


1. Introduction
Are inflation expectations related to fiscal expectations? Should they be? There is little evidence of this link in the economic literature. However, common knowledge suggests the existence of such a relationship. In his seminal paper, Blinder (Reference Blinder2000) lists small fiscal deficits among the seven factors that enhance central bank credibility and provides arguments for why large deficits are inflationary. Respondents to his survey were macroeconomists from central banks and academia, and they generally agreed on the importance of fiscal discipline for central bank credibility. However, economic theory and empirical studies imply that fiscal deficits are inflationary and newspapers and other media have drawn public attention to this link. Since the beginning of the global financial crisis, media outlets have often jointly referred to fiscal deficits and inflation.
Analyzing the textual content of articles published in the Wall Street Journal (WSJ) reveals that the number of articles containing jointly the words “US,” “inflation,” and “fiscal” surged substantially in 2010–2018 and later in 2022 relative to the previous period (Figure 1). This is not surprising given that US fiscal deficits increased considerably in this period, exceeding 1 trillion USD in 2009–2012 and again in 2020–2022. Many of these articles explicitly indicate causality running from fiscal deficits to inflation—e.g., “When debt grows so much that people don’t believe the Treasury will pay it, they sell their bonds and buy other things, sending prices through the roof” (WSJ 2022Footnote 1 ).Footnote 2 The extensive media coverage of this relationship makes it likely that laypeople can build current fiscal developments or expectations into the formation of their inflation expectations (Dräger and Lamla, Reference Dräger and Lamla2017; Larsen et al. Reference Larsen, Thorsrud and Zhulanova2021). Therefore, this study aims to explore the formation of consumer inflation expectations and add to the limited empirical evidence on the relationship between fiscal and inflation expectations.
The number of Wall Street Journal articles with the words “US,” “inflation,” and “fiscal” vs. the federal deficit and CPI inflation. Source: Authors’ own calculations based on Wall Street Journal and Federal Reserve Economic Data (FRED).

In recent years, a new wave of interest in the formation of consumer inflation expectations has emerged (e.g., Bruine de Bruin et al. Reference Bruine de Bruin, Van der Klaauw, Downs, Fischhoff, Topa and Armantier2010; Madeira and Zafar, Reference Madeira and Zafar2015; Dräger and Lamla, Reference Dräger and Lamla2017; Łyziak and Paloviita, Reference Łyziak and Paloviita2017; Binder, Reference Binder2018; Niu and Harvey, Reference Niu and Harvey2023). The need to understand the factors affecting these expectations results from the observation that their changes affect consumer spending and savings (e.g., Armantier et al. Reference Armantier, de Bruin, Topa, Van Der Klaauw and Zafar2015; Bachmann et al. Reference Bachmann, Berg and Sims2015; Ichiue and Nishiguchi, Reference Ichiue and Nishiguchi2015; Duca-Radu et al. Reference Duca-Radu, Kenny and Reuter2021) as well as price developments (e.g., Binder, Reference Binder2015; Coibion and Gorodnichenko, Reference Coibion and Gorodnichenko2015; Friedrich, Reference Friedrich2016; Álvarez and Correa-López, Reference Álvarez and Correa-López2020). Therefore, exploring the links between fiscal and inflation expectations is highly relevant from the policy perspective.
Empirical literature has identified several stylized facts about how consumer inflation expectations are formed. Generally, these expectations are backward-looking, biased, and inefficient. Forecast errors often correlate with personal characteristics (e.g., Souleles, Reference Souleles2004). These expectations respond strongly to perceived price changes (Axelrod et al. Reference Axelrod, Lebow and Peneva2018) and are driven by price changes of frequently purchased items, such as food or fuel (e.g., Ranyard et al. Reference Ranyard, Missier, Bonini, Duxbury and Summers2008; Coibion and Gorodnichenko, Reference Coibion and Gorodnichenko2015; Berge, Reference Berge2018). Concurrently, consumers are somewhat forward-looking when forming expectations and use available information (Curtin, Reference Curtin2019). They also consider expert forecasts communicated by the media (e.g., Carroll, Reference Carroll2003, Reference Carroll and Carroll2006).
The literature provides two theoretical explanations for the inflationary impact of fiscal deficits, which further justify the relationship between fiscal expectations and the inflation expectations postulated in this study. One is the increase in demand caused by greater government spending, as suggested by simple Keynesian models (Bordo and Levy, Reference Bordo and Levy2021). According to this approach, fiscal deficits stimulate aggregate demand, which translates into higher real income and, through the New Keynesian Phillips Curve, results in an increase in the price level (Angeletos et al. Reference Angeletos, Lian and Wolf2024). The fiscal theory of the price level (FTPL) describes another possible mechanism driving this relationship (Leeper, Reference Leeper1991; Woodford, Reference Woodford2001; Cochrane, Reference Cochrane2022) and is based on the concept of unpleasant monetarist arithmetic introduced by Sargent and Wallace (Reference Sargent and Wallace1981). Sargent and Wallace (Reference Sargent and Wallace1981) state that if the government finances its debt through taxes and seignorage, overly loose fiscal policy may force the central bank to increase seignorage to guarantee the fulfillment of the government’s budget constraint. This leads to an increase in inflation. FTPL develops this concept and postulates that if the government is unable or unwilling to adjust primary surpluses to satisfy the intertemporal government budget constraint, it will be satisfied through adjustments to the price level, which will erode the real value of government debt. Barro and Bianchi (Reference Barro and Bianchi2025) note that FTPL has been developing outside the mainstream macroeconomics, mainly due to low and stable inflation in recent decades. Lately, however, it has gained attention as an elegant theoretical explanation of the inflationary impact of recent large fiscal expansions. Barro and Bianchi (Reference Barro and Bianchi2025) empirically confirm this effect in the COVID-19 crisis, stating that the observed increase in inflation during this period can be attributed to the rise in government spending. It is worth noting that both approaches assume failure of the Ricardian equivalence.
Leeper and Leith (Reference Leeper, Leith, Leeper and Leith2016) provide a theoretical explanation for the relationship between public debt and inflation expectations, showing that if the debt burden is high and policymakers are tempted to induce inflation surprises to reduce it, economic agents will increase their inflation expectations in response to rising public debt. Similarly, Bianchi and Melosi (Reference Bianchi and Melosi2019) argue that in the case of a lack of coordination between monetary and fiscal policy—i.e., when the central bank aims to stabilize inflation, but the government does not undertake adequate measures to stabilize the debt—inflation expectations of private sector agents will depend on their beliefs about what kind of policy will prevail. If the public does not expect fiscal support for price stability, inflation expectations increase as debt increases. Empirical studies have supported these hypotheses. In one of the earliest studies, Webb (Reference Webb1986) analyzes the German case and shows that the high inflation in 1919–1923 was the result of high debt, expectations of further budget deficits, and inflation expectations reacting to fiscal imbalances. Cerisola and Gelos (Reference Cerisola and Gelos2009) demonstrate that an increase in budgetary surplus (i.e., a reduction in deficit) causes a drop in expected inflation in Brazil. Galati et al. (Reference Galati, Heemeijer and Moessner2011) demonstrate a statistically significant reaction of inflation expectations to the increase in public debt in the euro zone, while Łyziak and Mackiewicz-Łyziak (Reference Łyziak and Mackiewicz-Łyziak2020) confirm that fiscal stance influences inflation expectations of both consumers and professional forecasters in the European countries. Geiger and Zachariadis (Reference Geiger and Zachariadis2022), based on US survey data, demonstrate that the responses of consumer expectations, including inflation expectations, to fiscal shocks are state-dependent and become larger in high-debt states. Brandao-Marques et al. (Reference Brandao-Marques, Casiraghi, Gelos, Harrison and Kamber2023) report that inflation expectations in emerging market economies are significantly affected by public debt surprises, unlike advanced economies. Finally, Christensen and Spiegel (Reference Christensen and Spiegel2023) show that long-term inflation expectations in Japan were unresponsive to the announcement of fiscal measures during the COVID-19 pandemic.
The empirical evidence described above does not unequivocally confirm the impact of the fiscal stance on inflation expectations. Concurrently, the literature linking fiscal and inflation expectations is scarce, mostly because of a lack of appropriate data on fiscal expectations. Based on Colombian survey data, Anzoátegui-Zapata and Galvis-Ciro (Reference Anzoátegui-Zapata and Galvis-Ciro2021) show that the loss of fiscal credibility, reflected in the growing gap between fiscal deficit expectations and the actual fiscal deficit, can significantly increase the inflation expectations of economic agents. However, Colombian evidence concerns the expectations of experts from private banks, stockbrokers, pension funds, academia, and international organizations rather than consumers. Coibion et al. (Reference Coibion, Gorodnichenko and Weber2021) directly address the link between fiscal and inflation expectations using randomized control trials on US households. They find that information about current debt or deficit levels has little impact on inflation expectations, but news about future debt provided to respondents leads them to anticipate higher inflation. Furthermore, news about rising public debt makes households anticipate rising spending and higher interest rates on government debt. Grigoli and Sandri (Reference Grigoli and Sandri2023) also use randomized control trials to examine the causal impact of public debt on household inflation expectations in the US, the UK, and Brazil. Their results suggest that households underestimate public debt and increase their inflation expectations when informed of the correct levels. Additionally, confidence in the central bank reduces the sensitivity of inflation expectations to public debt considerably. These results suggest that lay people’s understanding of economic mechanisms is more sophisticated and theoretically consistent than was previously perceived.
In this study, we analyze the impact of survey-based public debt expectations (described interchangeably as fiscal expectations) on consumer inflation expectations in the US. We investigate the strength of this impact and whether the relationship between fiscal and inflation expectations is nonlinear with respect to fiscal policy performance or expectations of the future fiscal situation. The question of the existence and nature of such a relationship seems particularly important, given the large and rapid increase in public debt worldwide combined with persistently high inflation. In this study, we claim that economic agents recognize the inflationary threat of an expansionary fiscal policy and the expected fiscal situation to have an impact on inflation expectations. Moreover, the worse the expected fiscal situation, the stronger is the impact of fiscal expectations on inflation expectations. The hypothesis regarding the nonlinear relationship between inflation expectations and fiscal expectations stems directly from the FTPL literature and the concept of fiscal sustainability. If monetary policy controls inflation and fiscal policy stabilizes debt, i.e., a monetary-dominant regime (Leeper, Reference Leeper1991), fiscal policy does not pose risks to inflation. In such circumstances, temporary increases in debt may not raise public concerns if fiscal authorities are expected to take corrective measures in the future. However, if the public starts believing that fiscal authorities are unwilling or unable to undertake such fiscal adjustments and believing that debt will step on an explosive path (i.e., expectations of a change in regime to fiscal dominance emerge), then inflation expectations will increase (Bianchi and Melosi, Reference Bianchi and Melosi2019). When observing large increases in debt, the public may expect it to eventually become inflated. Hence, such a change in the expected policy mix may cause a nonlinear relationship between fiscal and inflation expectations. Barro and Bianchi (Reference Barro and Bianchi2025) postulate the existence of a relationship between fiscal deficits and inflation, particularly in extreme circumstances, which may be a source of nonlinearity. They find evidence that increased fiscal spending was a key driver of inflation in the COVID pandemic. Bassetto and Miller (Reference Bassetto and Miller2025) explain the nonlinearity in this relationship by the costs of acquiring information about the government surpluses. In certain economic conditions, consumers may find it beneficial to gather costly information. If they learn that fiscal surpluses will be insufficient, the price level increases, leading to sudden inflation.
Given the limited number of studies analyzing this relationship, our study sheds new light on the formation of consumer inflation expectations in such an extraordinary economic situation—that is, large fiscal expansion after the global financial crisis and, more recently, the COVID-19 pandemic. Therefore, the contribution of our study is twofold. First, we confirm the positive relationship between fiscal and inflation expectations. Second, we provide novel evidence that this relationship may not be linear and may become stronger with a deterioration in the fiscal situation, particularly the expectations of future fiscal performance.Footnote 3 We check the robustness of our results using different estimation methods, linear and nonlinear model specifications, and samples. Our approach is prone to endogeneity problems; therefore, we apply special modeling techniques to minimize them.Footnote 4
The remainder of this paper is organized as follows. Section 2 describes the data and methods used in the analysis. Section 3 presents the results of the linear and nonlinear models. Section 4 concludes the study and offers policy implications.
2. Data and methods
2.1. Data
The Survey of Consumer Expectations (SCE), launched by the Federal Reserve Bank of New York in 2013, is a useful tool for analyzing data on consumer expectations regarding various macroeconomic variables, including inflation and government debt (see Armantier et al. (Reference Armantier, Topa, der Klaauw and Zafar2016) for details). In this study, we use the point predictions of SCE respondents regarding the inflation rate 12 months ahead (Question Q8v2 of the SCE questionnaireFootnote 5 ) and the rate of growth in the level of US government debt over the next 12 months (Question C3).
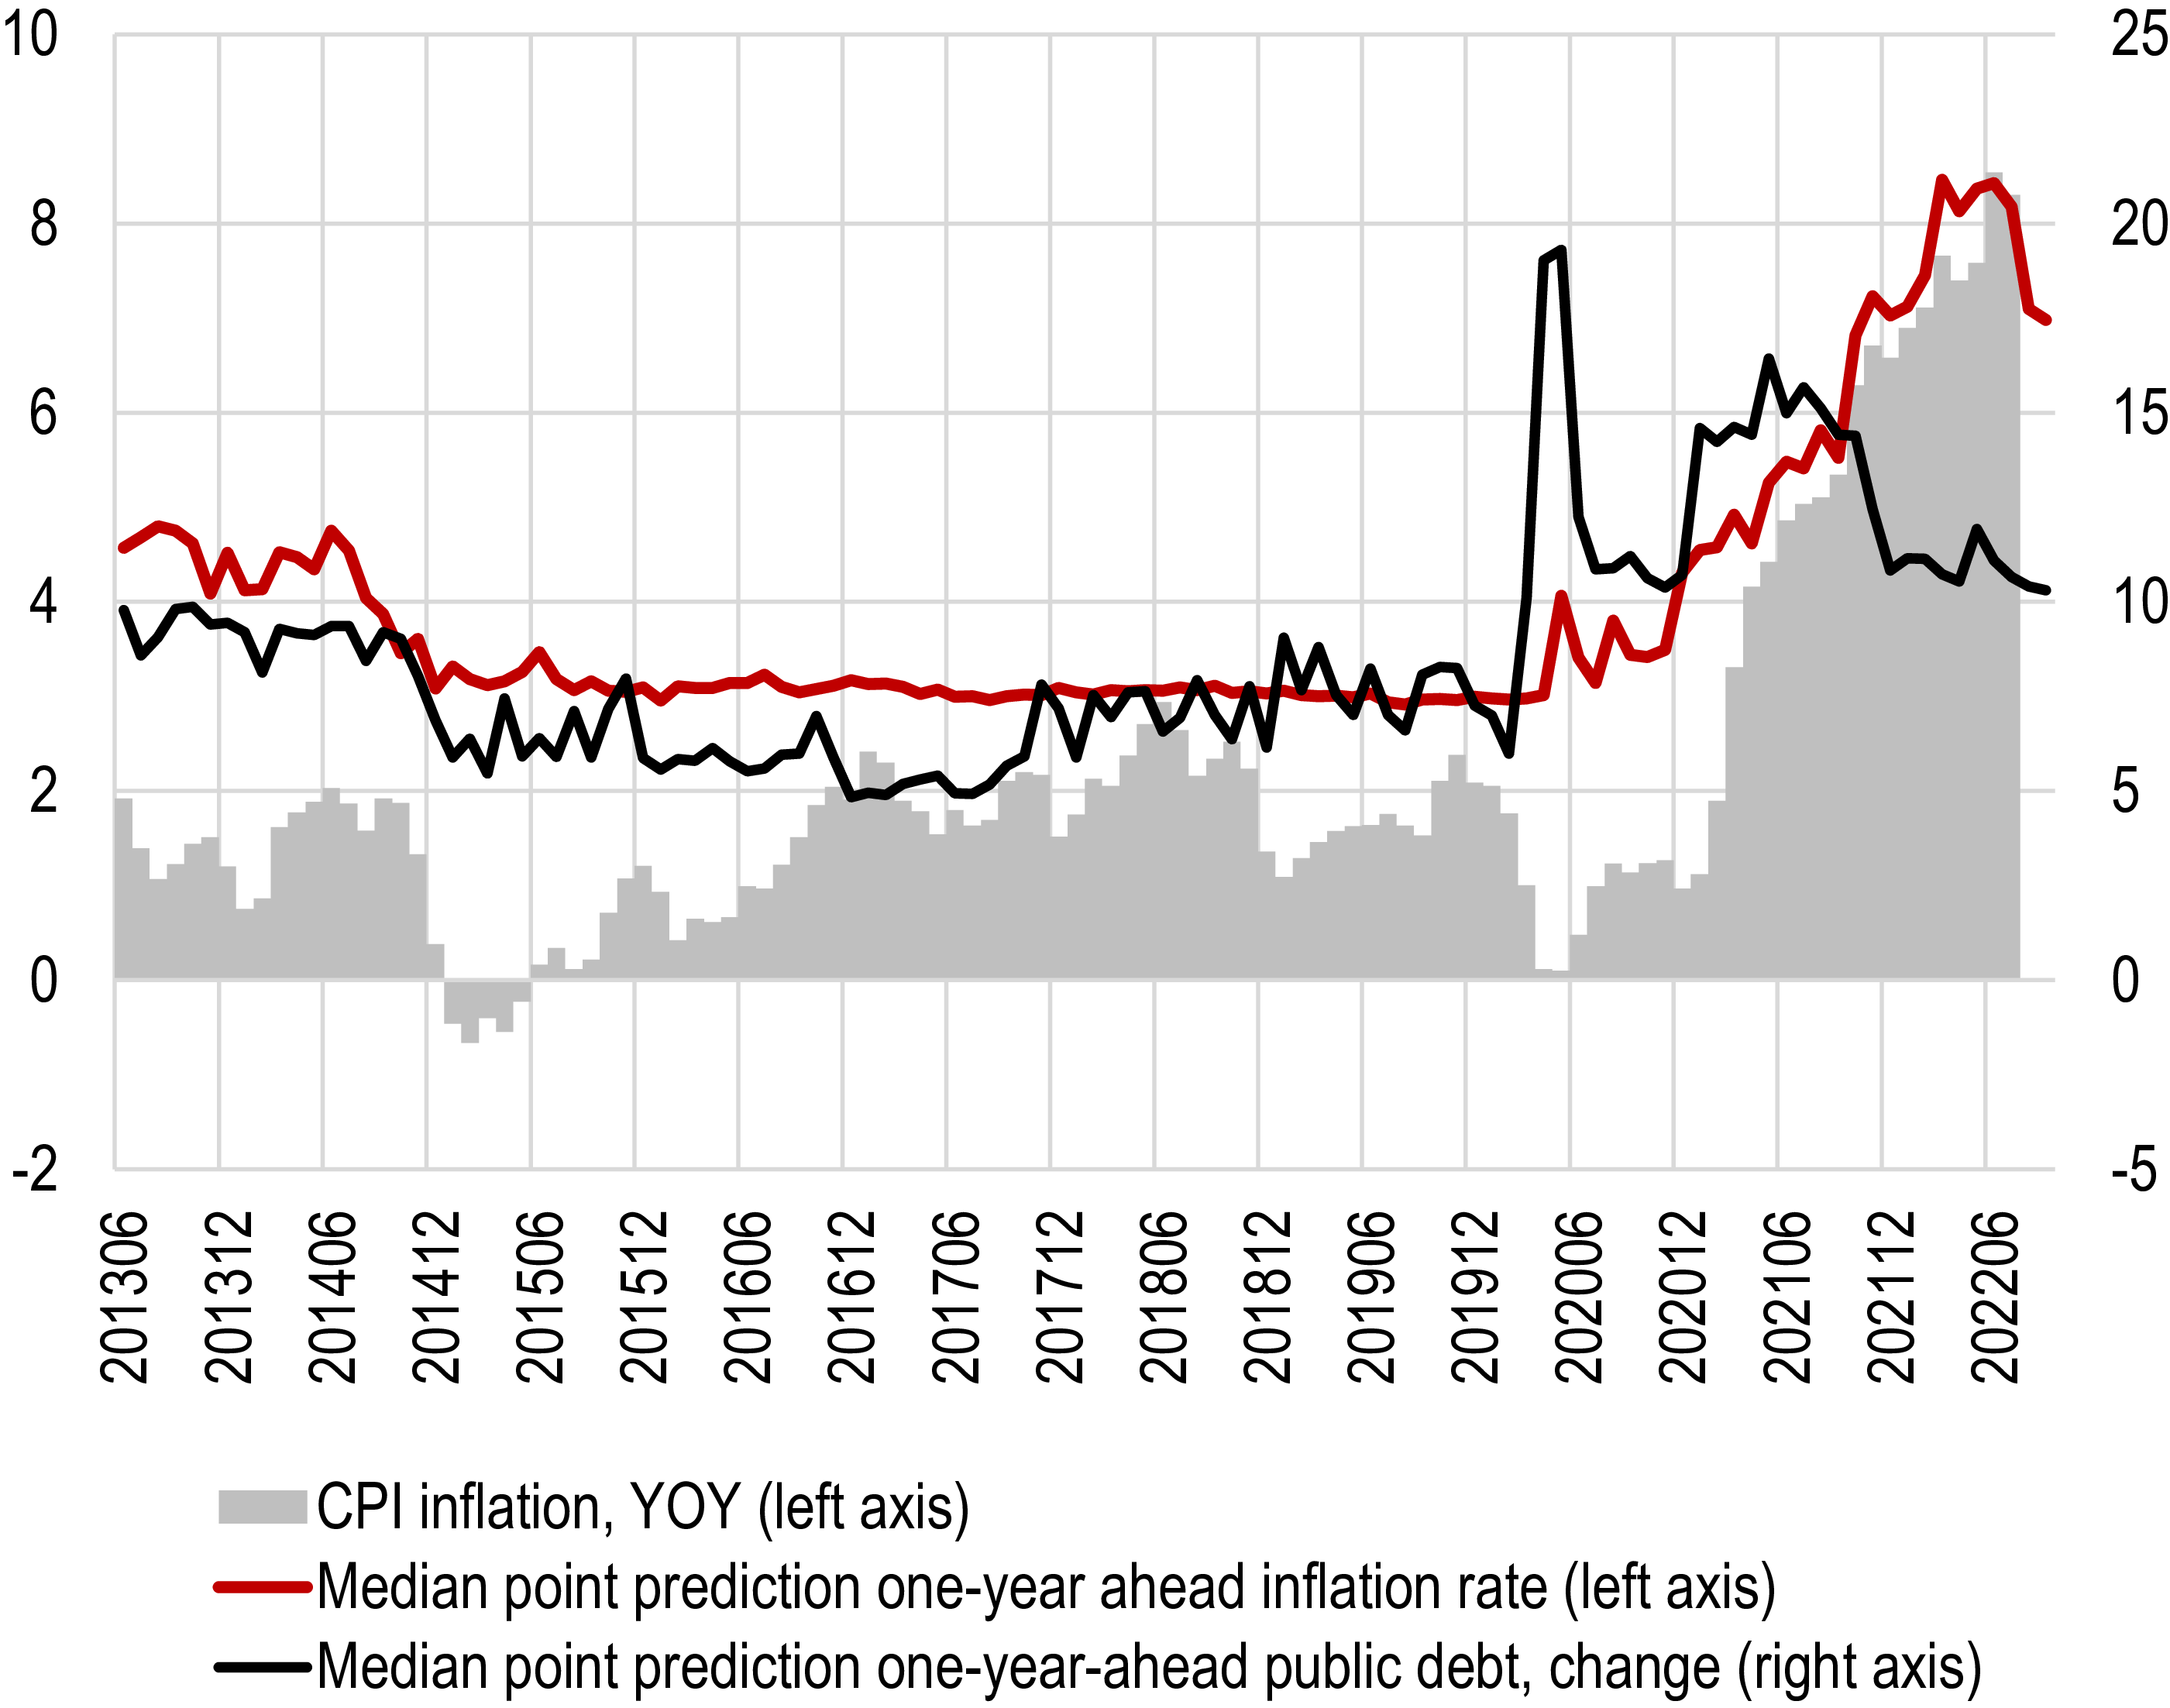
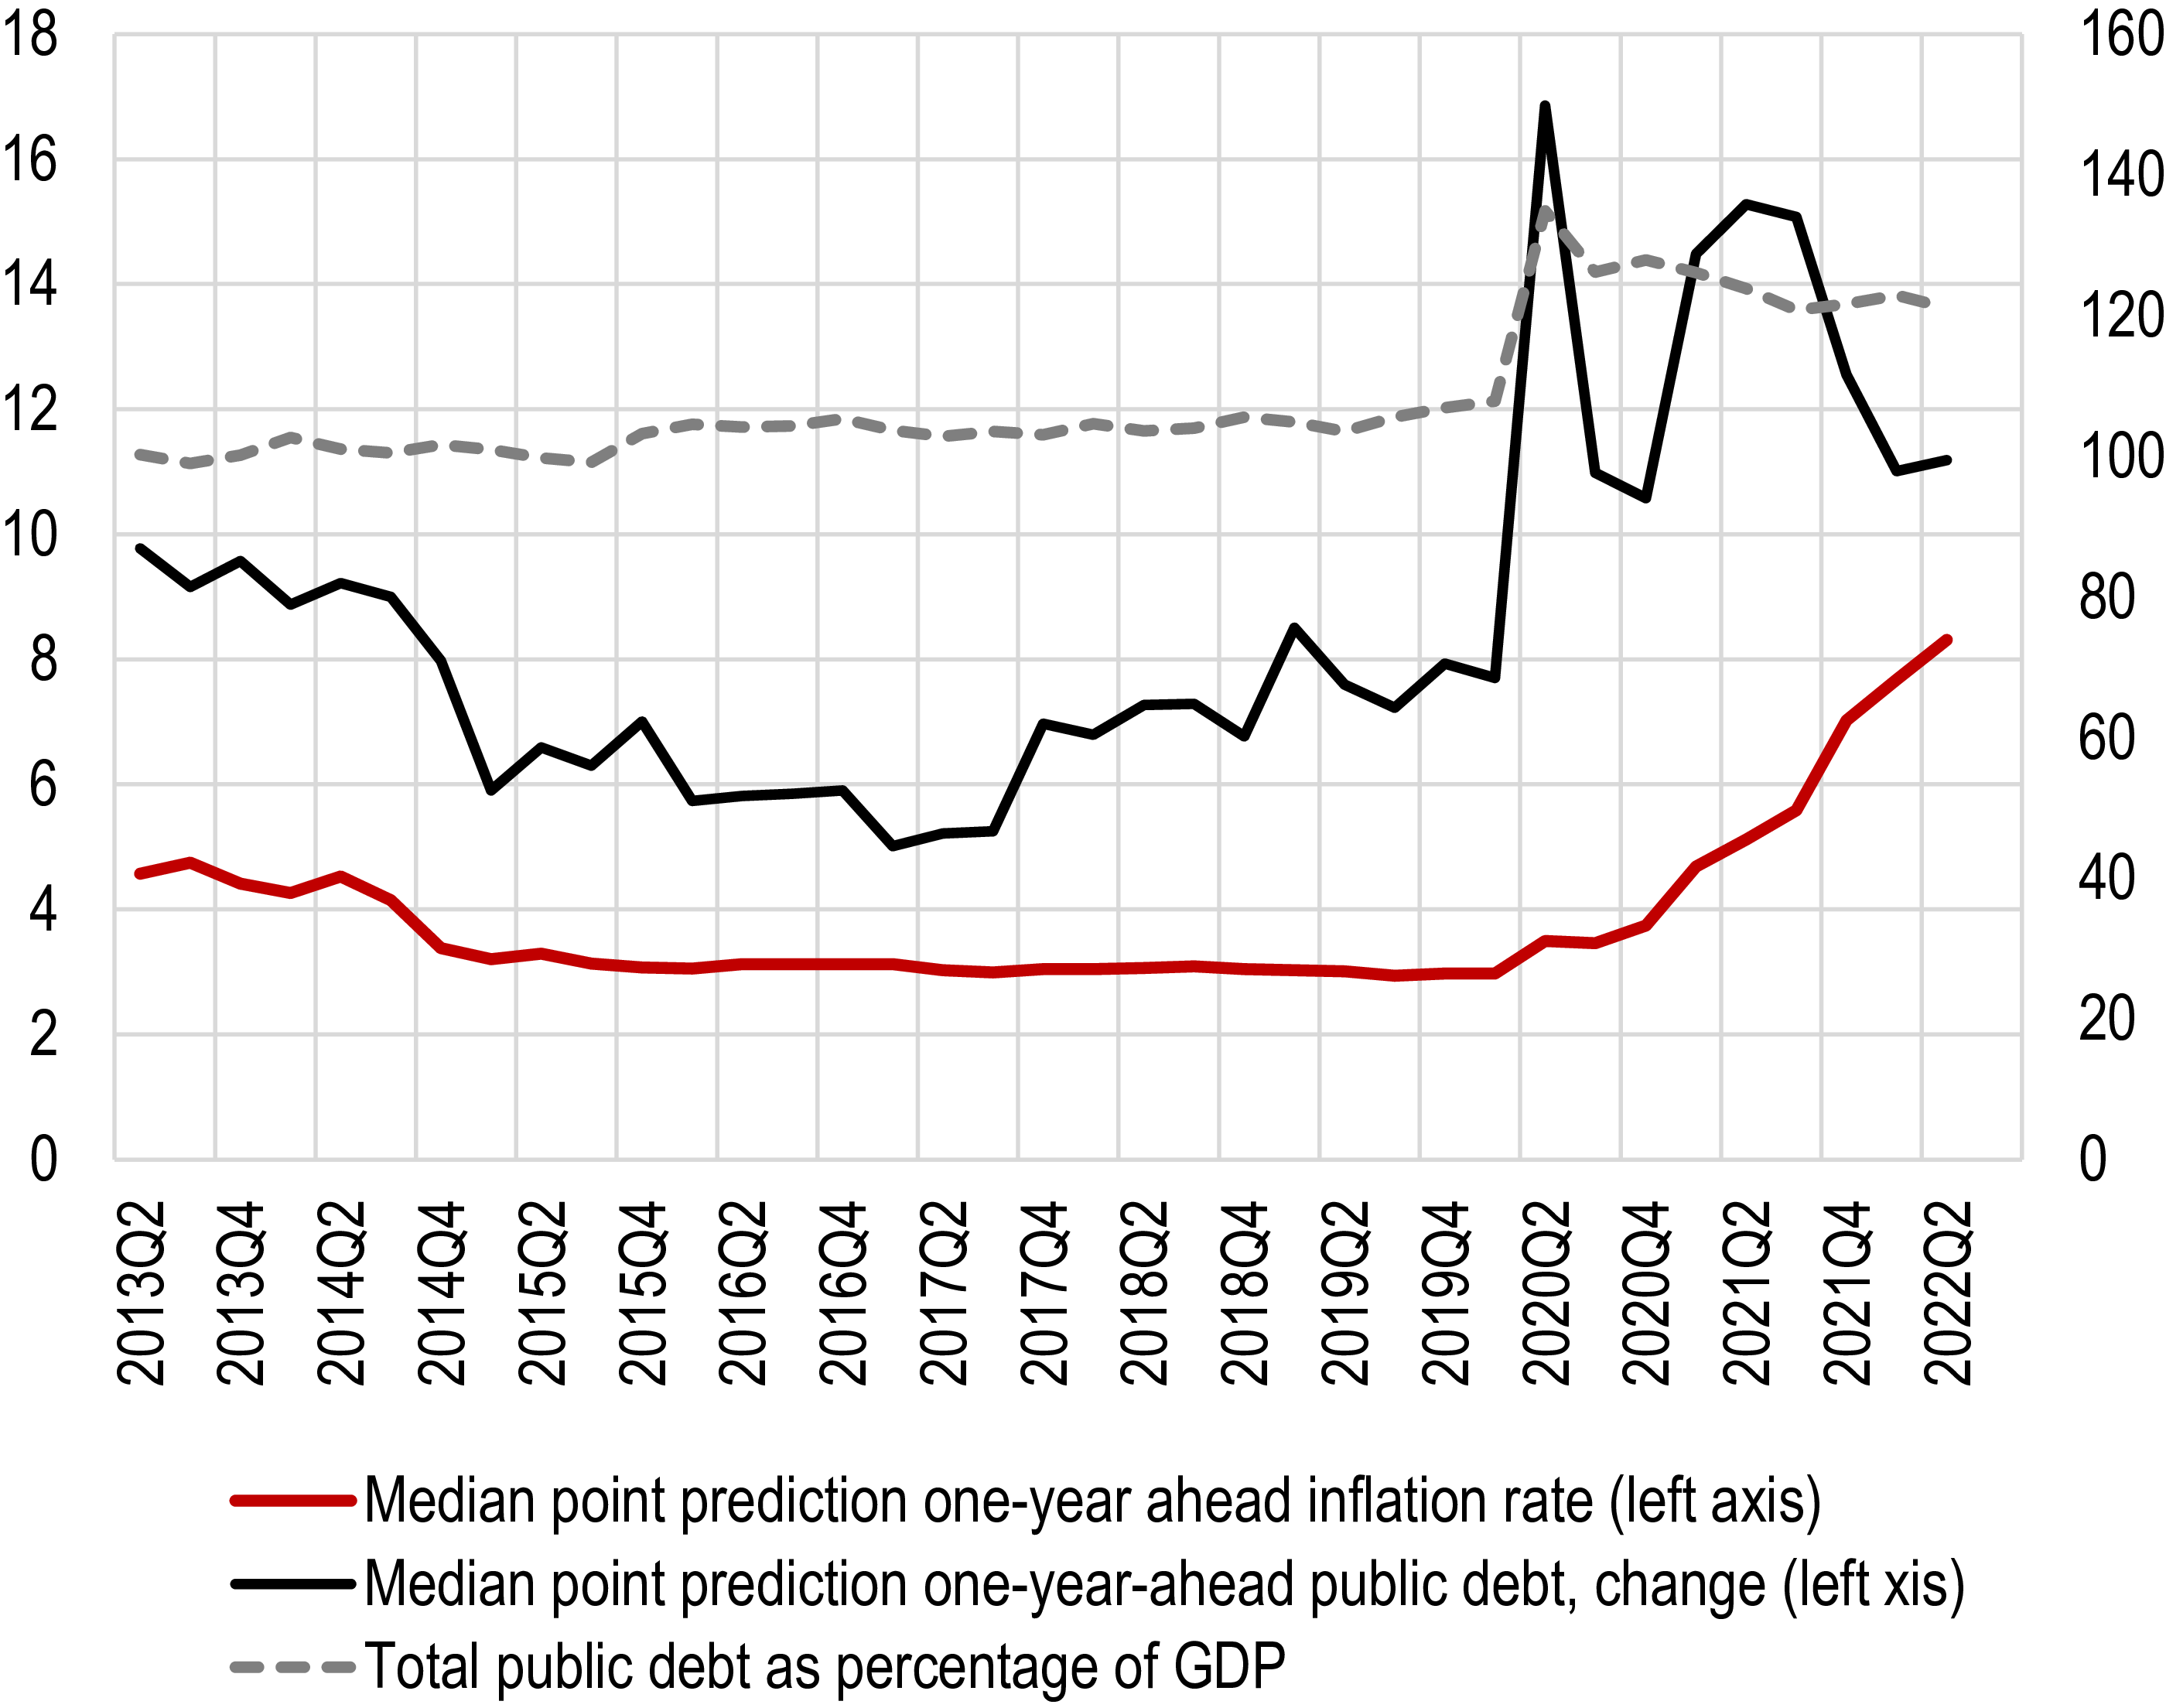
On the aggregate level consumer inflation expectations are positively correlated with both government debt expectations (Figure 2) and the current government debt (Figure 3)—the Pearson correlations are 0.56 and 0.49, respectively. The correlation between inflation expectations and current CPI inflation is stronger (0.85) than the correlations reported above, reflecting the backward-looking character of inflation expectations, a well-established stylized fact (e.g., Souleles, Reference Souleles2004; Ranyard et al., Reference Ranyard, Missier, Bonini, Duxbury and Summers2008; Coibion and Gorodnichenko, Reference Coibion and Gorodnichenko2015; Axelrod et al., Reference Axelrod, Lebow and Peneva2018; Berge, Reference Berge2018). These comparisons suggest a link between fiscal expectations and consumer inflation expectations, which is slightly stronger than the relationship between actual public debt and inflation predictions.
CPI inflation, inflation expectations, and fiscal expectations. Source: Federal Reserve Bank of New York Survey of Consumer Expectations (SCE), Federal Reserve Economic Data (FRED).

Inflation expectations, fiscal expectations, and total public debt. Source: Federal Reserve Bank of New York Survey of Consumer Expectations (SCE), Federal Reserve Economic Data (FRED).

After the onset of the COVID-19 pandemic in March 2020, consumer inflation expectations increased significantly, which is typically explained by the heuristic that pessimism of consumers and their concerns regarding the economy and their own economic situation are associated with higher inflation expectations (Kamdar, Reference Kamdar2019; Binder, Reference Binder2020). A careful inspection of the data suggests that the increase in inflation expectations in 2020, which occurred before the acceleration of the inflation rate itself, could have been associated with a large increase in public debt expectations (Figure 2), which was followed by an increase in government debt (Figure 3). Such an interpretation seems consistent with recent empirical studies mentioned in Section 1, confirming the link between fiscal and inflation expectations (Anzoátegui-Zapata and Galvis-Ciro, Reference Anzoátegui-Zapata and Galvis-Ciro2021; Coibion et al. Reference Coibion, Gorodnichenko and Weber2021). Therefore, in Section 2.2, we assess this hypothesis from the perspective of microdata.
To account for other consumer expectations regarding the future state of the economy, our dataset includes expected unemployment as a control variable. In this case, survey respondents declare probability of higher unemployment rate one year ahead rather than their quantitative expectations concerning a change in the unemployment rate (Question Q4new).
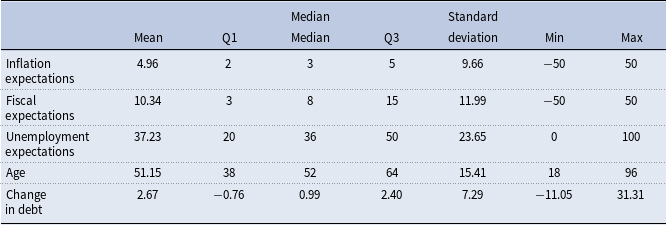
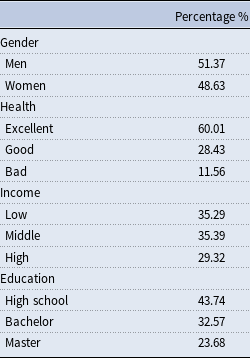
Inflation expectations are heterogeneous among consumers, with some sociodemographic characteristics explaining the different levels of expectations among different groups of consumers. Recognized determinants of inflation expectations include gender, age, income, and education (Bryan and Venkatu, Reference Bryan and Venkatu2001; Anderson, Reference Anderson2008; Ehrmann et al. Reference Ehrmann, Pfajfar and Santoro2017). Therefore, we include these features as control variables. Except for the standard set of sociodemographic variables, we consider consumers’ self-assessments of their health, which can be treated as a proxy for the overall degree of optimism or pessimism.Footnote 6 A detailed description of the variables is provided in the Appendix, while Tables A1 and A2 present descriptive statistics of continuous variables and frequencies of dummy variables, respectively.
Our dataset is the unbalanced panel that covers 80,165 observations for the period from June 2015 to December 2021. Following Bellemare et al. (Reference Bellemare, Tossou and Moran2020) we exclude from the analysis respondents with unrealistically high and low expectations, i.e., fiscal and inflation expectations higher than 50% or lower than -50%.
2.2. Methods
The theoretical literature offers various models of the formation of inflation expectations. Their historical evolution has been from simple adaptive models (Cagan, Reference Cagan and Cagan1956) to the rational expectations hypothesis (Muth, Reference Muth1961; Lucas, Reference Lucas1972) and then to hybrid models, combining backward- and forward-looking determinants of inflation expectations (Lovell, Reference Lovell1986; Roberts, Reference Roberts1997; Galı and Gertler, Reference Galì and Gertler1999). To analyze the relationship between fiscal and inflation expectations, we apply two types of panel models that belong to the class of hybrid expectations models. First, to account for the potential impact of the lagged inflation rate and other macroeconomic variables common to all individuals on their inflation expectations, we estimate a model that includes time effects:
 \begin{equation}\pi _{i,t|t+12}^{e}=\alpha _{0}+\alpha _{2}d_{i,t-1|t+12}^{e}+\alpha _{3}u_{i,t|t+12}^{e}+\sum _{k=1}^{K}\beta _{k}x_{k,i,t}+\delta _{i}+\tau _{t}+\varepsilon _{i,t}\end{equation}
where $\pi _{i,t|t+12}^{e}$
denotes 12-months-ahead expected inflation by the i-th respondent at time t;
$\pi _{i,t|t+12}^{e}$
denotes 12-months-ahead expected inflation by the i-th respondent at time t; $d_{i,t-1|t+12}^{e}$
is the expected growth rate of the US government debt (lagged);
$d_{i,t-1|t+12}^{e}$
is the expected growth rate of the US government debt (lagged); $u_{i,t|t+12}^{e}$
is the probability of higher unemployment rate one year ahead;
$u_{i,t|t+12}^{e}$
is the probability of higher unemployment rate one year ahead; $x_{k,i,t}$
is a set of sociodemographic characteristics including gender, age, income, education, and healthFootnote
7
;
$x_{k,i,t}$
is a set of sociodemographic characteristics including gender, age, income, education, and healthFootnote
7
; $\delta _{i}$
are individual effects;
$\delta _{i}$
are individual effects; $\tau _{t}$
are time effects, and
$\tau _{t}$
are time effects, and $\varepsilon _{i,t}$
is the error term.
$\varepsilon _{i,t}$
is the error term.
Second, by referring to sticky information models (Mankiw and Reis, Reference Mankiw and Reis2002), we estimate a dynamic panel model that includes lagged inflation expectations.
 \begin{equation}\pi _{i,t|t+12}^{e}=\alpha _{0}+\alpha _{1}\pi _{i,t-1|t+12}^{e}+\alpha _{2}d_{i,t|t+12}^{e}+\alpha _{3}u_{i,t|t+12}^{e}+\sum _{k=1}^{K}\beta _{k}x_{k,i,t}+\delta _{i}+\tau _{t}+\varepsilon _{i,t}\end{equation}
where $\pi _{i,t-1|t+12}^{e}$
denotes lagged expected inflation.
$\pi _{i,t-1|t+12}^{e}$
denotes lagged expected inflation.
To verify that the link between inflation expectations and fiscal expectations depends on the actual or predicted fiscal developments and, specifically, that it becomes stronger when the fiscal situation deteriorates, we introduce interactions of fiscal expectations with either a change in the government debt-to-GDP ratio over the last 12 months (sourced from FRED) or the square of fiscal expectationsFootnote 8 into the above-described models. Subsequently, (1) and (2) take the following forms:
 \begin{align}\pi _{i,t|t+12}^{e}&=\alpha _{0}+\alpha _{2}d_{i,t-1|t+12}^{e}+\alpha _{3}u_{i,t|t+12}^{e}+\sum _{k=1}^{K}\beta _{k}x_{k,i,t}+ \beta _{l}z_{i,t-1}\cdot d_{i,t-1|t+12}^{e}+\delta _{i}+\tau _{t}+\varepsilon _{i,t}\end{align}
 \begin{align}\pi _{i,t|t+12}^{e}&=\alpha _{0}+\alpha _{1}\pi _{i,t-1|t+12}^{e}+\alpha _{2}d_{i,t|t+12}^{e}+\alpha _{3}u_{i,t|t+12}^{e}+ \sum _{k=1}^{K}\beta _{k}x_{k,i,t}+\beta _{l}z_{i,t}\cdot d_{i,t|t+12}^{e}\nonumber\\&\quad +\delta _{i}+\tau _{t}+\varepsilon _{i,t}\end{align}
where $z$
denotes the change in government debt-to-GDP ratio during the last 12 months or fiscal expectations.
$z$
denotes the change in government debt-to-GDP ratio during the last 12 months or fiscal expectations.
Based on the estimation results of (3) and (4), we analyze the marginal effects of fiscal expectations on expected inflation depending on the described fiscal variables.
Our empirical models may be affected by several sources of endogeneity, which we attempt to mitigate using different measures. As our set of variables includes sociodemographic characteristics, which are mostly time-invariant, we use two estimation methods to address this problem. We estimate (1) using the correlated random effects (CRE) method (Mundlak, Reference Mundlak1978; Chamberlain, Reference Chamberlain and Chamberlain1984), which solves the endogeneity problems caused by the correlation between time-varying explanatory variables and time-constant heterogeneity. Hence, in our study, this feature of the CRE model enables us to overcome the problem of correlation between macroeconomic expectations and sociodemographic variables, which are mostly time-invariant. Additionally, to address the potential simultaneity problem, the model estimated using the CRE method includes fiscal expectations lagged by one period. However, another kind of endogeneity remains because a common factor, such as consumer confidence, can drive all survey-based expectations. To address this possibility and eliminate the influence of this common factor, in another specification we use modified measures of survey-based expectations, i.e., expectations orthogonalized with respect to a survey-based measure of consumer confidence. To address this aim, we use a survey question on the expected percentage change in household income (Question Q25v2part2).
The dynamic panel model described by (2) suffers from another source of endogeneity stemming from the inclusion of the lagged dependent variable among the regressors. To account for the time-invariant controls, the model is estimated using a sequential procedure for the dynamic Hausman–Taylor model (Hausman and Taylor, Reference Hausman and Taylor1981) proposed by Kripfganz and Schwarz (Reference Kripfganz and Schwarz2019). This method ensures correct estimation of the coefficients of the time-invariant variables. In the first stage of this procedure, only the coefficients of the time-varying variables are estimated. Second, the coefficients of the time-invariant repressors are calculated. We treat gender, age, wealth status, education, and health status as time-invariant variables. This method allows the use of instrumental variables to address potential endogeneity problems. In our model, we use two lags of the dependent and independent variables as instruments. Additionally, we instrument fiscal expectations with another variable, i.e., survey participants’ responses to the question regarding the expected increase or decrease in total taxes over 12 months (Question Q27v2part2).
Therefore, we handle potential endogeneity problems in a careful, complex, and comprehensive manner. The methods applied in this respect are likely to substantially reduce endogeneity bias and provide a robustness check for our results.
3. Results
3.1. Main results
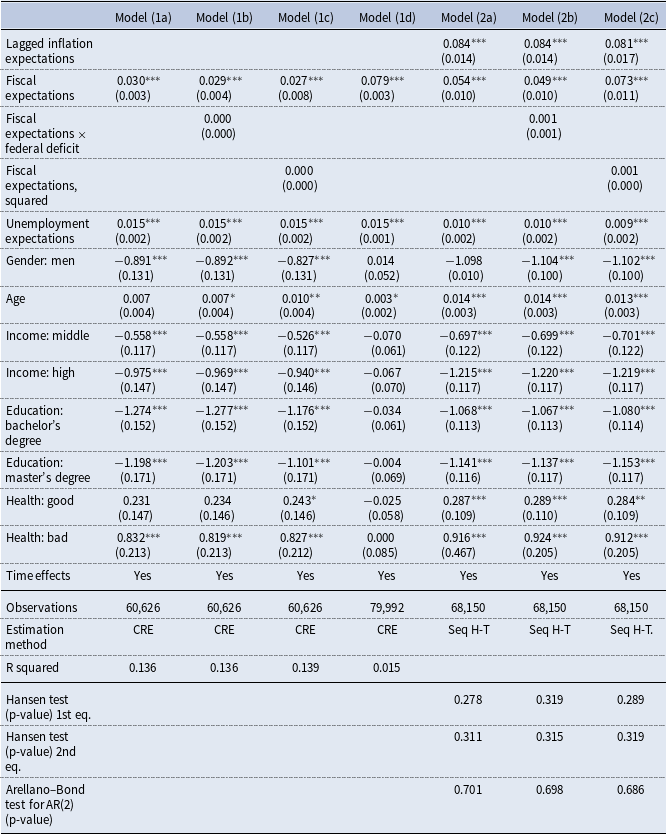
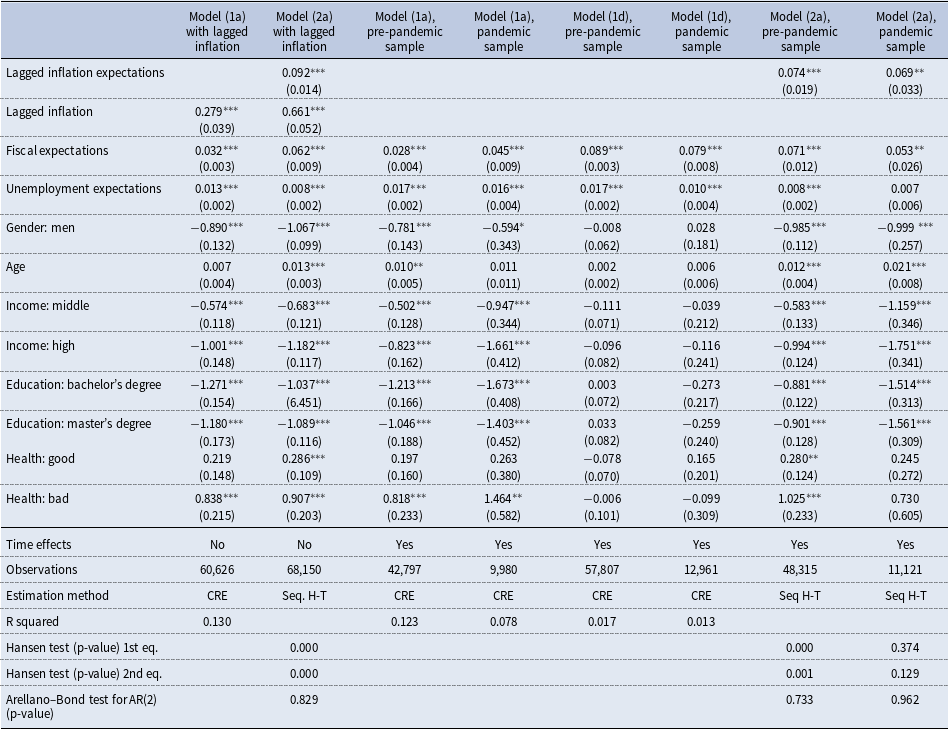
Table 1 presents the estimation results for the different specifications of the inflation expectations models presented in Section 2.2. We estimate three different specifications for each of the models (static and dynamic): models (a) without interactions, (b) including the interaction of fiscal expectations with a change in federal debt (fiscal deficit)Footnote 9 , and (c) with squared fiscal expectations. Additionally, a static model without interactions was estimated using orthogonalized expectation variables, i.e., Model (1d).
According to the linear models, i.e., Models (1a), (1d), and (2a), consumers’ fiscal and inflation expectations are positively and significantly related. In line with theoretical considerations, the predictions of fiscal expansion led to higher expected inflation. The strength of this impact is non-negligible. A typical change in fiscal expectations—one standard deviation of their distribution—can shift inflation expectations by 0.3–1.0 percentage points, while extreme changes in fiscal expectations—three standard deviations of their distribution—can push inflation expectations even by 1.0–2.9 percentage points. Given the need to keep inflation expectations anchored, both typical and extreme changes in fiscal expectations can disturb inflation expectations, negatively impacting monetary policy and requiring a policy response.
Estimation results

Notes: Standard errors in parentheses.
Source: Authors’ own calculations.
***, **, and * denote significance level at 1, 5, and 10%, respectively.
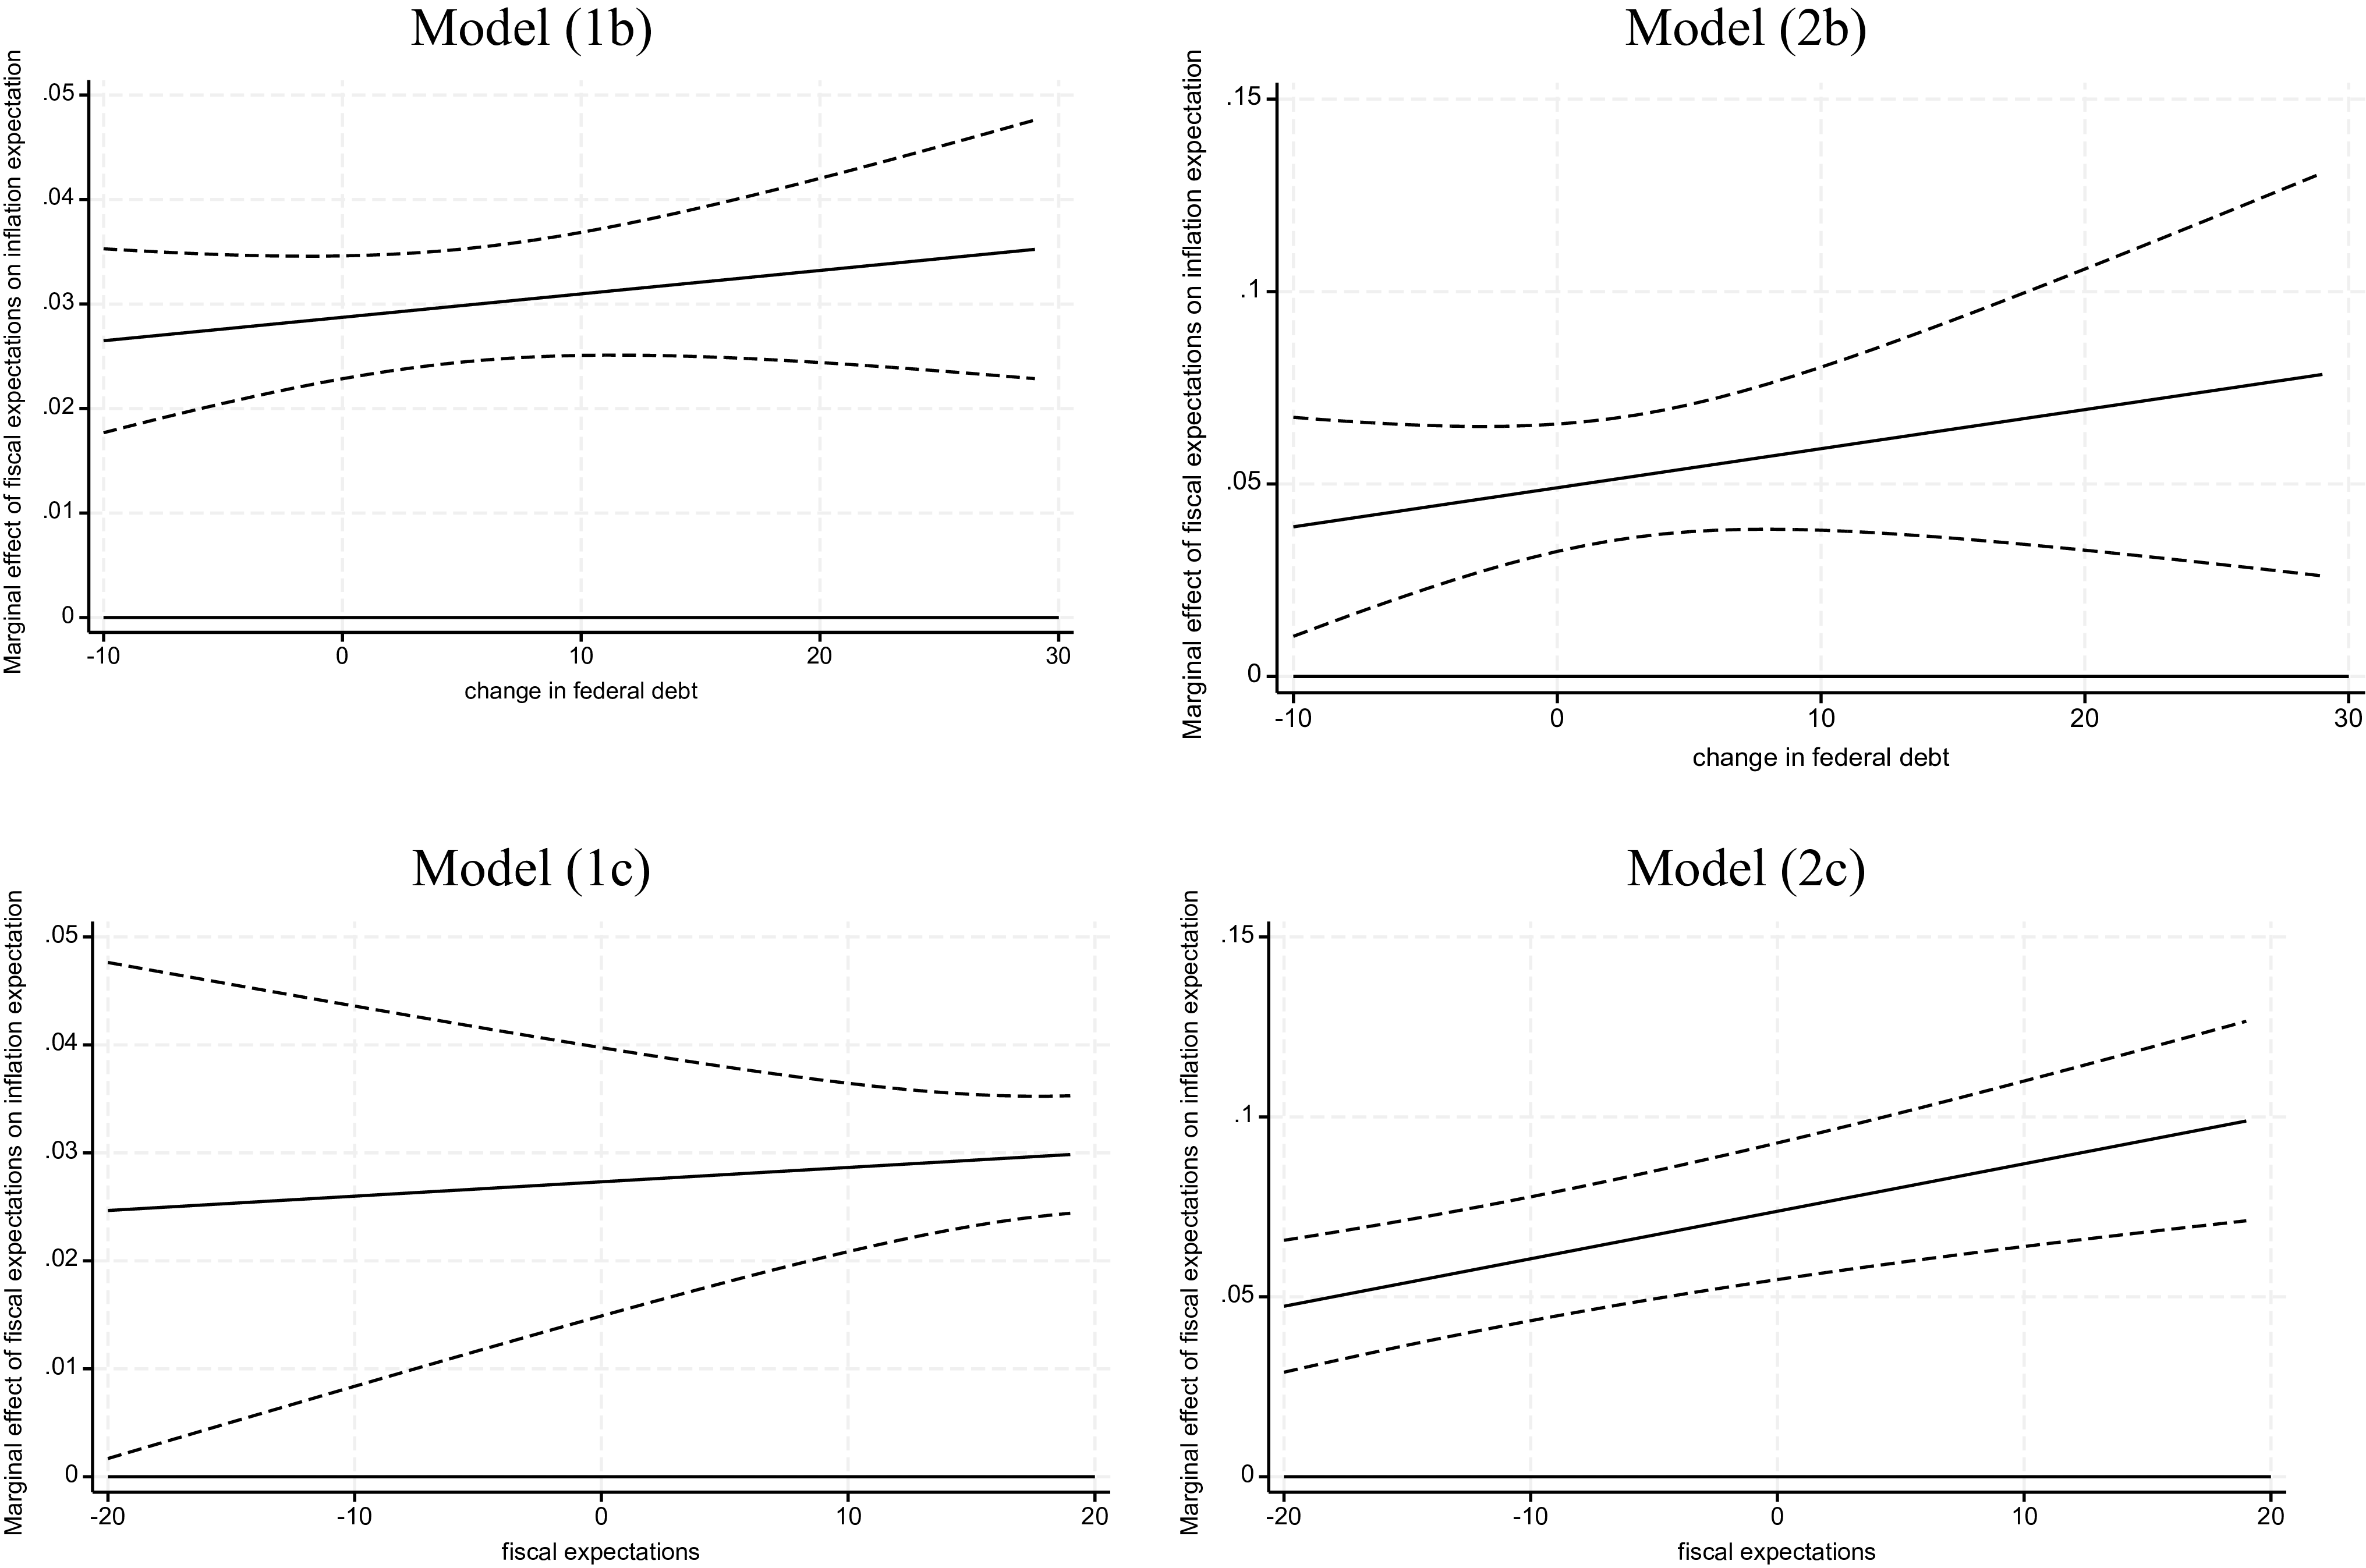
According to our hypothesis, this relationship may be nonlinear and change with the worsening of the actual fiscal situation or with expectations of a worse fiscal situation. The remaining models attempt to capture such nonlinear effects by including either interaction terms or squared fiscal expectations. In all these specifications, the nonlinear terms prove to be statistically insignificant. However, as Brambor et al. (Reference Brambor, Clark and Golder2006) argue, a simple verification of statistical significance is not sufficient in the case of nonlinear models, and a full analysis of marginal effects is required. Therefore, we analyze the marginal effects of fiscal expectations on inflation expectations, depending on either the change in government debt over the last 12 months or the level of fiscal expectations. The left panel of Figure 4 presents the marginal effects (with 95% confidence intervals) obtained for the models estimated with the CRE estimator, and the right panel for the models estimated with the sequential procedure.
Marginal effect of fiscal expectations on inflation expectations of households. Note: solid lines—marginal effect; dashed lines—95% confidence intervals. Source: Authors’ own calculations.

The analysis of marginal effects confirms our hypothesis that the relationship between fiscal and inflation expectations strengthens when fiscal policy becomes or is perceived as less prudent. The marginal effect of fiscal expectations on inflation expectations increases with changes in government debt over the last year. We obtain this result for both Models 1b and 2b. With a faster increase in debt, the reaction of inflation expectations to fiscal expectations strengthens, confirming the nonlinear relationship between fiscal and inflation expectations. For the range of the change in debt from the 5th to the 95th percentile of this variable (−5.94 and 20.96 percentage points of GDP), the estimated impact increases from 0.027 to 0.033 or from 0.043 to 0.070 for Models 1b and 2b, respectively. Similarly, we observe a comparable result for the level of fiscal expectations. In Models (1c) and (2c), when the level of fiscal expectations increases, the relationship between fiscal and inflation expectations becomes stronger. Specifically, the estimated marginal effect of fiscal expectations on inflation expectations ranges from 0.027 to 0.031 for Model 1c and from 0.068 to 0.11 for Model 2c if the fiscal expectations variable varies between the 5th and 95th percentiles of its distribution (i.e., –4 to 30% of the expected growth rate of debt). All the reported results are statistically significant at the 5% level. All the models indicate an increase in the marginal impact of fiscal expectations on inflation expectations; however, it should be noted that the magnitude of this impact differs between Models 1 and 2, with Model 2 showing a stronger relationship. This difference arises because, in the CRE models (1b and 1c), we use lagged fiscal expectations to mitigate endogeneity problems, whereas Models 2b and 2c use current fiscal variables. These results robustly support our hypothesis that the relationship between fiscal and inflation expectations depends on the actual or predicted fiscal situation; disadvantageous changes seem to have a stronger impact in this respect.Footnote 10
To account for the different beliefs of respondents regarding the future state of the economy, the model includes consumer expectations concerning unemployment. The results suggest that consumers who declare a higher probability that unemployment will increase have higher inflation expectations than respondents whose unemployment predictions are more optimistic. This effect may either reflect the good–bad heuristic (Andre et al. Reference Andre, Pizzinelli, Roth and Wohlfart2019), or suggest that both unemployment and inflation are, according to consumers, driven mostly by supply shocks.
The impact of demographic features on consumer inflation expectations is mostly consistent with the results of existing empirical studies. In general, men have lower inflation expectations than women, and better-educated and wealthier people form lower inflation expectations than less-educated and poorer respondents (Table 1). Older respondents tend to expect higher inflation rates. Health self-assessments also seem to affect the level of expected inflation; worse health status is associated with higher expectations. However, because health status is based on individual self-assessment, survey responses may, to some degree, reflect the psychological features of a respondent, such as the degree of pessimism or optimism. The results for the sociodemographic variables are similar and highly statistically significant in most of the models.
3.2. Robustness analysis
The results presented in Section 3.1 are robust with respect to different estimation methods and different specifications of linear and nonlinear models. In this section, we further check for robustness using models without time effects but with lagged inflation, as well as the models estimated using different samples. The pre-pandemic period (before March 2020) and the pandemic period (from March 2020 to March 2021, a period of the largest increase in the government debt) were used for raw and orthogonalized expectation variables. As discussed above, a sharp increase in the public debt and inflation in the pandemic period, accompanied by the intensive media coverage, was associated with higher consumer expectations for both public debt and inflation. The question arises whether the identified relationship between fiscal and inflation expectations is unique to the pandemic period, or whether it can also be identified in a more stable macroeconomic environment. The results are summarized in Table 2.
Robustness analysis

Notes: Standard errors in parentheses.
Source: Authors’ own calculations.
***, **, and * denote significance level at 1, 5, and 10%, respectively.
Our main findings on the relationship between the fiscal and inflation expectations of US consumers remain robust; this relationship is positive and significant across all the estimated models. It seems that using the lagged inflation rate instead of time effects does not affect the results; the respective estimates from both approaches are close to each other. Regarding the estimation in different subsamples, we confirm that the identified impact of consumers’ fiscal expectations on inflation expectations is not driven only by extreme developments at the end of the sample period but reflects a more systematic behavior. Interestingly, in most estimated models (i.e., except CRE models in levels), this is somewhat stronger in the pre-pandemic period than that since 2020.Footnote 11
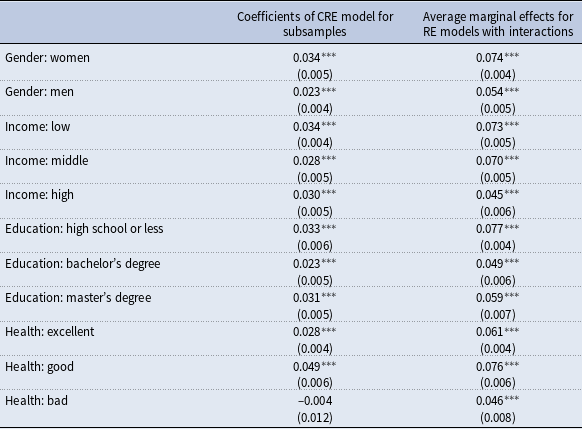
Finally, our findings regarding sociodemographic features hold: men, wealthier people, and better-educated people form lower inflation expectations, whereas worse health and age increase expected inflation. In line with other studies, this evidence suggests that the level of inflation expectations depends on sociodemographic characteristics; therefore, we checked whether the strength of the relationship between fiscal and inflation expectations also depends on these characteristics. Moreover, we wanted to ensure that our conclusions on this relationship were not driven by a specific group. Accordingly, we estimated the CRE model separately for each subsample distinguished according to gender, income, education, and health. Moreover, we analyzed marginal effects for the model with interactions of fiscal expectations with dummies representing sociodemographic features. Table A3 in the Appendix presents the results. We found that the link between fiscal and inflation expectations evidenced in this study holds for each group of respondents and is not driven by any specific group.
4. Conclusion
The notion that consumers form their inflation expectations in a simplistic and fully backward-looking manner has recently been challenged in the literature. The process by which lay people set expectations seems to be much more complex and sophisticated than is usually assumed. Forming their expectations, consumers not only replicate observed and experienced developments in inflation but also, to some extent, use forward-looking information, including their own expectations related to other variables.
The recent sizeable fiscal expansion and elevated inflation made us particularly interested in the link between consumers’ fiscal expectations and their inflation expectations. Understanding how consumers form their inflation expectations and to what extent they respond to changes in fiscal policy and fiscal expectations is crucial in designing appropriate fiscal and monetary policies, as well as the optimal policy mix.
In this study, we show that fiscal expectations drive US consumer inflation expectations. This relationship is positive, statistically and economically significant, and robust across specifications and estimation methods. Moreover, the response of inflation expectations to fiscal expectations is nonlinear: the unfavorable public debt dynamics or worse predictions of the future fiscal stance strengthen the link between them. This implies that expectations of fiscal expansion, once built into consumer consciousness, can have a long-lasting impact, potentially leading to de-anchoring of inflation expectations and the need for monetary policy actions. It also suggests the need for improvements in central bank communication, which should be more explicit in explaining inflation risks stemming from fiscal expansions and, concurrently, mitigate the undesired impact of the media’s alarmistic news on fiscal policy expectations. This is vitally important because growing public debt and persistently high inflation have increased interest in this topic in the media, causing lay people to link these developments.
Our findings are relevant for modeling and forecasting inflation. Capturing the link from fiscal policy actions to fiscal and inflation expectations should improve model accuracy. It should also account for an additional channel through which fiscal policies can affect inflation and design an optimal mix of monetary and fiscal policies.
This study has some limitations. We analyzed a period of already-high federal debt and lack earlier data, so our results may not capture nonlinearities over a broader debt range. Despite this, our findings support that rising debt expectations lead to increased inflation expectations, highlighting the importance of accounting for nonlinearities tied to fiscal outlook changes.
Competing interests
The authors declare none.
Appendix
A. Description of data from SCE used in the study
A.1. Sociodemographic variables
Gender: dummy variable: 0 denotes women, 1 denotes men.
Age: variable denoting the age of the respondent during the survey.
Income: the total combined pre-tax income of all members of the household (including the respondent) during the past 12 months (including money from all jobs, net income from business, farm, or rent, pensions, interest in savings or bonds, dividends, social security income, unemployment benefits, food stamps, worker compensation or disability benefits, child support, alimony, scholarships, fellowships, grants, inheritances and gifts, and any other money income received by members of the household who are 15 years old or older). Dummy variables have been constructed: “income middle” = income higher than $50,000 and lower than $100,000; “income high” = income above $100,000, low income (i.e., lower than $50,000) is the base case.
Descriptive statistics of continuous variables

Source: Authors’ own calculations.
Frequencies of dummy variables

Source: Authors’ own calculations.
The impact of fiscal expectations on inflation expectations in different sociodemographic groups

Notes: Standard errors in parentheses.
Source: Authors’ own calculations.
***, **, and * denote significance level at 1, 5, and 10%, respectively.
Education: split in two dummy variables: “education: bachelor’s degree” takes the value 1 for bachelor’s degree, and “education: master’s degree” takes the value 1 for master’s or doctoral degree; high school or less is a base case.
Health: split in two dummy variables: “health good” takes the value 1 for health self-assessment described as good, and “health bad” takes the value 1 for health self-assessment described as fair or poor. Health status described as excellent or very good was used a base case.
A.2. Expectation variables
Inflation expectations: The survey participants are asked the following question: “What do you expect the rate of inflation/deflation to be over the next 12 months? Please give your best guess.” The response has the following form: “Over the next 12 months, I expect the rate of [inflation/deflation] to be _____ %”
Fiscal expectations: The survey participants are asked the following questions: “Over the next 12 months, what do you expect will happen to the level of U.S. government debt? By about what percent do you expect the level of U.S. government debt to decrease/increase?” The response has the following form: “Over the next 12 months, I expect the level of U.S. government debt to decrease/increase by _____ %.”
Unemployment expectations: The respondents answer the following question: “What do you think is the percent chance that 12 months from now the unemployment rate in the U.S. will be higher than it is now?”


 Open access