


1 Introduction
Recent innovations in language technology have transformed the automation of text analysis in political science, particularly with the emergence of pre-trained multilingual language models (PMLMs). These models offer new opportunities to enhance the classification of open-ended survey responses in cross-cultural research, where linguistic and conceptual diversity often complicates comparative analyses. Open-ended survey questions provide a systematic and effective way to capture a diverse range of views, enabling researchers to explore spontaneous and nuanced perspectives that may be constrained by fixed-response categories (Krosnick Reference Krosnick1999; Lazarsfeld Reference Lazarsfeld1944; Reja et al. Reference Reja, Manfreda, Hlebec and Vehovar2003; Schuman and Presser Reference Schuman and Presser1979). However, their use in comparative settings introduces substantial challenges, including high coding costs, translation inconsistencies and difficulties in maintaining thematic consistency across multiple languages, cultures and regime types (Harkness Reference Harkness, Leeuw, Hox and Dillman2012). In other words, systematic analysis of cross-cultural open-ended survey questions is extremely resource-intensive in practice.
This article seeks to mitigate these challenges by introducing a novel methodology that integrates PMLMs with structured coding schemes to classify open-ended survey responses in a cost-effective, scalable and adaptable manner. Specifically, we focus on democratic conceptions, a central theme in comparative political science, to assess the effectiveness of PMLM-based classification relative to human coders. Leveraging a cross-national dataset on attitudes toward democracy, spanning nine languages across ten countries, we evaluate a hybrid approach that integrates human annotation, a predefined coding scheme operationalized through the Democracy Tree framework (Dahlberg and Mörkenstam Reference Dahlberg and Mörkenstam2024) and fine-tuned PMLMs.
While we implement the Democracy Tree framework—designed to capture different conceptions of democracy in text data—as a case study, our approach is not limited to democracy. The methodology is applicable to any coding scheme for classifying open-ended survey responses, making it adaptable across diverse research contexts and thematic analyses. By automating the classification of large volumes of text data, this study demonstrates the potential of PMLMs to address comparability challenges in cross-cultural survey research, while reducing the resource-intensive nature of manual coding. By fine-tuning PMLMs on a limited set of manually coded responses, we demonstrate that the model can accurately classify unannotated responses, including those in languages unseen during training. This hybrid approach significantly reduces the labor-intensive nature of manual coding while ensuring cross-linguistic comparability in survey research, offering a scalable and cost-efficient alternative to traditional classification methods.
We structure the article as follows: First, we discuss the role of open- vs. closed-ended survey questions in comparative research and situate the democracy measurement debate within this context. Next, we present our methodological framework, including the Democracy Tree coding scheme, manual annotation of a proportion of survey responses and the training and application of PMLMs for automated classification. We then evaluate model performance relative to traditional coding and discuss its implications for comparative survey research. Finally, we apply the annotated data to examine how conceptions of democracy relate to nativist attitudes, demonstrating the method’s substantive utility in a cross-cultural setting.
2 The advantage of open-ended approaches in survey-based research
Open-ended survey responses provide rich qualitative insights, allowing respondents to articulate their thoughts freely, reducing researcher-imposed bias and uncovering unexpected themes (Neuert et al. Reference Neuert, Meitinger, Behr and Schonlau2021; Reja et al. Reference Reja, Manfreda, Hlebec and Vehovar2003). They are particularly valuable in political science, where researchers seek to capture public conceptions of abstract and contested concepts, such as democracy, justice and governance. By enabling respondents to express their views in their own terms, open-ended questions reveal nuanced understandings that may be constrained by predefined categories in closed-ended surveys (Baburajan, de Abreu e Silva, and Pereira Reference Baburajan, de Abreu e Silva and Pereira2024; Jackson and Trochim Reference Jackson and Trochim2002; Stoneman, Sturgis, and Allum Reference Stoneman, Sturgis and Allum2013).
Democracy, in particular, is a multidimensional concept that resists reduction to fixed-response categories. While structured surveys like the European Social Survey, the European Values Study and the World Values Survey facilitate cross-national comparisons, they often impose theoretical frameworks that may not fully align with respondents’ conceptualizations, risking oversimplification (Dahlberg and Mörkenstam Reference Dahlberg and Mörkenstam2024; Ferrín and Kriesi Reference Ferrín and Kriesi2016; König, Siewert, and Ackermann Reference König, Siewert and Ackermann2022; Lu and Chu Reference Lu and Chu2021; Quaranta Reference Quaranta2018; Shin and Kim Reference Shin and Kim2018). By contrast, open-ended questions capture diverse perspectives shaped by political histories, institutional structures and cultural contexts, revealing how democracy may emphasize elections and rights in some settings, and social equality or economic justice in others (Dalton, Shin, and Jou Reference Dalton, Shin and Jou2007b; Ulbricht Reference Ulbricht2018).
However, coding and analyzing open-ended responses present challenges, particularly in cross-national research. Unlike closed-ended responses, open-ended data require extensive manual or computational processing, which is costly, time-consuming and introduces subjectivity as interpretations vary between researchers (Goodrich Reference Goodrich2008; Jackson and Trochim Reference Jackson and Trochim2002; Miller and Lambert Reference Miller and Lambert2014). Linguistic and cultural differences further complicate coding, as translation inconsistencies and contextual variations can limit comparability (Harkness Reference Harkness, Leeuw, Hox and Dillman2012; Smith Reference Smith, Beatty, Collins, Kaye, Padilla, Willis and Wilmot2020). Moreover, variation in response quality adds another layer of complexity to large-scale comparative analyses (Neuert et al. Reference Neuert, Meitinger, Behr and Schonlau2021; Reja et al. Reference Reja, Manfreda, Hlebec and Vehovar2003).
2.1 The use of NLP for quantifying responses from open-ended survey questions
Several natural language processing (NLP) techniques have been used to analyze open-ended survey data. These range from unsupervised approaches such as topic modeling, which automatically uncover latent themes (Chen et al. Reference Chen, Vidden, Nelson and Vriens2018; Pietsch and Lessmann Reference Pietsch and Lessmann2018; Roberts et al. Reference Roberts2014), to supervised or semi-automatic coding strategies that rely on predefined coding schemes and human-annotated training data to estimate statistical annotation models (Haensch et al. Reference Haensch, Weiß, Steins, Chyrva and Bitz2022; Gweon and Schonlau Reference Gweon and Schonlau2024). More recently, researchers have also prompted generative large language models (LLMs) to classify responses into predefined categories without additional task-specific training (Mellon et al. Reference Mellon, Bailey, Scott, Breckwoldt, Miori and Schmedeman2024).
Among unsupervised models, one widely used approach is the structural topic model (STM) (Roberts et al. Reference Roberts, Stewart, Tingley and Airoldi2013), applied in comparative survey research to model topics in the open-ended response (Mourtgos and Adams Reference Mourtgos and Adams2019; Roberts et al. Reference Roberts2014), while also incorporating covariates reflecting other attributes expressed in closed-ended questions.
While topic models are valuable for exploratory analysis, their data-driven nature poses a challenge for multilingual text collections and may result in different topic distributions for responses in different languages, even when respondents discuss similar underlying concepts. Such variability complicates systematic cross-national comparisons, as topics are not inherently aligned across different linguistic and cultural groups (Roberts et al. Reference Roberts2014). STMs remain useful for exploratory research in single-country studies, but their lack of predefined topic structures and cross-linguistic alignment limits their effectiveness in comparative survey settings.
Mellon et al. (Reference Mellon, Bailey, Scott, Breckwoldt, Miori and Schmedeman2024) praise LLMs as a powerful tool for social science researchers that could allow for increased use of open-ended survey questions, given their relative ease of use as compared to supervised modeling requiring expensive annotations. At the same time, they caution against blindly trusting the LLM output without proper validation and warn that annotation quality may be worse in languages other than English. Lin and Zhang (Reference Lin and Zhang2025) also raise the complexity of the annotation task as a factor in deciding whether LLMs should be used directly as primary coders or merely as secondary coding assistants.
Supervised methods require the development of an appropriate coding scheme, training of human annotators and manual annotation of a representative sample, in order to train a model. In their analysis, Mellon et al. (Reference Mellon, Bailey, Scott, Breckwoldt, Miori and Schmedeman2024) find LLMs to outperform their supervised models despite training the latter on a substantial amount of annotated examples. However, incorporating pre-trained language models (LMs) in the supervised model may allow for better annotation in multilingual settings, when a PMLM is chosen.
PMLMs leverage extensive pre-training on diverse, multilingual corpora, enabling them to generalize more effectively across languages and to capture semantic nuances. This capability facilitates consistent categorization of key concepts across different cultural contexts, which often vary across countries.
Given these trade-offs, supervised approaches, combining open-ended responses with structured coding techniques, offer a promising solution.
2.2 Structured coding frameworks for open-ended responses
A well-defined coding scheme ensures consistency, validity and theoretical alignment in classifying open-ended responses, whether manually by coders or automatically by PMLMs, and is essential for maintaining comparability across countries (Nelson et al. Reference Nelson, D.Burk, Knudsen and McCall2021).
In comparative survey research, coding schemes must be conceptually robust yet flexible enough to capture linguistic and cultural variation in how respondents express their views (Aizpurua Reference Aizpurua, Sha and Gabriel2020). Human coders play a crucial role by providing expert-annotated validation datasets that train models to distinguish between response types. This hybrid approach—combining human expertise with computational efficiency—improves classification accuracy and comparability in large-scale, cross-national research. While PMLMs scale the classification of open-ended responses, their reliability ultimately depends on the quality and theoretical soundness of the coding scheme.
This article employs the Democracy Tree framework (Dahlberg and Mörkenstam Reference Dahlberg and Mörkenstam2024) to classify conceptions of democracy across diverse linguistic and cultural contexts. The framework categorizes democracy-related discourse into procedural, substantive and outcome-based understandings. Originally developed for analyzing media discourse across 93 countries using distributional semantics, the Democracy Tree offers a systematic, empirically grounded and theoretically informed approach to structuring democratic conceptions.
We next describe the data, preprocessing and implementation of the Democracy Tree framework for classifying democratic conceptions across languages and cultures. We then compare PMLM performance to traditional coding and discuss implications for comparative survey research.
3 Methodology
3.1 Survey data collection
The data collection, conducted between July and October 2020 via the panel provider Mantap Global AB, involved a master questionnaire translated by researchers at GESIS Leibniz Institute for the Social Sciences.Footnote 1 The survey was fielded in ten countries—Estonia, France, Germany, Hungary, Italy, Poland, Russia, Spain, the United Kingdom and the United States—targeting Internet users aged 18–65. Stratified samples of approximately 2,000 respondents per country were drawn according to a predefined quota plan, yielding around 2,000 written responses per country.Footnote 2 The survey covered topics of democracy and migration and included both closed- and open-ended questions; this article focuses on two open-ended questions about democracy.
The first open-ended question (Q1) asked the respondents to elaborate on what they think about when they hear the word democracy.Footnote 3 The second open-ended question (Q2) followed directly after a close-ended question asking the respondents to rate how satisfied they are with the way democracy works in their country on an 11-point numeric scale, from 0 labeled “Extremely dissatisfied” to 10 labeled “Extremely satisfied.”Footnote 4 Footnote 5 The first question captures abstract associations with democracy, while the second focuses on its perceived performance in each country.
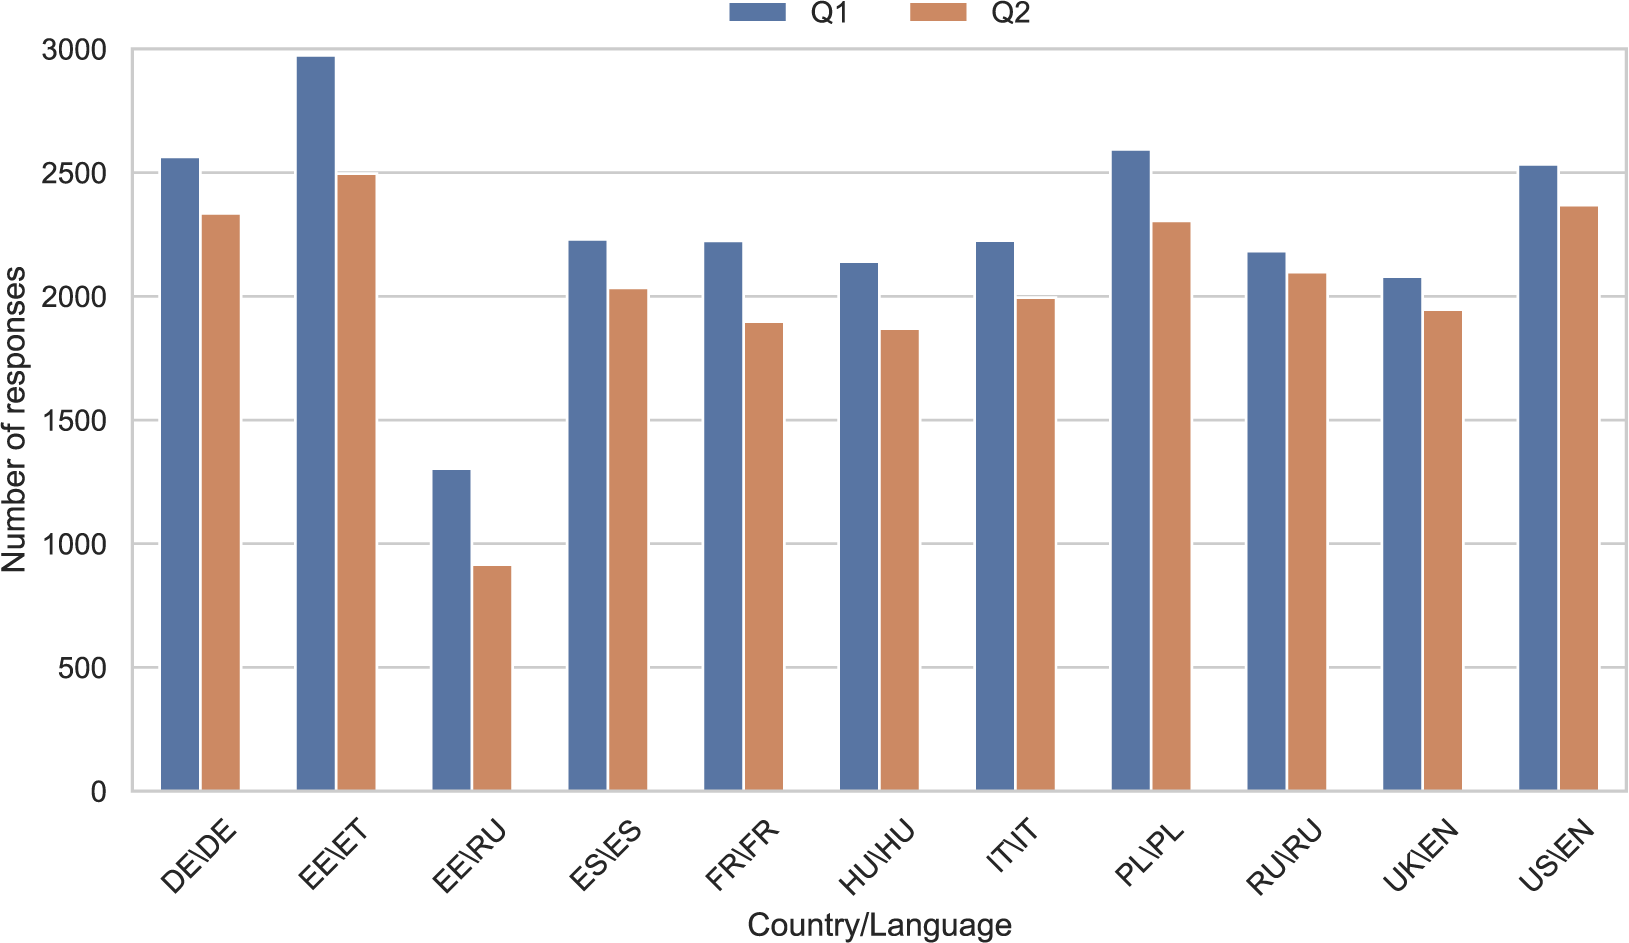
While the responses in most of the countries were collected in the official language only, responses from Estonia were collected in either Estonian or Russian. Altogether, this gives responses from ten countries in nine languages (Russian is common to Estonia and Russia, English to the UK and the US). Figure 1 shows the number of responses for each question in the different countries and languages.
Number of responses per question (Q1 and Q2) and country/language.

3.2 Manual annotation
The data were annotated by international students—all native speakers of the language they annotated, and with an educational background in social sciences. The task consisted of annotating spans of text, that is, sequences of consecutive words, within the responses corresponding to categories in the coding scheme. The coding scheme, labeled the Democracy Tree, was developed both inductively and deductively based on online media data from the Online Distributional Semantic Lexicon created by the Linguistic Explorations of Societies (LES) project at the University of Gothenburg (see Dahlberg and Mörkenstam Reference Dahlberg and Mörkenstam2024; Dahlberg et al. Reference Dahlberg2023). Despite methodological differences, studies commonly converge on procedural or substantive understandings of democracy (Lu and Chu Reference Lu and Chu2021; Shin and Kim Reference Shin and Kim2018; Wu and Wu Reference Wu and Wu2022; Zhai Reference Zhai2019). Procedural democracy emphasizes electoral processes and institutional frameworks, while substantive democracy encompasses values and outcomes. This distinction forms the cornerstone for delineating three abstract categories: democracy as a system of governance, democracy as values and democracy as outcome. These categories were instrumental in constructing a Democracy Tree, aligning with findings from a previous study (Dahlberg, Axelsson, and Holmberg Reference Dahlberg, Axelsson and Holmberg2020), thereby ensuring the reliability and validity of the coding. The integration of these categories with prior research findings indicates the robustness of the coding, which is also demonstrated by correlations with previous studies on conceptions of democracy from open-ended survey questions (Dalton, Shin, and Jou Reference Dalton, Shin and Jou2007a). Finally, the Democracy Tree expands upon these dimensions to provide comprehensive insights into democracy, thereby rendering our results comparable to other cross-cultural survey studies (Dahlberg and Mörkenstam Reference Dahlberg and Mörkenstam2024). See Appendix 2 of the Supplementary Material for an overview of the Democracy Tree.
The coding scheme is made up of three main domains:
-
1. Governance.
-
2. Values.
-
3. Outcome.
Each domain comprises a maximum of three subdomains, allowing a multilevel coding process. For example, 1. Governance represents the main domain (level 1), 1.1 Governance – Politics a subdomain at level 2, 1.1.1 Governance – Politics – National a subdomain at level 3 and 1.1.1.1 Governance – Politics – National – National Actors a subdomain at level 4. Besides the three main domains, the coding scheme includes three categories for coding text inapplicable to any of these domains:
-
4. Other.
-
5. Missing/Non-Response.
-
6. Linguistically Unclear.
The annotators were instructed to only use domain 4. Other for spans of text that were fit for annotation but did not apply to any of the three main domains. Domain 5. Missing/Non-Response was used when text was missing or considered as an evident non-response (e.g., “I don’t know”), and domain 6. Linguistically Unclear was used when the annotator could not make sense of the text (e.g., “Yu es hey war”).
The annotators were encouraged to select the most specific category possible; they were allowed to assign multiple labels to the same span but were in general discouraged from doing so. However, of all labeled spans in the five languages about 40% still overlap with another span at level 1.
We selected a subset of five languages to annotate: Hungarian, Italian, Polish, RussianFootnote 6 and Spanish. The selection of languages was motivated by an interest in linguistic diversity (two Romance, two Slavic and one Finno-Ugric language) and in having some variation in political regime types in the respective countries.
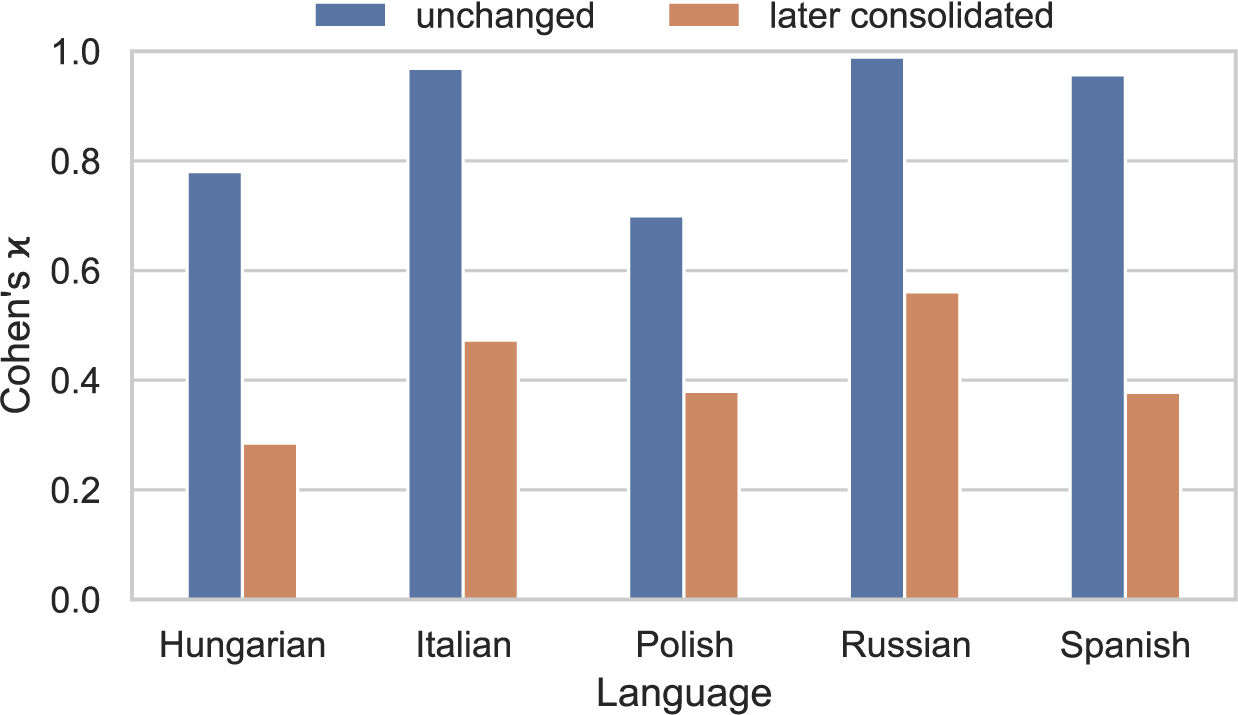
Annotation was conducted in three phases. First, two annotators for each language independently annotated the two open-ended responses of (the same randomized) 500 respondents. After computing inter-annotator agreement (IAA) on these 500 instances, the two annotators were asked to reach a consensus annotation on the instances where annotations diverged the most, which amounted to about 300 instances per language. Figure 2 shows IAA in the first stage for categories at level 1 of the Democracy Tree across the five languages according to Cohen’s $\kappa $
(Cohen Reference Cohen1960). The agreement has been calculated separately for the divergent instances (red bars), which were later consolidated with a consensus annotation, and the remaining instances (blue bars), which were used unchanged. For the latter, the
$\kappa $
(Cohen Reference Cohen1960). The agreement has been calculated separately for the divergent instances (red bars), which were later consolidated with a consensus annotation, and the remaining instances (blue bars), which were used unchanged. For the latter, the $\kappa $
values range from 0.70 (Polish) to 0.99 (Russian), which is regarded as substantial to almost perfect agreement. Finally, after the consolidation phase, the two annotators separately annotated 250 instances each. This gives a total of 1,000 annotated responses (for both open-ended questions) in each language, where 500 are annotated by a single annotator, about 300 are annotated by a consensus of two annotators and about 200 are annotated by both annotators. For the experiments, we only use one of the annotations for the doubly annotated instances, selecting the annotator that shows the highest IAA with the consensus annotations.
$\kappa $
values range from 0.70 (Polish) to 0.99 (Russian), which is regarded as substantial to almost perfect agreement. Finally, after the consolidation phase, the two annotators separately annotated 250 instances each. This gives a total of 1,000 annotated responses (for both open-ended questions) in each language, where 500 are annotated by a single annotator, about 300 are annotated by a consensus of two annotators and about 200 are annotated by both annotators. For the experiments, we only use one of the annotations for the doubly annotated instances, selecting the annotator that shows the highest IAA with the consensus annotations.
Inter-annotator agreement at Democracy Tree level 1. Blue bars correspond to examples with high enough agreement to be included for further use, while red bars show examples selected for consolidation by both annotators in each language.

Although we cannot measure the agreement on the annotations from stages two and three (because we only have single annotations), we expect it to resemble the unchanged annotations in Figure 2 more than the divergent annotations. IAA in the same splits at lower levels in the Democracy Tree is lower (Figures 7 and 8 in the Supplementary Material), which is why we only use annotations at level 1.
3.3 Automatic annotation
To automatically annotate the remaining responses in the five countries with manual annotations (roughly 1,000 responses per country), as well as all responses in the other five countries (roughly 2,000 responses per country), we fine-tune XLM-RoBERTa (Conneau et al. Reference Conneau, Jurafsky, Chai, Schluter and Tetreault2020)Footnote 7 using a subset of our annotated data. XLM-RoBERTa (XLM-R for short) is a multilingual pre-trained encoder model trained on text from the CommonCrawl repository in 100 languages, including all nine languages in our study. The multilingual pre-training enables classification after fine-tuning not only on the five languages included in the training data (Hungarian, Italian, Polish, Russian and Spanish) but also on the remaining four languages (English, Estonian, French and German). This technique is known as zero-shot cross-lingual transfer and has been studied extensively for PMLMs (see, e.g., Pires, Schlinger, and Garrette Reference Pires, Schlinger, Garrette, Korhonen, Traum and Màrquez2019; Wu and Dredze Reference Wu, Dredze, Inui, Jiang, Ng and Wan2019). To be able to assign different categories to different segments of a response, we fine-tune XLM-R for token classification, following common practice for related annotation tasks such as named-entity recognition (Liang et al. Reference Liang, Yu, Jiang, Er, Wang, Zhao and Zhang2020). This means that the model is trained to assign a label to each token (a word or a part of a word) in the text.
The choice of model and annotation approach is based on a pilot study conducted on the subset of the data available before the third phase of annotation (Zhao Reference Zhao2023).Footnote 8 Note that this approach involves fine-tuning a relatively small encoder LM (XLM-R) instead of prompting a much larger generative decoder model, like ChatGPT, Gemini or Llama. The motivation for this choice is threefold: (i) fine-tuning may improve performance when adapting the model to the specific coding scheme; (ii) annotating open-ended survey responses requires token-level classification, for which fine-tuned encoder models still often outperform much larger generative decoder models (Arzideh et al. Reference Arzideh2025; Nielsen, Enevoldsen, and Schneider-Kamp Reference Nielsen, Enevoldsen and Schneider-Kamp2025); and (iii) smaller models are more resource-efficient.
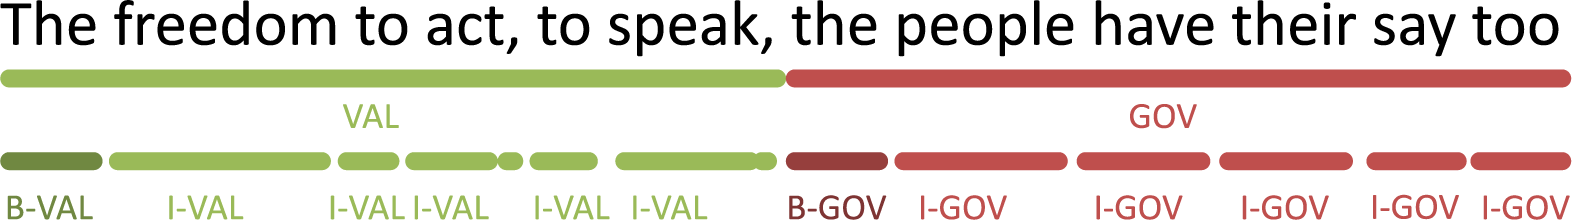
In preparation for the classification, annotated spans are converted into token-level labels using the BIO format (Ramshaw and Marcus Reference Ramshaw and Marcus1995), where B- and I- indicate the beginning and inside of a span, respectively, and tokens outside any span are assigned the label O. Figure 3 provides an example of both span and BIO annotations.
Example of a response annotated as spans (top row) and in BIO token classification format (bottom row).

Considering the low IAA for lower levels of the Democracy Tree mentioned earlier, we focus on the three broad level 1 categories, Governance (GOV), Values (VAL) and Outcomes (OUT), and map the remaining top-level categoriesFootnote 9 to Other (O). We split the data for each language by respondents into 850 training pairs, 50 development pairs and 100 test pairs. We randomly sample the development and test sets from the final round of 500 annotations and use all remaining data for training in order to have as much data as possible for training while retaining a reasonably sized test set.
To annotate responses in the four languages for which we do not have any annotations, we use cross-lingual zero-shot learning to fine-tune an instance of XLM-R on all the data from the other five languages and apply it to the unseen languages. We call this the multilingual model. For the five languages with annotations, we can either use this model or a monolingual model fine-tuned only on annotated data of that language.Footnote 10 To select the best model for the seen languages and to estimate the expected accuracy on the unseen languages, we perform a series of experiments with mono- and multilingual models fine-tuned only on the training sets and evaluated on the test sets:
-
• Monolingual models, trained on one language, evaluated on the same language.
-
• Multilingual models, trained on all five languages, evaluated on the same languages.
-
• Cross-lingual models, trained on subsets of four languages, evaluated on the fifth.
While the cross-lingual experiments are the most relevant to our analysis on the full survey, monolingual and multilingual experiments indicate how well models perform on the five languages with annotations and how performance on individual languages may be helped by learning from additional annotations in other languages.
We estimate hyperparameters like learning rate and number of training epochsFootnote 11
for the three scenarios on a subset of languages and settle on a learning rate of 2 $\times $
10
$\times $
10 $^{-5}$
and training up to five epochs with early stopping. Appendix 5 of the Supplementary Material gives more details on hyperparameter experiments, and Appendix 6 of the Supplementary Material shows the amount of data used at different stages of the experiments.
$^{-5}$
and training up to five epochs with early stopping. Appendix 5 of the Supplementary Material gives more details on hyperparameter experiments, and Appendix 6 of the Supplementary Material shows the amount of data used at different stages of the experiments.
Building on the insights gained from the multilingual and cross-lingual experiments, we finally train a new multilingual model on all 5,000 annotated responses, which we use to annotate all survey responses from all ten countries to estimate the proportions of different Democracy Tree categories in individual countries and in the survey as a whole (see Section 4.2).
4 Results
In this section, we discuss the results of the study from two different perspectives. First, in Section 4.1, in order to validate that the automatic annotation is sufficiently accurate to be used as a basis for further analysis, we evaluate the monolingual, multilingual and cross-lingual models against manually annotated test data. In Section 4.2, we then show how the automatic annotation produced by the final multilingual model can be used to compare survey responses across different questions and countries.
4.1 Evaluation of the automatic annotation
As described in Section 3.3, we formulate the annotation task as a token classification task, where we consider seven labels (O and a B- and I- version of the three broad Democracy Tree categories). Since we are primarily interested in estimating the proportion of different categories in the responses to the two questions in different countries, exact span replication—that is, where exactly the beginning and end of a segment reflecting a specific category is—is not as important to us as whether the model annotates roughly the right number of tokens with the right labels. Therefore, we report the token-level F1-score for each Democracy Tree dimension after merging the six B- and I- tags back into the corresponding Democracy Tree categories, as well as the micro-averaged F1-score on all four categories, that is, including the O label. F1 is the harmonic mean between Precision and Recall, all three common evaluation metrics for classification problems. These metrics are further described in Appendix 4 of the Supplementary Material. In addition to F1, we report the estimated proportions for each category and compare them to the manually annotated proportions. To understand how well the automatically derived proportions reflect those based on human annotation, we calculate the Pearson correlation coefficient between the two across categories and languages.
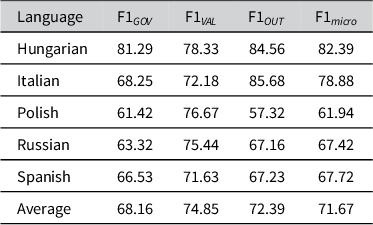
Tables 1–3 detail the performance of monolingual, multilingual and cross-lingual models on the test sets. We observe that a single multilingual model on average slightly improves over the monolingual models by 1.77% and reaches an F1 $_{micro}$
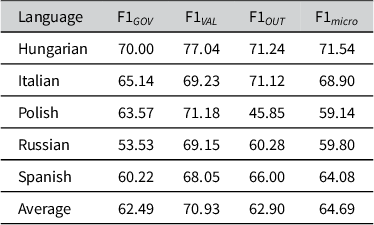
of 71.67, whereas the cross-lingual models, lacking explicit training on the languages they are evaluated on, underperform the monolingual models by 5.21% with an F1
$_{micro}$
of 71.67, whereas the cross-lingual models, lacking explicit training on the languages they are evaluated on, underperform the monolingual models by 5.21% with an F1 $_{micro}$
of 64.69. The relatively low drop in performance corroborates the efficacy of zero-shot cross-lingual transfer using a massively multilingual pre-trained LM like XLM-R.
$_{micro}$
of 64.69. The relatively low drop in performance corroborates the efficacy of zero-shot cross-lingual transfer using a massively multilingual pre-trained LM like XLM-R.
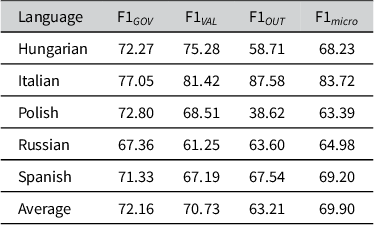
Annotation results as category-wise F1-score with monolingual models

Annotation results as category-wise F1-score with multilingual models

Annotation results as category-wise F1-score with cross-lingual models

Considering performance by individual language, the micro-averaged F1 of the monolingual model is slightly better than that of the multilingual and corresponding cross-lingual model in all languages except Hungarian and Russian, where we see strong evidence of cross-lingual transfer in the multilingual model, and for Hungarian also a notable improvement in the purely cross-lingual scenario.
With respect to specific Democracy Tree categories, the multilingual model improves the average performance in predicting the Outcome and Values categories compared to monolingual performance (+9.18% F1 $_{OUT}$
and +4.12% F1
$_{OUT}$
and +4.12% F1 $_{VAL}$
).
$_{VAL}$
).
Italian is the only language where we do not see any improvements from adding annotated data in other languages. For the remaining four languages, we observe substantial improvements in the annotation of Outcome in Hungarian and Polish and notable improvements in the annotation of Values in Russian and Spanish. Hungarian stands out as the only language where the annotation of all three Democracy Tree categories is improved, when training on additional data in other languages.
Without having seen annotated data in the test language, the annotations of individual categories can still be improved over the monolingual models. The best examples for this are again Hungarian and Polish, where Outcome and Values annotation improves over the monolingual models. In addition, we see some improvement in annotating Values in Russian, albeit at the expense of performance for Governance and Outcome.
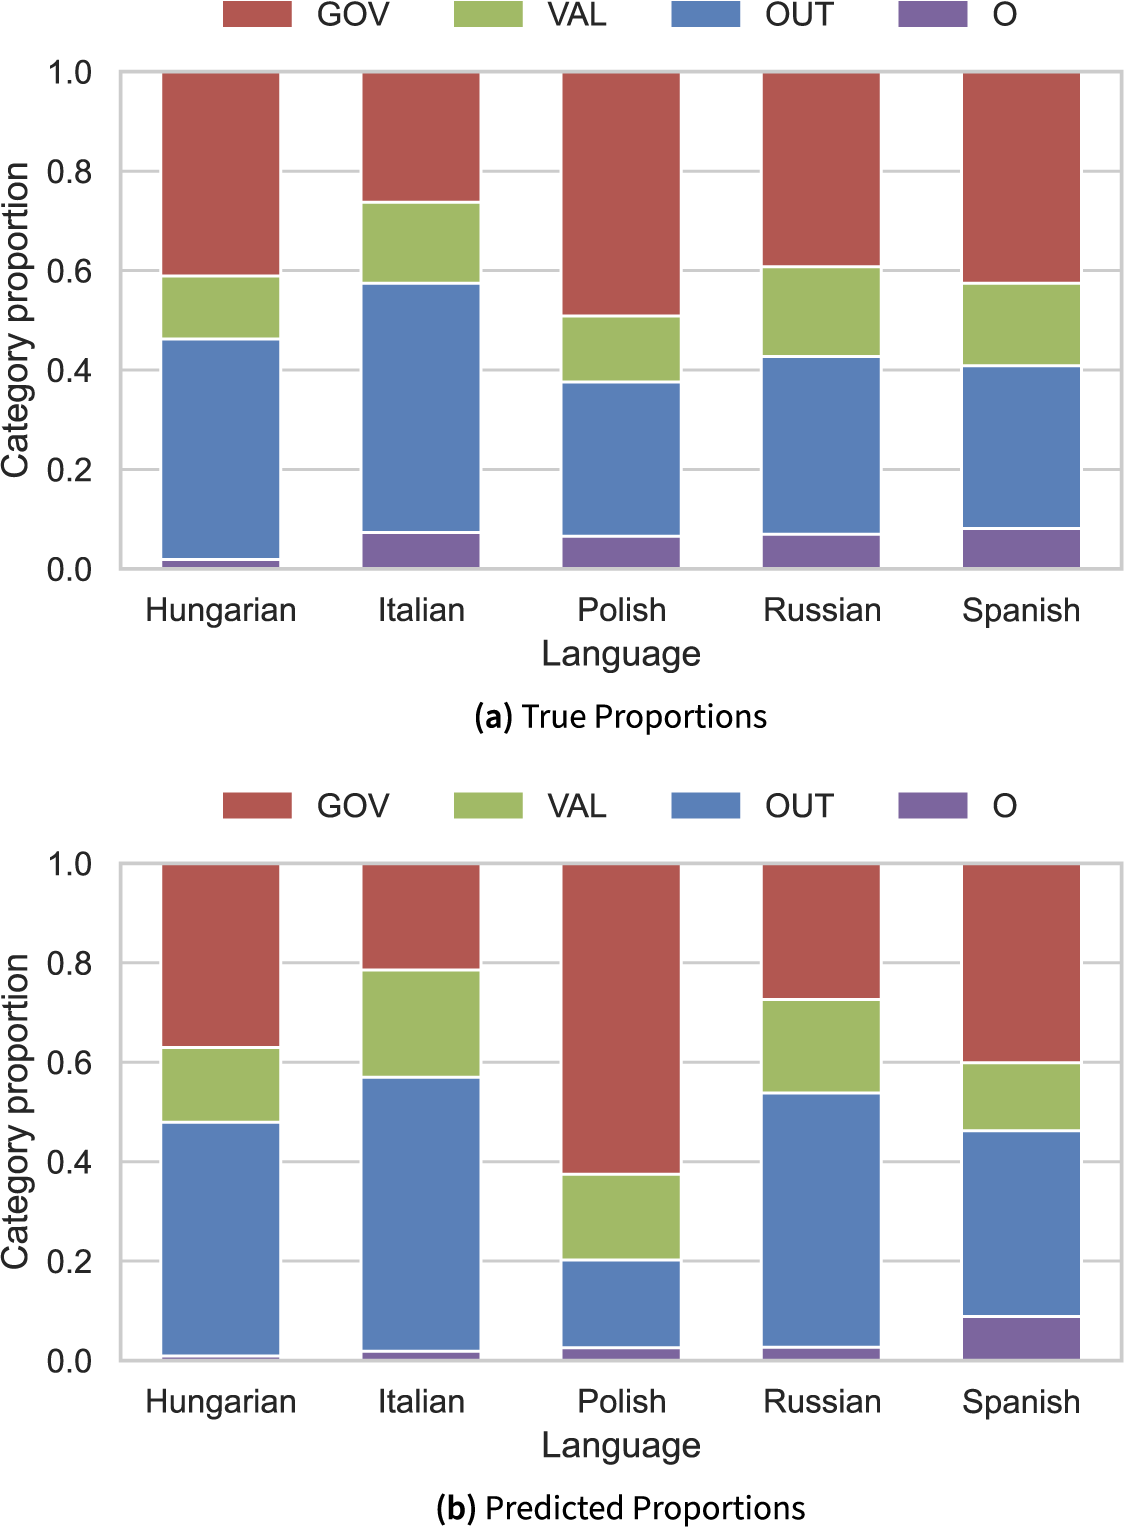
Using the best models identified for the five annotated languages,Footnote 12 we then calculate the proportions of each category on the test set and compare them with the proportions in the human annotation. We visualize these proportions in Figure 4.
Category proportions in the test set according to human annotation and best model predictions

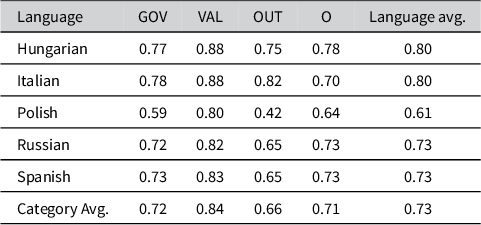
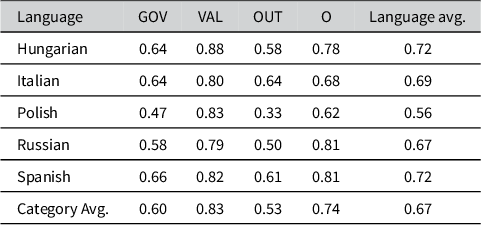
Table 4 shows the Pearson correlation coefficient on the estimated proportions per response and Table 5 shows the difference between automatic and human proportions over all responses. We observe strong positive correlations of 0.70 and higher between the proportions based on human annotation and automatic predictions in most languages, with weaker correlations for the Other, Outcome and Governance categories in Polish and Outcome in Russian and Spanish. However, even these lower correlations in the range of 0.42 and 0.66 are still encouraging as the correlation coefficient is defined within $-$
1 and 1 where 1 is a perfect linear relationship between the studied variables and a correlation of 0 would imply the absence of a linear relationship altogether. This suggests that the models’ predictions, when expressed as proportions per response, correspond reasonably well to proportions we can compute from human annotation.
$-$
1 and 1 where 1 is a perfect linear relationship between the studied variables and a correlation of 0 would imply the absence of a linear relationship altogether. This suggests that the models’ predictions, when expressed as proportions per response, correspond reasonably well to proportions we can compute from human annotation.
Pearson correlation between predicted proportions by the best models for each language and human annotation on the test set

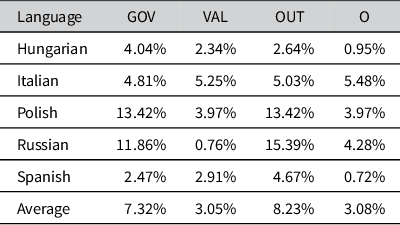
Absolute difference between proportions based on automatic and human annotation

Considering the proportions calculated over all reports in the test set in Figure 4 and the differences between human and model proportions as reported in Table 5, we see that for most languages and categories the differences are minor at less than 5%. Here, the biggest differences can be observed for Russian, where Outcome is over-predicted at the expense of Governance by 15.39%, followed by Polish, where the model over-predicts the Governance category by about 13% mostly at the expense of Outcome.
As a proxy for the performance on unseen languages, we also consider the Pearson coefficient between proportions based on the annotation by the cross-lingual models and human annotation. These coefficients are shown in Table 6. In all cross-lingual models, we observe strong positive correlations for the Values and Other categories. Governance and Outcome also have positive correlations, which are weaker for Polish and Russian. The Polish predictions for Outcome stand out with a weak positive correlation of 0.33 with human annotation.
Pearson correlation between predicted proportions by cross-lingual (leave-one-out) models and human annotation on the test set

Compared to the best models for all five languages, the zero-shot cross-lingual predictions show significantly weaker correlations for the Governance and Outcome categories, indicating larger variation in per report proportions by these models and less consistency with human annotation of this category. In general, however, the category proportions derived from automatically annotated data are highly similar on average to those based on manual annotation, even for cross-lingual models without prior exposure to annotated data in the evaluated language, which validates the use of our method for automatic annotation of survey responses.
4.2 Analysis of survey responses
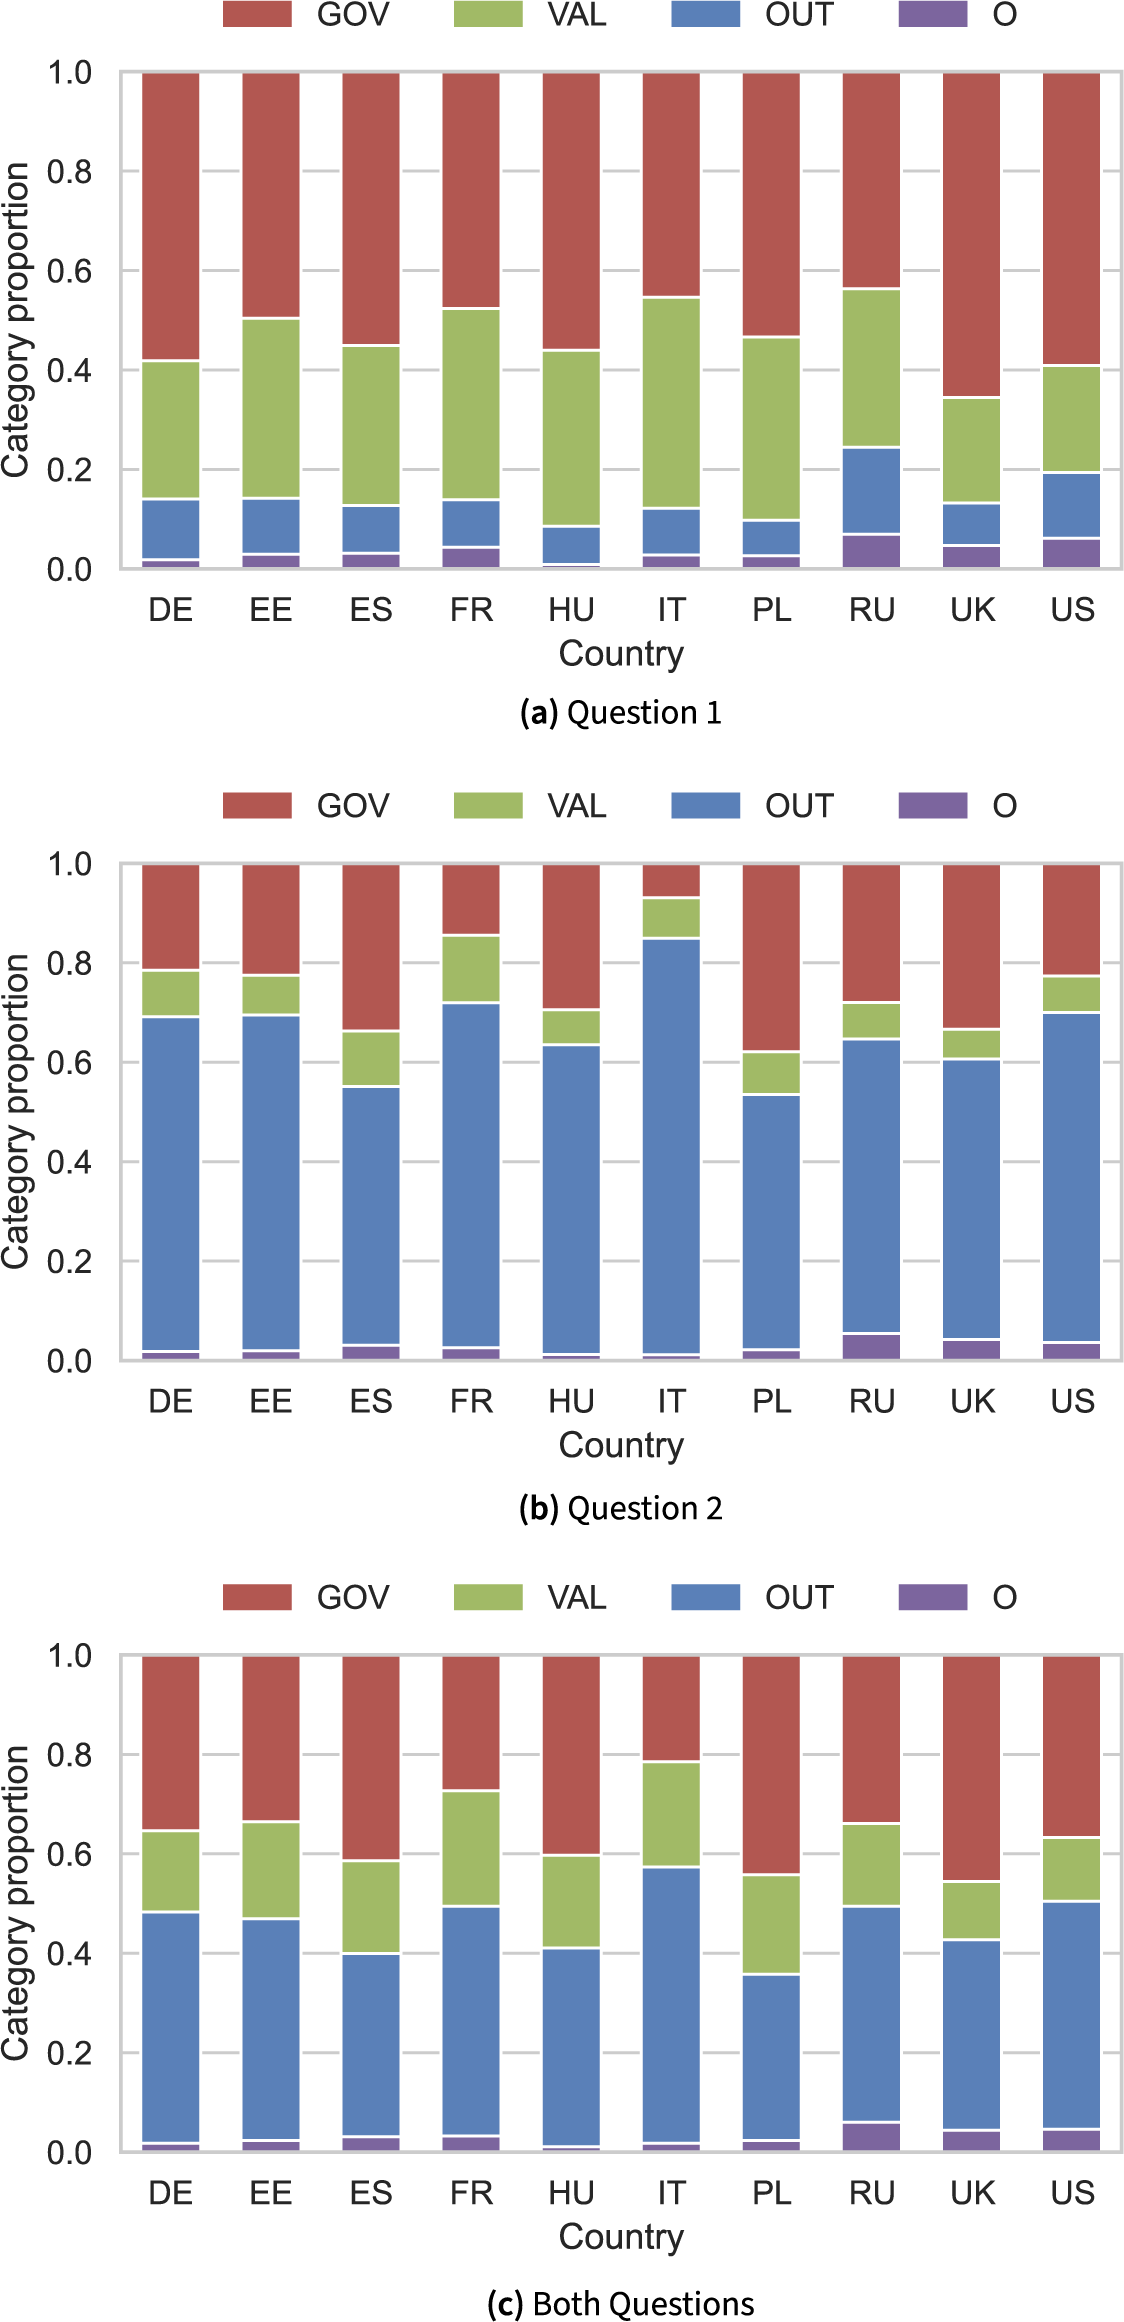
As explained in Section 3.3, we now consider predictions by a model trained on all available annotated data to compute category proportions on the entire survey. Figure 5 shows the proportions by country in each of the two questions separately and with both questions combined. We note that responses to Q1 exhibit larger proportions of the Governance and Values categories, while Q2 contains a larger proportion of Outcome, consistent with the more abstract framing of Q1 and the performance-oriented nature of Q2.
Category proportions by country as estimated by the multilingual model.

Looking more closely at individual countries, in Q1, the proportion of Governance is highest for the UK, followed by the US. France, Italy and Estonia display almost balanced proportions of Governance to Values, when discussing democracy in general. Poland stands out as the country discussing Outcome the least, while responses from Russia contain the largest proportion of Outcome for Q1.
Among all countries in the survey, Italian responses to Q2 contain the lowest proportion of Governance and the lowest proportion of Outcome. We observe similar trends for France, while Polish, UK and Spanish responses contain the highest proportions of Governance and notably less Outcome than other countries for Q2. Responses from the UK, US, Hungary and Russia have the lowest proportions of Values, when discussing satisfaction with democracy in their respective countries.
Calculating proportions over both questions, we still see Italian and French responses pertaining to Governance the least, and the UK, the US and Russia pertaining to Values the least. Overall, Italy, Germany, Estonia and France appear to discuss Outcome the most. At the same time, the UK, Poland, Spain and Hungary are the countries with the largest proportions of Governance over both questions.
5 Applying annotated open-ended survey data in cross-national analysis
Having validated our annotation method, we apply it to a substantive question: how citizens’ conceptions of democracy relate to nativist attitudes.
In recent years, scholars have increasingly explored the relationship between nativist attitudes, often linked to radical right voting, and support for democracy. While nativist citizens often express dissatisfaction with how democracy functions, this discontent extends beyond short-term performance concerns.Footnote 13 Comparative studies by Kokkonen and Linde (Reference Kokkonen and Linde2023a,Reference Kokkonen and Lindeb, Reference Kokkonen and Linde2025) consistently link nativist attitudes to lower levels of diffuse support for democracy—understood as support for democracy as a principled system of government. Nativists are particularly skeptical of liberal democratic norms, such as minority rights, institutional checks, pluralism and equal inclusion. However, this does not mean they reject democracy entirely; rather, their support is conditional and instrumental, favoring procedures or leaders that serve the perceived interests of the native majority.
This ambivalence often manifests itself as support for unconstrained majoritarianism, strong leadership and direct democratic mechanisms (Bartels Reference Bartels2020; Kokkonen and Linde Reference Kokkonen and Linde2025). From this perspective, democracy is valued less for its normative commitments and more for its capacity to deliver outcomes aligned with the priorities of the in-group.
Building on this literature, we expect individuals with strong nativist attitudes to be less likely to associate democracy with (liberal) values, and more likely to conceive of democracy in terms of outcomes—particularly those that reflect nationalist or exclusionary priorities. In contrast, we remain agnostic about the association between nativist attitudes and conceptions of democracy as governance. While nativists are often critical of existing democratic institutions, they do not necessarily reject procedural aspects, such as elections or institutional responsiveness—especially when these are perceived as mechanisms for asserting the majority will. We therefore propose the following hypothesis:
Individuals with strong nativist attitudes are more likely to associate democracy with outcomes and less likely to associate democracy with values, compared to non-nativists.
This hypothesis is tested using individual-level variation in nativist attitudes to predict the likelihood that respondents mention each of the three conceptions of democracy in our annotated data.
5.1 Analytical strategy
To test these predictions using our annotated survey data, we include three dependent variables corresponding to the three democracy categories: democracy as governance, as values and as outcome. Each variable is binary, coded as 1 if the classifier detects the respective category in a respondent’s answer, and 0 otherwise; coefficients therefore capture associations with detection probabilities. Since responses may reference multiple aspects of democracy, the classifications are not mutually exclusive—a single response can be assigned to one, two or all three categories.
To capture nativist attitudes, we construct an additive index ( $\alpha $
= 0.79) based on three survey items: (1) “Immigrants are generally good for [country]’s economy,” (2) “[Country]’s culture is generally undermined by immigrants,” and (3) “Immigrants increase crime rates.” Each item uses a five-point Likert scale ranging from “strongly agree” to “strongly disagree.” Responses were recoded such that higher values indicate stronger anti-immigrant or nativist sentiment.
$\alpha $
= 0.79) based on three survey items: (1) “Immigrants are generally good for [country]’s economy,” (2) “[Country]’s culture is generally undermined by immigrants,” and (3) “Immigrants increase crime rates.” Each item uses a five-point Likert scale ranging from “strongly agree” to “strongly disagree.” Responses were recoded such that higher values indicate stronger anti-immigrant or nativist sentiment.
5.2 Results
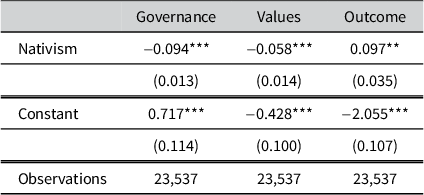
The results of the logistic regression models provide clear support for our theoretical expectations regarding the relationship between nativist attitudes and popular conceptions of democracy. In line with the hypothesis, table 7 shows a statistically significant and negative association between nativism and democracy as values ( $\beta $
=
$\beta $
= $-$
0.058, SE = 0.014,
$-$
0.058, SE = 0.014, $p < 0.001$
). Respondents with stronger nativist attitudes are less likely to describe democracy in terms of liberal principles, such as equality, rights or pluralism. This finding reinforces previous research showing that nativist worldviews are often at odds with the normative foundations of liberal democracy, particularly its emphasis on the inclusion of minorities and institutional constraints on majority rule.
$p < 0.001$
). Respondents with stronger nativist attitudes are less likely to describe democracy in terms of liberal principles, such as equality, rights or pluralism. This finding reinforces previous research showing that nativist worldviews are often at odds with the normative foundations of liberal democracy, particularly its emphasis on the inclusion of minorities and institutional constraints on majority rule.
Logistic regression results: Nativism and conceptions of democracy

Note: Standard errors in parentheses. * $p<0.05$
, **
$p<0.05$
, ** $p<0.01$
, and ***
$p<0.01$
, and *** $p<0.001$
. All models include control variables for gender, age cohort, education, political interest, employment status and area of residence. Country fixed effects are included to account for average differences across countries.
$p<0.001$
. All models include control variables for gender, age cohort, education, political interest, employment status and area of residence. Country fixed effects are included to account for average differences across countries.
Conversely, the relationship between nativism and democracy as outcome is positive and statistically significant ( $\beta $
= 0.097, SE = 0.035,
$\beta $
= 0.097, SE = 0.035, $p < 0.01$
). Individuals who score high on the nativism index are more likely to associate democracy with the delivery of substantive results—such as welfare, national protection or societal order, outcomes that are often framed in the literature as serving the interests of the native in-group. This supports the interpretation that nativists approach democracy in instrumental terms: they value democracy not for its intrinsic principles, but for its potential to produce desirable outcomes. Although the logit coefficients are moderate in size, moving from low to high levels of nativism corresponds to non-trivial changes in the predicted odds of mentioning democracy as an outcome and lower odds of referencing democratic values (Table 7).
$p < 0.01$
). Individuals who score high on the nativism index are more likely to associate democracy with the delivery of substantive results—such as welfare, national protection or societal order, outcomes that are often framed in the literature as serving the interests of the native in-group. This supports the interpretation that nativists approach democracy in instrumental terms: they value democracy not for its intrinsic principles, but for its potential to produce desirable outcomes. Although the logit coefficients are moderate in size, moving from low to high levels of nativism corresponds to non-trivial changes in the predicted odds of mentioning democracy as an outcome and lower odds of referencing democratic values (Table 7).
6 Conclusion
This study demonstrates the capabilities of PMLMs for analyzing open-ended survey responses, focusing on perceptions of democracy across a diverse, multilingual dataset from ten countries. Central to our approach is the Democracy Tree, a structured coding scheme that systematically categorizes responses into nuanced classes, reflecting the multifaceted nature of democratic perceptions. By fine-tuning PMLMs on a manually annotated subset of responses using this framework, we show that PMLMs can approach the accuracy of human annotators in identifying broad democratic concepts.
Our findings show PMLMs’ proficiency in classifying survey responses across languages, highlighting their potential to streamline manual coding in multilingual settings, a task that usually involves high labor intensity and substantial resources.
Furthermore, this research underscores the utility of PMLMs in providing deep insights into how respondents conceptualize democracy, equipping political scientists with a powerful tool to navigate the complexities of open-ended survey data. The precision of PMLM classifications opens new pathways for quantitatively analyzing qualitative data, effectively narrowing the gap between the detailed richness of open-ended feedback and the scalability of automated processing.
A key contribution of this study is to demonstrate how PMLM-assisted classification can complement human-coded data to improve the efficiency, consistency and interpretability of cross-national survey research. The Democracy Tree framework ensures that PMLMs enhance, rather than replace, human judgment, offering a hybrid approach that combines computational efficiency with theoretical precision. Although we apply this method to conceptions of democracy, the approach applies to any coding scheme for open-ended survey responses.
6.1 Challenges and considerations
Despite these promising findings, our study also reveals challenges that merit consideration. First, while PMLMs performed well across multiple languages, variation in classification accuracy suggests that linguistic and cultural factors influence performance.
Second, PMLMs are only as reliable as the coding framework and training data they are given. Although our human-annotated dataset provided a strong foundation, further improvements in fine-tuning models for specific cultural and linguistic contexts may be necessary. Additionally, biases inherent in pre-trained LMs warrant caution as they may subtly shape classification outcomes in ways that require further scrutiny.
A limitation of our work is that we do not include a comparison of our system with other automated methods, not even a simple baseline like a keyword classifier. The reason is that such classifiers can only label complete responses, while our method performs token-level classification and allows different categories to different parts of a response, making direct baseline comparisons misleading and uninformative. A direct comparison is therefore not possible, except with another PMLM like mBERT (Devlin et al. Reference Devlin, Chang, Lee and Toutanova2019), which we deem a less interesting comparison, given similar architectures and training (Conneau et al. Reference Conneau, Jurafsky, Chai, Schluter and Tetreault2020).
6.2 Future research directions
Future research could explore the specific linguistic or cultural factors that influence the effectiveness of cross-lingual transfer, particularly in languages like Italian, where current models show limited improvement. Exploring zero-shot learning mechanisms could provide insight into improving model robustness and accuracy across unseen languages, which is crucial for global comparative political analysis.
With respect to fine-tuning, the amount of annotated data required to train a robust PMLM in this context could be studied more systematically, and approaches such as active learning (Cohn, Atlas, and Ladner Reference Cohn, Atlas and Ladner1994; Zhang, Strubell, and Hovy Reference Zhang, Strubell and Hovy2023) for optimal selection of which examples to annotate could be pursued in order to minimize the amount of manual annotation required. This could affect the access to and uptake of supervised methods when funding for manual annotation is limited. It may also be worth exploring the use of LLMs with prompting; however, as discussed in Section 3.3, fine-tuned models are better suited to multilingual token classification with a specific coding scheme.
Our study focuses on automated annotation at the top level of the Democracy Tree, primarily due to low IAA in some languages at levels 2 and 3. Modeling finer categories would also require more training examples per class. Crucially, the low IAA reflects not only limited data but also the task’s inherent difficulty—human experts likewise struggle to assign fine-grained, context-dependent labels consistently (Jackson and Trochim Reference Jackson and Trochim2002). Advancing automated fine-grained coding will require further research on larger, well-annotated datasets.
Future research should examine how linguistic and cultural factors affect PMLM performance, the role of domain-specific fine-tuning and how response types (e.g., short vs. long, emotional vs. neutral) influence classification. Direct comparisons between PMLMs, STMs and other automated methods could clarify their respective strengths and limitations in comparative research.
In sum, integrating open-ended questions with PMLMs offers a scalable, systematic toolkit for qualitative analysis, enhancing the depth, efficiency and cross-cultural comparability of survey research. Continued refinement will be key as NLP advances.
Data availability statement
Data and replication code for this article have been published in the Political Analysis Harvard Dataverse at https://doi.org/10.7910/DVN/XOWF9C (Dürlich et al. Reference Dürlich, Dahlberg, Axelsson, Nivre and Zhao2026).
Acknowledgements
We thank Ulf Mörkenstam and Johan Broberg for contributions to annotation and model training.
Funding statement
This work was funded by Swedish Research Council grants 2017-02429 and 2022-02909.
Competing interests
The authors declare none.
Supplementary material
The supplementary material for this article can be found at https://doi.org/10.1017/pan.2026.10043.


 Open access