


Introduction
Exogenous factors such as fluctuations in prices, weather, global markets, and government policies could have a significant impact on farm income. For instance, rainfall distribution throughout the production cycle is of particular importance to livestock and forage producers. It has been documented that precipitation patterns are associated with significant variations in forage yieldsFootnote 1 (Currie and Peterson, Reference Currie and Peterson1966; Murphy, Reference Murphy1970; Cable, Reference Cable1975; Duncan and Woodmansee, Reference Duncan and Woodmansee1975; Lauenroth and Sala, Reference Lauenroth and Sala1992; Dunn et al., Reference Dunn, Gutwein, Green, Menger and Printz2013). In response, ranchers have adopted climate risk management strategies that include short- and long-term adjustments in forage supply and demand, and the implementation of financial risk management measures (Shrum et al., Reference Shrum, Travis, Williams and Lih2018). In this regard, producers can incorporate existing weather-related crop insurance programs into their risk management plans to protect against uncertain precipitation levels.
In 2007, the Federal Crop Insurance Corporation (FCIC) introduced the Pasture, Rangeland, Forage (PRF) pilot insurance program as a tool for livestock and forage producers to mitigate the risk of forage loss associated with the lack of precipitation. Currently, the PRF insurance program is available in 48 states and over 201 million acres were enrolled in the program in 2021 (USDA RMA, 2021a). Compared to traditional crop insurance options, the PRF program is an index-based insurance that utilizes National Oceanic and Atmospheric Administration Climate Prediction Center (NOAA CPC) data to estimate the relative temporal precipitation within a specific area. Policyholders receive an indemnity payment when the precipitation index falls below a chosen trigger level. Precipitation or forage production is not measured at the farm level. Therefore, given exogenous precipitation index realizations, the magnitude of the indemnity received merely depends on farmers’ ex ante selection of the program coverage parameters.
Farmers can tailor their policies by choosing appropriate index intervals, coverage level, and productivity factor. These parameters determine the amount of protection, premium rates, subsidy level, and expected indemnity payments. Regardless of their economic implications, only a handful of studies have been conducted to untangle the relationships between decision parameters and the impacts they have on expected returns and risk. Previous studies have focused on providing selection recommendations for specific geographical areas, evaluated a limited number of decision parameters, and omitted parameter selection restrictions (Jimenez Maldonado, Reference Jimenez Maldonado2011; Diersen, Gurung, and Fausti, Reference Diersen, Gurung and Fausti2015; Stewart, Reference Stewart2018; Westerhold et al., Reference Westerhold, Walters, Brooks, Vanderveer, Volesky and Schacht2018).
Omission of any decision parameter or selection constraint disrupts the set of valid potential solutions, which could result in suboptimal allocation of resources, and misestimation of the feasible range of returns and underlying risk. The main objective of this study is to develop risk-efficient coverage selection strategies for the PRF insurance program. Although the proposed methods are applicable to any participating state, they are illustrated and evaluated using actuarial data for a grid in South Texas. To the best of our knowledge, this is the first study that considers all the decision parameters in the selection process and meets all the actual selection restrictions of the PRF program. Three risk-efficient portfolio allocation methods are applied and adapted to solve the PRF parameter selection conundrum. Linear and quadratic mathematical programming techniques are incorporated into a heuristic optimization framework to jointly identify the ideal level of each decision parameters. Empirical results highlight the underlying relationships between expected revenue, risk, and the choice of the decision parameters.
PRF program
The PRF insurance program is designed to protect producers of perennial pastures, rangeland, and forages against precipitation uncertainty. Insurable acres are assigned to a coordinate system with grids equal to 0.25° in latitude by 0.25° in longitude (or approximately 17 by 17 miles at the equator). As an index-based insurance, the PRF program does not adjust for crop losses, but from deviations from historical normal precipitation. Particularly, precipitation is interpolated for each grid and it is estimated for 11 overlaying 2-month index intervals (i.e., January–February, February–March, …, November–December). The interval precipitation levels estimated for each individual grid are transformed into a precipitation index, where a value of 100 is assigned to the interval historical average precipitation.
Besides inherent and fixed location and production practice settings, farmers are allowed to select a set of independent coverage parameters including the index intervals, coverage level, and productivity factor. The optimal levels of these decision parameters should be gauged in terms of their associated expected benefits and costs. For instance, distribution of the percent of value is used to select a disjoint set of the 11 available index intervals.Footnote 2 The percent of value allocated to all index intervals must add up to 100%. Additionally, between 10 and a state-based maximum percent of value (typically between 50% and 70%) can be assigned to each of the selected index intervals. Different premium rates are associated with each index interval, and the premium amount is proportional to the percent of value allocated to each index interval. Given percent of value constraints, a minimum of two index intervals can be chosen and no more than six index intervals are permitted.
The coverage level serves as the threshold for indemnity payments for all selected index intervals. Coverages levels between 70% and 90% in 5-unit increments are available. An indemnity payment is triggered when the interval precipitation index falls below the chosen coverage level. Higher premium rates are associated with higher coverage levels. Premium subsidies are also determined by the coverage level. Particularly, a subsidy factor of 59% is used for 70% and 75% coverage levels, 55% subsidy when 80% or 85% coverage levels are selected, and a 51% subsidy factor for 90% coverage level. Given a predefined county base value, farmers have the option to modify the amount of protection by adjusting the coverage level and productivity factor. Namely, policyholders can choose a productivity factor between 60% and 150% in 1-unit increments. The amount of protection per acre is equal to:
 $$\delta = v\lambda \gamma,$$
where v is the county base value, λ is the coverage level, and γ is the productivity factor.
The indemnity payment corresponding to the j th index interval is given by:
 $$\mathcal{l}_{j}={w_{j}}\rho _{j}\delta,$$
where w
j
is the percent of value assigned to the j
th interval, ${\rho _j} = \max \left({{\lambda - {{\rm{I}}_j}} \over \lambda },0\right)$
is the interval payment factor, and I
j
is the observed interval precipitation index.
${\rho _j} = \max \left({{\lambda - {{\rm{I}}_j}} \over \lambda },0\right)$
is the interval payment factor, and I
j
is the observed interval precipitation index.
The farmer-paid premium for the j th interval is equal to:
 $$\varphi _{j}=(1-s)w_{j}\beta _{j}\delta,$$
where s is the subsidy level, and β j is the premium rate of the j th index interval. Both s and β j depend on the coverage level selected. Hence, the net indemnity of the PRF program is given by:
 $$R=\sum \nolimits _{j=1}^{11}w_{j}\delta [\rho _{j}-(1-s)\beta _{j}]=\sum \nolimits _{j=1}^{11}w_{j}r_{j}$$
The overall producers’ net return or net farm income is given by the net farm sales (π) generated by the marketing or utilization of the forage produced plus the net indemnity received by participating in the PRF program. Namely, net return is equal to:
 $$\Pi =\pi +R.$$
The PRF program could be considered as an alternative source of revenue to compensate for the expected reduction in farm income in the event of limited precipitation. Hence, a risk management strategy could be to choose the PRF coverage that is expected to offset potential yield losses, while minimizing the joint risk. In general, possible risk management strategies associated with the PRF insurance program range from hedging a fraction of the forage value to maximizing the overall net return. Optimal coverage selection and related risk vary with the overall net return target level.
Special considerations should be given to inherent aspects of the designing of the PRF program that could affect the effectiveness of a risk management plan. Particularly, as an index-based insurance, the PRF program may suffer from basis risk (the difference between the magnitude and occurrence of actual forage losses and the corresponding insurance payouts) (Orden et al., Reference Van Orden, Willis, Bosworth, Larsen, McCarty and Kim2020). Furthermore, historical farm- or grid-level production data necessary to estimate net farm sales and their relationship to net indemnity payments may not be available. Therefore, omitting farm sale returns or using a proxy for forage yields could aggravate basis risk.
Limited theoretical and empirical work have been conducted to understand the implications of the selection of the coverage parameters for the PRF insurance program. Preceding studies have evaluated specific parameters separately or a reduced range of feasible combinations. Namely, in Pennsylvania, Jimenez Maldonado (Reference Jimenez Maldonado2011) identified preferred combinations of index intervals and coverage levels in terms of specific return and risk criteria. However, in the analysis, the percent of value was fixed and set to be proportional to the number of index intervals selected, and the effect that productivity factor has on the inherent uncertainty of the returns was not considered. In South Dakota, Diersen, Gurung, and Fausti (Reference Diersen, Gurung and Fausti2015) estimated conditional, risk-efficient index interval combinations, where a limited set of potential intervals were considered, minimum percent of value restriction was not imposed, and the coverage level and productivity factor were set at the maximum possible levels. Similarly, Stewart (Reference Stewart2018) identified the distribution of the percent of value that maximized expected indemnity returns in Utah, but coverage level and productivity factor were constant in the optimization process, and minimum interval allocations were not constrained. Westerhold et al. (Reference Westerhold, Walters, Brooks, Vanderveer, Volesky and Schacht2018) evaluated the expected net income and variability of specific coverage scenarios in Nebraska. The scenarios were constructed by combining two equal-weighted index intervals, and fixed coverage level and productivity factor were used.
Optimizing all the PRF coverage parameters has been found challenging in practice because maximizing the program net indemnity described in equation (5) requires solving a constrained mixed integer nonlinear function with a large number of possible combinations of continuous and discrete variables. Compared to previous studies, we proposed a comprehensive selection approach that considers all coverage parameters of the PRF program and meets every parameter restriction. A heuristic optimization approach is presented to overcome the limitations found in previous studies to include all the parameters in the selection analysis.
Coverage selection methods
The proposed coverage selection strategies are based on well-known portfolio optimization frameworks. Particularly, three alternative strategies are presented to assist producers with their coverage selection process: mean-variance, Value-at-Risk, and shortfall. These asset selection models are tailored to the context and data of the PRF insurance program. To the best of our knowledge, the Value-at-Risk and shortfall method have been barely used in agricultural applications. However, they provide alternative measures of risk that could be of interest to PRF policyholders. For instance, the goal of a risk-averse producer may be to select the percent of value, coverage level, and productivity factor that yield a desired expected net return while minimizing risk exposure. To take more risk, a risk-averse policyholder needs to be compensated with a higher net expected return. The optimal trade-off between net return and risk will depend on individual risk preferences. In the case of the mean-variance approach, risk is represented by the resulting variability of the net return. On the other hand, selection risk in the Value-at-Risk and shortfall models are given by the probability and expected value of the net returns below a particular value, respectively.
Mean-variance
The mean-variance analysis was initially proposed by Markowitz (Reference Markowitz1952) as a risk diversification strategy for financial portfolio selection. Under the mean-variance framework, a set of assets is chosen to maximize expected net returns for every level of risk or vice versa. Portfolio risk is typically described by the variance or standard deviation of the portfolio return. The mean-variance approach has been widely adapted in agricultural applications to assist with crop variety selection (Nalley et al., Reference Nalley, Barkley, Watkins and Hignight2009; Nalley and Barkley, Reference Nalley and Barkley2010), irrigation water use options (Gaydon et al., Reference Gaydon, Meinke, Rodriguez and McGrath2012; Paydar and Qureshi, Reference Paydar and Qureshi2012), ecosystem services (Alvarez, Larkin & Ropicki, Reference Alvarez, Larkin and Ropicki2017), forest management (Zinkhan, Reference Zinkhan1988; Knoke et al., Reference Knoke, Stimm, Ammer and Moog2005; Neuner, Beinhofer & Knoke, Reference Neuner, Beinhofer and Knoke2013), among others. Reduced forms of the mean-variance method were used in Jimenez Maldonado (Reference Jimenez Maldonado2011) and Diersen, Gurung, and Fausti (Reference Diersen, Gurung and Fausti2015) to select the optimal level for certain parameters of the PRF insurance program.
In the context of the PRF program, the objective of the mean-variance strategy is to find the level of the decision parameters – coverage level, productivity factor, and percent of value distribution – that minimizes the variance of the overall net returns (5) for any given expected return level. Particularly, given producer’s selection of the aforementioned decision parameters (i.e., λ, γ, and w ), the conditional expected value of the net returns is equal to:
 $$E\left(\Pi \right)=E\left(\pi \right)+\sum \nolimits_{j=1}^{11}w_{j}E(r_{j}).$$
It can also be shown that the variance of the net returns can be written as:
 $$V\left(\Pi \right)=\sigma _{\pi }^{2}+\sum \nolimits_{j=1}^{11}\sum \nolimits_{K=1}^{11}w_{j}w_{k} \ \sigma _{jk}+2\sum \nolimits_{j=1}^{11}w_{j}\sigma _{\pi j},$$
where σ π 2 is the variance of the net farm sales, σ jk is the covariance between r j and r k , and σ πj is the covariance between π and r j .
The PRF coverage selection process can be represented as a mixed integer nonlinear programming problem of the form:
 $$\mathop {\min }\nolimits_{\lambda ,\,\gamma ,\,{{\omega}} ,\,{ {d}}} \ V= \sigma _\pi ^2 + \mathop \sum \nolimits_{j = 1}^{11} \mathop \sum \nolimits_{K = 1}^{11} {w_j}{w_k}{\sigma _{jk}} + 2\mathop \sum \nolimits_{j = 1}^{11} {w_j}{\sigma _{\pi j}} $$
 $${s.t.\,\,\,E(\pi ) + \mathop \sum \nolimits_{j = 1}^{11} {w_j}E({r_j}) = x}$$
 $${\mathop \sum \nolimits_{j = 1}^{11} {w_j} = 1}$$
 $${{w_j} = {d_j}{\omega _j}\,\,\,\,\,\ \ \ \ \ \ \ \ \ \ \ \ \ j = 1, \ldots 11}$$
 $${0.1 \le {\omega _j} \le \varpi \,\,\,\ \ \ \ \ \ \ \ j = 1, \ldots 11}$$
 $${{d_j} + {d_{j + 1}} \le 1\,\,\,\,\,\ \ \ \ \ \ \ j = 1, \ldots 10}$$
 $${{d_j} \in \left\{ {0,1} \right\}\,\,\,\,\ \ \ \ \ \ \ \ \ \ \ \ j = 1, \ldots 11}$$
 $${\lambda \in \{ 70,75,80,85,90\}}$$
 $${\gamma \in \{ 60,61,62, \ldots ,150\}} ,$$
where x is the expected net return level, ω is a vector of conditional weights, ϖ is the maximum percent of value that can be assigned to a single index interval, and d is a vector of 11 d j dummy variables that indicate the index intervals selected. Note that σ jk , σ πj , and r j are explicit functions of λ and γ, even though this is suppressed in the notation. Also, it is reasonable to assume that participation in the PRF program does not significantly affect farm outcomes. Hence, σ 2 π and E(π) can be set or adjusted according to the coverage parameter levels during the optimization process.
Value-at-Risk
The underlying distribution of the net returns could affect the performance of the coverage selection strategies. For instance, the mean-variance approach may inadequately capture downside risk when returns are nonsymmetrically distributed (Harlow, Reference Harlow1991; Sing and Ong, Reference Sing and Ong2010). Therefore, we propose the Value-at-Risk method as an alternative coverage selection strategy that may provide better tail risk control. Specifically, the goal of the Value-at-Risk approach is to find the coverage parameter values that minimize the chances of obtaining a net return below a certain level.
Let’s define the α-quantile of the net returns in equation (5) as q
α
such that $P\left(\Pi \leq q_{\alpha }\right)\leq \alpha$
and 0 < α < 1. The objective of the policyholder is then to select the coverage level, productivity factor, and percent of value distribution that yield the largest qα (i.e., q*
α
) and desired expected net return. The combination of parameter values associated with q*
α
is preferred over all other possible alternatives with the same expected net return because their probability of obtaining a net return below q*
α
is greater or equal than α. By definition, there is a 1-α chance of obtaining a net return greater than q*
α
. Risk is commonly centered at the expected value, and it is referred as Value-at-Risk (Bertsimas, Lauprete & Samarov, Reference Bertsimas, Lauprete and Samarov2004):
$P\left(\Pi \leq q_{\alpha }\right)\leq \alpha$
and 0 < α < 1. The objective of the policyholder is then to select the coverage level, productivity factor, and percent of value distribution that yield the largest qα (i.e., q*
α
) and desired expected net return. The combination of parameter values associated with q*
α
is preferred over all other possible alternatives with the same expected net return because their probability of obtaining a net return below q*
α
is greater or equal than α. By definition, there is a 1-α chance of obtaining a net return greater than q*
α
. Risk is commonly centered at the expected value, and it is referred as Value-at-Risk (Bertsimas, Lauprete & Samarov, Reference Bertsimas, Lauprete and Samarov2004):
 $$VaR_{\alpha }=E\left(\Pi \right)-q_{\alpha }.$$
Note that for a fixed expected net return, minimizing VaR α is equivalent to maximizing q α . Compared to traditional financial settings, in the case of the PRF program, the maximum losses are bounded by the farmer-paid premiums (ϕ j ).
Furthermore, the distribution of the net returns can be approximated by the empirical distribution function using sample data. Namely, given a sample of n independent and identically distributed net returns ( $\Pi _{1},\ldots, \Pi _{n}$
), the nonparametric estimator of the cumulative distribution function of
$\Pi _{1},\ldots, \Pi _{n}$
), the nonparametric estimator of the cumulative distribution function of $\Pi $
is
$\Pi $
is
 $${{\hat{F}_{R}\left(q_{\alpha }\right)}}={1 \over n}\sum \nolimits_{i=1}^{n}{\bf 1}_{i}, $$
where 1
i
is an indicator variable that is equal to 1 if $\Pi _{i}\leq q_{\alpha }$
, and 0 otherwise. Hence, the Value-at-Risk formulation of the PRF coverage selection problem is
$\Pi _{i}\leq q_{\alpha }$
, and 0 otherwise. Hence, the Value-at-Risk formulation of the PRF coverage selection problem is
 $${{\max \nolimits_{\lambda, \ \gamma, \ {{\omega}}, \ {{d}}, \ {\bf 1}_{i}, \ { q}_{\alpha }}} \ q_{\alpha }}$$
 $${s.t.\,\,\,E(\pi ) + \mathop \sum \nolimits_{j = 1}^{11} {w_j}E({r_j}) = x}$$
 $${{1 \over n}\sum\nolimits_{i = 1}^n {{{\bf{1}}_i}} = \alpha} $$
 $${{\pi _i} + \mathop \sum \nolimits_{j = 1}^{11} {w_j}{r_{ji}} - {q_\alpha } + M{{\bf1}_i} \gt 0\,\,\ \ \ \ \ \ \ \,i = 1, \ldots ,n}$$
 $${\pi _i} + \mathop \sum \nolimits_{j = 1}^{11} {w_j}{r_{ji}} - {q_\alpha } + M({{\bf{1}}_i} - 1) \le 0\,\,\,\,\ \ \ \ \ \ \ \,i = 1, \ldots ,n$$
 $${\mathop \sum \nolimits_{j = 1}^{11} {w_j} = 1}$$
 $${w_j} = {d_j}{\omega _j}\,\,\,\ \ \ \ \ \ \ \ \ \ \ j = 1, \ldots 11$$
 $${0.1 \le {\omega _j} \le \varpi \,\,\,\,\ \ \ \ \ \ j = 1, \ldots 11}$$
 $${{d_j} + {d_{j + 1}} \le 1\,\,\,\,\,\ \ \ \ \ \ j = 1, \ldots 10}$$
 $${{d_j} \in \left\{ {0,1} \right\}\,\,\,\ \ \ \ \ \ \ \ \ \ j = 1, \ldots 11}$$
 $${\lambda \in \{ 70,75,80,85,90\}} $$
 $${\gamma \in \{ 60,61,62, \ldots ,150\}} $$
where π
i
and r
ji
are the net farming income and unweighted net indemnity of the jth index interval of the ith sample observation, respectively; and M is large enough so that $M \gt \max \{ |{\pi _i} + \mathop \sum \nolimits_{j = 1}^{11} {w_j}{r_{ji}} - {q_\alpha }|:i = 1 \ldots n\} $
. Note that 1
i
equals 1 if
$M \gt \max \{ |{\pi _i} + \mathop \sum \nolimits_{j = 1}^{11} {w_j}{r_{ji}} - {q_\alpha }|:i = 1 \ldots n\} $
. Note that 1
i
equals 1 if $\pi _{i}+\sum _{j=1}^{11}w_{j}r_{ji}-q_{\alpha }\leq 0$
, and 0 otherwise.
$\pi _{i}+\sum _{j=1}^{11}w_{j}r_{ji}-q_{\alpha }\leq 0$
, and 0 otherwise.
Shortfall
In the shortfall strategy, the goal is to maximize the expected value of the net returns in case they drop below the q α quantile. Thus, compared to Value-at-Risk, the shortfall selection approach considers the magnitude of the losses and not only their probability of occurrence. Namely, the shortfall at risk level α is (Bertsimas, Lauprete & Samarov, Reference Bertsimas, Lauprete and Samarov2004):
 $$SF_{\alpha }=E\left(\Pi \right)-E\left(\Pi |\Pi \leq q_{\alpha }\right).$$
Note that given n observed net returns, n
α
= ⌊αn⌋ of them are less than or equal to q
α
. Therefore, the sample estimator of the q
α
-conditional expected net return is $\sum _{i}^{n}{{\bf 1}_{i}}\Pi _{i} \over n_{\alpha } $
. An additional auxiliary variable z
i
is created to represent
$\sum _{i}^{n}{{\bf 1}_{i}}\Pi _{i} \over n_{\alpha } $
. An additional auxiliary variable z
i
is created to represent $\sum _{i}^{n}{{\bf 1}_{i}}\Pi _{i} \over n_{\alpha } $
as a linear function. Particularly, the expected value of the net returns that are less than or equal to q
α
is given by
$\sum _{i}^{n}{{\bf 1}_{i}}\Pi _{i} \over n_{\alpha } $
as a linear function. Particularly, the expected value of the net returns that are less than or equal to q
α
is given by ${1 \over n_{\alpha }}\left\{\sum _{i}^{n}z_{i}-\left(n-n_{\alpha }\right)q_{\alpha }\right\}$
, where z
i
is equal to
${1 \over n_{\alpha }}\left\{\sum _{i}^{n}z_{i}-\left(n-n_{\alpha }\right)q_{\alpha }\right\}$
, where z
i
is equal to $\Pi _{i}$
if
$\Pi _{i}$
if $\Pi _{i}\leq q_{\alpha }$
, and equal to q
α
otherwise. Also, note that for a given expected net return, minimizing SF
α
is equivalent to maximize its lower conditional expected value. Hence, the in-sample formulation of the Value-at-Risk problem is modified to incorporate the expected value of the net returns if they fall below q
α
. Specifically, the objective function in equation (11) is replaced by:
$\Pi _{i}\leq q_{\alpha }$
, and equal to q
α
otherwise. Also, note that for a given expected net return, minimizing SF
α
is equivalent to maximize its lower conditional expected value. Hence, the in-sample formulation of the Value-at-Risk problem is modified to incorporate the expected value of the net returns if they fall below q
α
. Specifically, the objective function in equation (11) is replaced by:
 $${{\max \nolimits_{\lambda, \ \gamma, \ {{\omega}}, \ {{d}}, \ {\bf 1}_{i}, \ { q}_{\alpha }. \ {{z}}}}} \ {1 \over n}_{\alpha }\left\{\sum _{i}^{n}z_{i}-\left(n-n_{\alpha }\right)q_{\alpha }\right\},$$
and two additional sets of constraints are added:
 $$z_{i}-\pi _{i}-\sum\nolimits _{j=1}^{11}w_{j}r_{ji}\leq 0, \qquad i=1,\ldots,n$$
 $${z_i} - {q_\alpha } \le 0,\,\,\,\,i = 1, \ldots ,n$$
where z is a vector containing the z i variables.
Heuristic estimation
The proposed selection models can be estimated directly using mixed integer nonlinear optimization techniques (Kronqvist, et al. Reference Kronqvist, Bernal, Lundell and Grossmann2019). However, if only the feasible combinations of the parameters are considered, the selection of the PRF coverage parameters can be reduced to simple conditional linear and quadratic programming problems. Particularly, the feasible search space can be constructed by identifying the combinations of productivity factor, coverage level, and intervals whose potential net return range enclosed the target return level.
It can be shown that the 11 available index intervals can be selected in 221 different valid combinationsFootnote
3
(Jimenez Maldonado, Reference Jimenez Maldonado2011). Given a coverage level (λ) and productivity factor (γ), the expected individual net indemnities E(r
j
) of the selected index intervals (i.e., d
j
= 1) in each of the 221 feasible index interval arrays (
d
) can be sorted in ascending ( ${\bf r}^{\Delta +}$
) or descending (
${\bf r}^{\Delta +}$
) or descending ( ${\bf r}^{\Delta -}$
) order. Moreover, the expected lower and upper net return bounds associated with the m
th combination of productivity factor, coverage level, and selected index intervals (i.e., C
m
= {λ
m
, γ
m
,
d
m
}) are [
${\bf r}^{\Delta -}$
) order. Moreover, the expected lower and upper net return bounds associated with the m
th combination of productivity factor, coverage level, and selected index intervals (i.e., C
m
= {λ
m
, γ
m
,
d
m
}) are [ $E\left(\pi \right)+{{g}}_{m}^{'}{\bf r}_{m}^{\Delta +}$
, E(π)+
$E\left(\pi \right)+{{g}}_{m}^{'}{\bf r}_{m}^{\Delta +}$
, E(π)+ ${{g}}_{m}^{'}{\bf r}_{m}^{\Delta -}$
], where
g
m
is a column vector of weights with length equal to the sum of the nonzero elements of
d
m
. The weights in
g
m
meet the percent of value (
w
) allocation constraints and they yield the minimum and maximum feasible expected net return for the m
th combination of parameters. For example, if six index intervals are selected, then
g
m
is equal to [0.5, 0.1, 0.1, 0.1, 0.1, 0.1]
T
, if five index intervals are considered
g
m
= [0.5, 0.2, 0.1, 0.1, 0.1]
T
, and so forth until
g
m
= [0.5, 0.5]
T
when only two index intervals are chosen. Note that the entries of
g
m
represent the percent of value assigned to each of the selected index intervals. Therefore, for any feasible expected net return x
l
, there is a subset
C
l
= {C
l
1,…,C
l
M
l
} containing M
l
combinations of λ, γ, and
d
, so that x
l
can be achieved with every element of
C
l
.
${{g}}_{m}^{'}{\bf r}_{m}^{\Delta -}$
], where
g
m
is a column vector of weights with length equal to the sum of the nonzero elements of
d
m
. The weights in
g
m
meet the percent of value (
w
) allocation constraints and they yield the minimum and maximum feasible expected net return for the m
th combination of parameters. For example, if six index intervals are selected, then
g
m
is equal to [0.5, 0.1, 0.1, 0.1, 0.1, 0.1]
T
, if five index intervals are considered
g
m
= [0.5, 0.2, 0.1, 0.1, 0.1]
T
, and so forth until
g
m
= [0.5, 0.5]
T
when only two index intervals are chosen. Note that the entries of
g
m
represent the percent of value assigned to each of the selected index intervals. Therefore, for any feasible expected net return x
l
, there is a subset
C
l
= {C
l
1,…,C
l
M
l
} containing M
l
combinations of λ, γ, and
d
, so that x
l
can be achieved with every element of
C
l
.
The goal then is to find the distribution of the percent of value ( w l m ) and the C l m that yield the desired level of risk. For instance, the local minimum risk associated with the x l expected net return can be calculated for each C l m , and then the global minimum is identified among the M l potential candidates. Under this approach, the mean-variance selection strategy can be represented as a conditional quadratic problem, and the Value-at-Risk and shortfall models can be formulated as conditional linear optimization problems, respectively. For instance, given the m th combination of parameters {λ l m , γ l m , d l m }, the local minimum variance and optimal percent of value allocation are found by:
 $$\min \nolimits_{{w}_{m}^{l}} V=\sigma _{\pi }^{2}+\sum \nolimits_{j=1}^{11}\sum \nolimits_{K=1}^{11}w_{mj}^{l}w_{mk}^{l}\sigma _{jk}+2\sum \nolimits_{j=1}^{11}w_{j}\sigma _{\pi j} $$
 $${s.t.\,\,\,\,E(\pi ) + \mathop \sum \nolimits_{j = 1}^{11} w_{mj}^lE({r_j}) = {x_l}}$$
 $${\sum\nolimits _{j=1}^{11}w_{mj}^{l}=1}$$
 $${\mathop \sum \nolimits_{j = 1}^{11} d_{mj}^lw_{mj}^l = 1}$$
 $${0.1d_{mj}^l \le w_{mj}^l \le \varpi \,\,\,\,\ \ \ \ \ \ \ j = 1, \ldots 11.}$$
The corresponding conditional linear problem for the Value-at-Risk selection approach is
 $${\max \nolimits_{ {{w}}_{m}^{l}, \ q_{\alpha }^{l}, \ {\bf 1}_{i}} \ q_{\alpha }^{l}}$$
 $${s.t.\,\,\,\,E(\pi ) + \mathop \sum \nolimits_{j = 1}^{11} w_{mj}^lE({r_j}) = {x_l}}$$
 $${{1 \over n}\mathop \sum \nolimits_{i = 1}^n {{\bf{1}}_i} = \alpha} $$
 $${\pi _i} + \mathop \sum \nolimits_{j = 1}^{11} w_{mj}^l{r_{ji}} - q_\alpha ^l + M{{\bf{1}}_i} \gt 0\,\,\,\ \ \ \ \ \ \ \ \ \ \ \ i = 1, \ldots ,n$$
 $${\pi _i} + \mathop \sum \nolimits_{j = 1}^{11} w_{mj}^l{r_{ji}} - q_\alpha ^l + M({{\bf{1}}_i} - 1) \le 0\,\,\,\,\ \ \ \ \ i = 1, \ldots ,n$$
 $${\mathop \sum \nolimits_{j = 1}^{11} w_{mj}^l = 1}$$
 $${\mathop \sum \nolimits_{j = 1}^{11} d_{mj}^lw_{mj}^l = 1}$$
 $${0.1d_{mj}^l \le w_{mj}^l \le \varpi \,\,\,\,\ \ \ \ \ \ \ \ \ \ j = 1, \ldots 11}$$
Similarly, the conditional selection of w m l in the shortfall model is reduced to:
 $${\max \nolimits_{{{w}}_{m}^{l}, \ q_{\alpha }^{l}, \ {\bf 1}_{i}, \ {{z}}} \ {1 \over n}_{\alpha }\left\{\sum \nolimits _{i}^{n}z_{i}-\left(n-n_{\alpha }\right)q_{\alpha }^{l}\right\}}$$
 $${s.t.\,\,\,\,E(\pi ) + \mathop \sum \nolimits_{j = 1}^{11} w_{mj}^lE({r_j}) = {x_l}}$$
 $${{1 \over n}\mathop \sum \nolimits_{i = 1}^n {{\bf{1}}_i} = \alpha} $$
 $${{\pi _i} + \mathop \sum \nolimits_{j = 1}^{11} w_{mj}^l{r_{ji}} - q_\alpha ^l + M{{\bf{1}}_i} \gt 0\,\,\,\,\ \ \ \ \ \ \ \ \ \ \ \ \ \ \ \ \,i = 1, \ldots ,n}$$
 $${\pi _i} + \mathop \sum \nolimits_{j = 1}^{11} w_{mj}^l{r_{ji}} - q_\alpha ^l + M({{\bf{1}}_i} - 1) \le 0\,\,\,\ \ \ \ \ \ \ \ \ \ \,i = 1, \ldots ,n$$
 $${{z_i} - {\pi _i} - \mathop \sum \nolimits_{j = 1}^{11} {w_j}{r_{ji}} \le 0\,\,\,\,\,\,\,\,\,\,\,\,\,\ i = 1, \ldots ,n}$$
 $${z_i} -{q^{l}_{\alpha} \le 0,\,\,\,\ \ \ \ \ \ \ i = 1, \ldots ,n} $$
 $$\mathop \sum \nolimits_{j = 1}^{11} w_{mj}^l = 1$$
 $${\mathop \sum \nolimits_{j = 1}^{11} d_{mj}^lw_{mj}^l = 1}$$
 $${0.1d_{mj}^l \le w_{mj}^l \le \varpi \,\,\,\,\ \ \ \ \ \ \ \ \ \ j = 1, \ldots 11}$$
Alternatively, the selection process of the PRF coverage parameters can be formulated as a bilevel optimization problem where the discrete parameters are considered in the upper-level optimization task and the search space is limited to C l . The lower-level optimization task is represented by the above-mentioned conditional quadratic and linear functions and constraint sets (Colson, Marcotte & Savard, Reference Colson, Marcotte and Savard2007).
Empirical application
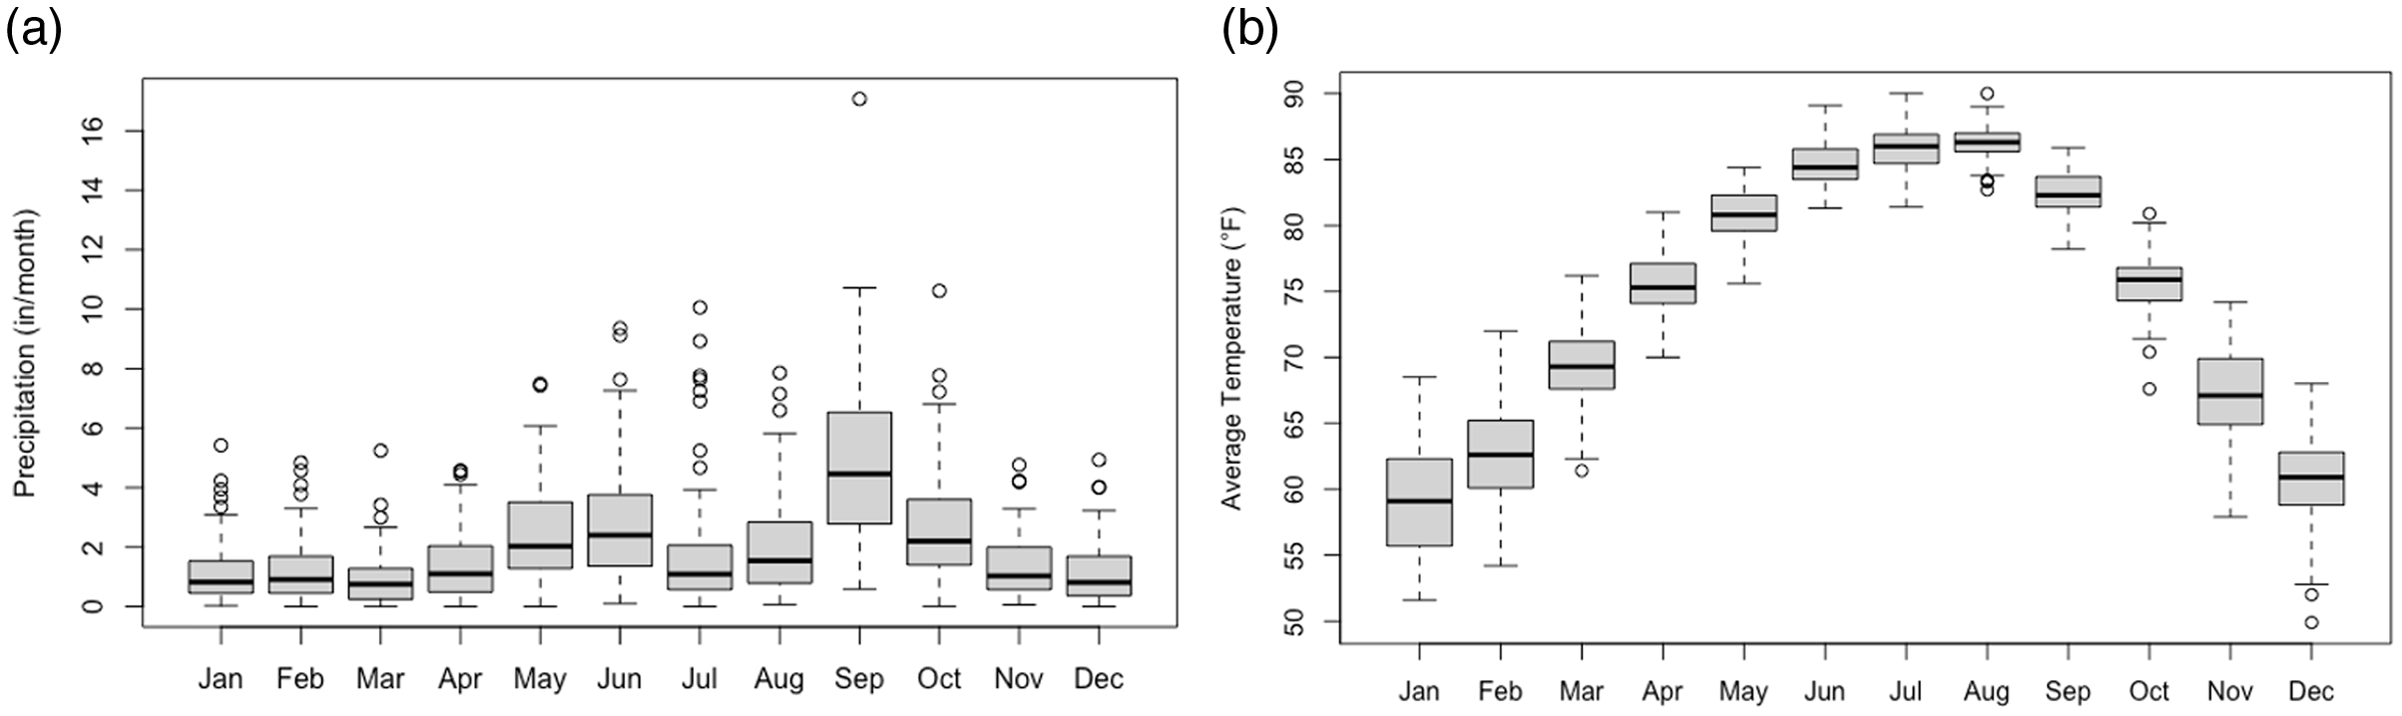
Significant variability caused by different precipitation patterns along with unique actuarial data is expected across all the grids where the PRF insurance program is available. Therefore, the main objective of this section is to illustrate the proposed coverage selection strategies on an empirical application and not to provide generalized parameter selection recommendations. The models were used to analyze coverage decisions for Grid 7329 (26.122°, −97.880°). This grid is located in Hidalgo, Texas. The area is identified as a semiarid climatic zone with variable and unpredicted rainfall (Enciso and Wiedenfeld, Reference Enciso and Wiedenfeld2005). Average monthly precipitation in the county is 2.02 inches with relatively higher precipitation levels from May to October (NOAA NCEI, 2021). Average monthly temperatures oscillate between 58.92 °F in January and 86.30 °F in August (NOAA NCEI, 2021). The coverage selection recommendations presented may not be relevant for other forage production regions with different climatic conditions. Historical monthly rainfall and average temperatures in Hidalgo County are presented in Figure 1.
Historical monthly precipitation (a) and average temperature (b) in Hidalgo, Texas, 1948–2020.
We focused on forage for hay use, as it is an important economic commodity produced in the region. According to Barnett and Robinson (Reference Barnett and Robinson2019), in 2018, the value of hay production was estimated to be equal to $5.8 million, and about 177,000 acres in the county were enrolled on the PRF program in 2021 (USDA RMA, 2021a). In terms of irrigation and organic practices, we considered a conventional, non-irrigated hay operation as these are common practices in the region. Although the results may only be pertinent to the selected grid and production practices, the proposed strategies can be easily replicated in other locations and forage production systems.
Historical interval precipitation indexes for Grid 7329 are provided in the Appendix and are summarized in Figure 2. Note that the distribution of the precipitation index for all index intervals is skewed to the right with higher precipitation index values recorded during most of the index intervals. The index intervals with the lowest median are July–August (74.3), March–April (78.4), and January–February (78.9). These three index intervals also have the highest standard deviations. On the other hand, August–September (48.8), September–October (48.8), and May–June (58.5) are the index intervals with the lowest standard deviations.
Distribution of Grid 7329 interval precipitation indexes, 1948–2019.

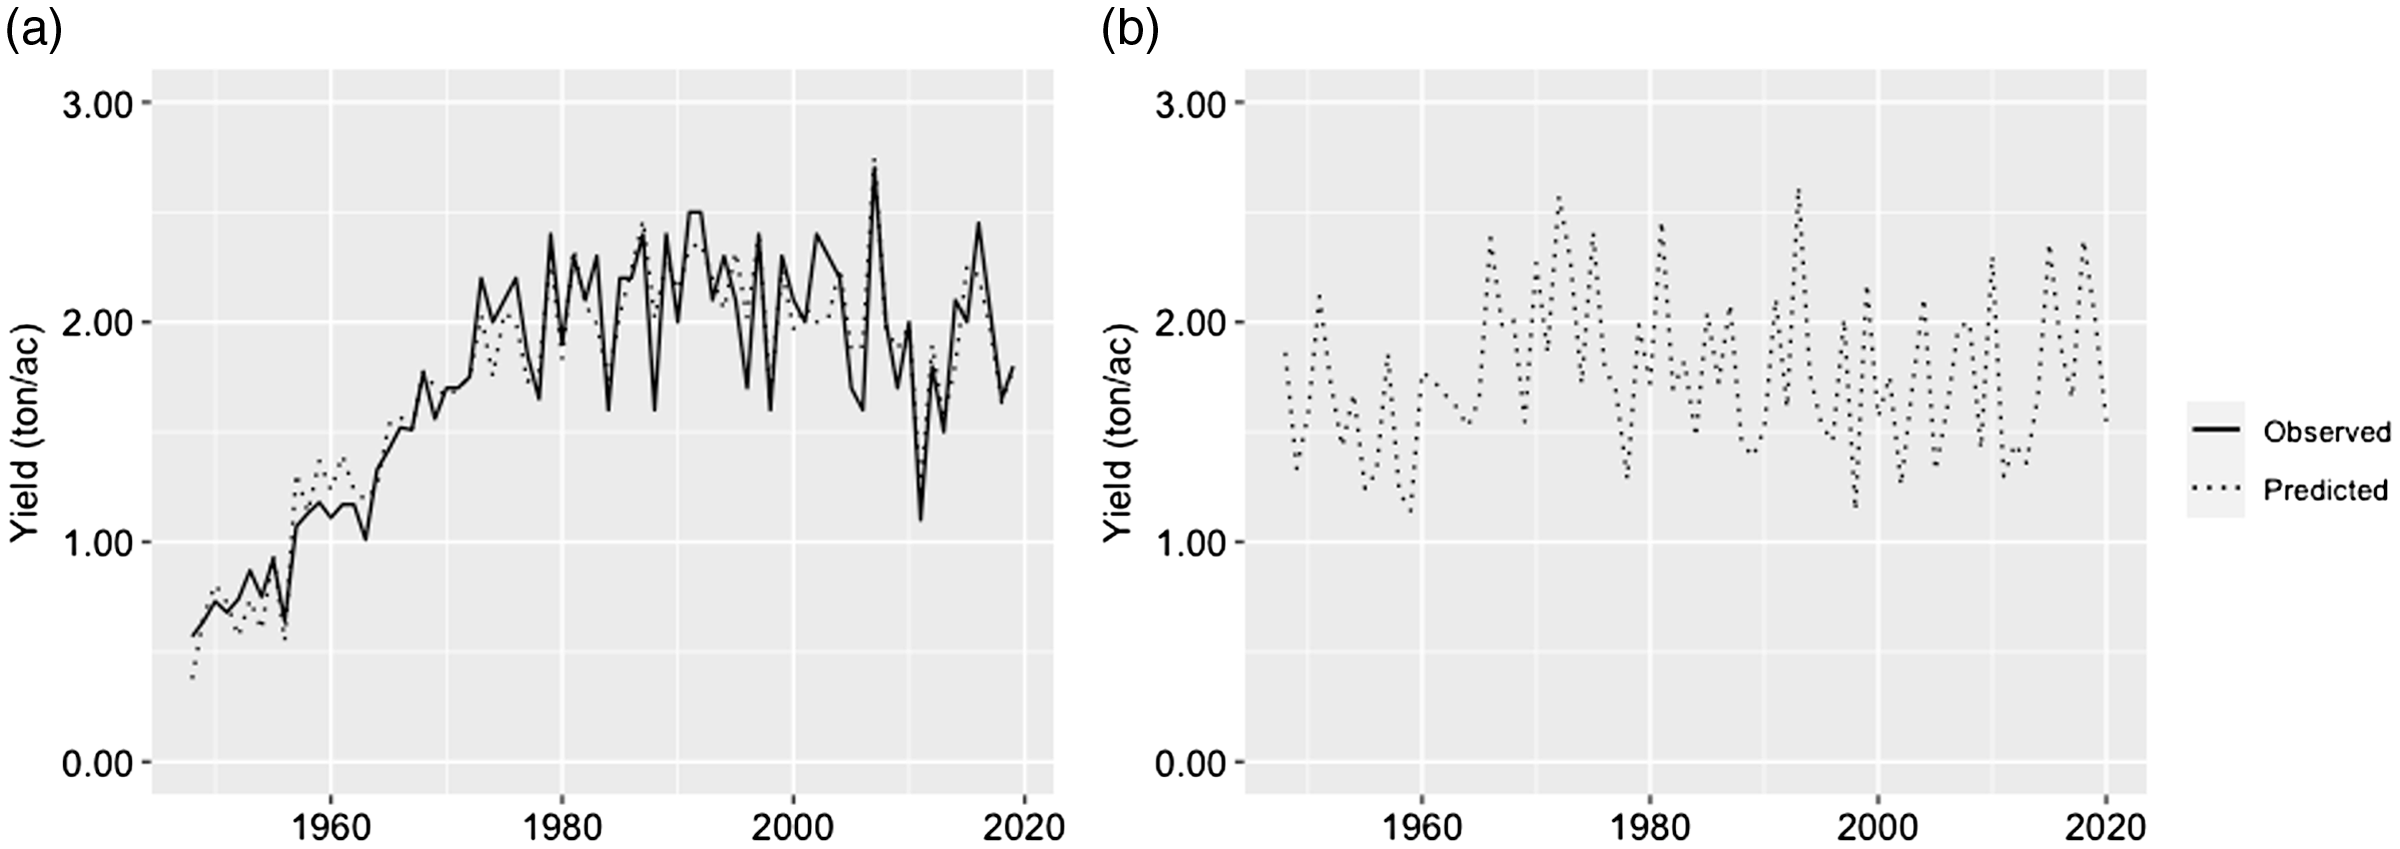
A practical and significant limitation to estimate farmers’ overall net returns described in equation (5) is the lack of historical grid-level production data. For illustration purposes, hay yield was calculated as a function of the recorded county monthly precipitation levels. Namely, Texas hay yields (i.e., 1948−2019) were regressed on the state monthly precipitation and a quadratic annual trend. Estimated coefficients along with observed historical county precipitation levels were used to predict the 2020-adjusted yields considered in the analysis. It was further assumed that Hidalgo hay yields are, on average, 21% higher than the state levels based on limited available data (USDA-NASS, 2021). Regression results suggest that precipitation levels in the months of March and from May through August have a positive significant effect on yields. Alternative, Diersen, Gurung, and Fausti (Reference Diersen, Gurung and Fausti2015) opted for recovering missing yields based on an observed correlated crop. No such crop was found for the grid or county in question. Hay yields (excluding alfalfa) reported by USDA-NASS (2021), and state and county precipitations from NOAA NCEI (2021), were used. Texas and Hidalgo observed and estimated hay yields are shown in Figure 3, and the estimated ordinary least squares coefficients are presented in the Appendix. The corresponding net farm sales associated with the estimated yields were calculated based on Texas A&M AgriLife Extension (2021) hay production enterprise budget for South Texas. Particularly, a hay price of $136.84/ton, a variable cost equal to $47.37/ton, and a fixed cost of $147.11/ac were used to estimate the expected returns and cost of production. In practice, forage sale prices and cost of production could also correlate with observed precipitation levels and be affected by other production and market conditions.
Historical Texas hay yield (a) and 2020-adjusted hay yields for Hidalgo (b).
The proposed models were used to identify the optimal set of parameters using 2020 actuarial data, estimated hay yields and past interval precipitation indexes (i.e., 1948–2019, Appendix). Expected net returns for all selection strategies were evaluated in the range of $24.00 to $28.00 per acre. The estimated risk-efficient frontiers for each model along with their corresponding optimal parameter levels are shown in Figure 4. For all three coverage selection strategies, the associated risk increased with the expected net return, making higher expected returns more variable. Also, the number of index intervals and the distribution of the percent of value were adjusted based on target expected net return and risk level. In terms of optimal coverage level and productivity factor, a 90% coverage level and productivity factors in the upper range shaped the three efficient frontiers.
Grid 7329 efficient frontier, percent of value, coverage level, and productivity factor for the mean-variance (a), Value-at-Risk (b), and shortfall (c) selection strategies.

In the case of the mean-variance model, the standard deviation of the lowest expected net return was $26.34/ac, while the standard deviation of the highest expected net return was $35.35/ac. For instance, risk exposure was mitigated by employing a diversified combination of index intervals consisting of four intervals for most of the efficient curve, but the number of index intervals reduced to three at relatively higher expected net returns. For the mean-variance model, the efficient mean-variance frontier was primarily formed by the January–February, March–April, May–June, July–August, and September–October intervals. Particularly, the percent of value assigned to the March–April and July–August increased with the expected net return, while the percent of value associated with the May–June and September–October intervals decreased as higher expected net returns were targeted. It was also observed that the optimal productivity factor increased with the expected net return, reaching the maximum productivity factor of 150% at an expected net return of $24.50/ac.
For the Value-at-Risk model, we considered the case where the goal was to select the combination of coverage parameters that minimizes the probability of obtaining a net return below the first decile (i.e., α = 0.10). The empirical distribution function of the net returns was estimated using the historical interval precipitation indexes and the estimated 2020-adjusted yields. As expected, VaR α increased as higher net returns were considered. For instance, the lowest expected net return (i.e., $24.00/ac) was associated with a VaR α equal to $22.34/ac. Thus, it is anticipated to obtain a net return higher than $1.66/ac with a 90% confidence level. Conversely, at the highest expected net return (i.e., $28.00/ac), 10% of the times the observed net return is expected to be less than or equal to −$12.37/ac. Compared to the mean-variance results, up to five index intervals were considered along the risk-efficient frontier with most of the optimal combinations of parameters including four index intervals. In general, March–April, May–June, July–August, and November–December were the index intervals with the higher percent of value. Additionally, the optimal productivity factor for the Value-at-Risk coverage selection strategy fluctuated between 145% and 150%.
As in the Value-at-Risk application, an α = 0.10 was considered in the shortfall illustration. The shortfall value ranged between $39.68/ac and $52.25/ac. Relatively smaller q α values were observed for all expected net returns compared to the counterpart quantiles obtained in the Value-at-Risk model. For instance, the q α values of the shortfall model were, on average, 83% smaller than those obtained in the Value-at-Risk. Like the other coverage selection strategies, the shortfall efficient frontier also consisted mainly of four index intervals. For instance, the March–April and October–November intervals were considered for most of the target expected net returns. Other index intervals included in the solution were January–February, May–June, June–July, July–August, August–September, and November–December. For the expected net returns evaluated, the optimal productivity factor in the shortfall model increased from 141% at the lowest net return to 150% for net expected returns higher than $25.83/ac.
Based on the above coverage selection results, it seems to be reasonable that policyholders in Grid 7329 choose at least four index intervals, a coverage level of 90% and a relatively high productivity factor, since these parameter levels were common in the optimal solution of the three proposed models. Also, the suggested parameter selections tended to provide coverage for a continuous period. Particularly, the March–April, May–June, and July–August intervals were frequently chosen. These are the same months that were found to be significant predictors of yield (Appendix). On average, a combined percent of value of 88.15%, 51.64%, and 66.08% were assigned to these three index intervals in the mean-variance, Value-at-Risk, and shortfall models, respectively.
Precipitation scenarios
The proposed selection methods were illustrated under three precipitation scenarios. The first scenario consisted of the observed 2020 precipitation levels for Hidalgo County (NOAA NCEI, 2021). Hence, the 2020 scenario represents the actual performance of the estimated coverage selections. The second scenario considered a rainy year (i.e., wet scenario) and the third scenario exemplified limited rainfall conditions (i.e., dry scenario). The annual distribution of precipitation for the wet and dry scenarios consisted of the monthly precipitation levels recorded for the years with the highest (i.e., 1967) and lowest (i.e., 2011) precipitation in Hidalgo County (NOAA NCEI, 2021). Thus, the wet and dry scenarios represent inordinate but potential precipitation outcomes. Forage yields were projected based on monthly precipitation as described in the preceding section. In 1967, a total of 41.69 inches were recorded, while 10.32 inches were registered in 2011 and 26.77 inches in 2020. The optimal coverage selections shown in Figure 4 were evaluated using the reported interval precipitation indexes and estimated forage yields for Grid 7329 for the years 2020, 1967, and 2011 (Appendix).
The net returns associated with the mean-variance, Value-at-Risk, and shortfall coverage selection strategies under the three precipitation scenarios along with the corresponding net farm sales without PRF indemnity payments are presented in Figure 5. Net farm sales were positively related to the overall precipitation levels. Namely, net hay cash receipts for the dry, 2020, and wet scenarios were −$30.99/ac, −$8.62/ac, and $29.40/ac, respectively. Note that without participating in the PRF program, net returns for 2020 and under dry conditions would have been negative. In terms of risk, net farm sales alone have an estimated standard deviation equal to $32.28/ac, a VaR α of $39.74/ac, and a shortfall value equal to $47.93/ac. Overall, the three coverage selection strategies were found to be effective reducing risk exposure and increasing net returns. In fact, when participating in the PRF program, the net returns for the mean-variance, Value-at-Risk, and shortfall models in each scenario were higher than the corresponding hay production returns without PRF coverage. Furthermore, the risk of most of the net returns targeted through the PRF program was less than the risk of the net cash receipts.
Performance of the mean-variance (a), Value-at-Risk (b), and shortfall (c) models under different precipitation scenarios. Net hay farm sales under the 2020, wet, and dry scenarios are denoted by  ,
,  , and
, and  , respectively.
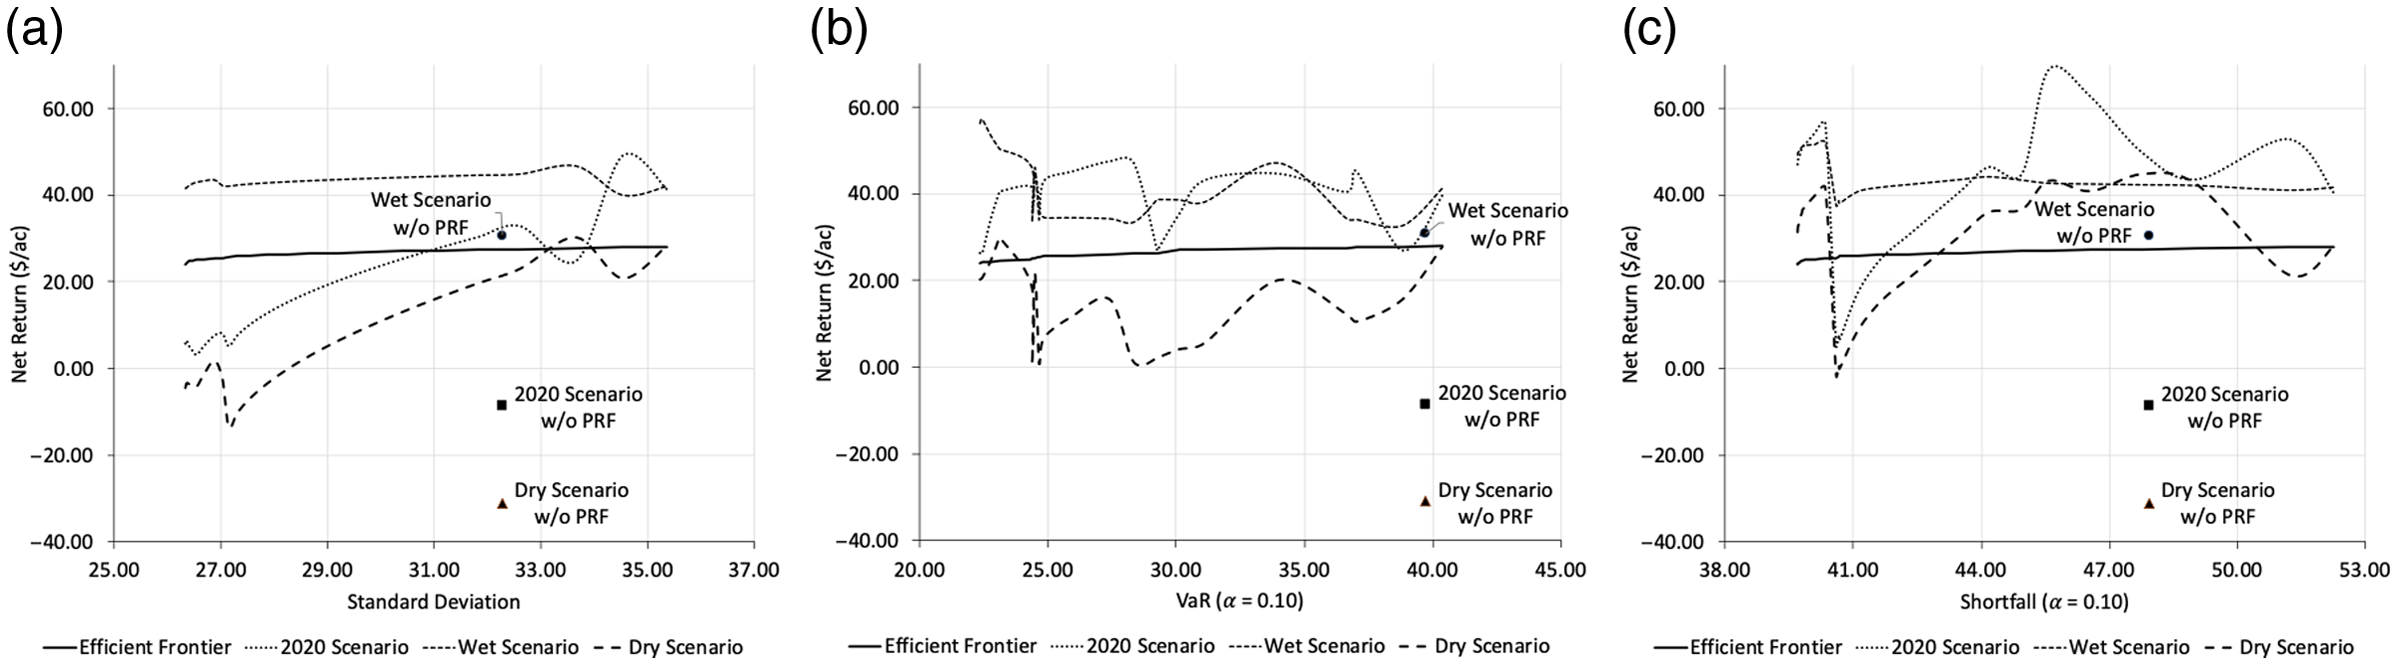
For the mean-variance strategy, overall lower net returns were observed under the dry scenario followed by the 2020 and wet scenarios. In the case of the 2020 scenario, resulting net returns ranged between $3.20/ac and $49.12/ac. Net returns below the efficient frontier were observed for expected net returns equal or less than $27.17/ac ($31.09/ac standard deviation). In the dry scenario, negative net returns were obtained when expected net returns less than $26.33/ac were targeted. Conversely, all observed net returns were above the mean-variance efficient frontier in the wet scenario.
Some differences were found when the Value-at-Risk strategy was adopted. Particularly, the observed net returns in the 2020 scenario were higher than the corresponding values obtained in the mean-variance strategy, except for those expected net returns greater than $27.83/ac. Also, most of the net returns in the 2020 scenario were above the efficient frontier. On the other hand, net returns in the wet scenario tended to be lower than the counterpart returns obtained under the mean-variance strategy. For the dry scenario, most net returns were less than the corresponding expected values, but observed returns were all positive.
In the case of the shortfall coverage selection strategy, relatively higher net returns were observed compared to the returns obtained with the mean-variance and Value-at-Risk strategies for all three scenarios. Also, the shortfall strategy was the only case in which the resulting net returns of the dry scenario were greater or equal than the returns of the wet scenario. Specifically, this occurred when the expected net returns ranged between $27.17/ac and $27.67/ac. In this range, also the highest net returns for the 2020 scenario were observed among the three coverage selection strategies. Particularly, a net return equal to $68.97/ac was obtained under the shortfall strategy when an expected net return of $27.17/ac was targeted.
Summary and conclusions
This study contributes to mitigate the production risk associated with precipitation uncertainty by providing comprehensive strategies to effectively participate in the PRF insurance program. This paper represents one of the first attempts to include all the PRF decision parameters and program restrictions in the coverage selection process. The three proposed selection methods highlight the underlying relationships between expected revenue, risk, and choice of the coverage parameters. Different measures of risk are considered in each of the selection strategies. For instance, risk is defined in terms of the variability of the resulting net returns in the mean-variance approach. Conversely, in the Value-at-Risk approach risk is represented by the probability that net returns drop below a specific level, and by the expected value of the net returns below a threshold in the shortfall method.
Given the discrete nature of some of the decision parameters and existing coverage selection constraints, finding the optimal level of the different parameters of the PRF program requires solving a mixed integer nonlinear programming problem. A heuristic estimation method is presented to reduce the number of possible parameter combinations to be considered during the optimization process. By following this approach, we showed that the proposed selection models can be represented as simple conditional linear and quadratic programming problems, while imposing all the program restrictions.
A practical limitation to implement the proposed coverage selection strategies may be the lack of historical forage production data. In the absence of grid-level production information, forage yields could be approximated using county level data or imputed based on available precipitation levels or existing correlated crops. Deviations from actual production could aggravate the inherent basis risk associated with the PRF program payouts. Additional research is needed to develop consistent grid yield estimators and to evaluate their effects on basis risk.
A grid in South Texas was used to illustrate the coverage selection decisions under the three strategies considered. Although the selection methods presented in this study can be replicated in any available grid, the empirical results discussed may be specific to the geographical area considered given the diverse and large number of participating grids in the country. The optimal set of parameters depicted similar trends along the risk-efficient frontiers for all coverage selection strategies. Particularly, between three and five index intervals were selected providing continuous coverage from March to August. Precipitation in this period was positively correlated with hay yields. Also, a 90% coverage level and productivity factors in the upper range were observed in the three selection strategies. Furthermore, the identified risk-efficient solutions were illustrated under actual rainfall levels in 2020, and in rainy and dry precipitation scenarios. It was found that participating in the PRF program could be an effective strategy to mitigate production risk and to increase farm income. For instance, net hay sales alone for all precipitation scenarios were lower and riskier than the corresponding returns obtained in conjunction with the PRF program.
Compared to traditional crop insurance programs, limited public and private resources exist to support PRF policyholders with their decision-making process at the grid level. For example, the available PRF USDA decision support tool (USDA RMA, 2021b) evaluates the potential outcome of specific coverage selections, but it provides no guidelines about how to tailor the selection of the program parameters to meet the revenue and risk expectations of farmers. This study provides the foundations to develop inclusive decision support tools for farmers. The methods proposed can be easily adapted into an interactive platform to simplify policyholders’ assessment of both expected net returns and corresponding risk associated with their coverage selection decisions. From a practical perspective, the strategies discussed in the paper have the advantage of providing three complementary risk measures, a reasonable computer processing time to complete the optimization task, and most of the input data required in the models are publicly available. An increase in the availability of educational resources capable of illustrating the actual economic and risk management implications of the PRF insurance could improve the participation rate in the program. Additionally, all the proposed coverage selection strategies can be extended to analyze the decision process of other Rainfall Index-based insurance programs such as the Apiculture and Annual Forage insurance programs.
Author contributions
Conceptualization, S.D.Z.; Methodology, S.D.Z.; Formal Analysis, S.D.Z. and J.M.G.; Data Curation, S.D.Z. and J.M.G.; Writing – Original Draft, S.D.Z. and J.M.G., Writing – Review and Editing, S.D.Z..; Supervision, S.D.Z.; Funding Acquisition, S.D.Z.
Financial support
This research received no specific grant from any funding agency, commercial, or not-for-profit sectors.
Conflict of interest
None.
Data availability statement
The data used in this study is publicly available at: https://prodwebnlb.rma.usda.gov/apps/prf. The specific dataset considered is provided in the Appendix.
Appendix
Grid 7329 interval precipitation indexes and estimated hay yields, 2020

1 Hay yield represents the expected yield for 2020 based on historical precipitation levels.
2 Statistic estimated using 1948–2019 data.
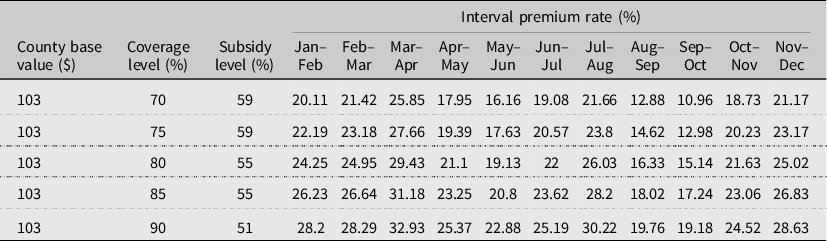
Grid 7329 actuarial data for non-irrigated, conventional haying, 2020
Estimated Texas hay yield coefficients
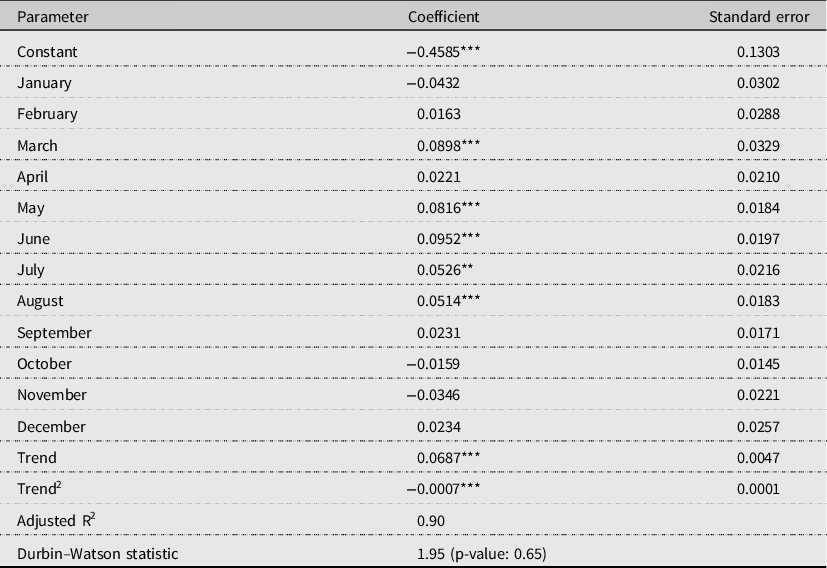
** Significance levels of 0.05.
*** Significance levels of 0.01.


 Open access

