

1. Introduction
Alkaline igneous rock-related gold-silver telluride deposits are among the world’s leading sources of gold and include Ladolam, Papua New Guinea (680 t Au; Moyle et al. Reference Moyle, Doyle, Hoogvliet and Ware1990), Emperor, Fiji (255 t Au; G. Begg, unpub. PhD thesis, Monash Univ., 1996), Porgera, Papua New Guinea (340t Au; Richards, Reference Richards and Thompson1995), and Cripple Creek deposit, Colorado (595 t Au; Kelley & Luddington, Reference Kelley and Ludington2002). In the United States, alkaline igneous rock-related gold deposits of Cretaceous-Tertiary age occur in a belt of rocks in the United States Cordillera that extends from Montana to Texas (Mutschler et al. Reference Mutschler, Griffen, Stevens and Shannon1985). Gold tellurides occur in several of these deposits in the Black Hills, South Dakota (e.g. Paterson et al. Reference Paterson, Groff and Longstaffe1989), the Colorado Mineral Belt (Kelly & Goddard, Reference Kelly and Goddard1969), Cripple Creek, Colorado (e.g. Thompson et al. Reference Thompson, Trippel and Dwelley1985; Kelley & Luddington, Reference Kelley and Ludington2002), and the central Montana alkalic province (e.g. Giles, Reference Giles and Babcock1983; Childs & Foster, Reference Childs and Foster1993; Foster & Childs, Reference Foster and Childs1993).
Despite the presence of > 400 t Au (produced and reserves) in gold telluride deposits in the central Montana alkalic province (CMAP), evaluations of their geological setting, mineralogy, and geochemistry are restricted to short reviews by Giles (Reference Giles and Babcock1983), Foster and Childs (Reference Foster and Childs1993), Richards (Reference Richards and Thompson1995), Thieben and Spry (Reference Thieben, Spry, Pašava, Kříbek and Žák1995), Kelley and Spry (Reference Kelley and Spry2016), Gammons et al. (Reference Gammons, Korzeb, Hargrave, Metesh and Gammons2020a) and Kelley et al. (Reference Kelley, Spry, McLemore, Fey and Anderson2020). Giles (Reference Giles and Babcock1983) discussed the general geological relations between alkalic volcanism and gold mineralisation in the CMAP and identified three main types of gold deposit: 1. Intrusion-hosted disseminated auriferous pyrite; 2. Stockworks and brecciated veins of auriferous quartz-pyrite at intrusive contacts; and 3. Limestone- and dolomite-hosted disseminated replacement deposits adjacent to porphyry contacts. He pointed out the presence of tellurides in several deposits. In describing the geological setting of lode gold systems in Montana, Foster and Childs (Reference Foster and Childs1993) gave brief descriptions of several gold deposits, including some that contained tellurides: Beal, Golden Sunlight, York, New World, Gies, Giltedge, Kendall, Spotted Horse, and Zortman-Landusky. They proposed that the deposits were strongly influenced by their structural setting and that they formed as a result of the interaction between structural, magmatic, and sedimentary depositional processes.
Richards (Reference Richards and Thompson1995) included a brief summary of the CMAP in a worldwide review of alkalic-type epithermal gold deposits. His examination included a discussion of the geological and geochemical setting of the Zortman-Landusky, Gies, and Golden Sunlight deposits. Further reviews of worldwide alkaline igneous rock-related gold deposits by Kelley and Spry (Reference Kelley and Spry2016) and Kelley et al. (Reference Kelley, Spry, McLemore, Fey and Anderson2020) also incorporated some deposits in the CMAP.
In addition to the aforementioned regional descriptions of gold telluride deposits in the CMAP, summaries of the geological setting of gold deposits (including gold telluride deposits) in the Judith Mountains were conducted by Weed and Pirsson (Reference Weed and Pirsson1898), R.A. Forrest (unpub. MS thesis, Montana College of Mineral Science and Technology, 1971), Woodward and Giles (Reference Woodward, Giles and Hunter1993), and Woodward (Reference Woodward1995). Recently, Olinger et al. (Reference Olinger, Andersen, Griffis, Mercer and Smith2024) analysed alkalic igneous rocks in the northern part of the Judith Mountains near these epithermal gold deposits.
The present paper expands on the limited reviews of Richards (Reference Richards and Thompson1995), Thieben and Spry (Reference Thieben, Spry, Pašava, Kříbek and Žák1995), Kelley and Spry (Reference Kelley and Spry2016), and Kelley et al. (Reference Kelley, Spry, McLemore, Fey and Anderson2020) by introducing new geological, mineralogical, and geochemical data (major element compositions, fluid inclusions, Pb and S isotopes) for alkaline igneous rock-related Au-Ag±Bi telluride deposits from central Montana. These data complement earlier studies by us on the Gies (Zhang & Spry, Reference Zhang, Spry, Baker and Berg1991; Reference Zhang and Spry1994a,b; Spry & Thieben, Reference Spry and Thieben1996; Bindi et al. Reference Bindi, Spry and Pratesi2006), Mayflower (Spry & Thieben, Reference Spry and Thieben1996) and Golden Sunlight Au-Ag telluride deposits (Spry et al. Reference Spry, Thieben and Stanley1999, Reference Spry, Foster, Truckle and Chadwick1997). The aim of the contribution is to place limits on physicochemical conditions of ore formation and to provide improved exploration guides for alkaline igneous rock-related gold telluride deposits in Montana and elsewhere. The Golden Sunlight, Mayflower, Zortman-Landusky, and Kendall deposits are evaluated here, along with a group of small gold-telluride deposits (Gies, Maginnis, Spotted Horse, Giltedge, Kentucky Favourite) in the Judith Mountains. Sulphur isotope compositions obtained herein of some non-telluride bearing deposits in the Judith Mountains (American Flag, Black Bull, Butcher Knife, Gold Hill, Great Falls and Judith, Iron Chancellor, Justice, Matthews and Last Chance, Silver Bullion), which occur in close proximity to gold telluride deposits, are included in this study for comparative purposes. Tellurides have been reported in other deposits in Montana (e.g. Beal Au-Bi, New World Au-Cu-Ag, Virginia City Au-Ag, Stillwater Pt-Pd) but are not included here because they are not spatially associated with alkaline igneous rocks in the CMAP (Cabri et al. Reference Cabri, Rowland, Gilles LaFlamme and Stewart1979; Hastings & Harrold, Reference Hastings, Harrold, Schafer, Cooper and Vikre1988; Johnson & Meinert, Reference Johnson and Meinert1994; Gammons et al. Reference Gammons, Mosolf and Poulson2019).
It should be noted here that although alkaline igneous rock-related gold telluride deposits are mainly mined for gold and silver, they are also potential sources of tellurium, which is considered to be a critical element for use in the green energy transition (McNulty & Jowitt, Reference McNulty and Jowitt2022).
2. Regional geology
The regional geology of Montana has been described by Foster and Childs (Reference Foster and Childs1993) and Lageson et al. (Reference Lageson, Kalakay, Foster, Metesh and Vuke2020) and is summarised here. Early to Late Archaean greenschists and granulites occur in south-central Montana and are overlain by a thick sequence of Middle Proterozoic to Cenozoic carbonate and clastic sedimentary rocks. Igneous rocks range in age from Archaean to Pleistocene. Foster and Childs (Reference Foster and Childs1993) informally divided Montana into the Basement, Fold-Thrust and Plains Tectonic Provinces, based on differences in deformation styles. This is a modification of the terminology originally proposed by McMannis (Reference McMannis1965), who first identified four provinces. The Basement Province occurs in southwest Montana, consists of Archaean crystalline basement and Palaeozoic sediments, and is characterised by thick-skinned foreland-style deformation. The Fold-Thrust Province occupies western Montana and consists of Proterozoic and younger sedimentary rocks, exhibiting thin-skinned, thrust belt-style deformation. The Plains Province is composed of Mesozoic and Cenozoic sedimentary rocks and is found in central and eastern Montana, where broad folds and basins were produced along reactivated basement structures.
Pirsson (Reference Pirsson1905) first identified the alkalic nature and petrologic similarities of multiple intrusive complexes of Cretaceous to Eocene age throughout central Montana and was the first to refer to this region as the ‘central Montana alkalic province’. Although Pirsson suggested that the south end of the CMAP was at the southern end of the Big Belt Mountains, Larsen (Reference Larsen1940), in recognising alkalic rocks in several mountain ranges in Montana, extended the province from Yellowstone Park to the Canadian border. However, due to the presence of alkaline igneous rocks in association with the Golden Sunlight and Mayflower gold-silver telluride deposits near Whitehall, Montana, the current contribution reinforces the concept of Foster and Childs (Reference Foster and Childs1993) that the CMAP extends further to the southwest than that proposed by Larsen (Reference Larsen1940).
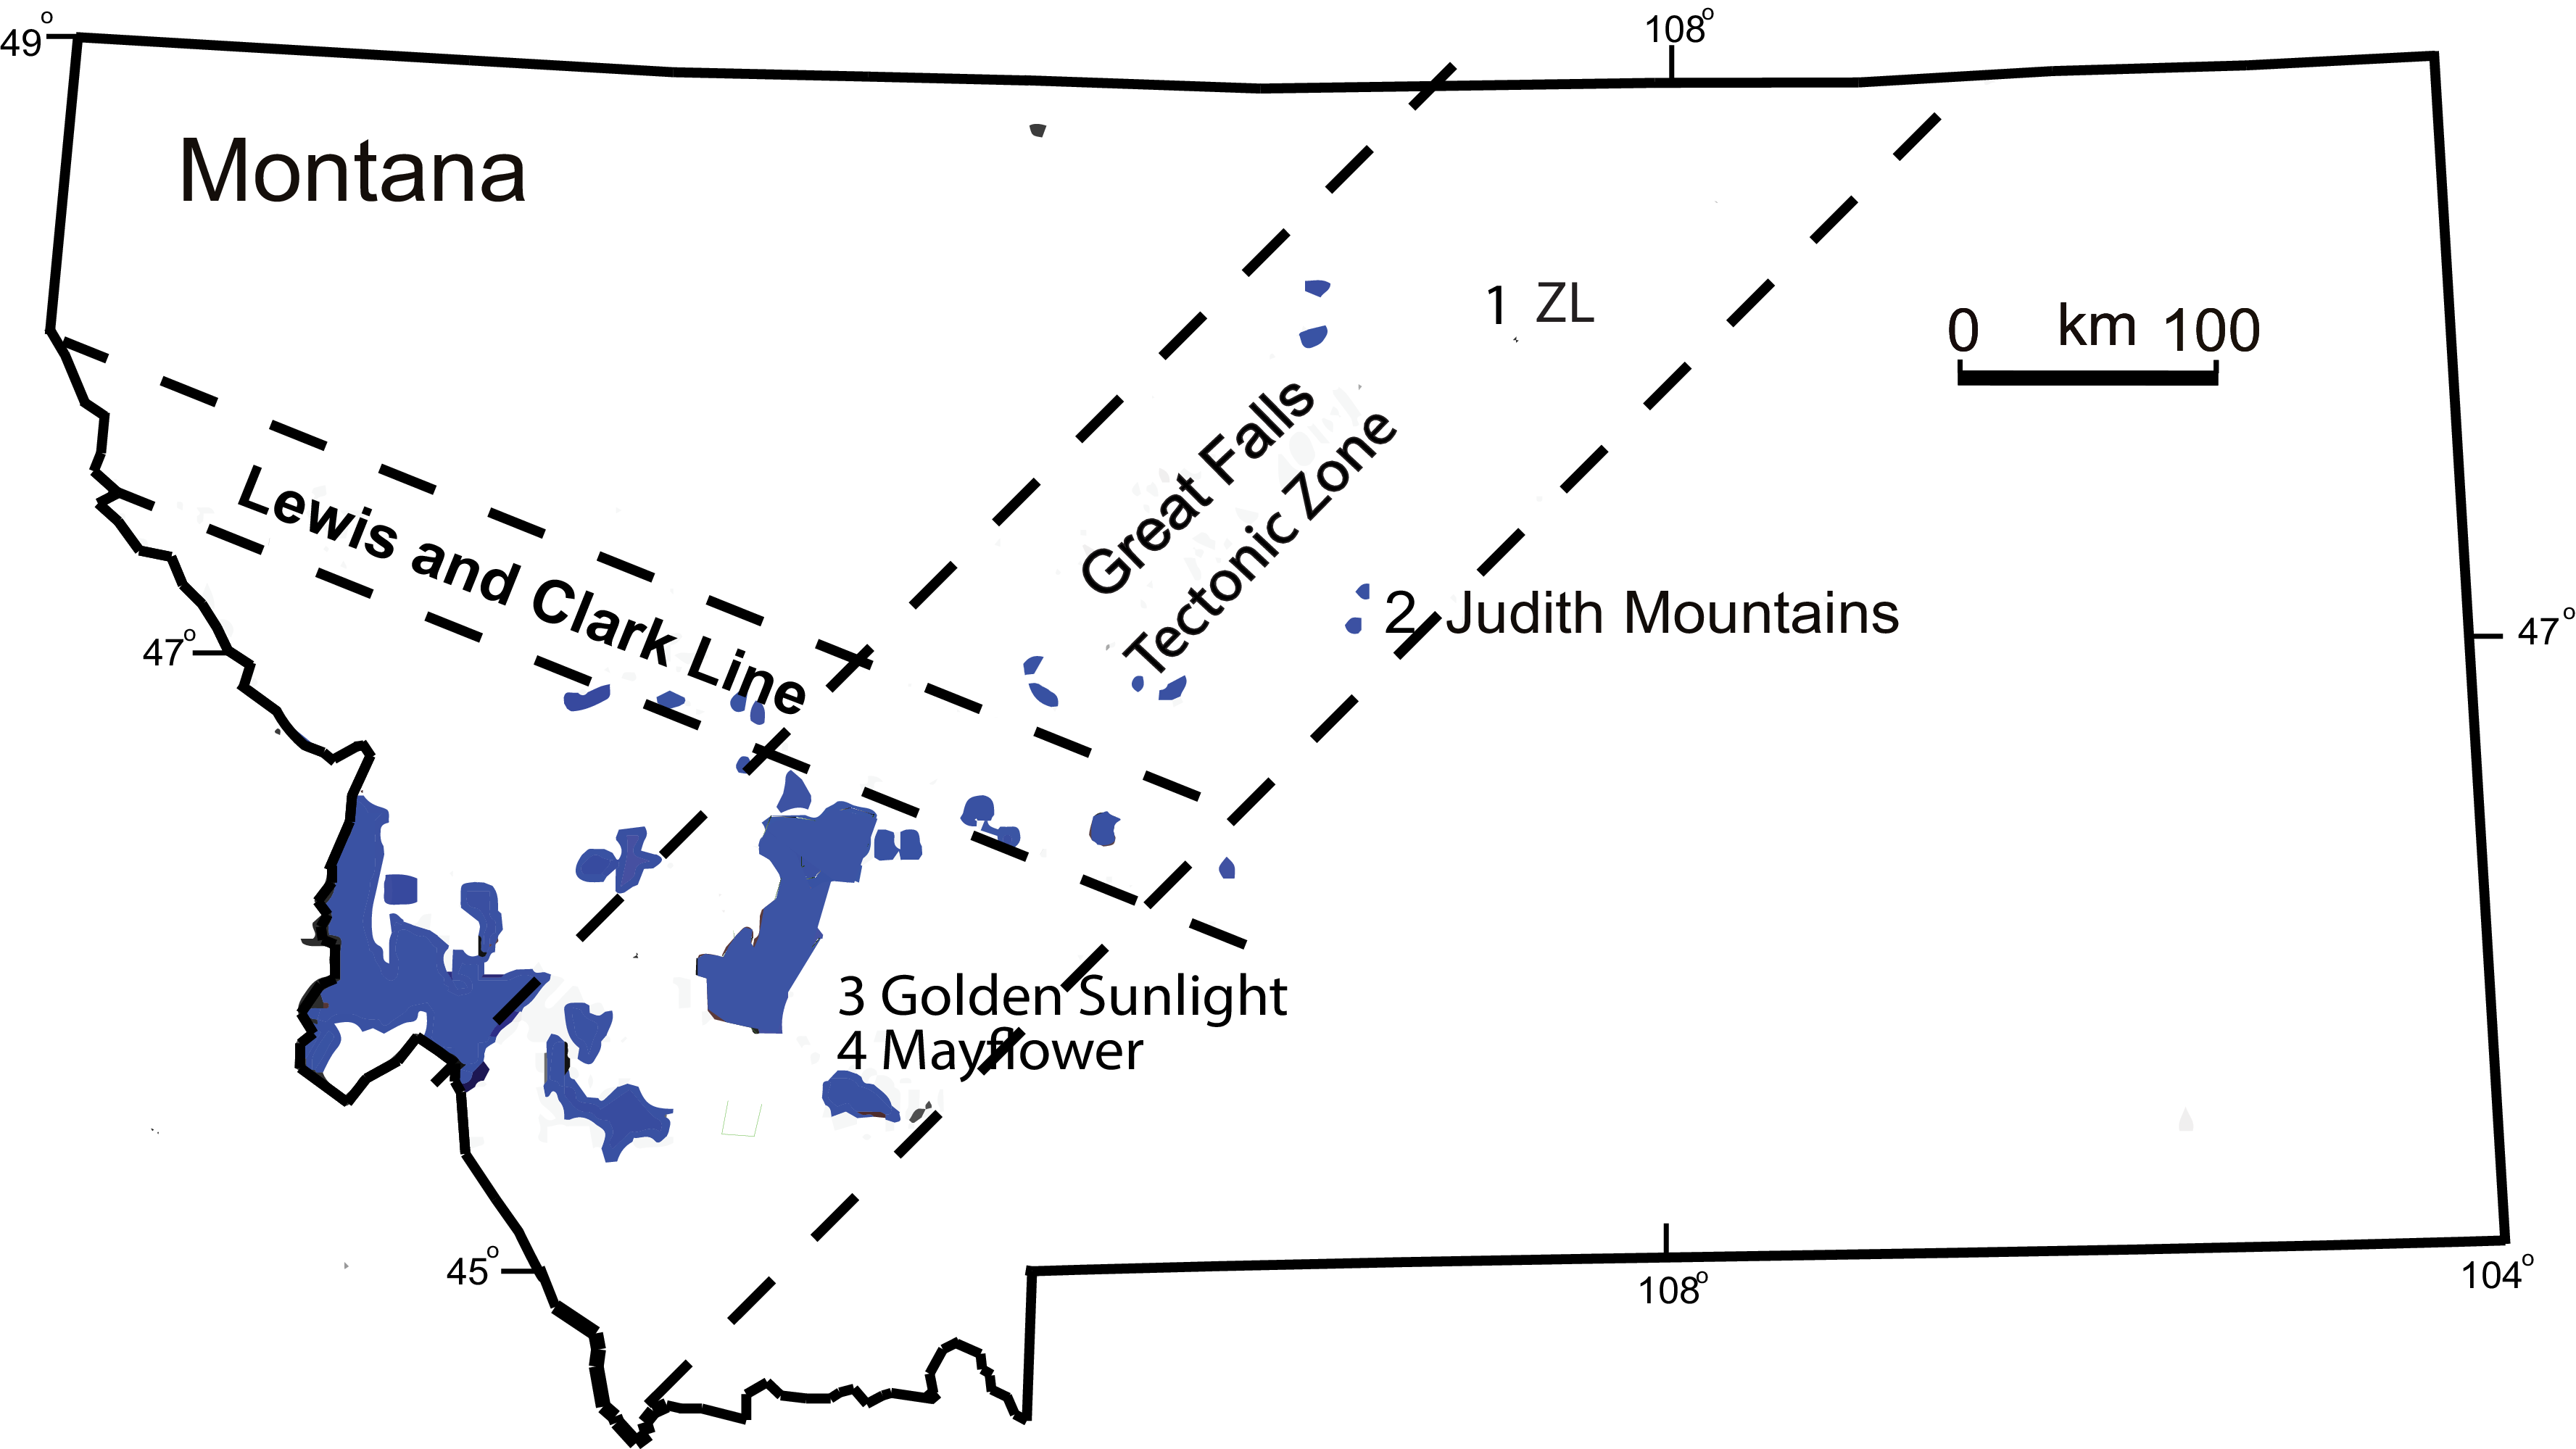
The orogenic and tectonic evolution of Montana is complex and is described in detail by Lageson et al. (Reference Lageson, Kalakay, Foster, Metesh and Vuke2020). A fundamental northeast-trending structural zone that extends from southwestern Idaho to Saskatchewan is known as the Great Falls Tectonic Zone (GFTZ) in Montana (O’Neill & Lopez, Reference O’Neill and Lopez1985) and the trans-Challis fault system in Idaho (Kiilsgaard & Lewis, Reference Kiilsgaard and Lewis1985). Lageson et al. (Reference Lageson, Kalakay, Foster, Metesh and Vuke2020) described the SW extension of the GFTZ as being the Big Sky Orogen. It should be noted that the GFTZ hosts all known gold-telluride deposits in Montana (Fig. 1), and that it essentially parallels another major gold-telluride-bearing structural zone along the eastern edge of the U.S. Cordillera, the Colorado Mineral Belt. Like the GFTZ, another major tectonic feature in Montana, the NW-SE trending Lewis and Clark Line or Montana Lineament, has been reactivated and mineralised since the Precambrian (Foster & Childs, Reference Foster and Childs1993). Periodic episodes of igneous activity, especially during the Late Cretaceous to Eocene, were localised along these two intersecting zones in the three tectonic provinces identified by Foster and Childs (Reference Foster and Childs1993).
Location of gold telluride deposits in Montana. 1. ZL = Zortman-Landusky; 2. Judith Mountain deposits (Gies, Spotted Horse, Maginnis, Giltedge, Kentucky Favourite); 3. Golden Sunlight district; 4. Mayflower. Late Cretaceous to Tertiary intrusions are shown in blue. Note the location of the deposits relative to the Great Falls Tectonic Zone and the tectonic Lewis and Clark Line is indicated (modified after Vuke et al. Reference Vuke, Porter, Lonn and Lopez2009; Gammons et al. Reference Gammons, Gnanou, Odt and Poulson2020b).
The plate tectonic setting of the CMAP and the GFTZ is controversial. O’Neill and Lopez (Reference O’Neill and Lopez1985) proposed that the GFTZ may form the contact between Precambrian crustal terranes, whereas Mutschler et al. (Reference Mutschler, Johnson, Mooney, Baker and Berg1991) suggested that the GFTZ may have been a transtensional zone or a releasing bend between transcurrent faults during the Cretaceous. More recently, Boerner et al. (Reference Boerner, Craven, Kurtz, Ross and Jones1998) discounted the idea that the GFTZ is a Proterozoic age suture between the Archaean Hearn and Wyoming provinces but represents a reactivated Archaean intracontinental shear zone. K-Ar and Rb-Sr ages of approximately 1.6 Ga for the GFTZ were reported by, for example, Giletti (Reference Giletti1966), but older zircon U-Pb ages of 1.87-1.86 Ga for diorite in the GFTZ suggest that the zone may have been reactivated, with Mueller et al. (Reference Mueller, Heatherington, Kelly, Wooden and Mogk2002) identifying Palaeoproterozoic crust within the GFTZ. Regardless of the origin of the GFTZ, the interpretation of magnetic and gravity data by Kleinkopf (Reference Kleinkopf, Baker and Berg1991) led to the conclusion that fractures in the Precambrian basement in the GFTZ influenced the emplacement of the alkalic intrusive complexes. Heat-flow modelling and seismic tomography studies by Eggler and Furlong (Reference Eggler, Furlong, Baker and Berg1991) suggested that a thick Precambrian lithosphere or mantle keel underlies central Montana and probably served as an impediment to low-angle SW to NE subduction of the Farallon Plate. Eggler et al. (Reference Eggler, Meen, Welt, Dudas, Furlong, McCallum and Carlson1988) and Eggler and Furlong (Reference Eggler, Furlong, Baker and Berg1991) proposed a back-arc advection model for the origin of CMAP in which a steeply dipping subduction zone produces circulation of the asthenosphere and magma generation from a partially melted lithosphere. As was discussed by Baker (Reference Baker1992), the back-arc advection model of Eggler et al. (Reference Eggler, Meen, Welt, Dudas, Furlong, McCallum and Carlson1988) is in contrast to that proposed by Bird (Reference Bird1998), who invoked a flat-slab subduction model for the Farallon Plate. Lageson et al. (Reference Lageson, Kalakay, Foster, Metesh and Vuke2020), more recently, while invoking the importance of the Farallon Plate, suggested that it decoupled from the North American Plate and was associated with SW rollback and its removal beneath the Rocky Mountain foreland.
3. Analytical methods
Samples in this study were collected from underground localities, drill core, operating pits, and surface dumps and examined using an Olympus dual reflected-transmitted light petrographic microscope, with selected samples being subjected to scanning electron microscope, electron microprobe and ion microprobe studies. Chemical compositions of native elements, tellurides, sulphides, and sulphosalts were obtained using an ARL-SEMQ electron microprobe. The standards used were pure metals (for Au, Ag, Te, Se, and Cu), AgBiS2 and Bi2S3 (Bi), Sb2S3 (Sb), As2S3 (As), ZnS (Zn), HgS (Hg) and Fe0.939S (Fe and S). Operating conditions included an accelerating voltage of 20 kV and sample currents of 20 nA. The ARL-SEMQ electron microprobe employed the PRSUPR data-reduction procedures (Donovan et al. Reference Donovan, Rivers and Armstrong1992). Scanning electron microscope studies were conducted on Hitachi S-2460N and JEOL JSM-35 instruments that possessed EDAX area mapping and back-scattered imaging capabilities.
Gold and arsenic contents of pyrite and marcasite were obtained using a Cameca MS-3f ion microprobe at Advanced Mineral Technology Laboratory (AMTEL), London, Ontario, Canada. Experimental parameters and operating conditions are given in Spry and Thieben (Reference Spry and Thieben2000). The measurements were done with a primary Cs+ beam source of about 50-55 nA at 14.5 keV in high-mass resolution mode with –180V offset to eliminate interference with 197FeAsS2.The primary ion beam diameter was 20 μm, and the depth of most analyses was, in general, up to 1.2 μm. Some ion sputtering to depths of 4 μm was done to evaluate whether gold and, if present, how much gold was distributed throughout the volume of pyrite grains. Calibration of Au and As was done by external standardisation using gold-implanted arsenopyrite (Chryssoulis et al. Reference Chryssoulis, Cabri and Lennard1989). A minimum detection limit of 150 ppb Au was obtained.
Fluid inclusion studies of quartz in samples from the Spotted Horse deposit were done on a Fluid Inc.-adapted U.S. Geological Survey gas flow heating/freezing stage calibrated with synthetic fluid inclusions at Iowa State University. The estimated accuracy is ± 0.1°C between -56.6 and 100 °C, and ±2°C at 374.1 °C. Reproducibility is within the estimated accuracy of the temperature determination.
Major element (SiO2, Al2O3, Fe2O3, CaO, MgO, Na2O, K2O, MnO, TiO2, P2O5, Cr2O3, LOI) compositions of igneous rocks from the Mayflower deposit and deposits in the Judith Mountains were determined by LiBO2 fusion and measured by ICP-AES techniques. Trace elements (Ba, Nb, Ni, Sc, Sr, Y, Zr) were obtained by LiBO2 fusion, where the sample was then dissolved in 5% nitric acid, and measured by ICP-MS techniques by Acme Analytical Laboratories. Standards used by Acme Analytical Laboratories are accurate to within ±5 μg/g for the trace elements and to within ±2 percent for major elements. Exceptions are for Ni, Nb and Sc, which are all below the limits of detection (20, 50, and 10 μg/g, respectively).
Samples for sulphur isotope analysis were either hand-picked or drilled with a Dremel tool and inspected under a binocular microscope to insure a purity of >95%. Sulphur isotope compositions were obtained from the Departments of Geology at Indiana University and the University of Georgia. At these locations, sulphide separates were converted to SO2 by combustion with V2O5, utilising the methods described by Yanagisawa and Sakai (Reference Yanagisawa and Sakai1983). Analyses were run on Finnigan Mat 252 mass spectrometers. The isotopic ratios are reported in the standard δ notation in per mil relative to Cañon Diablo troilite (VCDT). The precision of analysis was ±0.15 per mil at Indiana and ±0.20 per mil at Georgia based on replicate analysis of standards.
Lead isotope compositions of galena were measured at the University of Washington using the procedure of McCallum et al. (Reference McCallum, Thurber, O’Brien and Nelson1999). The process involves a progressive acid leaching procedure to remove any contamination on grain boundaries and fracture surfaces and to preferentially leach unsupported radiogenic Pb. Between two and six leaches were extracted from each sample, depending on sample size. Aliquots of each leach were prepared for isotopic composition and isotopic dilution measurements. Fifty to 100 ml of anion exchange resin (AG1X8 200 ± 400 mesh) was used for separation and purification of Pb. The isotopic measurements were obtained on a VG-Sector mass spectrometer. Isotopic measurements were made between 1150 and 1350 °C using static multicollection. Scans between masses 200 and 210 were made to check for interference peaks from organic compounds or BaPO2, 203Tl, and 205Tl. Multiple measurements of a standard (NBS-981) showed mass fractionation of 0.125% per amu (atomic mass unit). All analyses were corrected for mass fractionation and blank contribution. The internal precision of the isotopic measurements is less than <0.1% based on multiple analyses of NBS981 and an internal lab sulphide standard (4750E-ST).
4. Geological setting of Au-Ag telluride deposits
4.a. Golden Sunlight district, Whitehall
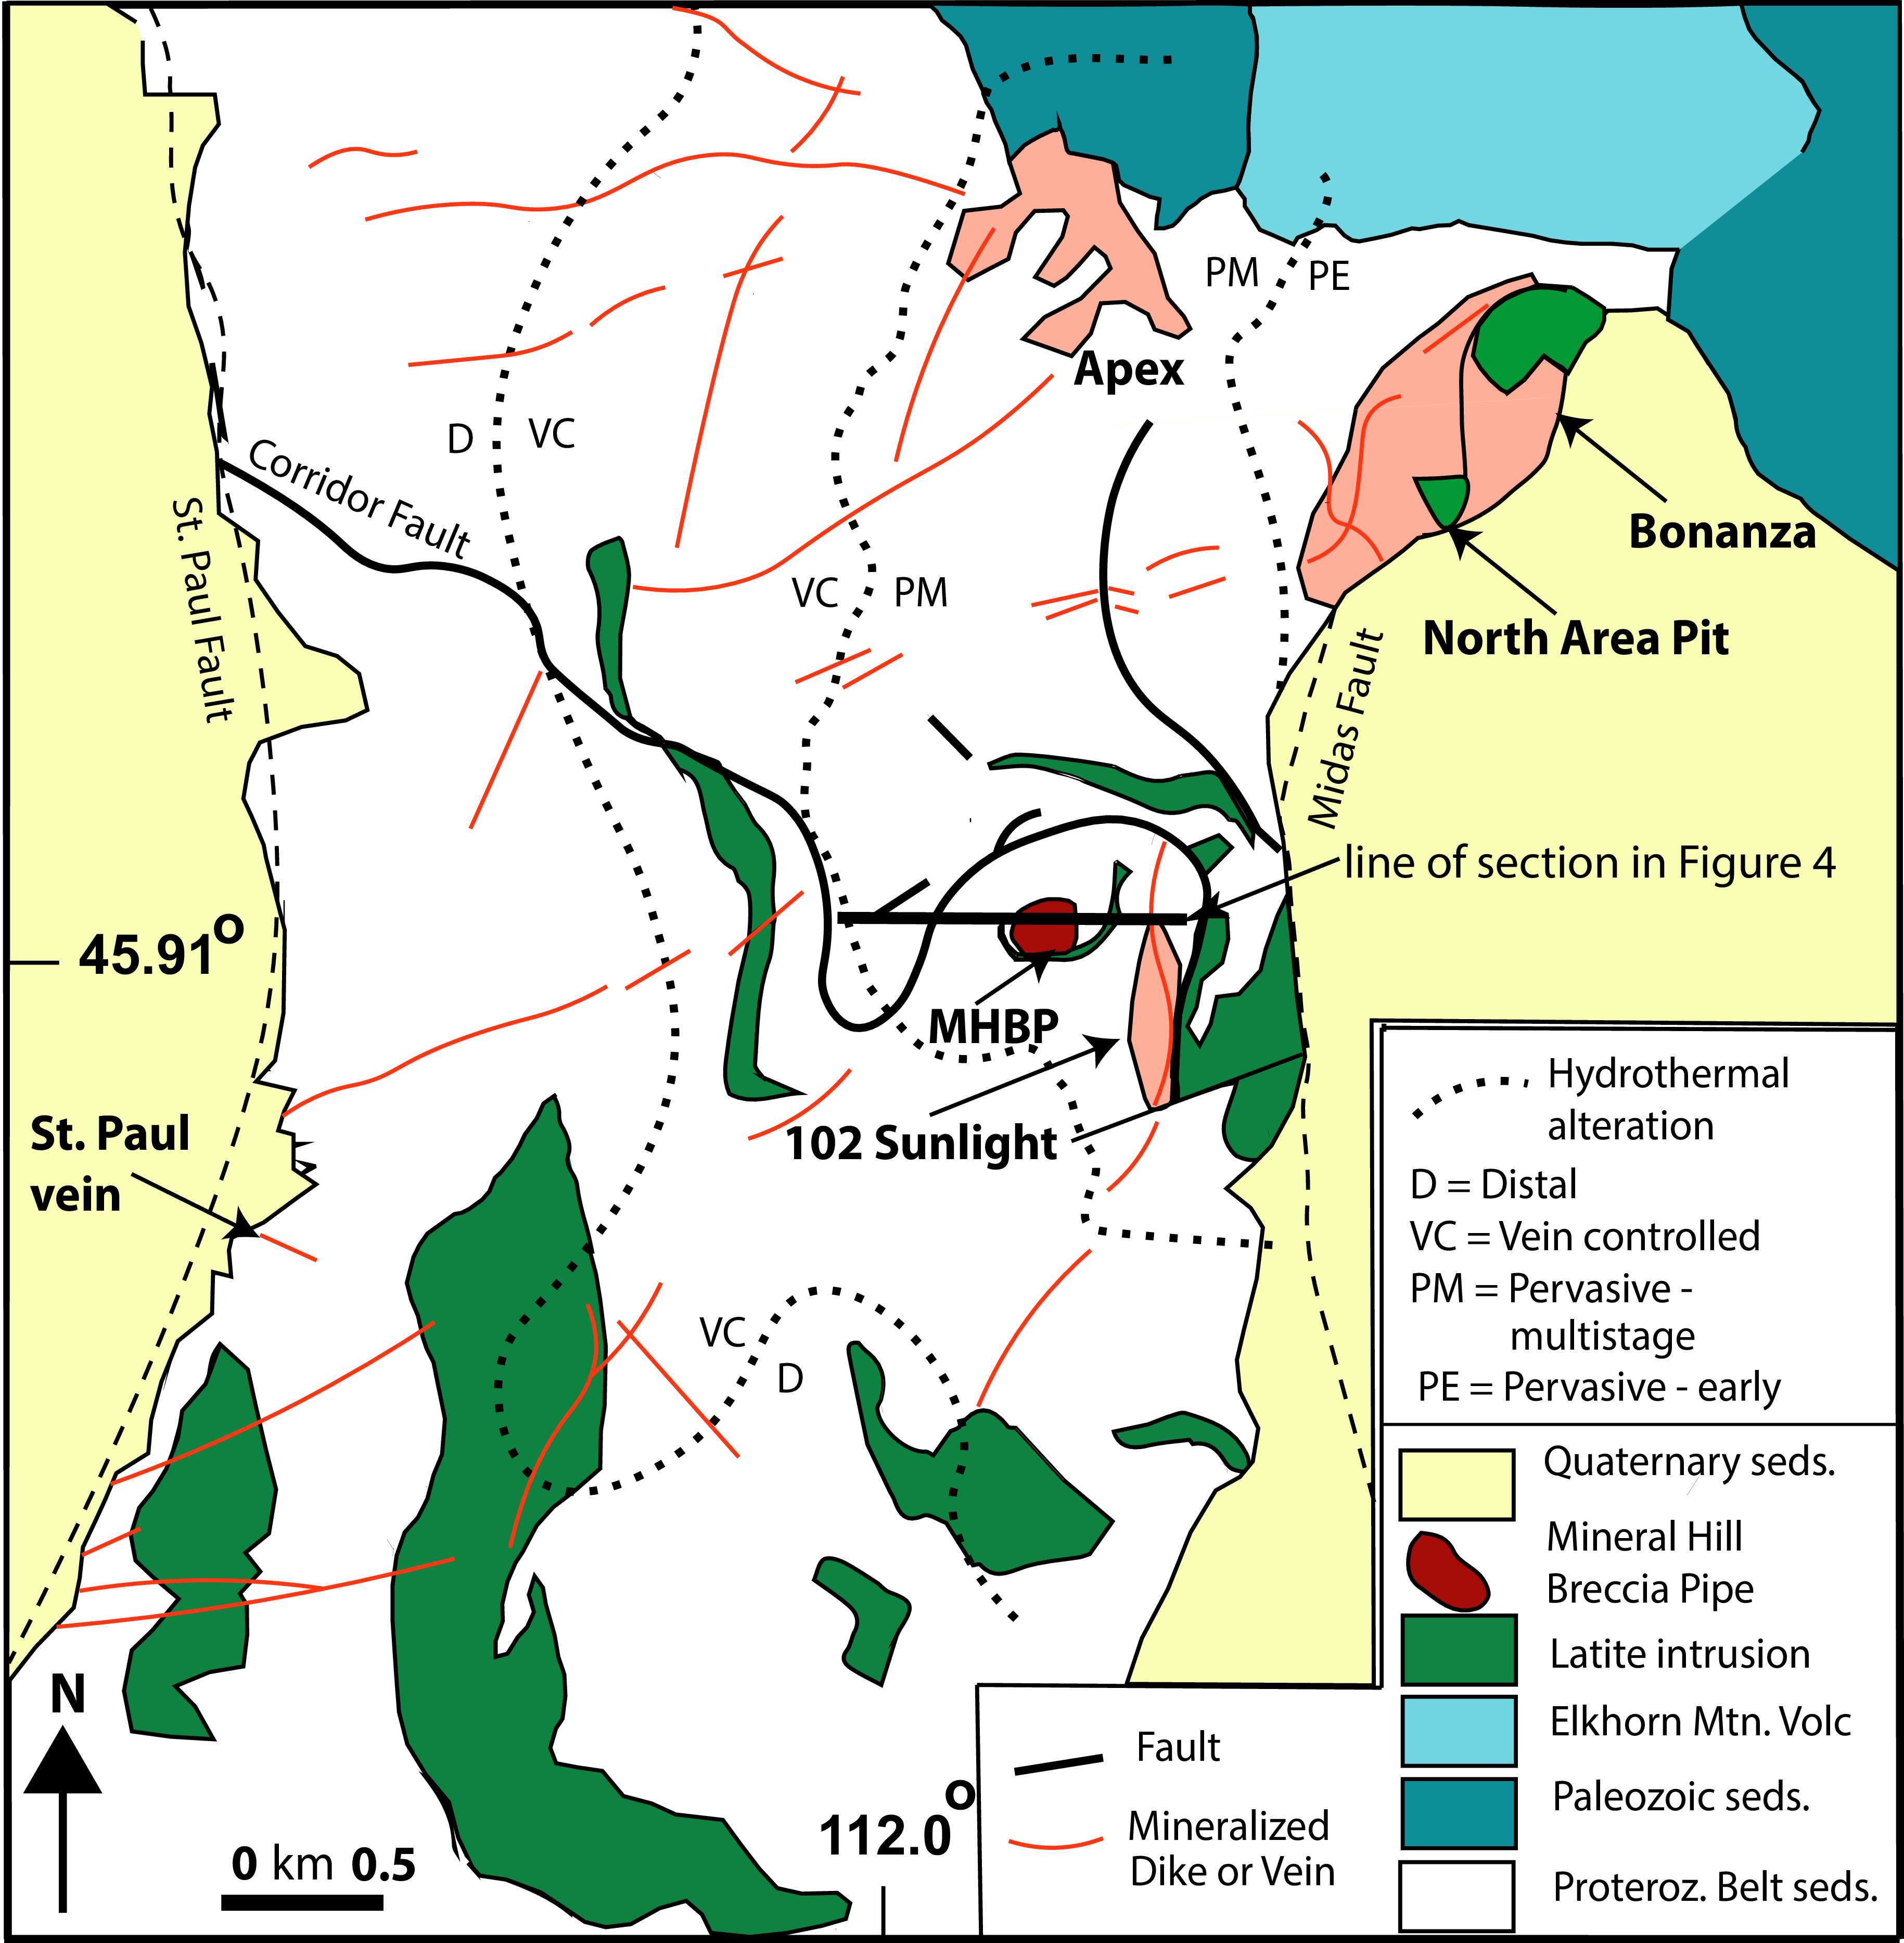
The epithermal Golden Sunlight Au-Ag-Te-Bi-Mo deposit is genetically associated with a Late Cretaceous alkaline to subalkaline porphyry system. The mining operation was in continuous operation between 1982 and 2022, and produced more than 102 t Au, with an average ore grade of ∼ 1.5 g/t Au. Previous studies of the Golden Sunlight deposit consist of those by AE Lindquist (unpub MS thesis, Montana Technical University, 1966), who described its general geological setting and by Porter and Ripley (Reference Porter and Ripley1985), Spry et al. (Reference Spry and Thieben1996) and Spry and Thieben (Reference Spry, Thieben and Stanley1999), who evaluated the mineralogical, stable isotope and fluid inclusion characteristics of the ore deposit. DeWitt et al. (Reference DeWitt, Foord, Zartman, Pearson and Foster1996) determined the chronology of igneous and hydrothermal events in the Golden Sunlight mine area, while Spry et al. (Reference Spry, Foster, Truckle and Chadwick1997) and Spry and Thieben (Reference Spry and Thieben2000) completed mineralogical investigations of the ore. Recent studies by Gammons et al. (Reference Gammons, Gnanou, Odt and Poulson2020b) extended these earlier studies by focusing on sulphide mineralisation in locations (Apex, Bonanza, 102 Sunlight, and North Area Pit) peripheral to, but within 2 km of the main Golden Sunlight deposit (Fig. 2), while Zhao et al. (Reference Zhao, Zhai, Keith, Voudouris, Tombros, Zhang and Liu2025) provided sulphur and He-Ar isotopic constraints on the origin of the deposit.
Geological map of the Golden Sunlight district (modified from Spry et al. Reference Spry, Paredes, Foster, Truckle and Chadwick1996; Gammons et al. Reference Gammons, Gnanou, Odt and Poulson2020b).
The local geology is described in detail by Foster and Childs (Reference Foster and Childs1993), Childs and Foster, (Reference Childs and Foster1993), DeWitt et al. (Reference DeWitt, Foord, Zartman, Pearson and Foster1996), Spry et al. (Reference Spry, Foster, Truckle and Chadwick1997) and Oyer et al. (Reference Oyer, Childs and Mahoney2014) and is briefly summarised here (see also Table 1). Mesoproterozoic sedimentary rocks that host the Golden Sunlight deposit can be divided into two units; the older LaHood Formation, consisting of arkoses, sandstones, conglomerates, and carbonaceous black shales, and the informally named Bull Mountain Group, which is composed of siltstones, shales, synsedimentary sulphide (primarily pyrite), carbonate and silicate concretions, and olistostromes.
Characteristics of selected alkaline igneous rock-related gold telluride deposits, Montana
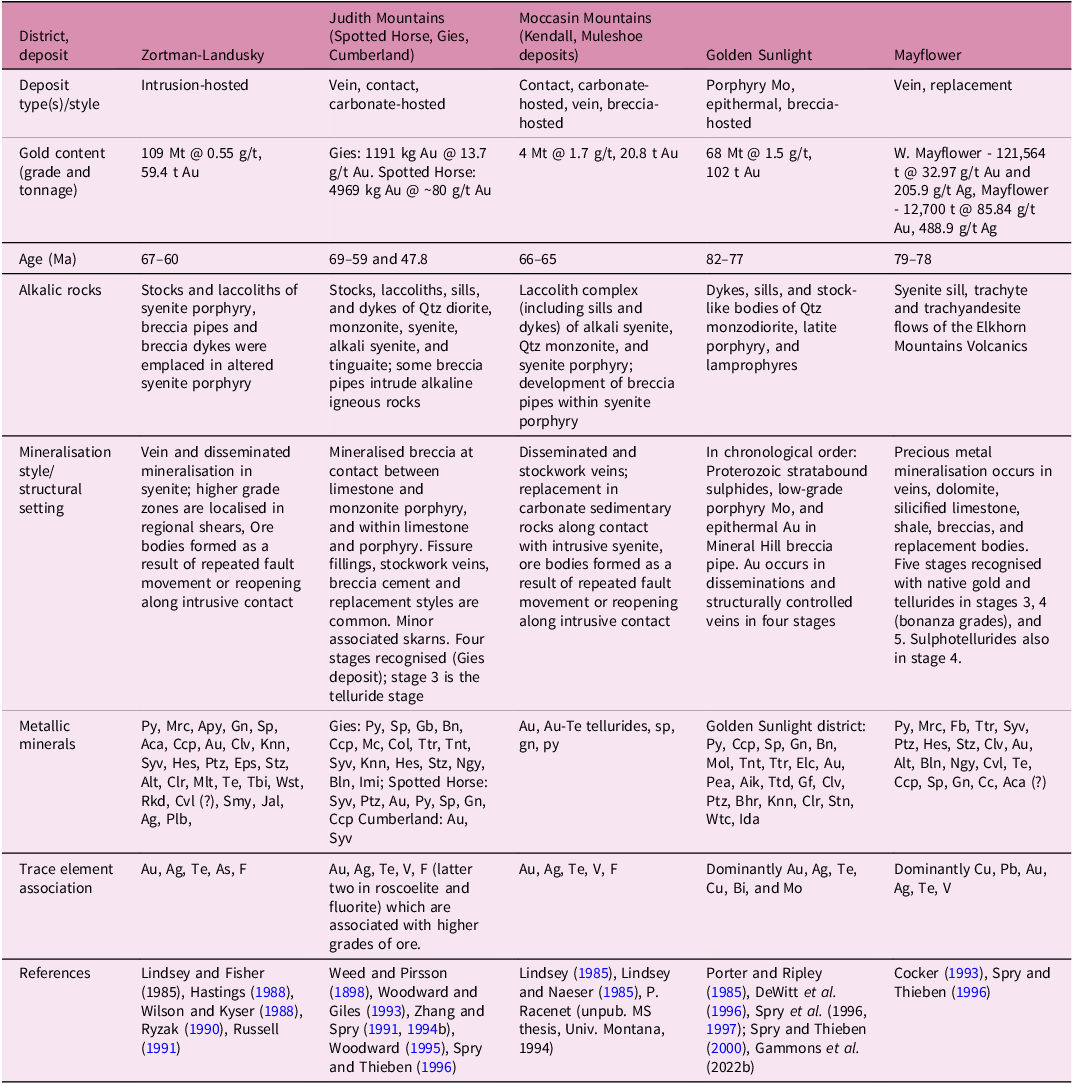
Mineral abbreviations: Aca acanthite, Ag native silver, Aik aikinite, Alt altaite, Apy arsenopyrite, Au native gold, Bhr buckhornite, Bln benleonardite, Bn bornite, Cc chalcocite, Ccp chalcopyrite, Clr coloradoite, Clv calaverite, Col colusite, Cth clausthalite, Cvl cervelleite, Dig digenite, Elc electrum, Emp emplectite, Eng enargite, Eps empressite, Fb freibergite, Gf goldfieldite, Gn galena, Hem haematite, Hes hessite, Ida idaite, Imi imiterite, Jal jalpaite, Knn krennerite, Ln lenaite, Mag magnetite, Mlt melonite, Mol molybdenite, Mrc marcasite, Mtd matildite, Ngy nagyagite, Pea pearceite, Plb polybasite, Ptz petzite, Py pyrite, Pyh pyrrhotite, Rkd rickardite, Sbn stibnite, Smy stromeyerite, Sp sphalerite, Stn stannite, Stz stützite, Syv sylvanite, Tbi tellurobismuthite, Te native tellurium, Tnt tennantite, Ttd tetradymite, Ttr tetrahedrite, Wst weissite, Wtc wittichenite. Format modified after Jensen and Barton (Reference Jensen and Barton2000) and Kelley and Spry (Reference Kelley and Spry2016); mineral abbreviations after Warr (Reference Warr2021) .
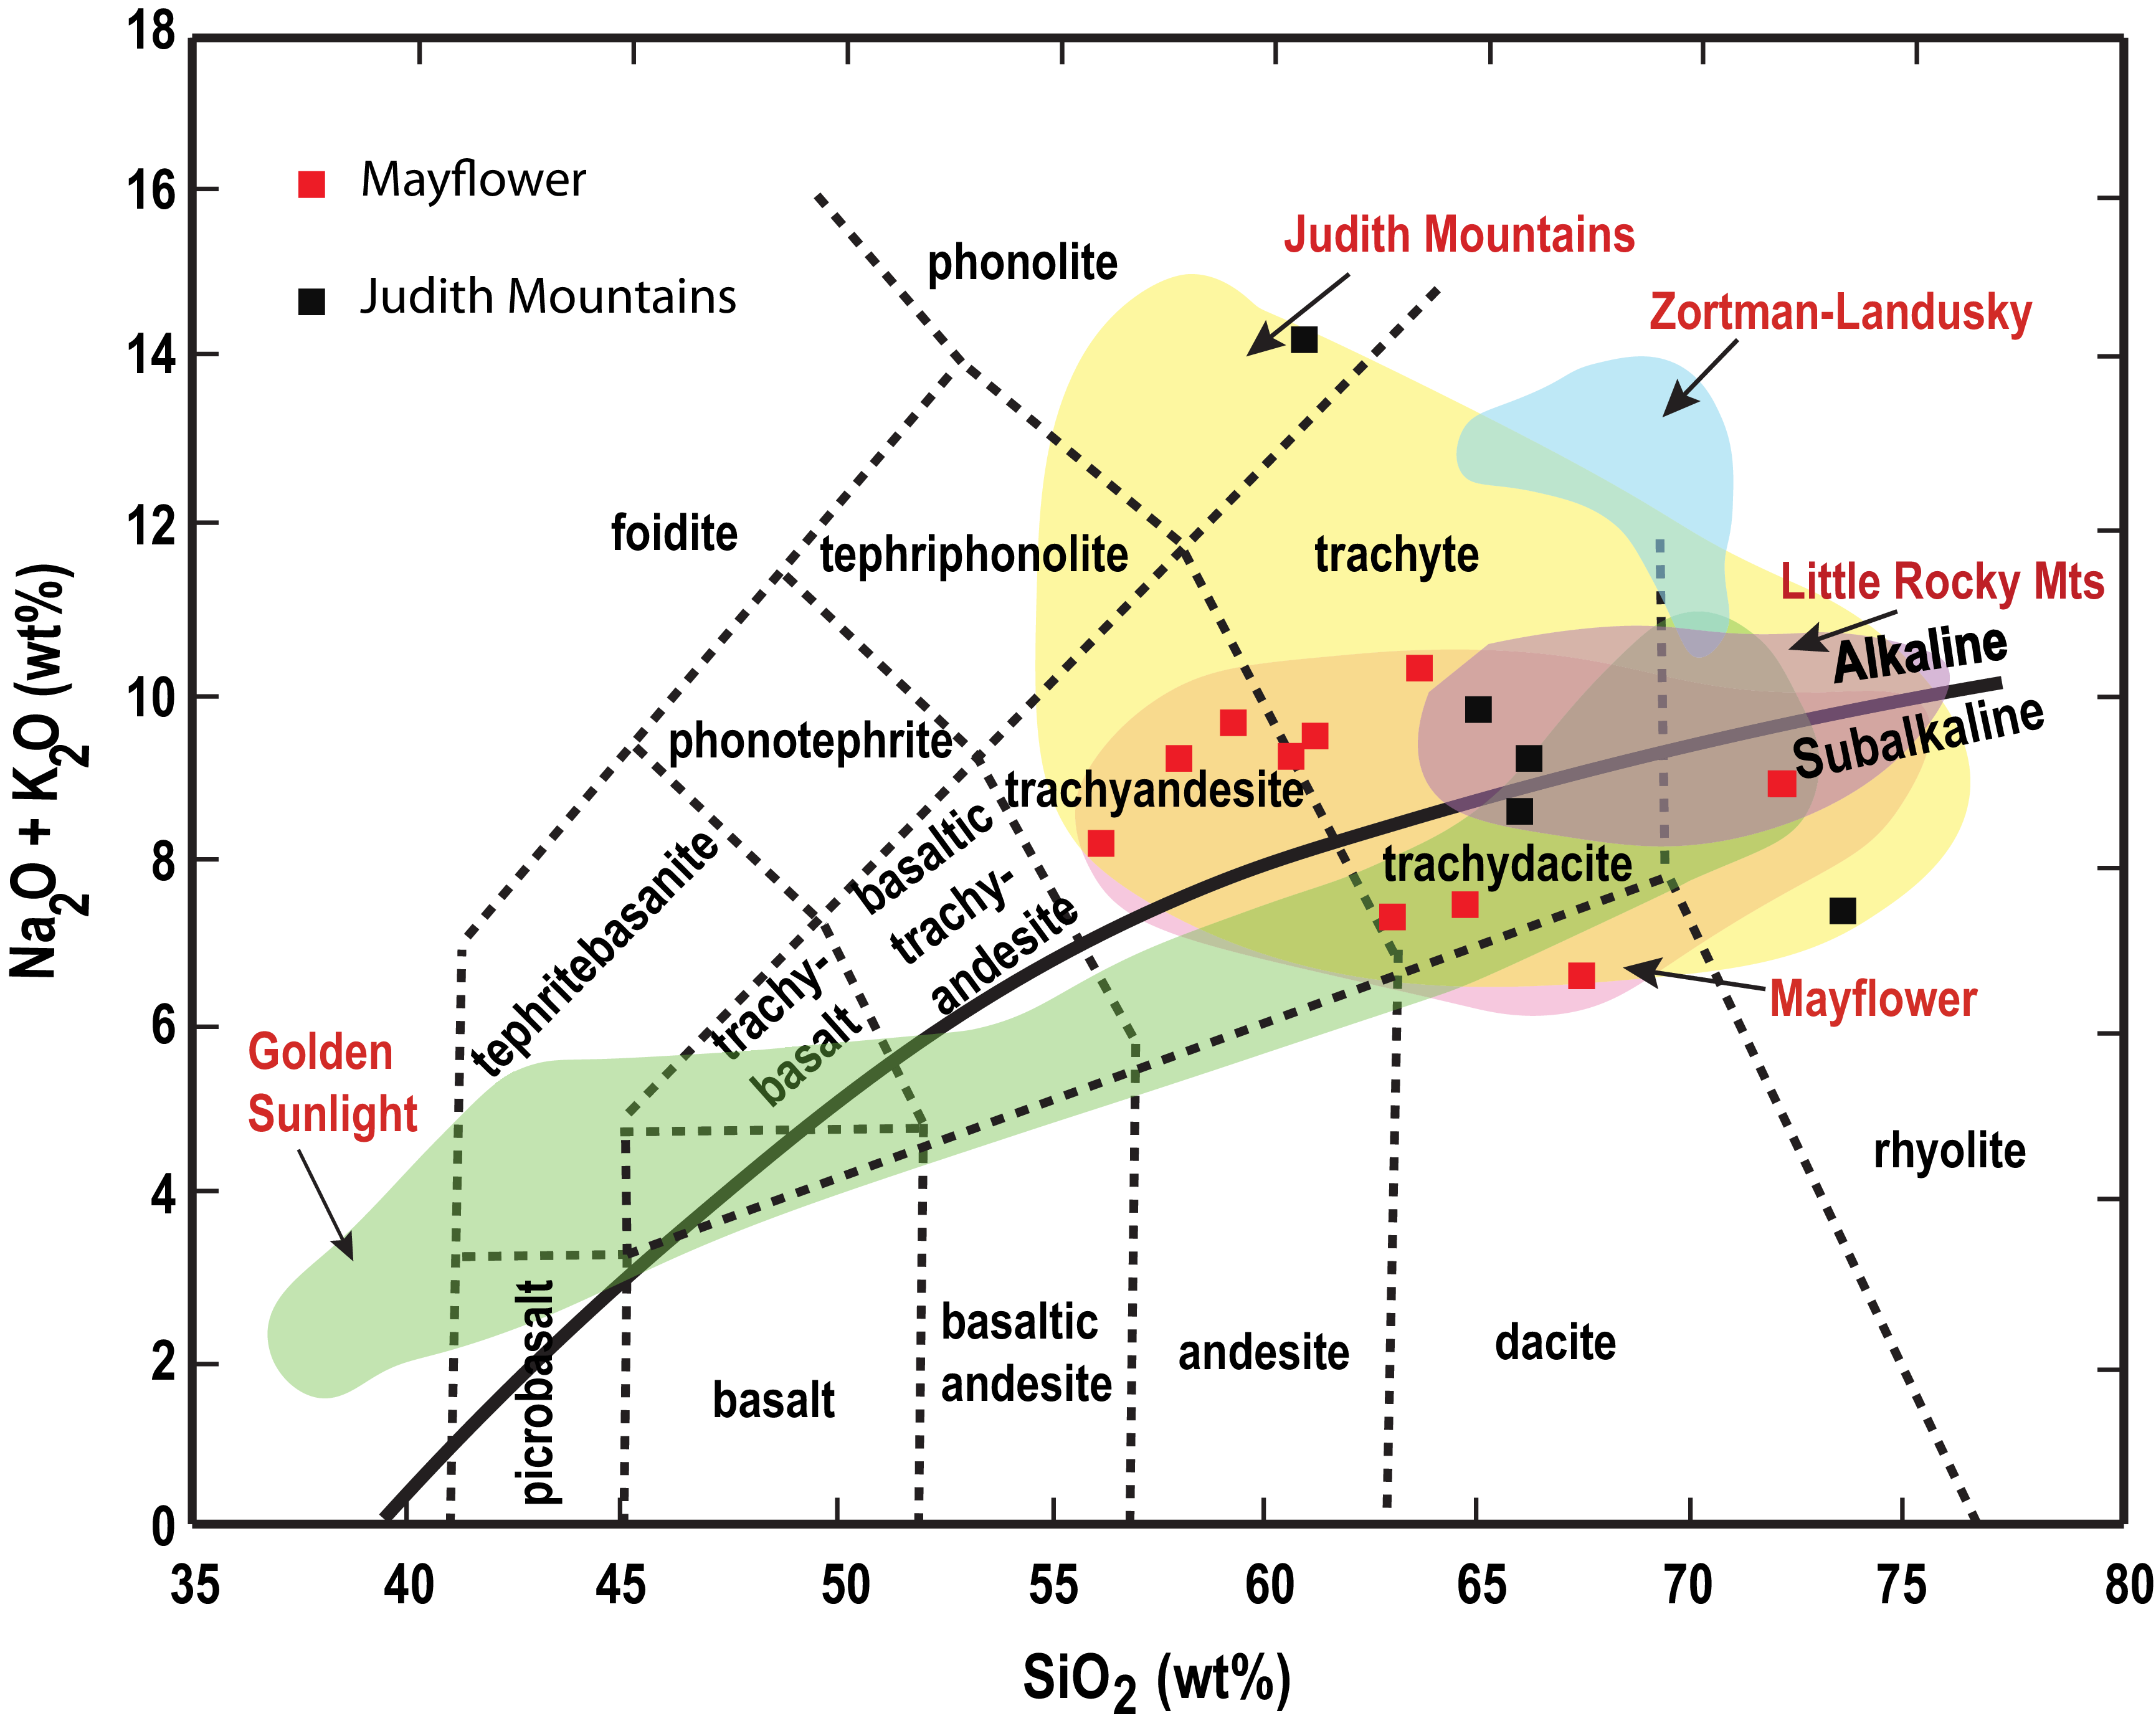
A Cretaceous alkalic-subalkalic suite of igneous rocks consisting of dykes, sills and stock-like bodies of quartz-monzodiorite, latite to rhyolite porphyry, and lamprophyres intrude the Proterozoic rocks. The composition of igneous rocks associated with the Golden Sunlight deposit, and other telluride-bearing gold deposits in Montana, is shown in Figure 3. Latite porphyry is coeval approximately with formation of the Mineral Hill breccia pipe since the porphyry is locally cross-cut by the Mineral Hill breccia pipe, clasts of latite porphyry occur in the breccia, and large bodies of latite porphyry occur at the bottom of the breccia pipe (Fig. 4). A whole-rock model 3 isochron age of 84±18 Ma was derived by De Witt et al. (Reference DeWitt, Foord, Zartman, Pearson and Foster1996) while biotite separates from basalts lamprophyres yielded a K-Ar age of 79.8 ± 2.8 Ma and a 40Ar-39Ar plateau date of 76.9 ± 0.5 Ma (DeWitt et al. Reference DeWitt, Foord, Zartman, Pearson and Foster1996). These ages are comparable to recent 40Ar-39Ar dates of 78.6 ± 1.5 to 77.5 ± 1.1 Ma for biotite from latite porphyry at the Bonanza prospect (Gammons et al. Reference Gammons, Gnanou, Odt and Poulson2020b). Ignoring the imprecise whole-rock U-Pb date of DeWitt et al. (Reference DeWitt, Foord, Zartman, Pearson and Foster1996), Gammons et al. (Reference Gammons, Gnanou, Odt and Poulson2020b) suggested that the age of mineralisation in the district occurred at 81.8 to 76.9 Ma.
Total alkali vs silica diagram (Le Bas et al. Reference Le Bas, Le Maitre, Streckeisen and Zenettin1986) of igneous rock compositions spatially associated with alkaline rock-related epithermal gold-silver deposits in Montana. The alkali-subalkalic boundary is from Irvine and Baragar (Reference Irvine and Baragar1971). Data are from: Mayflower (this study), Golden Sunlight (DeWitt et al. Reference DeWitt, Foord, Zartman, Pearson and Foster1996), Judith Mountains (Wallace, Reference Wallace1953; Nockolds, Reference Nockolds1954; GL Kirchner, unpub MS thesis Univ of Montana 1982; Zhang & Spry, Reference Zhang and Spry1994b; this study), Zortman-Landusky (Wilson & Kyser, Reference Wilson and Kyser1988), Little Rocky Mountains (Russell, Reference Russell, Baker and Berg1991). The new whole-rock compositions obtained here for the Mayflower deposit and the Judith Mountains are indicated.
Geological cross-section of the Mineral Hill breccia pipe, Golden Sunlight deposit, showing the location of stockwork zones on the margin of the breccia pipe and zones of hydrothermal alteration where the pyrite content is >15%. Abbreviations: Quat = Quaternary; Cret = Cretaceous; MP = Middle Proterozoic (modified after DeWitt et al. Reference DeWitt, Foord, Zartman, Pearson and Foster1996).
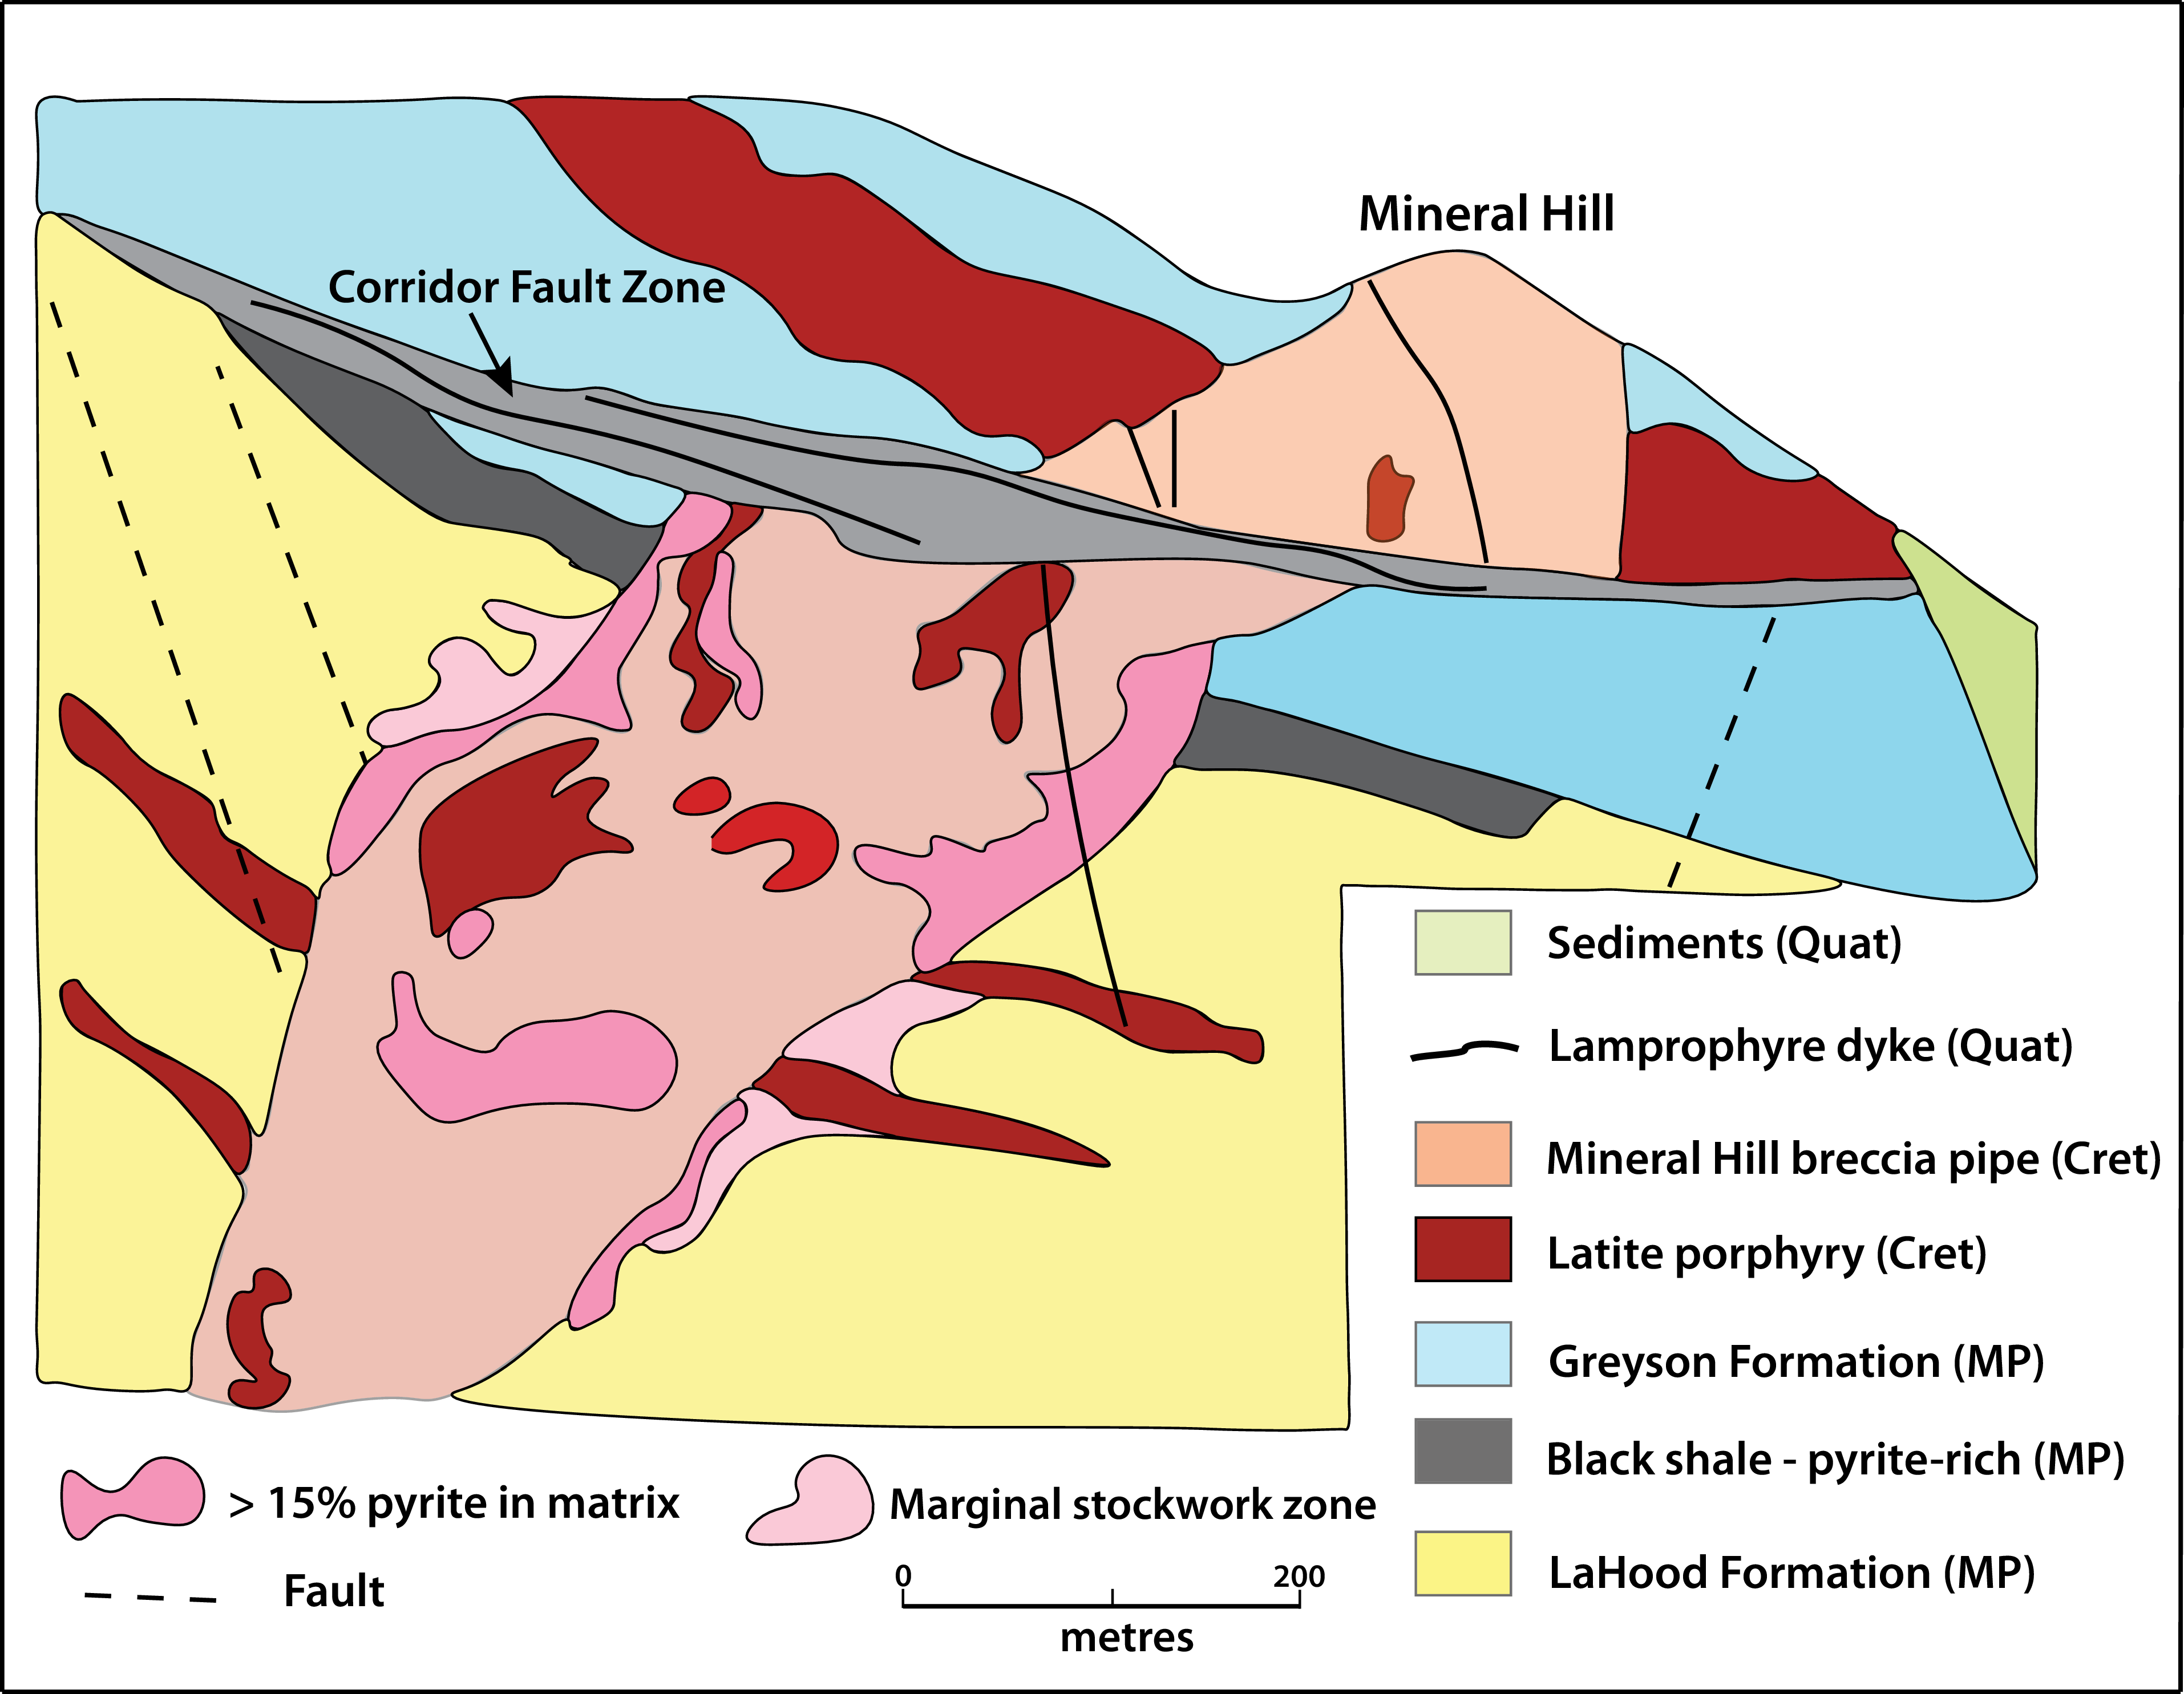
The Mineral Hill breccia pipe, which plunges at an average angle of 35o to the southwest (Fig. 4), has a circular to elliptical plan with a diameter of up to 270 m and a vertical extent of >700 m, and consists of fragments of Proterozoic sedimentary rocks and latite that range in size from a few millimetres to >10 m in diameter. Relatively unaltered potassic trachybasalts, basaltic andesites, and lamprophyre crop out approximately 1.5 km south of the breccia pipe (DeWitt et al. Reference DeWitt, Foord, Zartman, Pearson and Foster1996), and an altered body of quartz monzodiorite is located 1 km northeast of the pipe. A high concentration of lamprophyre sills is present in the breccia pipe coincident with a deformation zone (Fig. 2).
4.a.1. Hydrothermal mineralisation of the Mineral Hill breccia pipe
Three main types of sulphide mineralisation are found in the district. In chronological order, they are listed as follows: Proterozoic stratabound sulphide mineralisation; the low-grade Mineral Hill porphyry Mo system; and the Mineral Hill breccia pipe and related auriferous veins. Spry et al. (Reference Spry, Foster, Truckle and Chadwick1997) considered the Proterozoic stratabound sulphide mineralisation to be syngenetic or diagenetic in origin. Fluid inclusion, stable isotope and mineral alteration studies by Spry et al. (Reference Spry, Paredes, Foster, Truckle and Chadwick1996) suggested that the Mineral Hill breccia pipe and related auriferous veins were spatially and temporally linked to the porphyry molybdenum system. This system, which covers a surface area of 6 km2, is centred on the Mineral Hill breccia pipe. The general characteristics of the three ore types are described in detail by Spry et al. (Reference Spry and Thieben1996, Reference Spry, Foster, Truckle and Chadwick1997), and only the gold mineralisation is discussed here. Details of the mineralogy of the Apex, Bonanza, North Pit and 102/Sun zones are given in Gammons et al. (Reference Gammons, Gnanou, Odt and Poulson2020b), where they contain most of the same minerals present in the Mineral Hill breccia pipe, along with goldfieldite, celestite, albite, svanbergite, panasqueraite, and althausite in some of the zones.
Gold mineralisation in the Mineral Hill breccia pipe occurs primarily as disseminations and as structurally controlled northeast- and east-northeast-trending veins and breccias along faults and joints primarily. Most of the gold occurs at the margins of the Mineral Hill breccia pipe. Disseminated mineralisation is located in the sulphide-rich matrix of the breccia, the latite porphyry, and in Proterozoic sedimentary rocks. The highest gold grades (up to 740 g/t) occur in the deepest parts of the breccia pipe.
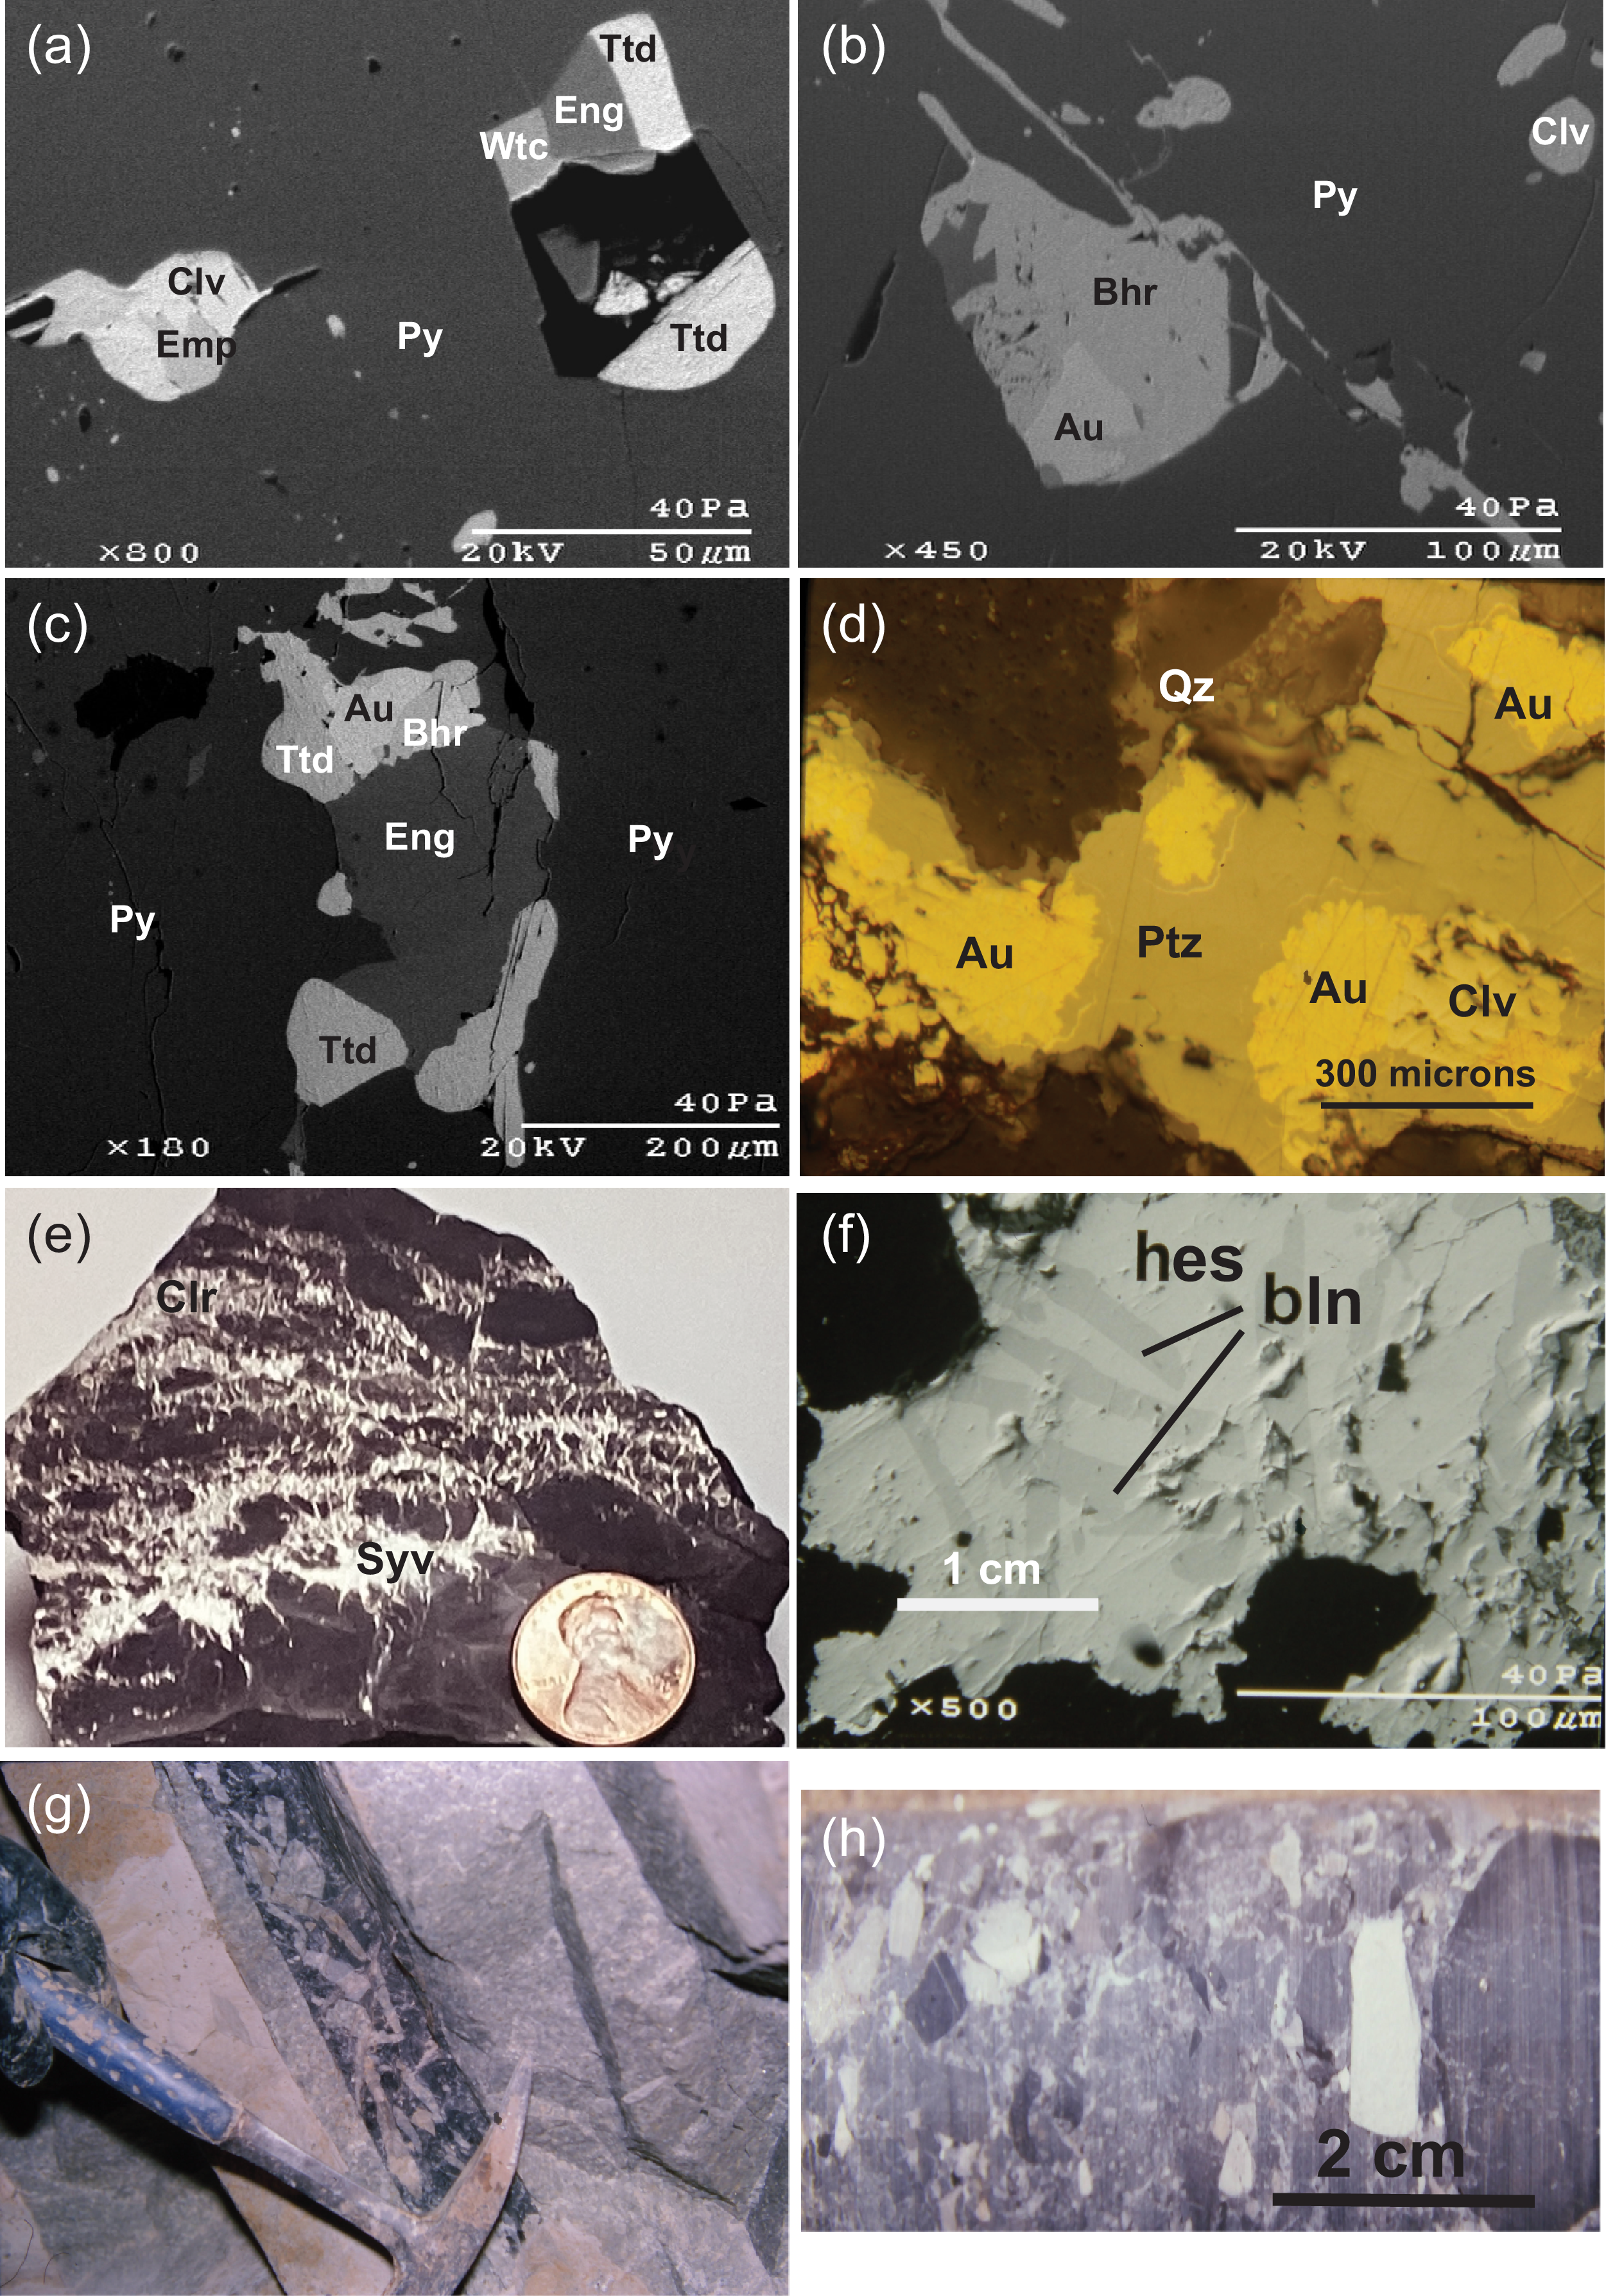
A new four-stage paragenetic sequence of hydrothermal mineralisation in the breccia pipe, in addition to the porphyry Mo stage, is given in Supplementary Figure S1, which incorporates the mineralogical studies of Porter and Ripley (Reference Porter and Ripley1985), Spry et al. (Reference Spry, Foster, Truckle and Chadwick1997), Spry and Thieben (Reference Spry and Thieben2000), Gammons et al. (Reference Gammons, Gnanou, Odt and Poulson2020b) and Gammons and Singh (Reference Gammons and Singh2024). Stages I and IV comprise about 99% of the total volume of the quartz-bearing breccia pipe matrix. Pyrite is the most common sulphide and constitutes up to 20% of some rocks. Stage I consists of two sub-stages, Ia and Ib, whereby haematite, rutile, pyrrhotite, and rare tetradymite occur as inclusions (stage Ia), up to 30μm in length, in the cores of pyrite porphyroblasts. Stage Ib mineralisation is composed of sulphides and sulphosalts that occur as randomly distributed inclusions in stage I pyrite and baryte. Spry et al. (Reference Spry, Foster, Truckle and Chadwick1997) and Spry and Thieben (Reference Spry and Thieben2000) showed that these inclusions consist of native gold, calaverite, tetradymite, tellurobismuthite, buckhornite, melonite, coloradoite, altaite, clausthalite, stannite, bornite, chalcopyrite, chalcocite, tennantite, sphalerite, wittichenite, emplectite, idaite, and petzite and native tellurium (Fig. 5a-c). A recent study by Gammons and Singh (Reference Gammons and Singh2024) also pointed out the presence of previously unreported hodrusite, mawsonite and goldfieldite in samples containing pyrite and calaverite, which suggests they formed in stage 1b.
Metallic mineralisation in gold telluride deposits in Montana. a. Back-scattered electron image of inclusions of calaverite (Clv), wittichenite (Wtc), emplectite (Emp), and tetradymite (Ttd) in pyrite (Py) from the Mineral Hill breccia pipe, Golden Sunlight deposit. b. Back-scattered electron (BSE) image of inclusions of buckhornite (Bhr) intergrown with native gold (Au) and calaverite in pyrite from the Mineral Hill breccia pipe, Golden Sunlight deposit. c. BSE image of an intergrowth of native gold, buckhornite, tetradymite and enargite (Eng) in pyrite from the Mineral Hill breccia pipe, Golden Sunlight deposit. d. Plane-polarised reflected light image of intergrown petzite (Ptz), native gold, and calaverite in quartz, Mayflower deposit. e. Sample of high-grade sylvanite (Syv) and coloradoite (Clr) ore in shaley limestone, Mayflower deposit. f. BSE image of benleonardite (Bln) blades in hessite (Hes), Mayflower deposit. g. Gold-bearing brecciated ore in Gold Hill quartz monzonite porphyry, Spotted Horse deposit. h. Polylithic gold-bearing breccia consisting of angular and rounded clasts of monzonite and limestone with calcite in the matrix, Kentucky Favourite deposit.
Stage II is separated from stage I by a period of brecciation (Porter & Ripley, Reference Porter and Ripley1985). Chalcopyrite is the most common mineral in stage II, although pyrite, galena, tennantite, marcasite, and tellurobismuthite, sylvanite, hessite, gold, altaite, and native tellurium are also present. Stage III mineralisation is of relatively minor importance but consists of tennantite that replaced chalcopyrite, and the following precious metal tellurides: petzite, sylvanite, krennerite, hessite, and rare grains of gold and empressite. Stage IV is characterised by infillings between breccia fragments and veins of quartz, pyrite, magnesite, dolomite, kaolinite, fluorapatite, fluorite, dickite, sericite, and chalcopyrite.
4.b. Mayflower deposit, Whitehall
The Mayflower deposit is an epithermal gold vein deposit hosted in dolomite and dolomitic limestone of the Cambrian Meagher Formation. It is spatially related to Late Cretaceous intrusive andesite sills and extrusive Elkhorn Mountains Volcanics (EMV). The deposit was intermittently mined from 1896 to 1961 and produced 5,098 kg Au and 31,237 kg Ag (Cocker, Reference Cocker1993). Drilling by Brimstone Gold Corporation in 1997 and 1998 identified total proven and probable reserves of 595 kg Au and 3912 kg Ag, but the deposit remains open at depth. Previous published studies of the Mayflower deposit are limited to those of Cocker (Reference Cocker1993) who described the geological setting, primary element dispersion patterns, and hydrothermal alteration associated with the ore, and Spry and Thieben (Reference Spry and Thieben1996) who described the presence of rare tellurium-bearing minerals, benleonardite (Ag8(Sb,As)Te2S3) and cervelleite (Ag4TeS) in high-grade samples of ore.
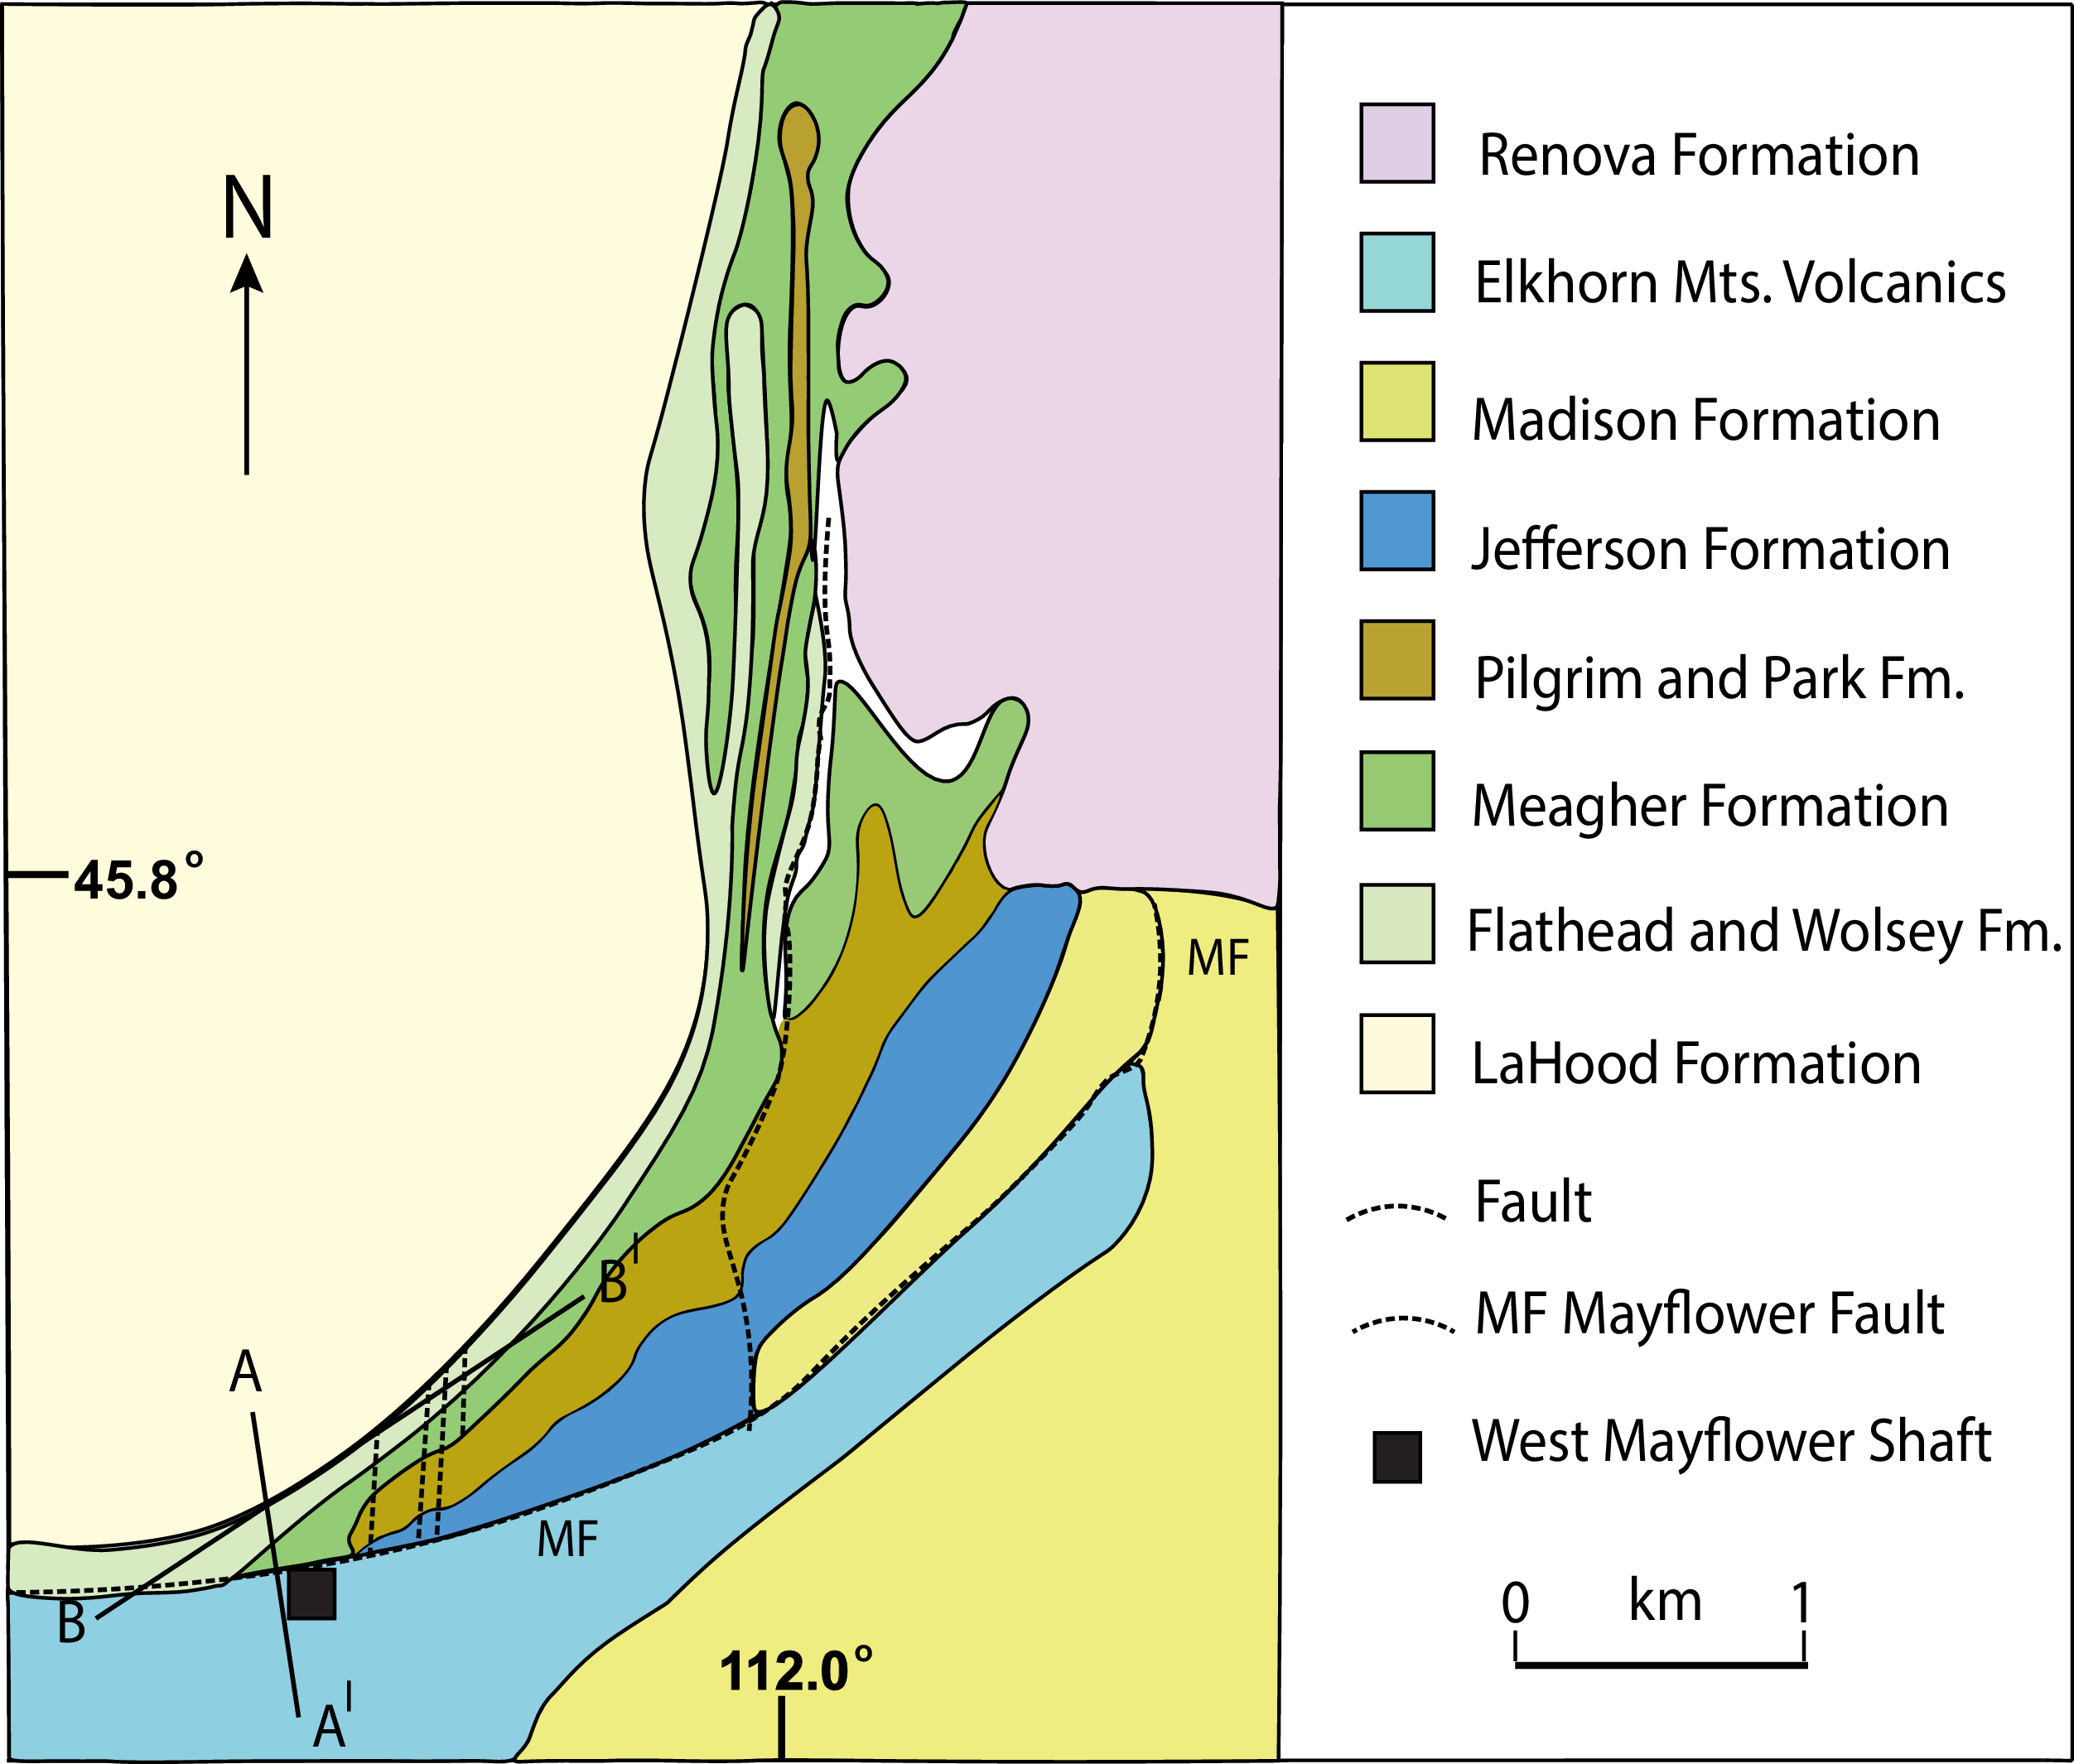
The Mayflower deposit occurs immediately adjacent to the Mayflower Fault and parallels the Proterozoic Willow Creek fault system (Fig. 6). Lochman-Balk (Reference Lochman-Balk and Holland1971) and Cocker (Reference Cocker1993) showed that Middle Proterozoic clastic sedimentary rocks of the LaHood Formation are unconformably overlain by a transgressive sequence of lower Palaeozoic sedimentary rocks in the Mayflower mine area (Figs. 6 and 7). Clastic rocks of the Cambrian Flathead Formation occur at the base of the Palaeozoic sequence and are overlain by the Cambrian Wolsey Shale. The Cambrian Meagher Formation consists of three carbonate members (Cocker, Reference Cocker1993): 1. the basal member is a thick-bedded, dark grey limestone; 2. the middle member is a thin-bedded blue-grey and brown limestone, with locally abundant argillaceous units; and 3. the upper member is a light grey limestone. Gold mineralisation is limited to the Meagher Formation, particularly the middle member.
Geological map of the Mayflower deposit (after Cocker, Reference Cocker1993).
Geological cross-section through the West Mayflower ore zone (after Cocker, Reference Cocker1993). The levels indicated are given in feet. MF refers to the Mayflower Fault.
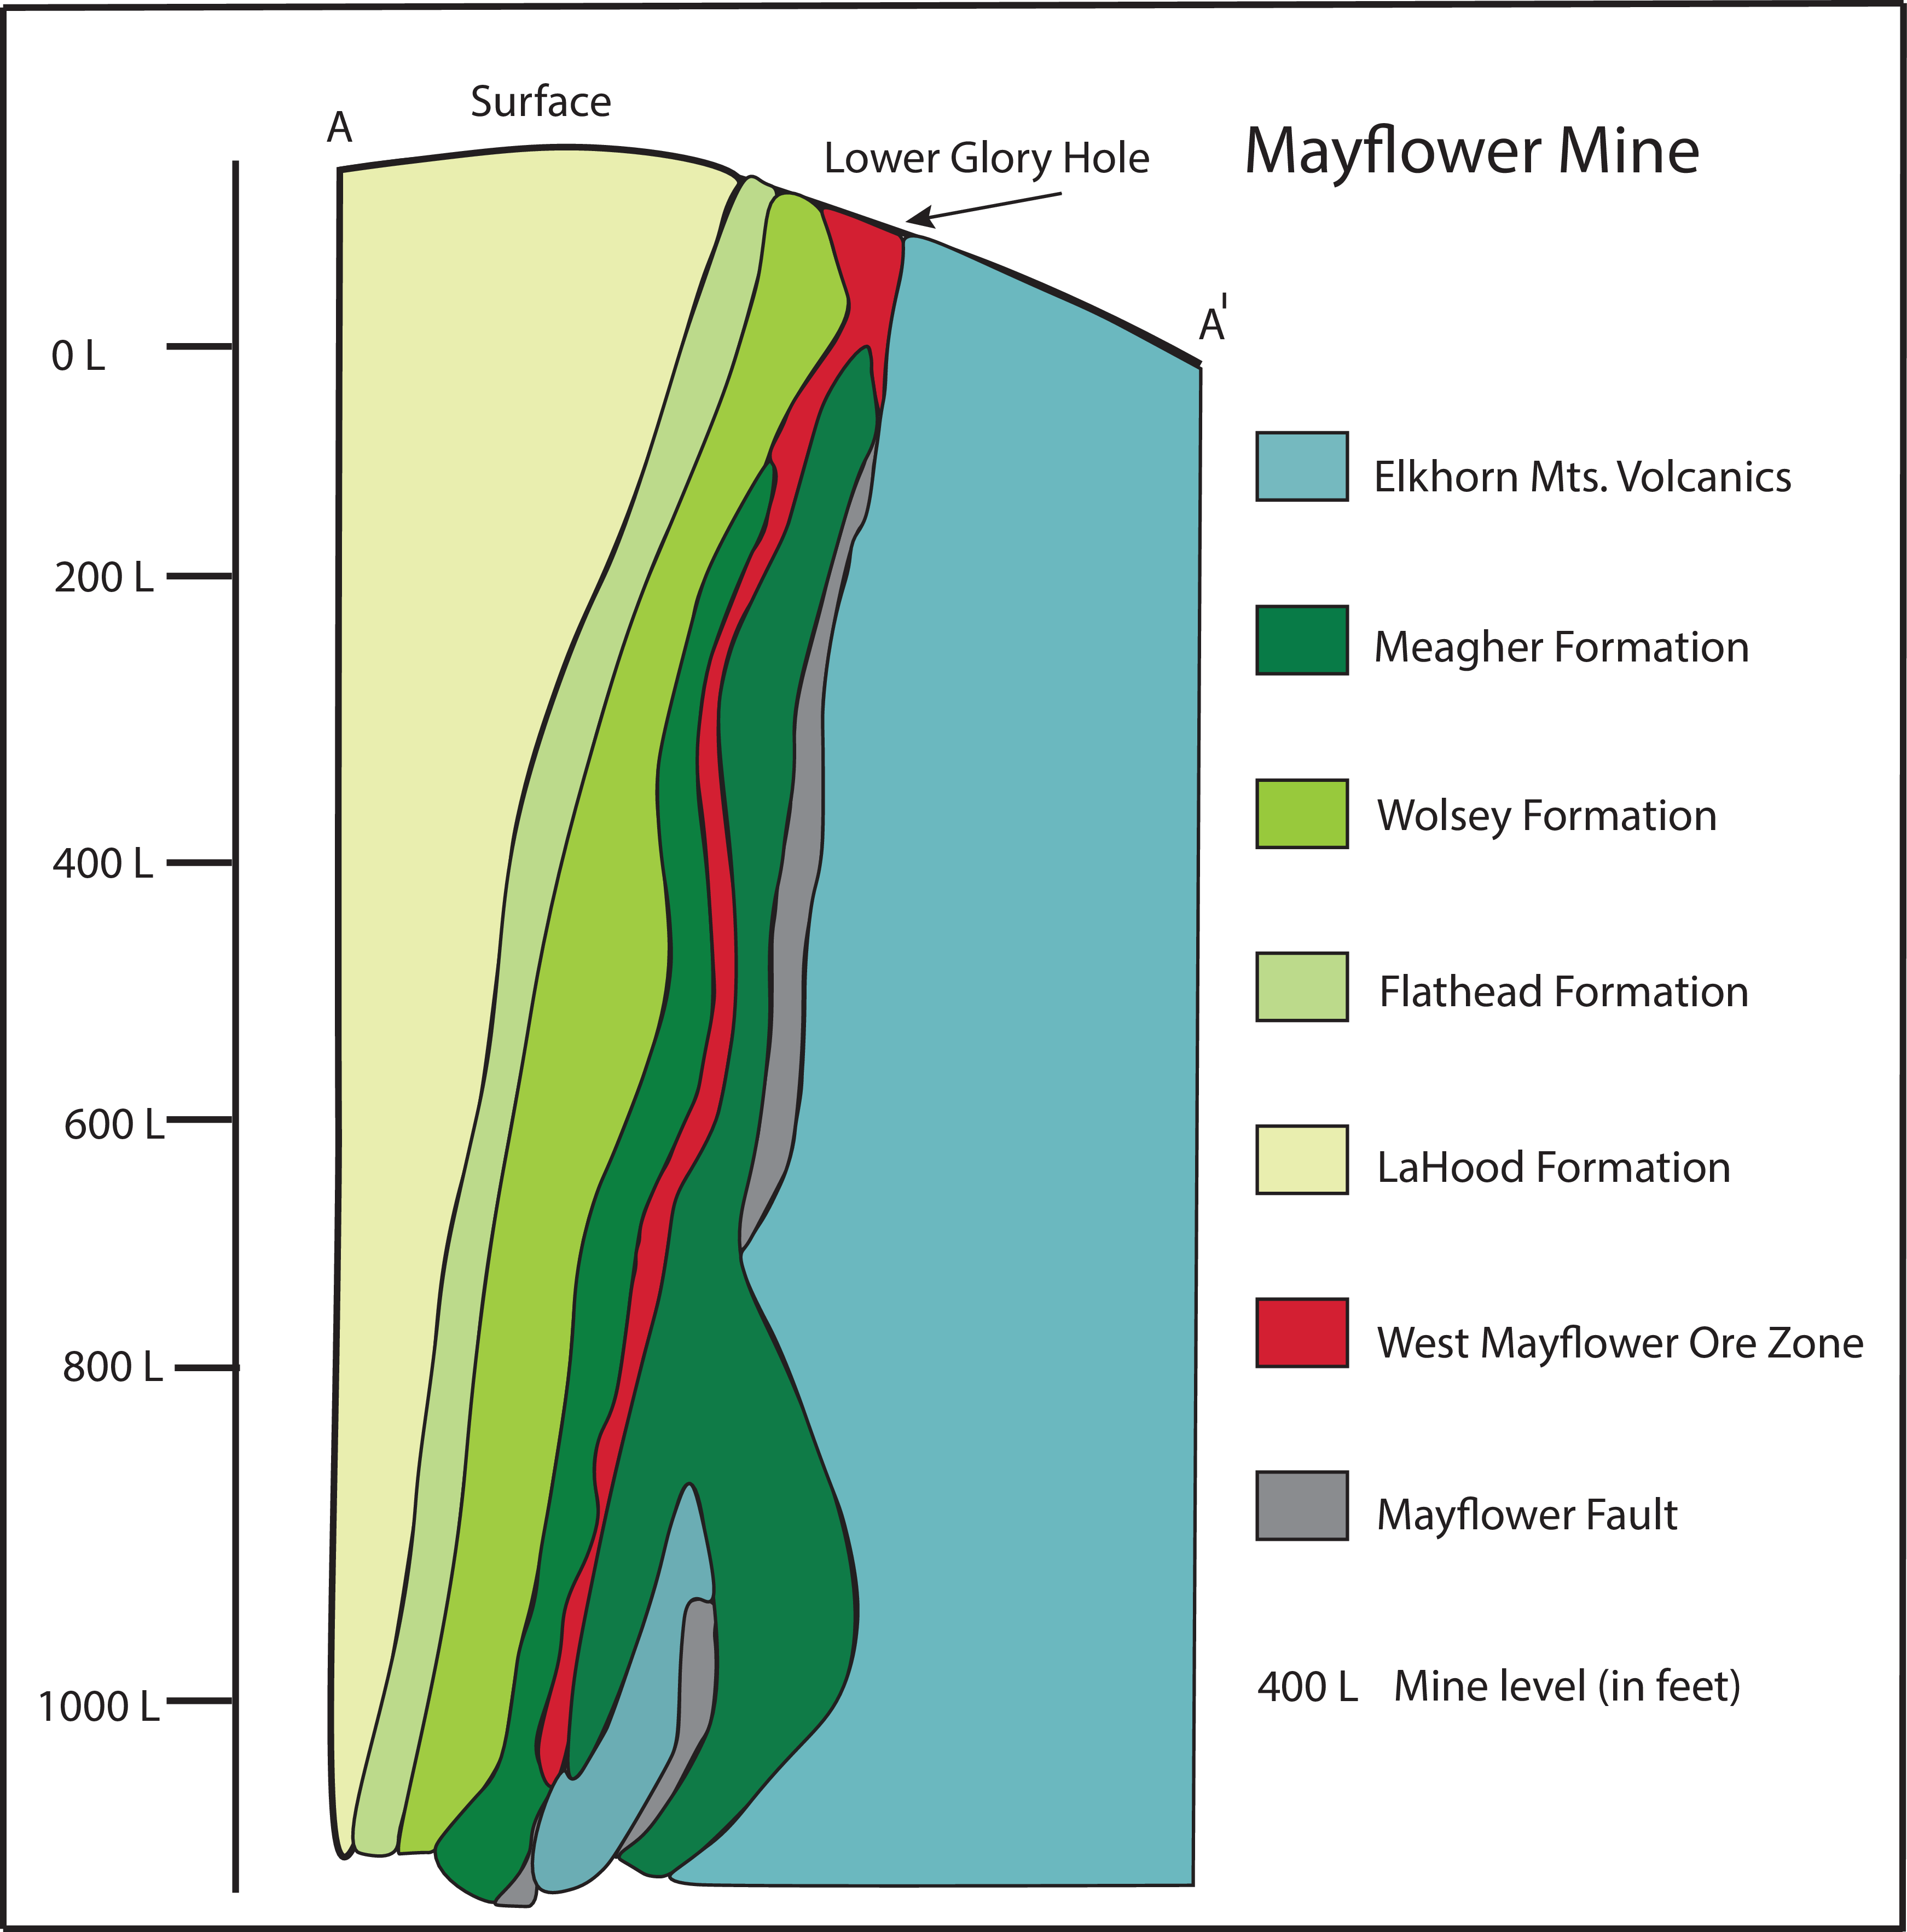
Intrusive rocks in the mine area are restricted to two sills. One of these sills, up to 10 m wide, is hosted by the Wolsey Formation and occurs along strike from the Mayflower deposit. In the mine area, it was propyllitically altered by chlorite, epidote, and calcite (Cocker, Reference Cocker1993). A second sill, up to 9 m wide, was identified by M.D. Cocker (unpub. report to Anaconda Minerals Company, 1983) in drill core and underground. The two sills have bulk compositions and textural characteristics of a syenite and an aplite (Table 2). The age of these sills is unknown, but it is likely that they are the intrusive equivalents of the extrusive EMV, which formed at ∼ 78 Ma (Tilling et al. Reference Tilling, Klepper and Obradovich1968; Schmidt et al. Reference Schmidt, O’Neill, Brandon, Schmidt and Perry1988). The EMV are well exposed on the south side of the Mayflower Fault and consist of trachyandesite flows, andesitic tuff breccias, rhyodacite welded tuffs, as well as welded and non-welded pyroclastics (Lund & Aleinikoff, Reference Lund and Aleinikoff2022).
Whole rock compositions of igneous rocks associated with the Mayflower deposit and Judith Mountains deposits
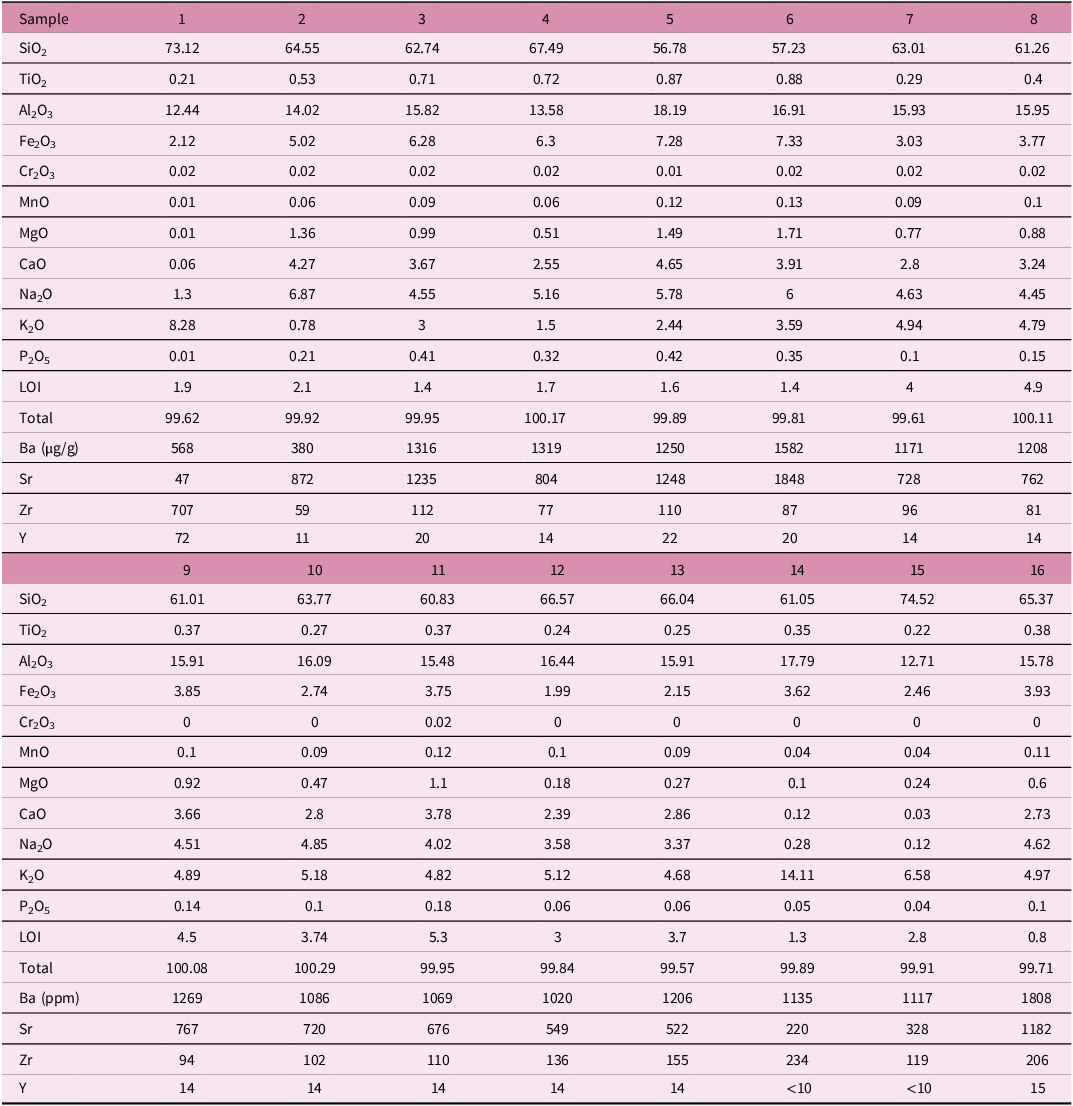
1. Aplite sill, Mayflower; 2. Syenite sill, Mayflower; 3. Trachyte, Elkhorn Mountains Volcanics (EMV), Mayflower; 4. Dacite, EMV, Mayflower; 5. Trachyandesite, EMV, Mayflower; 6. Trachyandesite, EMV, Mayflower; 7. Trachyte, EMV, Mayflower; 8. Trachyte, EMV, Mayflower; 8. Trachyte, EMV, Mayflower; 9. Trachyte, EMV, Mayflower; 10. Trachyte, EMV, Mayflower; 11. Trachyandesite, EMV, Mayflower; 12. Crystal Peak quartz monzonite porphyry (near Spotted Horse, Judith Mts; 13. Gold Hill quartz monzonite porphyry (near Spotted Horse, Judith Mts; 14. Gold Hill quartz monzonite porphyry (near Cumberland, Judith Mts; 15. Gold Hill quartz monzonite porphyry (near Mathews, Judith Mts); 16. Big Grassy Peak quartz monzonite porphyry (near Tail Holt, Judith Mts.).
The presence of silicification and adularia in and adjacent to gold mineralisation and the spatially associated Mayflower Fault suggests a genetic relationship between mineralisation and the fault. The age of the mineralisation is unknown due to a lack of geochronological studies; however, it is likely to have formed during the late Cretaceous to Palaeogene.
4.b.1. Hydrothermal mineralisation and alteration
Samples used in the present study were obtained either from drill core obtained by Brimstone Gold Corporation, dump material, a collection housed in the Mineral Museum at Montana Tech, or from the collection of Mark D. Cocker that was used in his studies (Cocker, Reference Cocker1993). It should be pointed out that nearly all of the gold-rich samples, although poorly located, were derived from the Mayflower ore shoot.
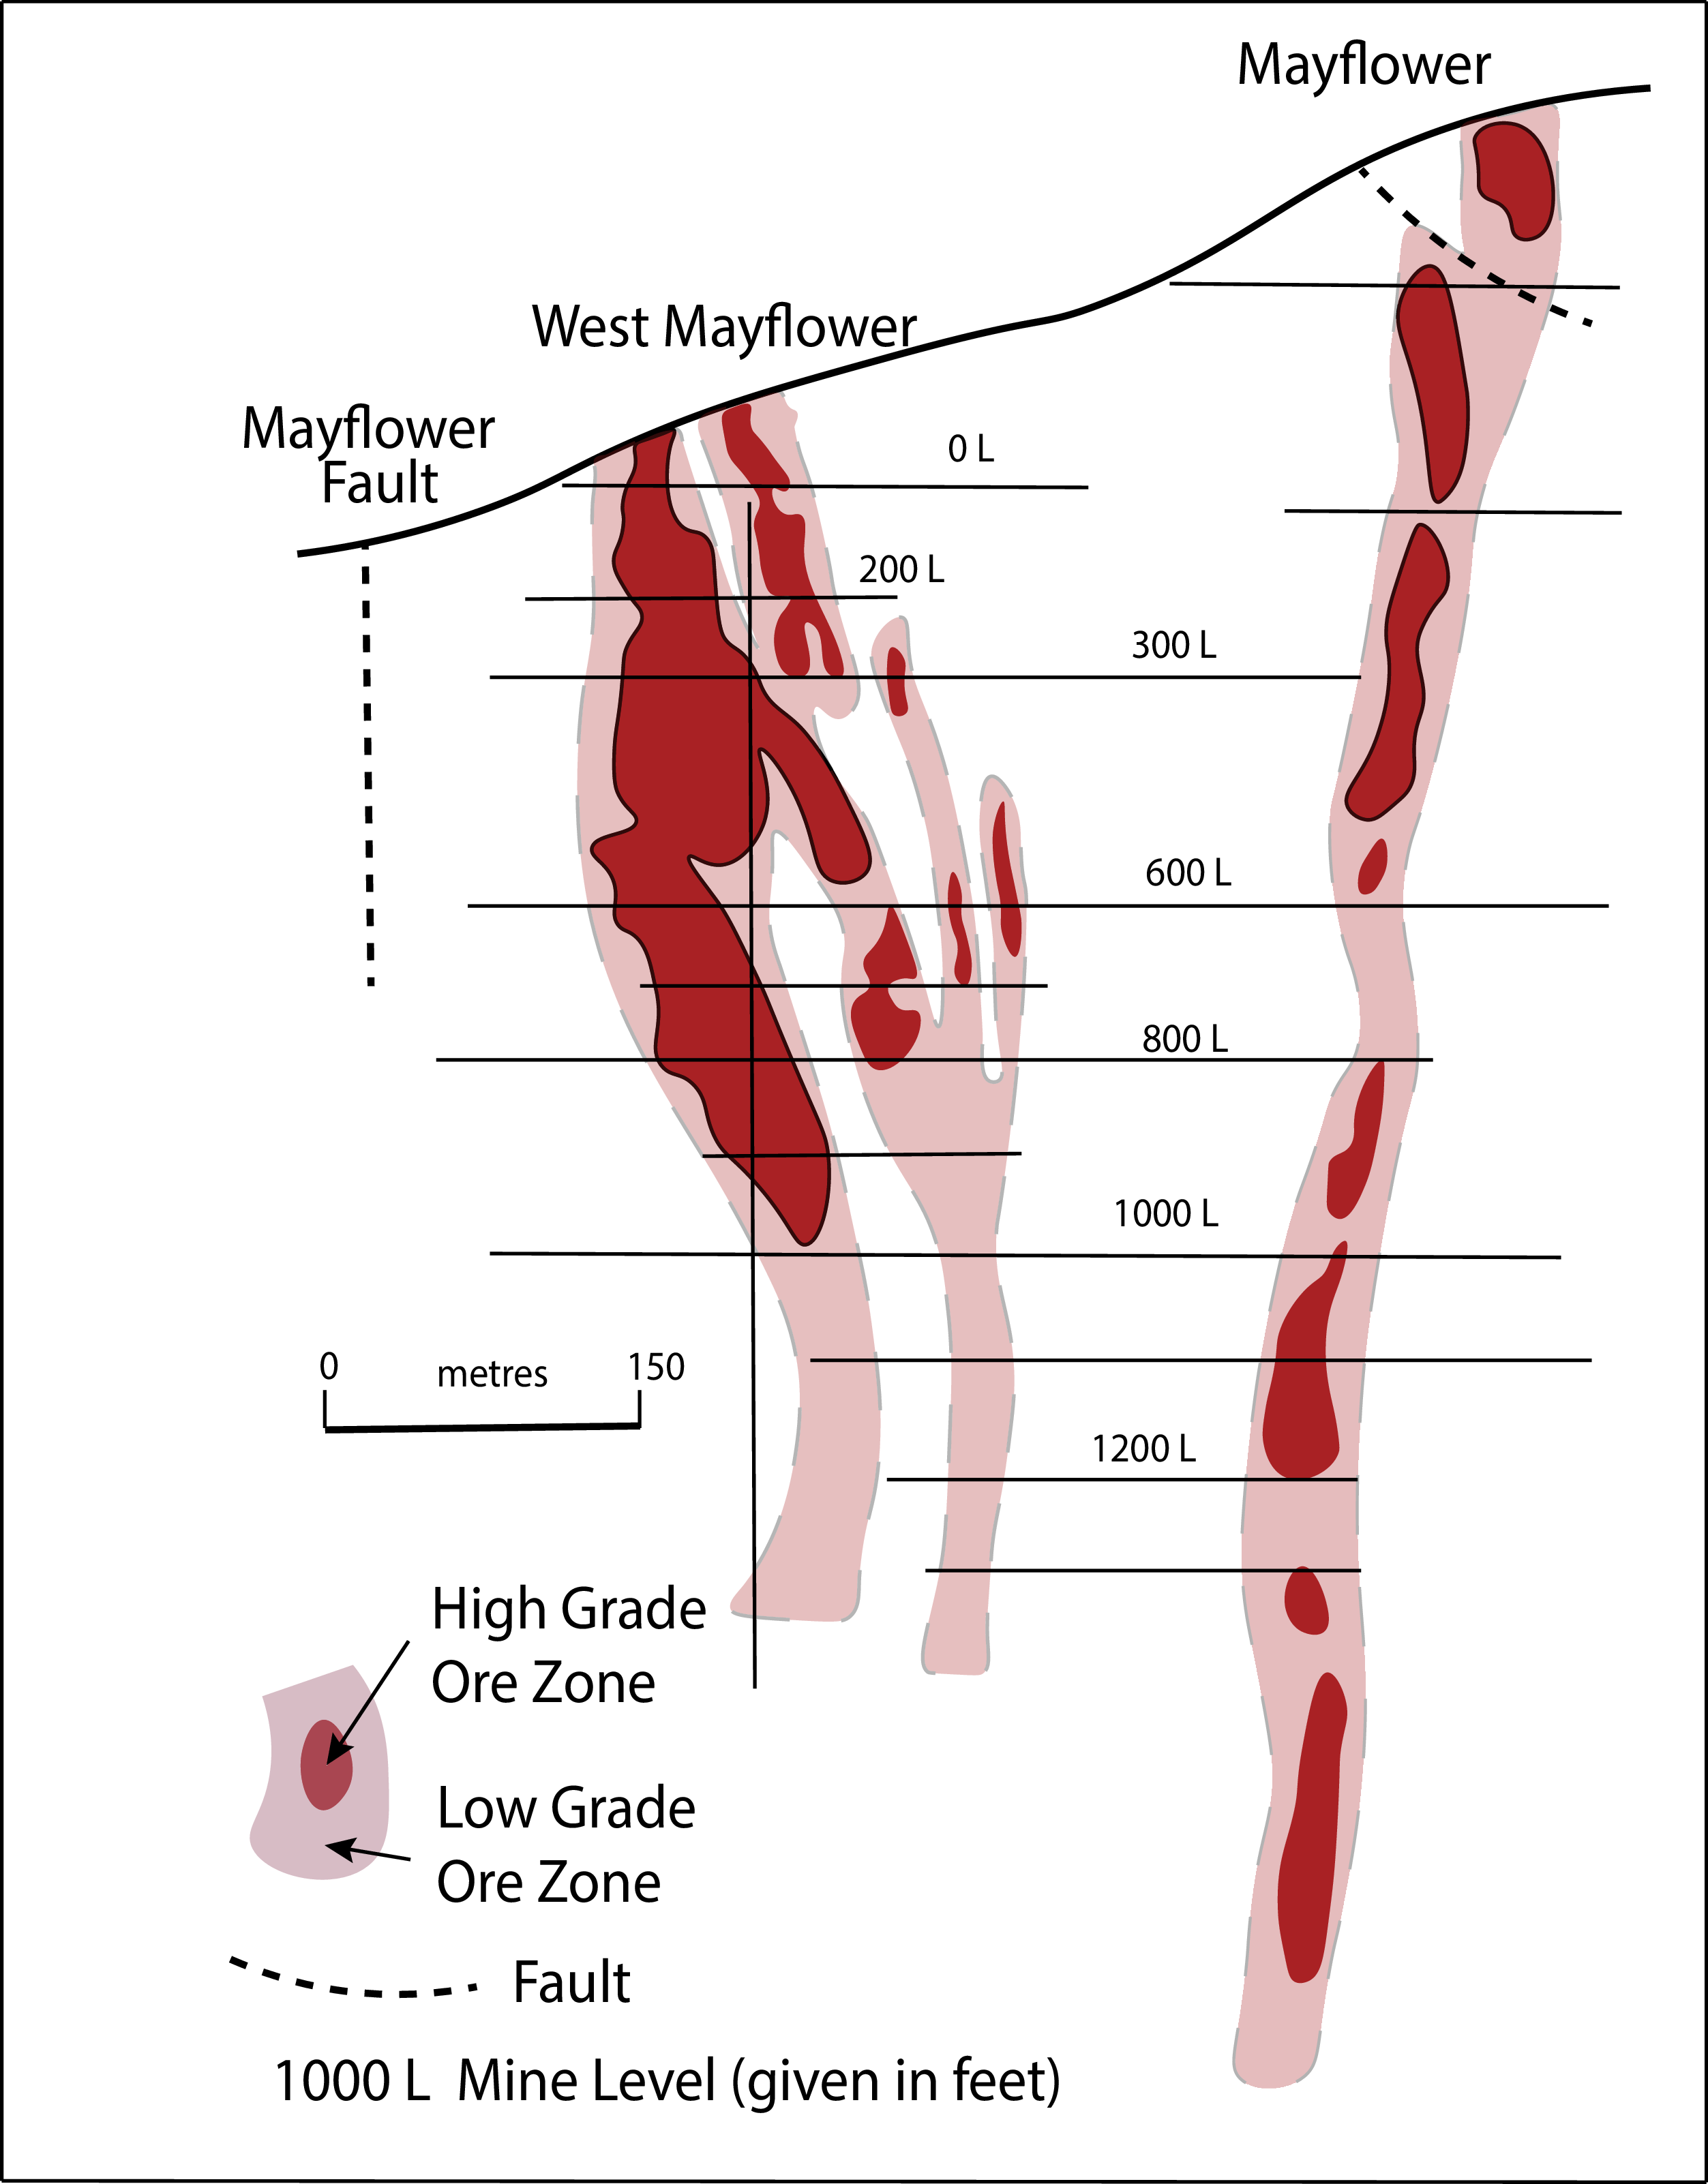
The Mayflower ore zone is steeply dipping to vertical in a structure with a strike length of 900 m and a width of 15 to 20 m and in the Cambrian Meagher Formation. The ore occurs in two lens-shaped ore shoots (Mayflower and West Mayflower), which are open at depths. The Mayflower and West Mayflower ore shoots have strike lengths of 15 to 35 m and 70 to 100 m, respectively, and widths of 1 to 5 m and 2 to 7 m, respectively (Figs. 7 and 8). Minor displacement on reverse and strike-slip faults results in the ore shoots being discontinuous.
Longitudinal section (see A-A’ in Figure 6) through the Mayflower deposit showing the locations of the high- and low-grade ore zones (after Cocker, Reference Cocker1993). The levels indicated are given in feet.
Gold mineralisation occurs in quartz veins, dolomite, silicified limestone, shale, quartz-rich breccias and shaley limestone as disseminations, vein fillings, and replacement bodies (Cocker, Reference Cocker1993). According to Cocker (Reference Cocker1993), alteration consists of silicified cores that grade into potassic zones characterised by adularia, V-muscovite, roscoelite, quartz, pyrite, and rutile. The potassic zone, in turn, grades into a hydrothermal dolomite zone, which may be up to 40 m wide.
Detailed petrographic studies herein suggest a five-stage paragenetic sequence (Supplementary Figure S2). The first two stages in the ore shoots are characterised by pyrite and sphalerite. Stage 1 pyrite and sphalerite are variable in size (up to 0.2 mm in diameter) and show a variety of anhedral grain shapes. Colloform pyrite, in places, is in-filled with sphalerite. Stage 2 sphalerite and pyrite are coarser grained (up to 0.3 mm in diameter) and occur in quartz-dolomite veins that cross-cut stage 1 pyrite-sphalerite-dolomite-quartz intergrowths. Stage 3 mineralisation is sulphur-poor and tellurium-rich compared to stages 1 and 2 and occurs as a replacement of stage 2 veins. It consists of native gold, native tellurium, calaverite (AuTe2), krennerite ((Au,Ag)Te2), petzite (Ag3AuTe2), altaite (PbTe), tetrahedrite, and minor pyrite (Fig. 5d). Stage 4 mineralisation is volumetrically and economically more important and more silver- and base metal- rich than stage 3 mineralisation and occurs as fine to coarse veins of tellurides that, in places, cross-cut stage 3 veins. The bonanza-grade samples reported by Cocker (Reference Cocker1993) and Spry and Thieben (Reference Spry and Thieben1996) are from stage 4 mineralisation (Figs. 5e), which contains electrum, sylvanite ((AuAg)Te2), stützite (Ag5-xTe3), petzite, hessite (Ag2Te), coloradoite (HgTe), altaite, nagyagite (Pb5Au(Sb,Bi)Te2S6), benleonardite, cervelleite, tetrahedrite, tennantite, pyrite, galena, sphalerite, and marcasite, as well as trace chalcopyrite (Fig 5e, f). A variant of stage 4 that occurs in places is a coarse intergrowth of sphalerite, galena, and pyrite that contains trace amounts of hessite, tetrahedrite and chalcopyrite. Rare cross-cutting relationships between base metal-rich and base-metal-poor stage 4 veins suggest that the base metal-rich variant of stage 4 may have formed slightly after the base metal-poor variant. By comparison to all other stages, stage 4 mineralisation is also characterised by the greatest variety of gangue and alteration minerals, which include quartz, dolomite, calcite, sericite, roscoelite, chlorite, adularia, zircon and rutile. Stage 5 is rare but consists of an assemblage dominated by Au-rich electrum intergrown with hessite, sphalerite, tetrahedrite, chalcopyrite, sericite, calcite, and quartz, which occur as rims on stage 4 Au-poor electrum.
Native gold/electrum formed in stages 3, 4, and 5 and exhibits a wide range of compositions (Table 3). In stage 3, grains of gold (up to 0.3 mm in diameter) with a fineness of 846-871, are intergrown with calaverite and petzite (Fig. 5d) or occur as isolated grains in quartz or dolomite. A rare assemblage of native gold-petzite-hessite-nagyagite-altaite-pyrite was also observed. Native gold/electrum, with a fineness of 447–820, formed during stage 4 as grains up to 2 mm in length. It occurs in a variety of telluride-bearing assemblages, including electrum-hessite, electrum-hessite-petzite±galena±sphalerite±pyrite±tetrahedrite, electrum-hessite-benleonardite±tetrahedrite±pyrite± chalcopyrite, electrum-hessite-coloradoite-altaite-galena, as rare intergrowths of native gold-sylvanite-petzite-stützite-nagyagite-altaite and native gold-petzite-stützite-hessite-galena-pyrite. Overgrowths of electrum, up to 80 μm in width, with a fineness of 654 to 712 on electrum with a lower fineness, characterise stage 5 assemblages. Inclusions of chalcopyrite, hessite, tetrahedrite, pyrite, quartz, dolomite, calcite, and sericite occur in stage 5 electrum.
Representative electron microprobe analyses of tellurium and gold-bearing minerals from the Mayflower deposit
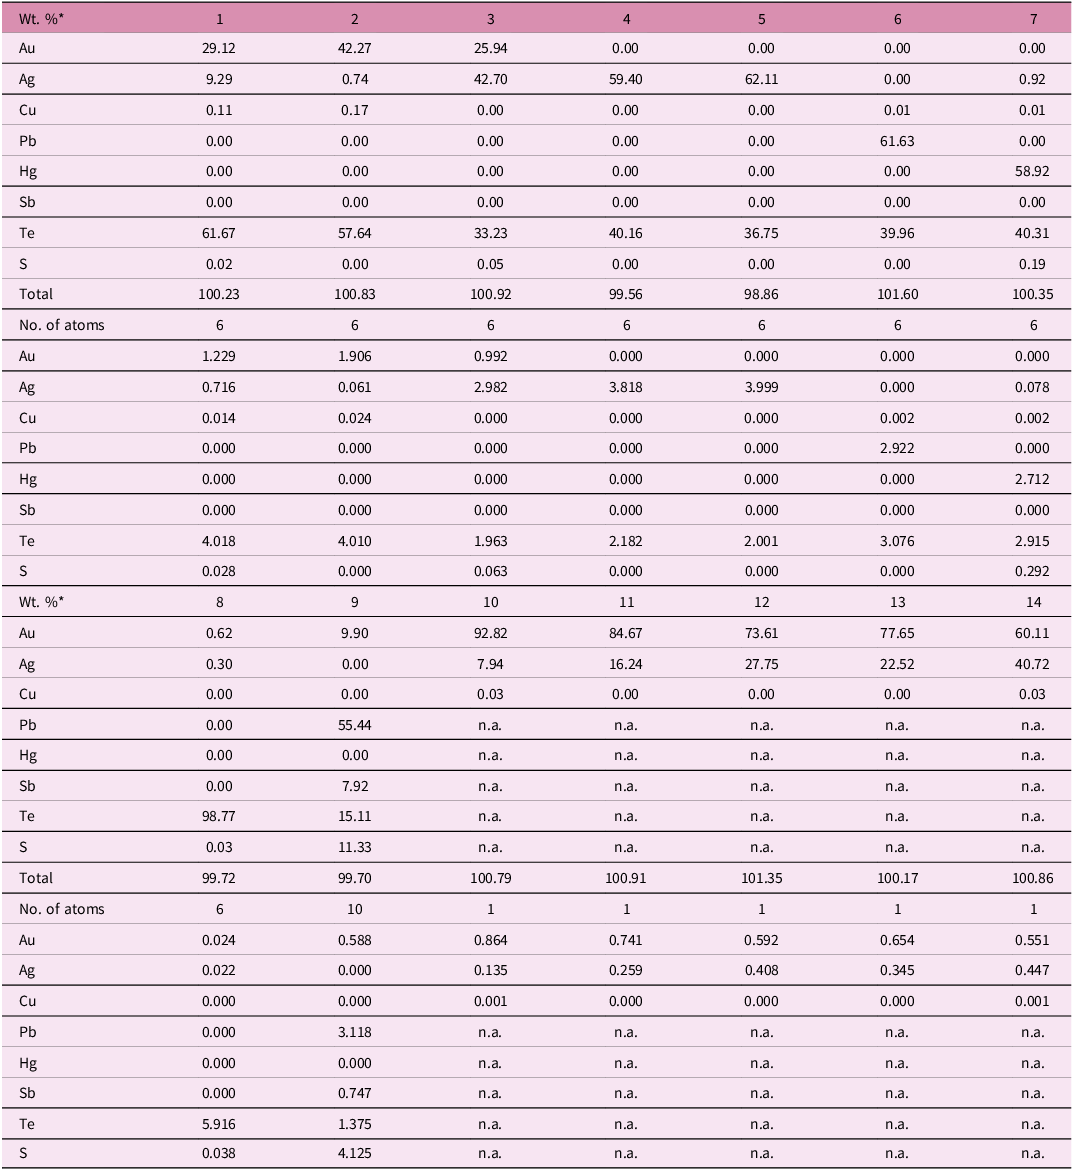
1 sylvanite (M2A); 2 calaverite (M17544); 3 petzite (9452M); 4 stützite (M2A); 5 hessite (M96-8A); 6 altaite (M95-7); 7 coloradoite (695-10B); 9 nagyagite (605-20B); 10 native gold (17650, stage 3); 11 electrum (17645, stage 5); 12 electrum (17645, stage 4); 13 electrum (17419, stage 5); 14 electrum (17419, stage 5).
* Bi, Zn, Fe, As, Sb and Se were also analysed but were not detected in Te-bearing minerals except for nagyagite.
* Zn, Fe, As, Pb, Hg, Te, Se and S were also analysed but were not detected in native gold/electrum.
Although native gold and electrum are important carriers of gold and silver, precious metal tellurides are more significant. Stage 3 tellurides are generally more gold-rich than stage 4 tellurides since calaverite and krennerite are restricted to stage 3. Calaverite and krennerite occur as intergrowths with native tellurium, whereas petzite and hessite are rare in stage 3. A shift to more silver-rich tellurides in stage 3 is reflected by the presence of sylvanite, petzite, hessite, and stützite, and the absence of calaverite and krennerite. Spectacular samples of coarse stage 4 sylvanite, up to several cm in length, coexisting with native tellurium and with stützite, hessite, petzite, and coloradoite (Figs. 5e) were identified. Representative compositions of tellurides and native minerals are given in Table 3.
A key mineral that distinguishes stage 3 assemblages from stage 4 assemblages is galena. The only Pb minerals in stage 3 are altaite and nagyagite, whereas these minerals and abundant galena characterise stage 4 assemblages. Altaite commonly coexists with hessite and sylvanite in stage 4 veins. Galena is most abundant at the end of stage 4, where it occurs as coarse intergrowths with Fe-poor sphalerite (Table 4), pyrite and marcasite. Galena is devoid of trace amounts of Bi, Ag, and Se, and, in this respect, differs considerably from that in the nearby Golden Sunlight gold-silver telluride deposit (5 km from north of Mayflower), which contains galena with up to 6.7 wt % Bi, 6.4 wt % Se, and 4.0 wt % Ag (Spry et al. Reference Spry, Foster, Truckle and Chadwick1997). However, considering the low proportion of pyrite relative to tellurides and other sulphides in stage 3 veins, the contribution of ‘invisible gold’ to the overall gold budget at Mayflower is likely to be insignificant.
Compositions of sulphosalts and sulphides from Mayflower
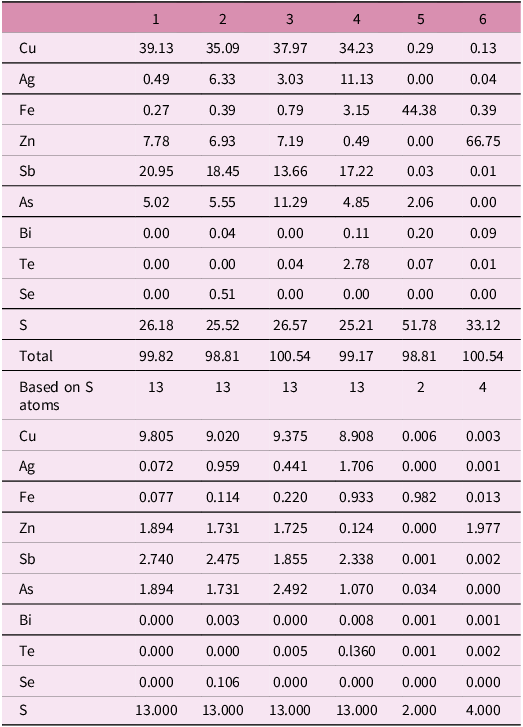
1 tetrahedrite (16930A); 2 tetrahedrite (M-1); 3 tennantite (697-6F); 4 tetrahedrite (17419); 5 pyrite (17645M); 5 sphalerite (695-75).
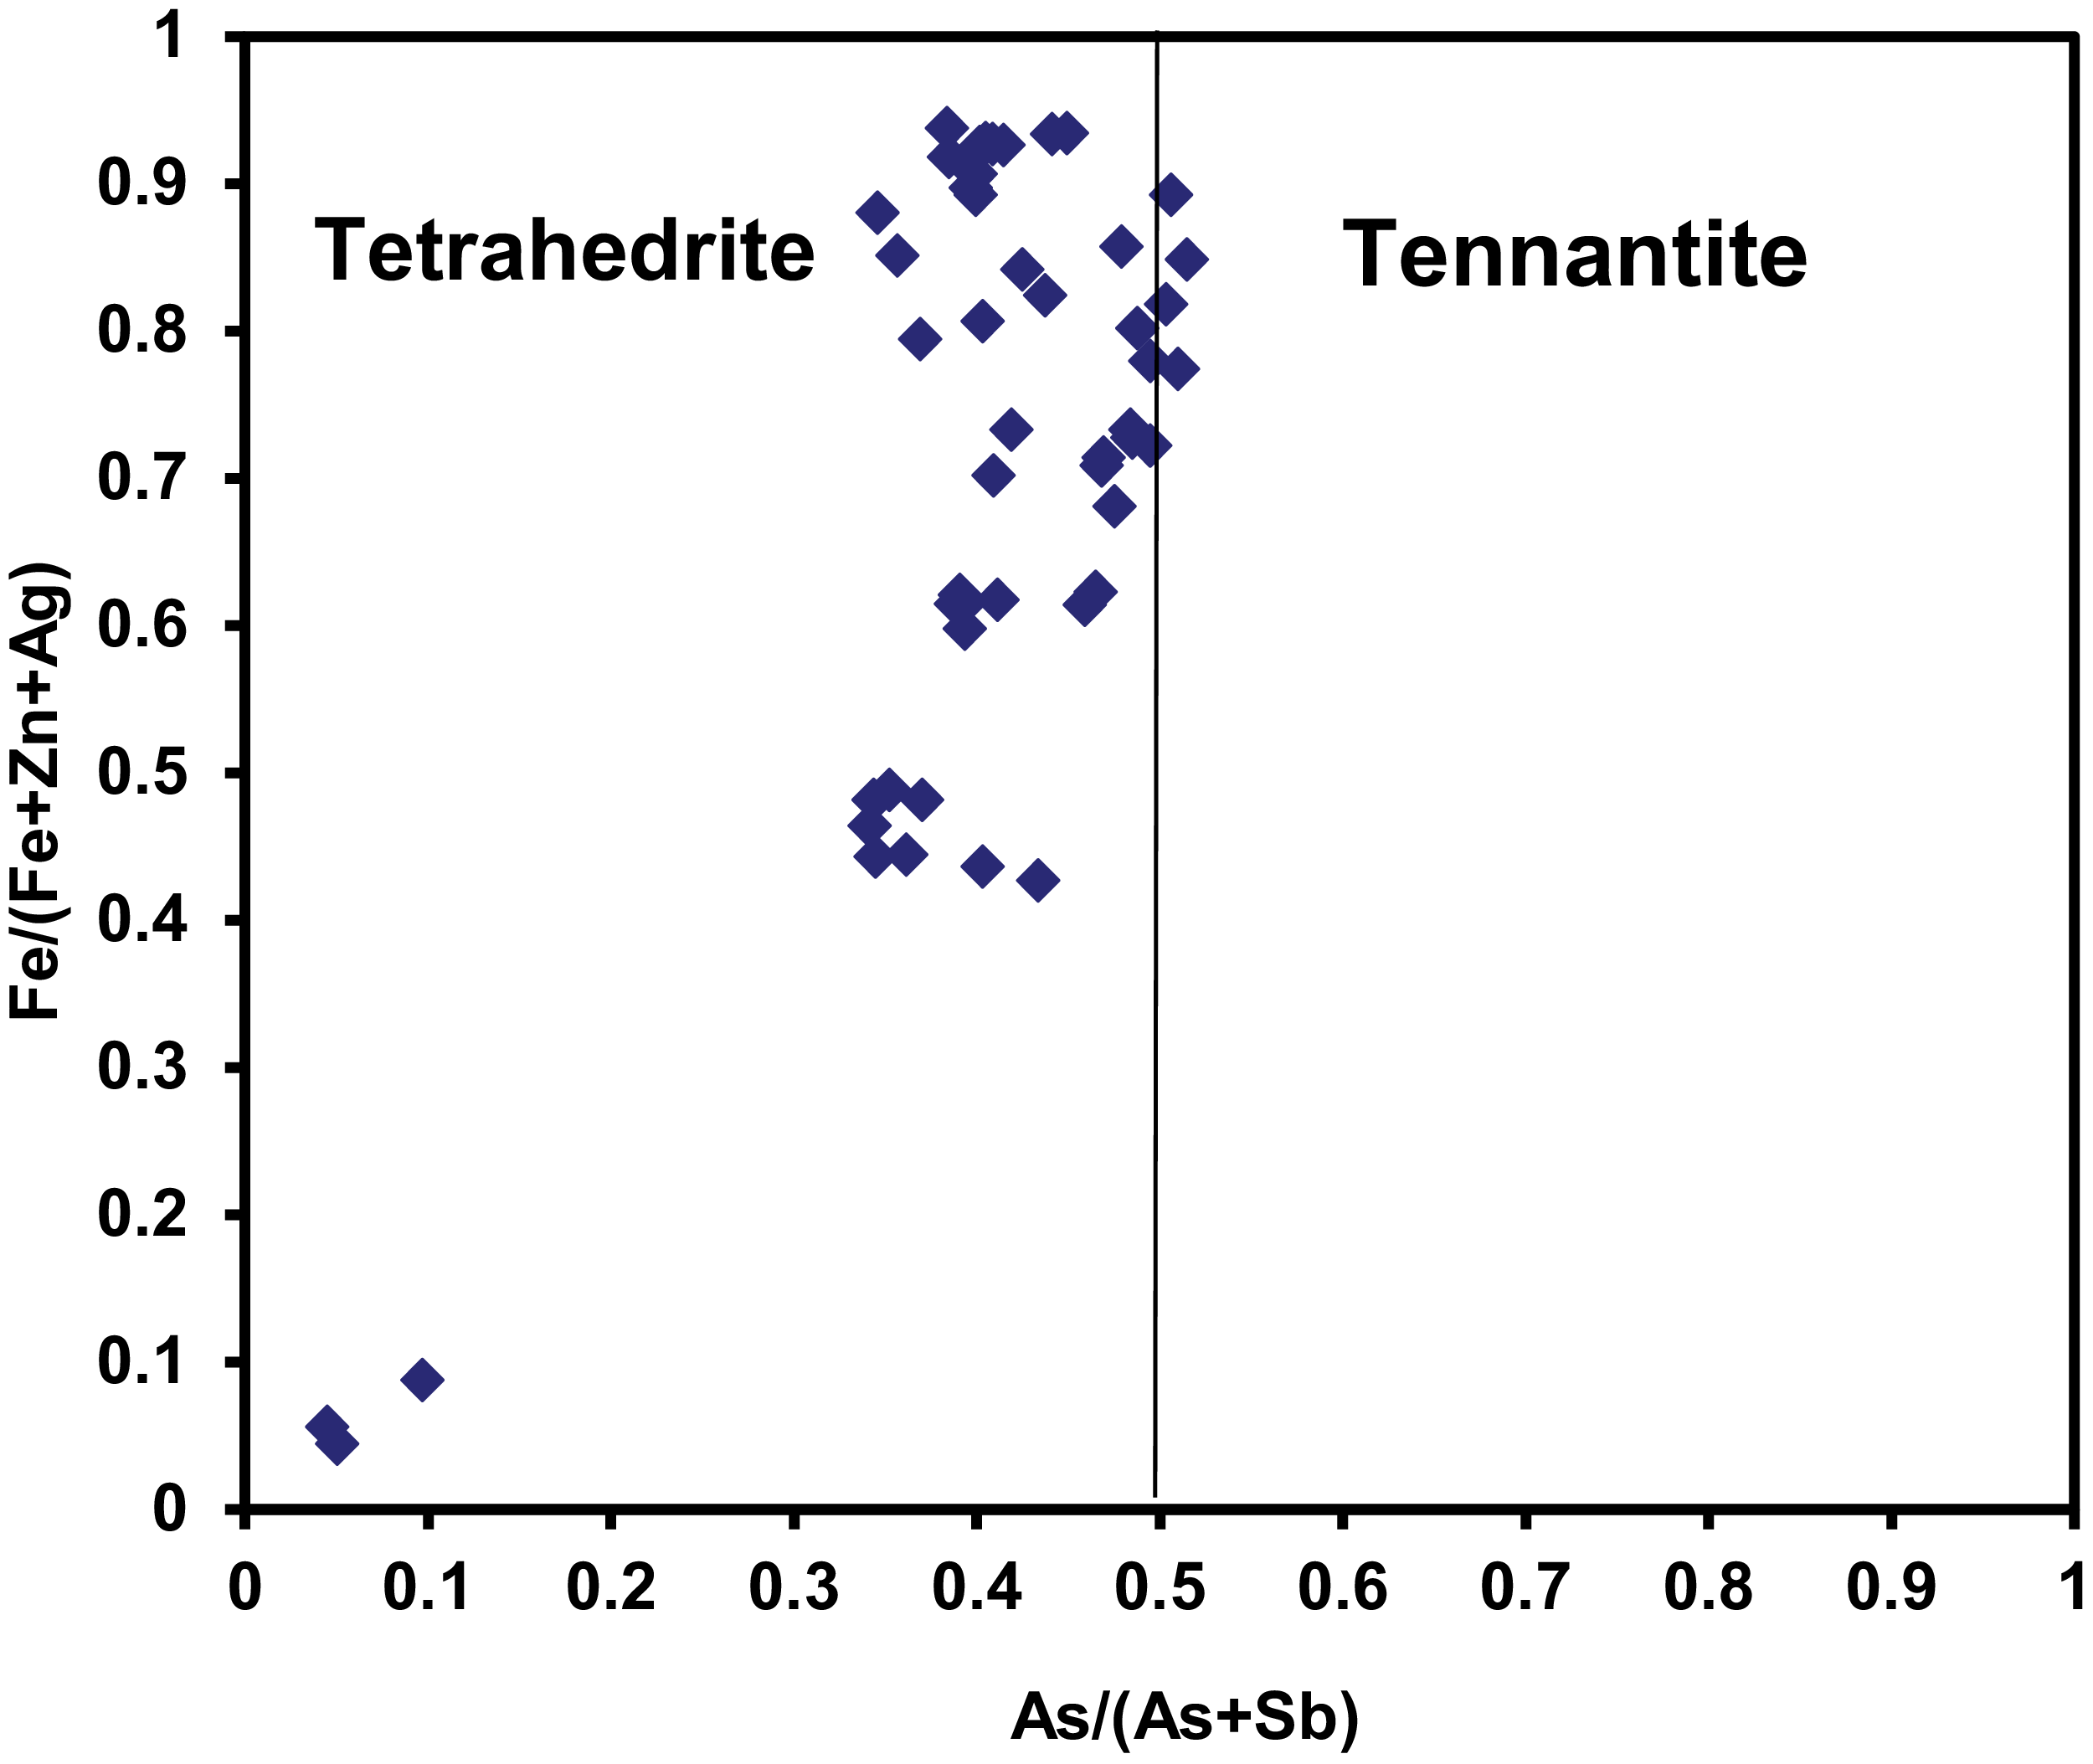
Cocker (Reference Cocker1993) reported that tetrahedrite, freibergite (Ag6[Ag6]4+),Cu4 C 2+ 2)Sb4S12S0-1, where C is occupied by, for example, Zn, Fe and Cd, and gold-bearing freibergite were present in the Mayflower deposit. Although tetrahedrite, which contains up to 13.0 wt. % Ag (Table 4; Fig. 9), is identified here, the identification of freibergite and gold-rich freibergite remains in doubt due to an absence of compositional data. Tennantite, which is far less common than tetrahedrite, contains considerably smaller amounts of Ag (< 0.45 wt % Ag).
Chemical variation of tetrahedrite–tennantite fahlores from the Mayflower deposit as a function of Fe/(Fe+Zn+Ag) versus As/(As+Sb). Note that tetrahedrite is the predominant fahlores.
4.c. Judith Mountains deposits
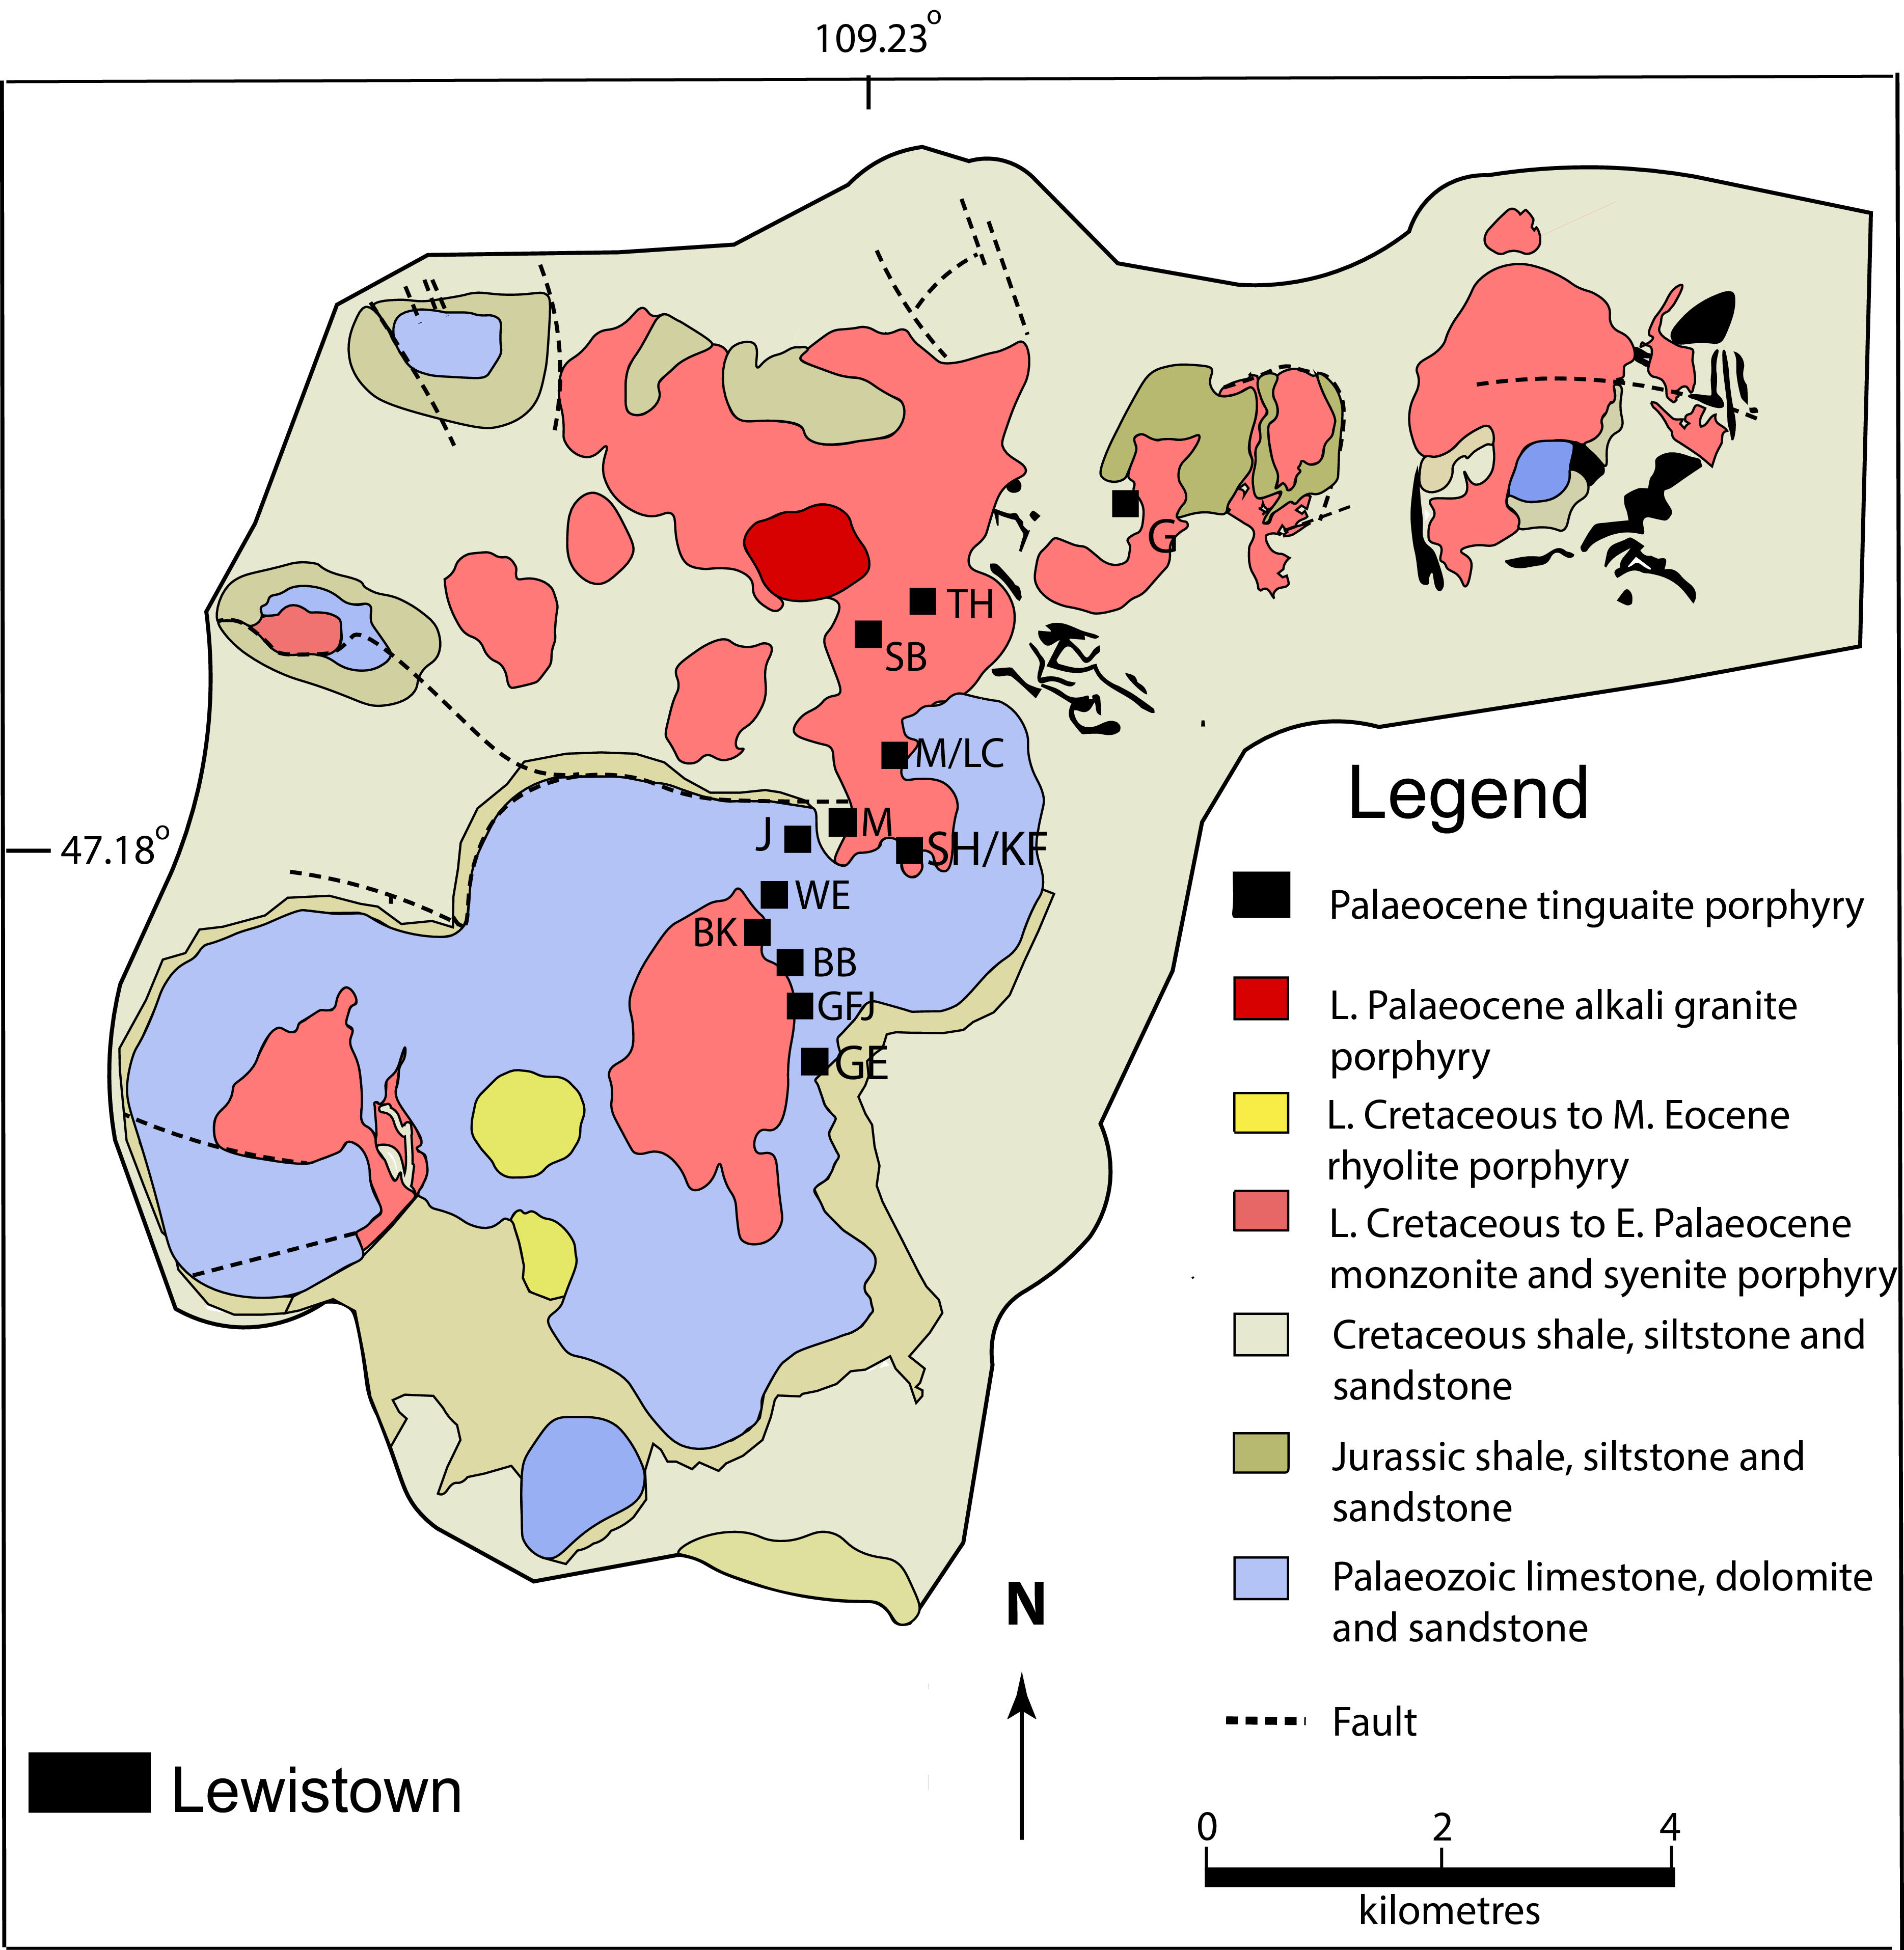
The Judith Mountains are composed of sixteen felsic, porphyritic, laccoliths and stocks of rhyolite, syenite, monzonite, and quartz monzonite that intrude Palaeozoic sedimentary rocks (e.g. Weed & Pirsson, 1897; Woodward, Reference Woodward1995) (Fig. 10). Five types of Late Cretaceous-Early Tertiary deposits are associated with these rocks (Woodward, Reference Woodward1995): 1. Disseminated gold deposits ± other metals in limestone and skarn; 2. Gold ± silver ± subordinate base metals mainly in veins, shear zones, and stockworks hosted by intrusive rocks and siliclastic rocks; 3. Base metal deposits in Palaeozoic carbonates; and 4. Disseminated copper ± other metals hosted by intrusives. Estimates of up to ∼20 t Au have been derived from > 90 named and unnamed mines and prospects (Woodward, Reference Woodward1995). Of these gold deposits, the five largest gold telluride deposits are Spotted Horse-Kentucky Favourite (∼7.8 t Au), Maginnis (∼2.8 t Au), Gies (∼1.2 t Au), Cumberland (∼1 t Au) and Gilt Edge (∼1 t Au). Other deposits that contain possible tellurides include Florence (Get Even), Allen Silver (Silver Dike), Tail Holt and Golden Jack (Woodward, Reference Woodward1995). Non-telluride-bearing Late Cretaceous-Early tertiary base and precious metal deposits spatially related to telluride deposits are also found in the Judith Mountains. Their geological characteristics are summarised in Supplementary Table S1 for comparative purposes.
Geologic map of the Judith Mountains. Abbreviations of deposits: BK Butcher Knife, G Gies, GE Gilt Edge, GFJ Great Falls and Judith, J Justice, M Maginnis, M/LC Mathews and Last Chance, SB Silver Bullion, SH/KF Spotted Horse/Kentucky Favourite, TH Tail Holt, WE War Eagle (modified after Woodward, Reference Woodward1995).
The Cretaceous-Tertiary intrusive rocks in the Judith Mountains occur along the Cat Creek fault zone, which is one of several W-NW-trending fault zones to form part of the Lewis and Clark Line (Smith, 1965). Kohrt (Reference Kohrt, Baker and Berg1991) suggested that the intersection of this lineament with a N-NE-trending structural trend, which parallels the GFTZ may have influenced the emplacement of the alkaline igneous rocks. Kohrt (Reference Kohrt, Baker and Berg1991) proposed two periods of Late Cretaceous- to Eocene-age igneous activity in the Judith Mountains: a large volume of calc-alkaline rocks followed by a small volume of alkaline igneous rocks. Radiometric age dating of alkali syenite, tinguaite, alkali granite, rhyolite, hornblende diorite, monzonite, and quartz monzonite using K-Ar, fission track, and U-Th-Pb techniques yields ages ranging from approximately 69 to 47 Ma (Marvin et al. Reference Marvin, Hearn, Mehnert, Naeser, Zartman and Lindsey1980).
The igneous rocks consist of quartz monzonite, monzonite, syenite, diorite, rhyolite, alkali granite, and tinguaite (Weed & Pirsson, Reference Weed and Pirsson1898; Wallace, Reference Wallace1953, Reference Wallace1956; Zhang & Spry, Reference Zhang and Spry1994b; Olinger et al. Reference Olinger, Andersen, Griffis, Mercer and Smith2024). Breccias associated with the emplacement of the intrusive rocks are widespread throughout the Judith Mountains and are commonly associated with hydrothermal mineralisation. The composition of five quartz monzonite porphyries obtained herein from the Gold Hill intrusive complex porphyry is given in Table 2 and schematically shown in Figure 3, along with monzonitic rocks and tinguaite porphyries spatially adjacent to the Gies deposit that are given in Zhang and Spry (Reference Zhang and Spry1994b). Although monzonitic stocks and laccoliths are the most common rock types in the Judith Mountains, rhyolite also occurs as stocks and dykes throughout the Judith Mountains, whereas tinguaite dykes occur predominantly in the eastern part. The presence of inclusions of Precambrian rocks in various intrusions (e.g. Marvin et al. Reference Marvin, Hearn, Mehnert, Naeser, Zartman and Lindsey1980) demonstrates that alkaline igneous rocks intruded the Precambrian basement.
Sedimentary rocks of Cambrian, Devonian, Mississippian, Jurassic, and Cretaceous age, consisting of quartzite, limestone (some of which is fetid), shale, sandstone, mudstone, and siltstone were intruded by the igneous intrusions. The Mission Canyon Limestone and the Lodgepole Limestone of the Mississippian Madison Group host many of the disseminated gold deposits including Giltedge.
Although the geological setting of individual occurrences is described in various degrees of detail in Woodward (Reference Woodward1995), the current study focuses on deposits in the Gold Hill mining district (Spotted Horse-Kentucky Favourite, Maginnis, and Cumberland deposits), and the Giltedge and Gies deposits.
4.c.1. Gold Hill mining district
The Gold Hill mining district was the biggest gold producer in the Judith Mountains. The deposits occur on the margins of the Gold Hill intrusive complex in and adjacent to tectonic breccias and Cambrian, Mississippian, and Cretaceous sedimentary rocks (Woodward, Reference Woodward1995). The intrusive complex consists of multiple phases of quartz monzonite porphyry, brecciated blocks of Palaeozoic sedimentary rocks, rhyolite dykes, and tectonic and intrusive breccias, which appear to have been emplaced along faulted contacts with the Crystal Peak and Maiden Peak porphyries.
The most prominent structure in the Judith Mountains is the Warm Springs Fault, which trends N 75o W and has a horizontal displacement of 200 to 300 m. It terminates near the western margin of the Gold Hill porphyry. A northeast-trending set of faults is very prominent and postdates the Gold Hill porphyry but predates intrusion breccias that form near the end of the intrusive period. These faults appear to have localised ore deposition.
4.c.2. Spotted Horse-Kentucky Favourite
The Spotted Horse-Kentucky Favourite deposits consists of several NNE-trending lodes in a complex zone of Gold Hill quartz-monzonite porphyry, Madison Group limestone, polylithic breccias (Fig. 5 g, h), and Cambrian shales and conglomerates (Woodward, Reference Woodward1995). According to R.A. Forrest (unpub. MS thesis, Montana College of Mineral Science and Technology, 1971), limestone replacement bodies, fissure fillings and veins, porphyry replacement, and breccia characterise the gold telluride mineralisation. Roscoelite in a roscoelite-fluorite-quartz-carbonate vein yielded a date of 59.2 to 58.8 ± 2.1 m.y., which probably represents the age of gold-silver telluride mineralisation (Marvin et al. Reference Marvin, Hearn, Mehnert, Naeser, Zartman and Lindsey1980)
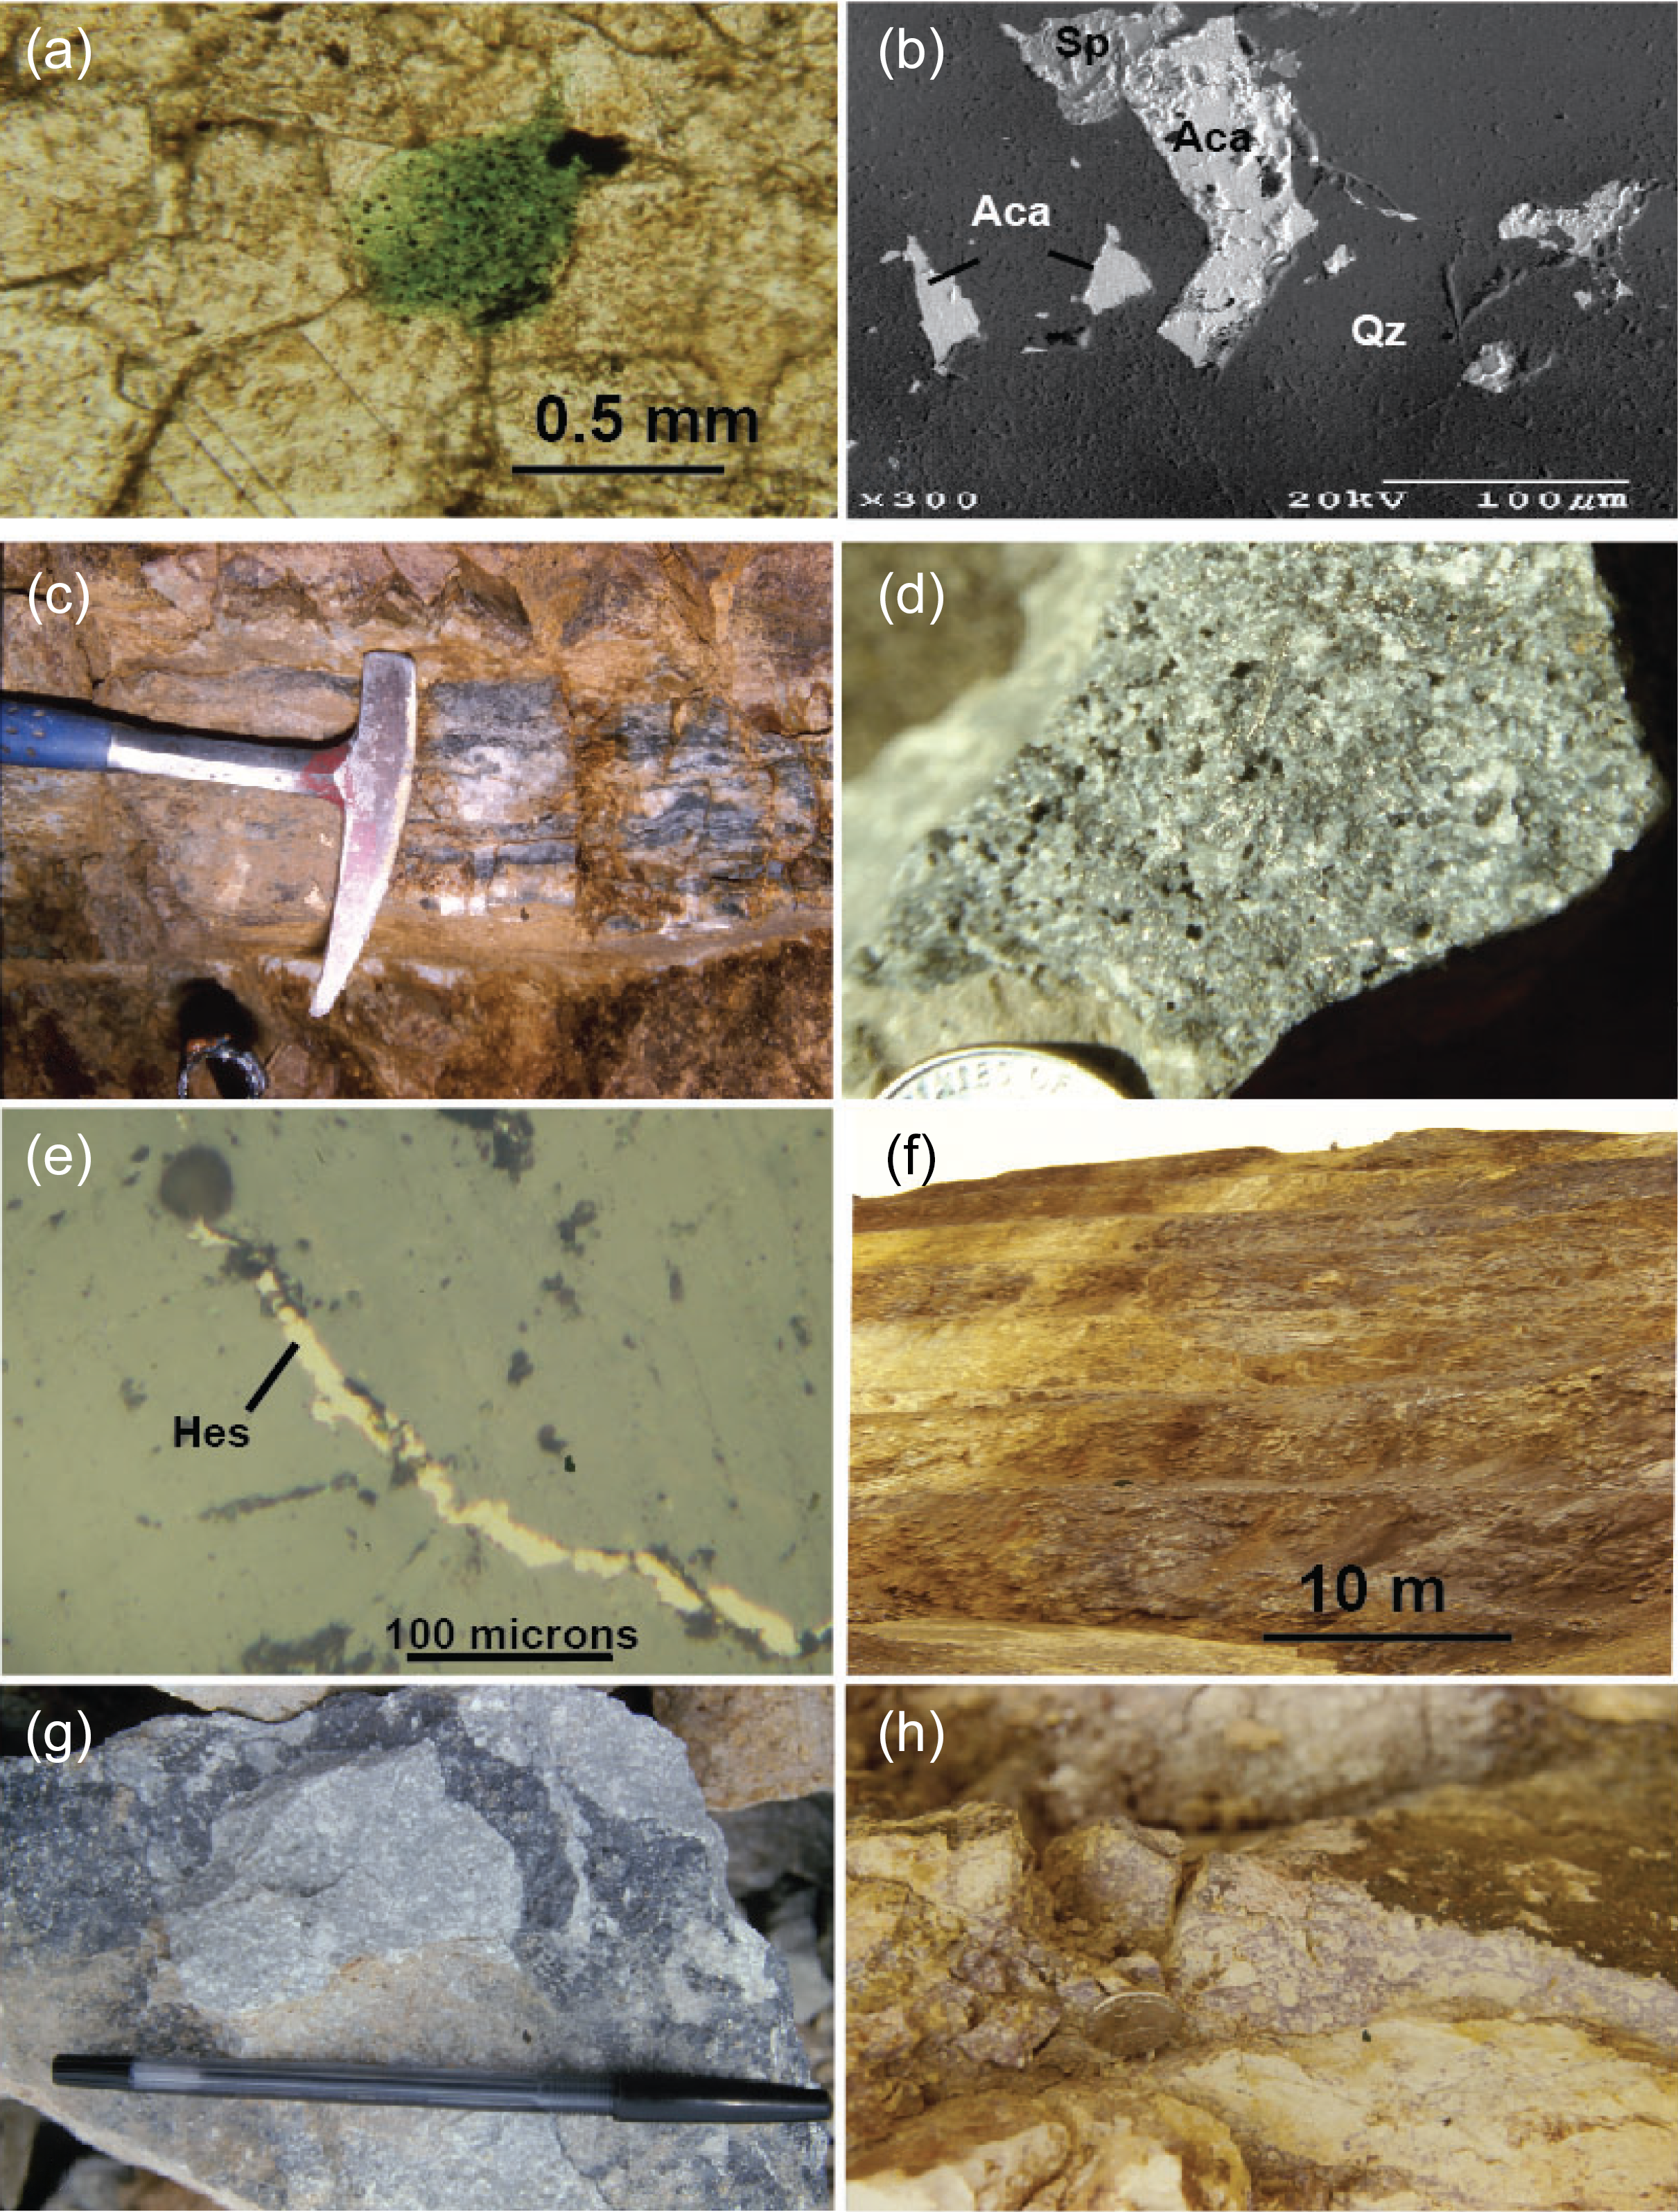
Limestone replacement ore averages 110 to 225 g/t Au and is the most important ore type economically. It occurs as disseminations in bleached limestone, fluorite and roscoelite (Fig. 11a). Fissure ore consists of multiple fracture fillings in zones up to 1.5 m wide of veinlets in Palaeozoic sedimentary rocks, whereas porphyry replacement ore is characterised by veinlets in Gold Hill porphyry adjacent to its contact with the Madison limestone. Breccia ore is volumetrically the most important ore type and averages 14 to 40 g/t Au. The breccias consist mostly of fragments of Gold Hill porphyry with lesser amounts of Madison Group limestone (Fig. 5h). It is generally silicified and contain veinlets of kaolinite. In general, the nature of the orebodies is complex and consists of more than one ore type, reflecting deposition at intrusive-sediment contacts and repeated movement along faults.
a. Roscoelite grain in recrystallised limestone from the Spotted Horse deposit. b. BSE image of acanthite (Aca) in quartz (Qz) and coexisting with sphalerite (Sp) from the Spotted Horse deposit. c. Quartz-telluride-roscoelite vein from the Gies deposit. d. Sylvanite crystals perched on quartz in a quartz vein, Gies deposit. d. Hessite veinlet in quartz (plane-polarised reflected light image), Gies deposit. e. Oxidized ore zone in the Kendall open-cut pit. f. Sphalerite-pyrite-telluride vein in syenite in the Gold Bug pit, Landusky deposit. g. Brecciated fluorite ore in the Alabama pit, Zortman deposit.
Descriptions of the ore mineralisation by Woodward and Giles (Reference Woodward, Giles and Hunter1993) and Woodward (Reference Woodward1995) suggest that the ore consists of native gold along with sylvanite and petzite. Gold in each of the ore types is spatially associated with fluorite, quartz, calcite, dolomite, pyrite, roscoelite (Fig. 11a), base metal sulphides, adularia and late-stage kaolinite. A modified version of the paragenetic sequence of ore deposition determined by R.A. Forrest (unpub. MS thesis, Montana College of Mineral Science and Technology, 1971), incorporates new mineralogical studies undertaken herein (Supplementary Figure S3). Native gold (14.53 to 17.95 wt. % Ag; n = 11) occurs as sponge-like aggregates commonly around pyrite grains or sylvanite-petzite intergrowths and is mostly secondary in origin. Grains of primary gold are rare and, where present, are intergrown with hessite. In addition to sylvanite (8.02 to 9.23 wt. % Ag; n = 28), which is the most common gold-bearing mineral in the Spotted Horse-Kentucky Favourite deposits, other tellurides include petzite and krennerite (3.24 to 7.20 wt. % Ag; n = 7), hessite, and rare altaite. Tellurides are commonly intimately intergrown with roscoelite, sericite, illite and fluorite. Quartz is fine-grained and commonly chalcedonic.
Pyrite exhibits a variety of forms ranging from round fine-grained aggregates disseminated in limestone, subhedral to euhedral grains of variable size (30 μm to 1 mm), pitted anhedral to subhedral grains, rare colloform grains, and aggregates of grains. Tellurides, haematite, sulphides (sphalerite, acanthite (Fig. 11b), galena, chalcopyrite and rare aikinite (PbCuBiS3), and sulphosalts (tennantite and proustite) occur as inclusions in subhedral to euhedral pyrite. Coarse masses of sphalerite, galena, and chalcopyrite are locally present along with intergrowths of proustite, tennantite, and hessite.
4.c.3. Cumberland and Maginnis deposits
The Cumberland deposit is developed as an E-W-trending vein along the contact between the Gold Hill stock and the Madison Limestone and at the intersection of NE- and NW-trending faults. Gold mineralisation also occurs as disseminations in monzonite porphyry (Corry, Reference Corry1933). The Maginnis deposit, located ∼0.5 km SSW of Cumberland, is primarily located in a brecciated zone up to 1.6 m wide at the contact between monzonite porphyry and silicified limestone of the Madison Group (Woodward, Reference Woodward1995). In addition, Au-bearing replacement bodies also extend a few metres into the limestone. The ore in both deposits contain native gold, sylvanite, fluorite, roscoelite, calcite, kaolinite, and minor pyrite, sphalerite and galena (Woodward, Reference Woodward1995).
4.c.4. Gies deposit
The Gies Au-Ag-Te deposit is an epithermal vein system that occurs along the contact between intrusive rocks of the Cretaceous-Tertiary Elk Creek laccolith (syenite, monzonite porphyry, and monzonite) with the Cretaceous Kootenai Formation (sandstone) (Fig. 12). Tinguaite porphyry dykes (up to 10 m wide and 1.5 km in length) cross-cut these rocks and pre-date and postdate mineralisation. Tellurides are mainly found in two NNW-trending veins that are up to 2 m wide and extend for ∼ 500m (Fig. 11c). A second set of veins trends ENE and where it intersects the first set, the highest gold grades are observed, locally as stockworks (Zhang & Spry, Reference Zhang, Spry, Baker and Berg1991, Reference Zhang and Spry1994b). The age of mineralisation is unknown, but irregularly distributed alteration is present up to 100 m away from the vein system and consists of silicification and carbonation with potassic alteration, in the form of adularia, occurring within a few metres of the veins. Minor amounts of albitisation and propylitic alteration (chlorite and clinozoisite) are also present.
Geological map of the Gies deposit (after Zhang & Spry, Reference Zhang and Spry1994b).

A four-stage paragenetic sequence was proposed by Zhang and Spry (Reference Zhang and Spry1994b) and is modified here to incorporate the more recent mineralogical findings of Spry and Thieben (Reference Spry and Thieben1996) and Bindi et al. (Reference Bindi, Spry and Pratesi2006) (Supplementary Figure S4). The mineralogy of the ore veins is complex but is dominated by quartz, roscoelite, pyrite, carbonate (calcite, dolomite, ankerite), sphalerite, and galena. The most prominent mineral assemblages in each stage are (Zhang & Spry, Reference Zhang and Spry1994b): stage 1 quartz-pyrite-roscoelite-carbonate; stage 2 quartz-pyrite-base metal sulphides-carbonates-minor tellurides-roscoelite; stage 3 quartz-tellurides-pyrite-roscoelite-base metal sulphides-sulphosalts; and stage 4 sulphides-sulphosalts-native gold. Although native gold and electrum are present in stages 3 and 4, precious metal and non-precious metal tellurides as well as native tellurium are most abundant in stages 2 and 3, with minor hessite in stage 4. Sylvanite is the most common telluride in the deposit (Fig. 11d), where it occurs in a variety of assemblages: sylvanite-stützite, sylvanite-altaite-galena ± pyrite, sylvanite-hessite, and sylvanite-nagyagite-altaite-galena. Hessite is the most common Ag-rich telluride (Fig. 11e). Other Te-bearing minerals include krennerite, nagyagite, native tellurium, and benleonardite (Supplementary Table S4).
4. d. North Moccasin Mountain deposits (Kendall mining district)
The Kendall mining district (23 t Au at an average grade of ∼1.4 g/t) occurs in and on the margins of the highly altered Palaeocene (∼66 Ma) North Moccasin Mountains laccolith, a syenite porphyry (Ikramuddin et al. Reference Ikramuddin, Asmeron, Nordstrom, Kinart, Martin, Digby and Afemari1983, Reference Ikramuddin, Besse and Nordstrom1986; Lindsey, Reference Lindsey1985; Lindsey & Naeser, Reference Lindsey and Naeser1985; Kurisso, Reference Kurisoo1991; P. Racinet unpub. M.S. thesis, University of Montana, 1994). This laccolith intruded a package of Cambrian to Cretaceous sedimentary rocks (limestone, cherty limestone, dolomite, sandstone, siltstone, black shale, mudstone). Karst breccias occur in the uppermost 85 m of limestone in the Mississippian Madison Group and host the Muleshoe, Horseshoe, Kendall, Cemetery Hill, Plum Creek, Little Dog Creek and Mason Creek deposits (Fig. 13). The first three deposits are the economically most important. The karst breccias are clast-supported and primarily contain fragments of syenite porphyry and limestone, with a fine- to coarse-grained calcite matrix.
Generalised geological map of the Kendall mine shows individual deposits (after Kurisoo, Reference Kurisoo1991).
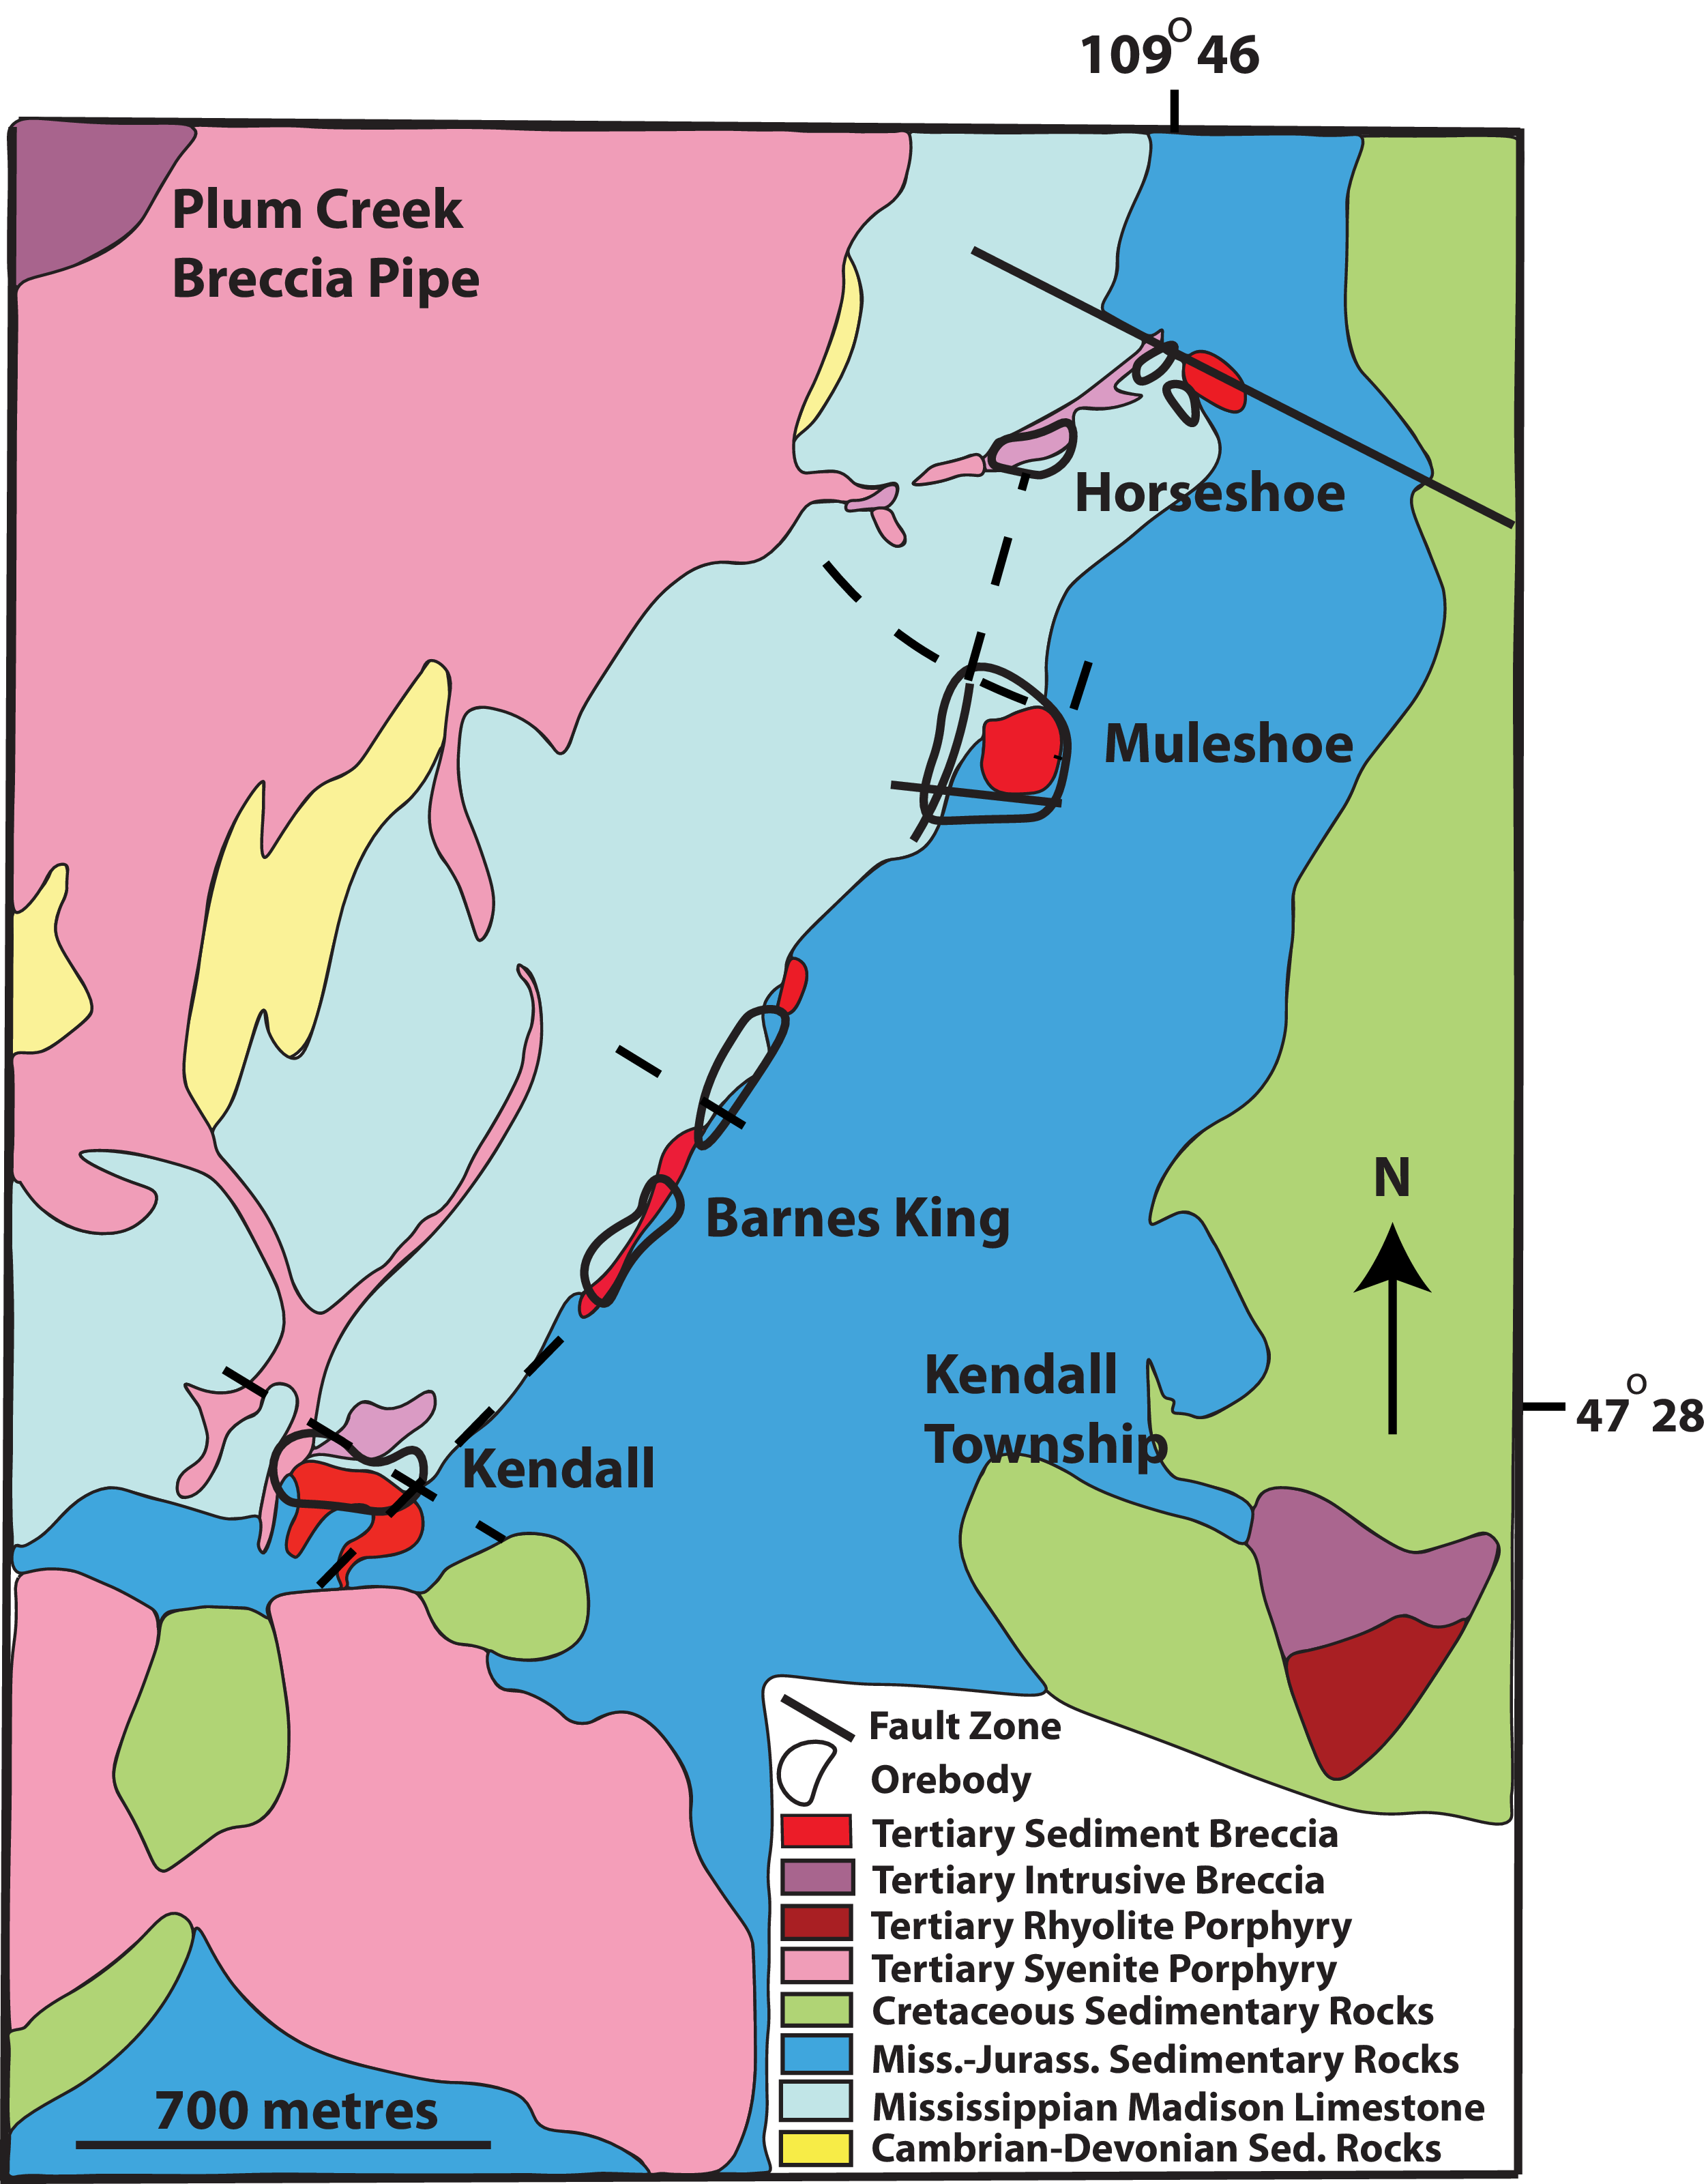
The ore zones are oxidised to about 200 m (Fig. 11f). Visible sulphides and gold are largely absent with the metallic minerals consisting of fine-grained arsenian pyrite, native gold, unidentified gold-silver tellurides, and arsenopyrite (Kurisso, Reference Kurisoo1991). Ikramuddin et al. (Reference Ikramuddin, Asmeron, Nordstrom, Kinart, Martin, Digby and Afemari1983, Reference Ikramuddin, Besse and Nordstrom1986) pointed out that the ore is enriched in As, Sb, Hg and Tl. Gangue minerals consist of calcite, fluorite, and sooty carbonaceous material, with minor quartz. Alteration is limited, but it is noted here that metallic mineralisation is locally associated with kaolinite, dolomitization, and silicification. Hydrothermal brecciation provided conduits for mineralising fluids, which assisted in karst development and the formation of associated sedimentary collapse breccias.
4.e. Little Rocky Mountain deposits (Zortman-Landusky)
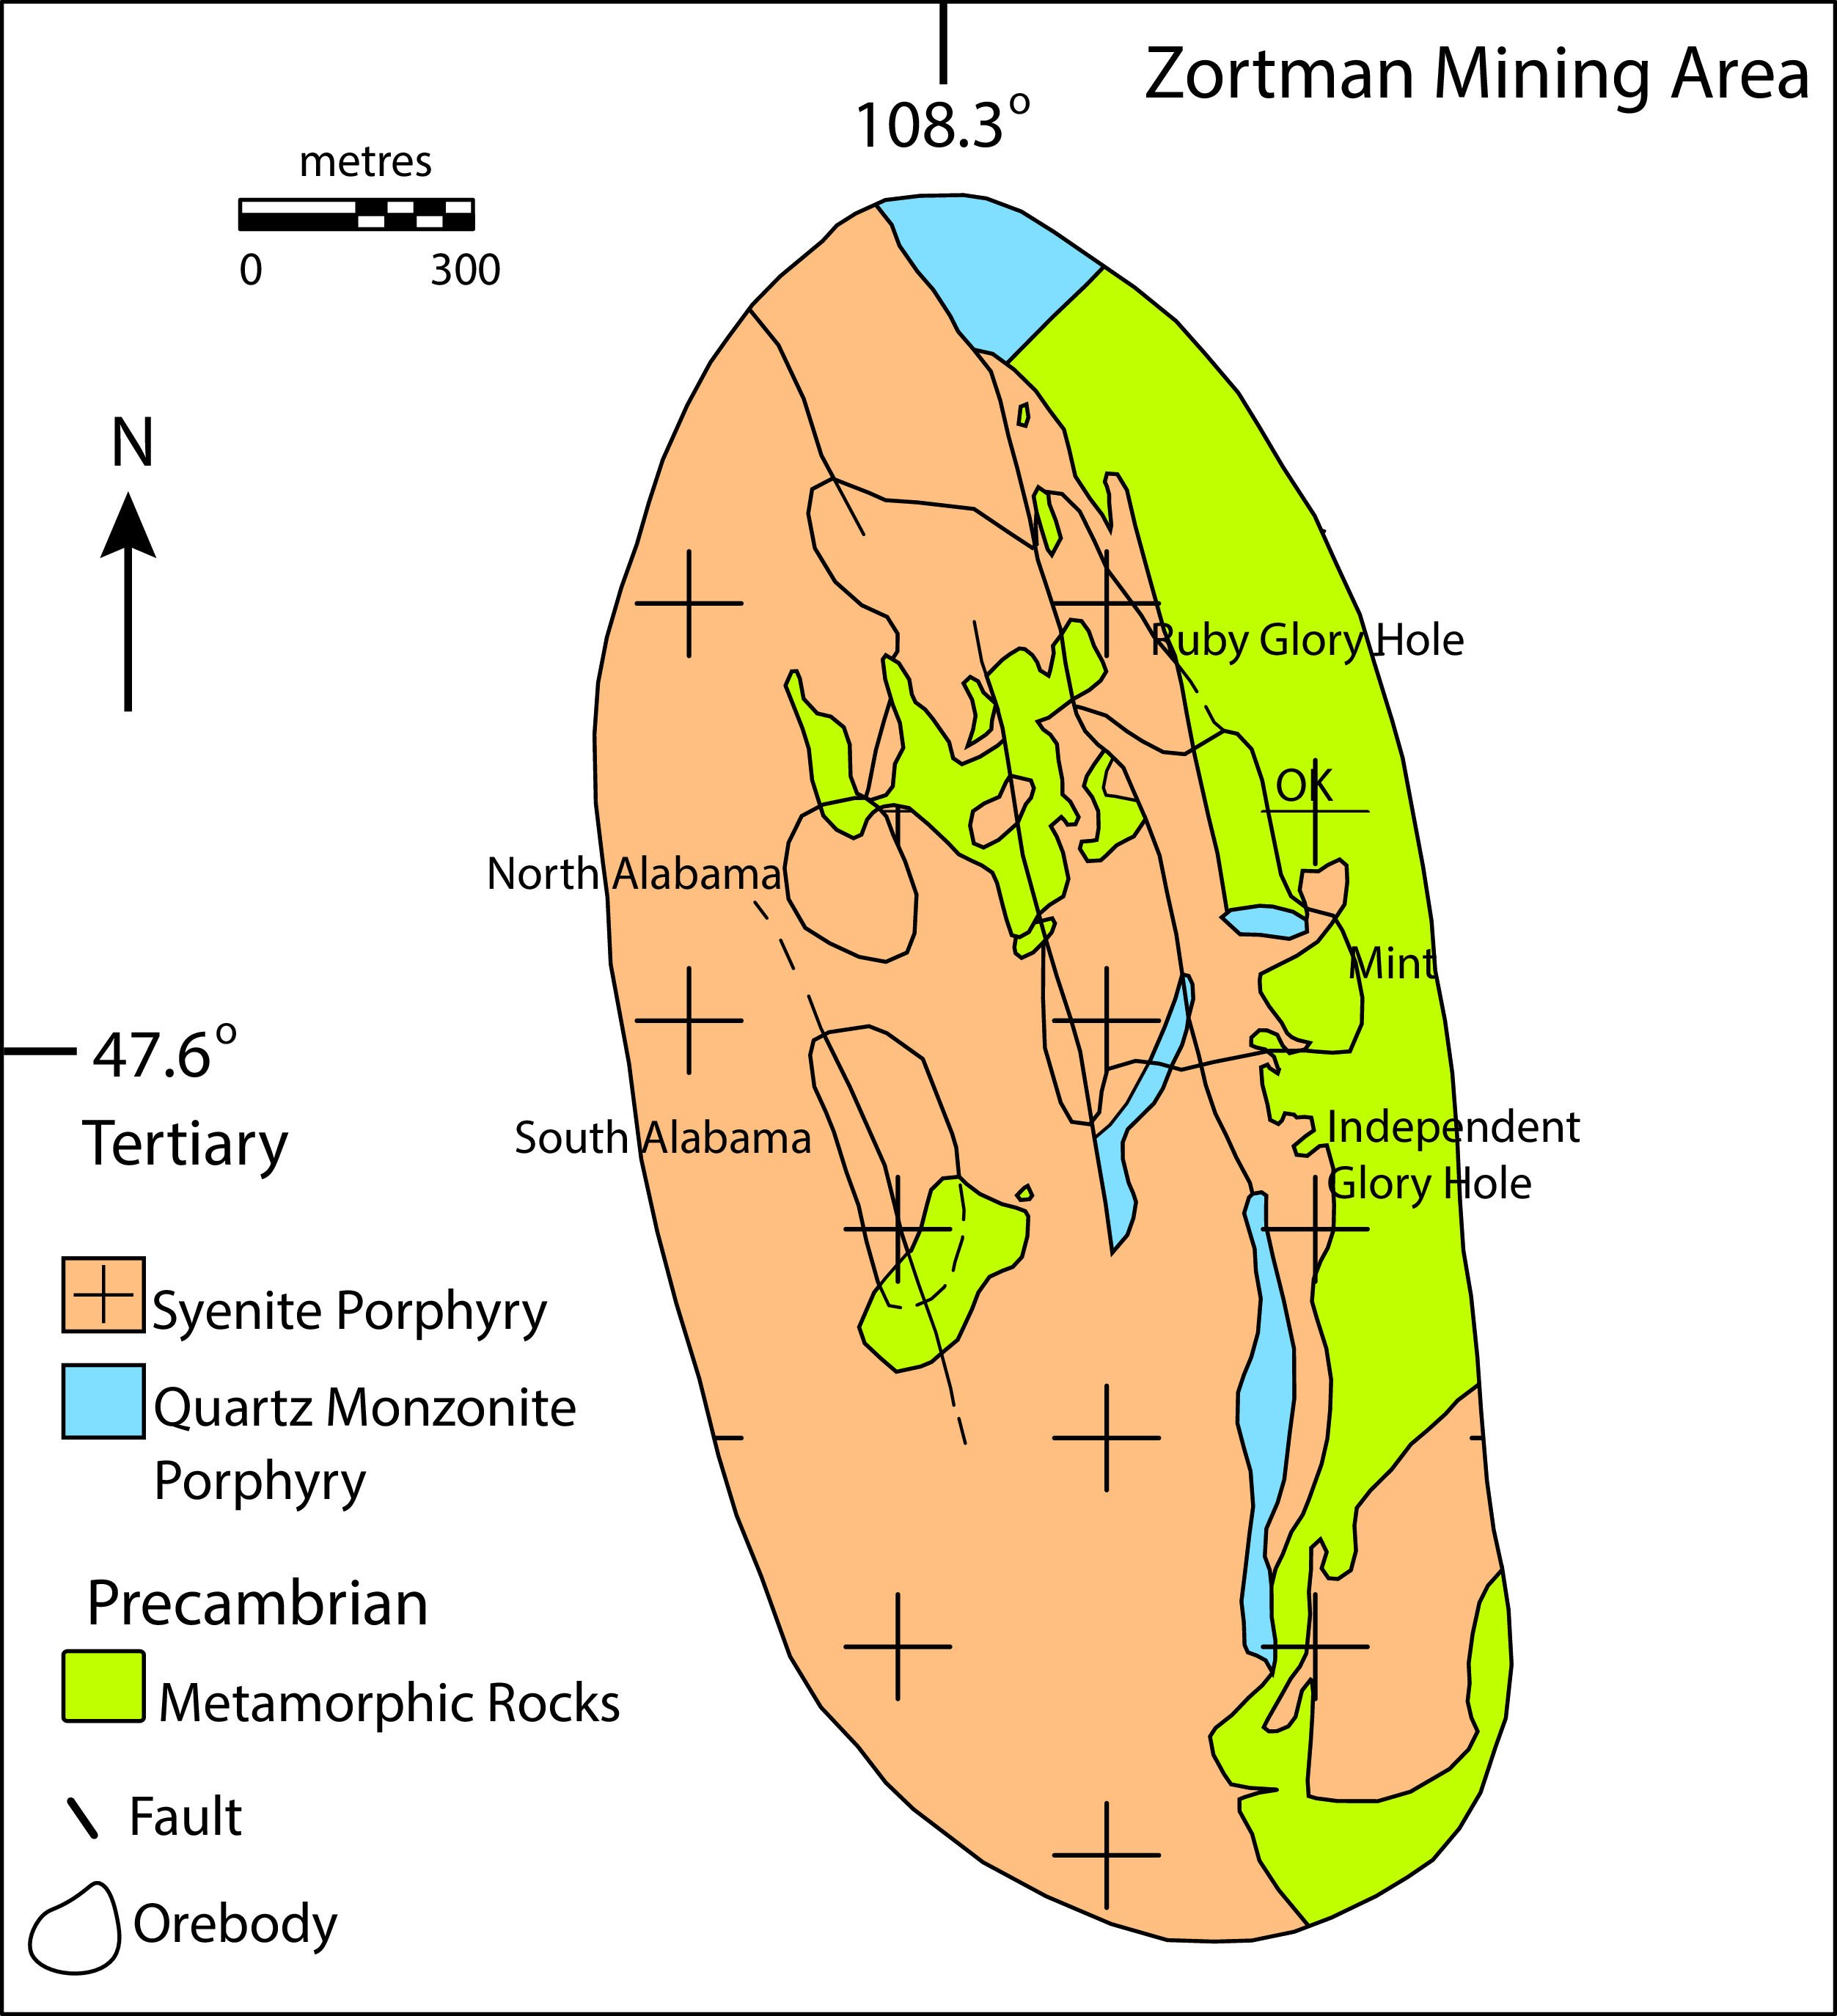
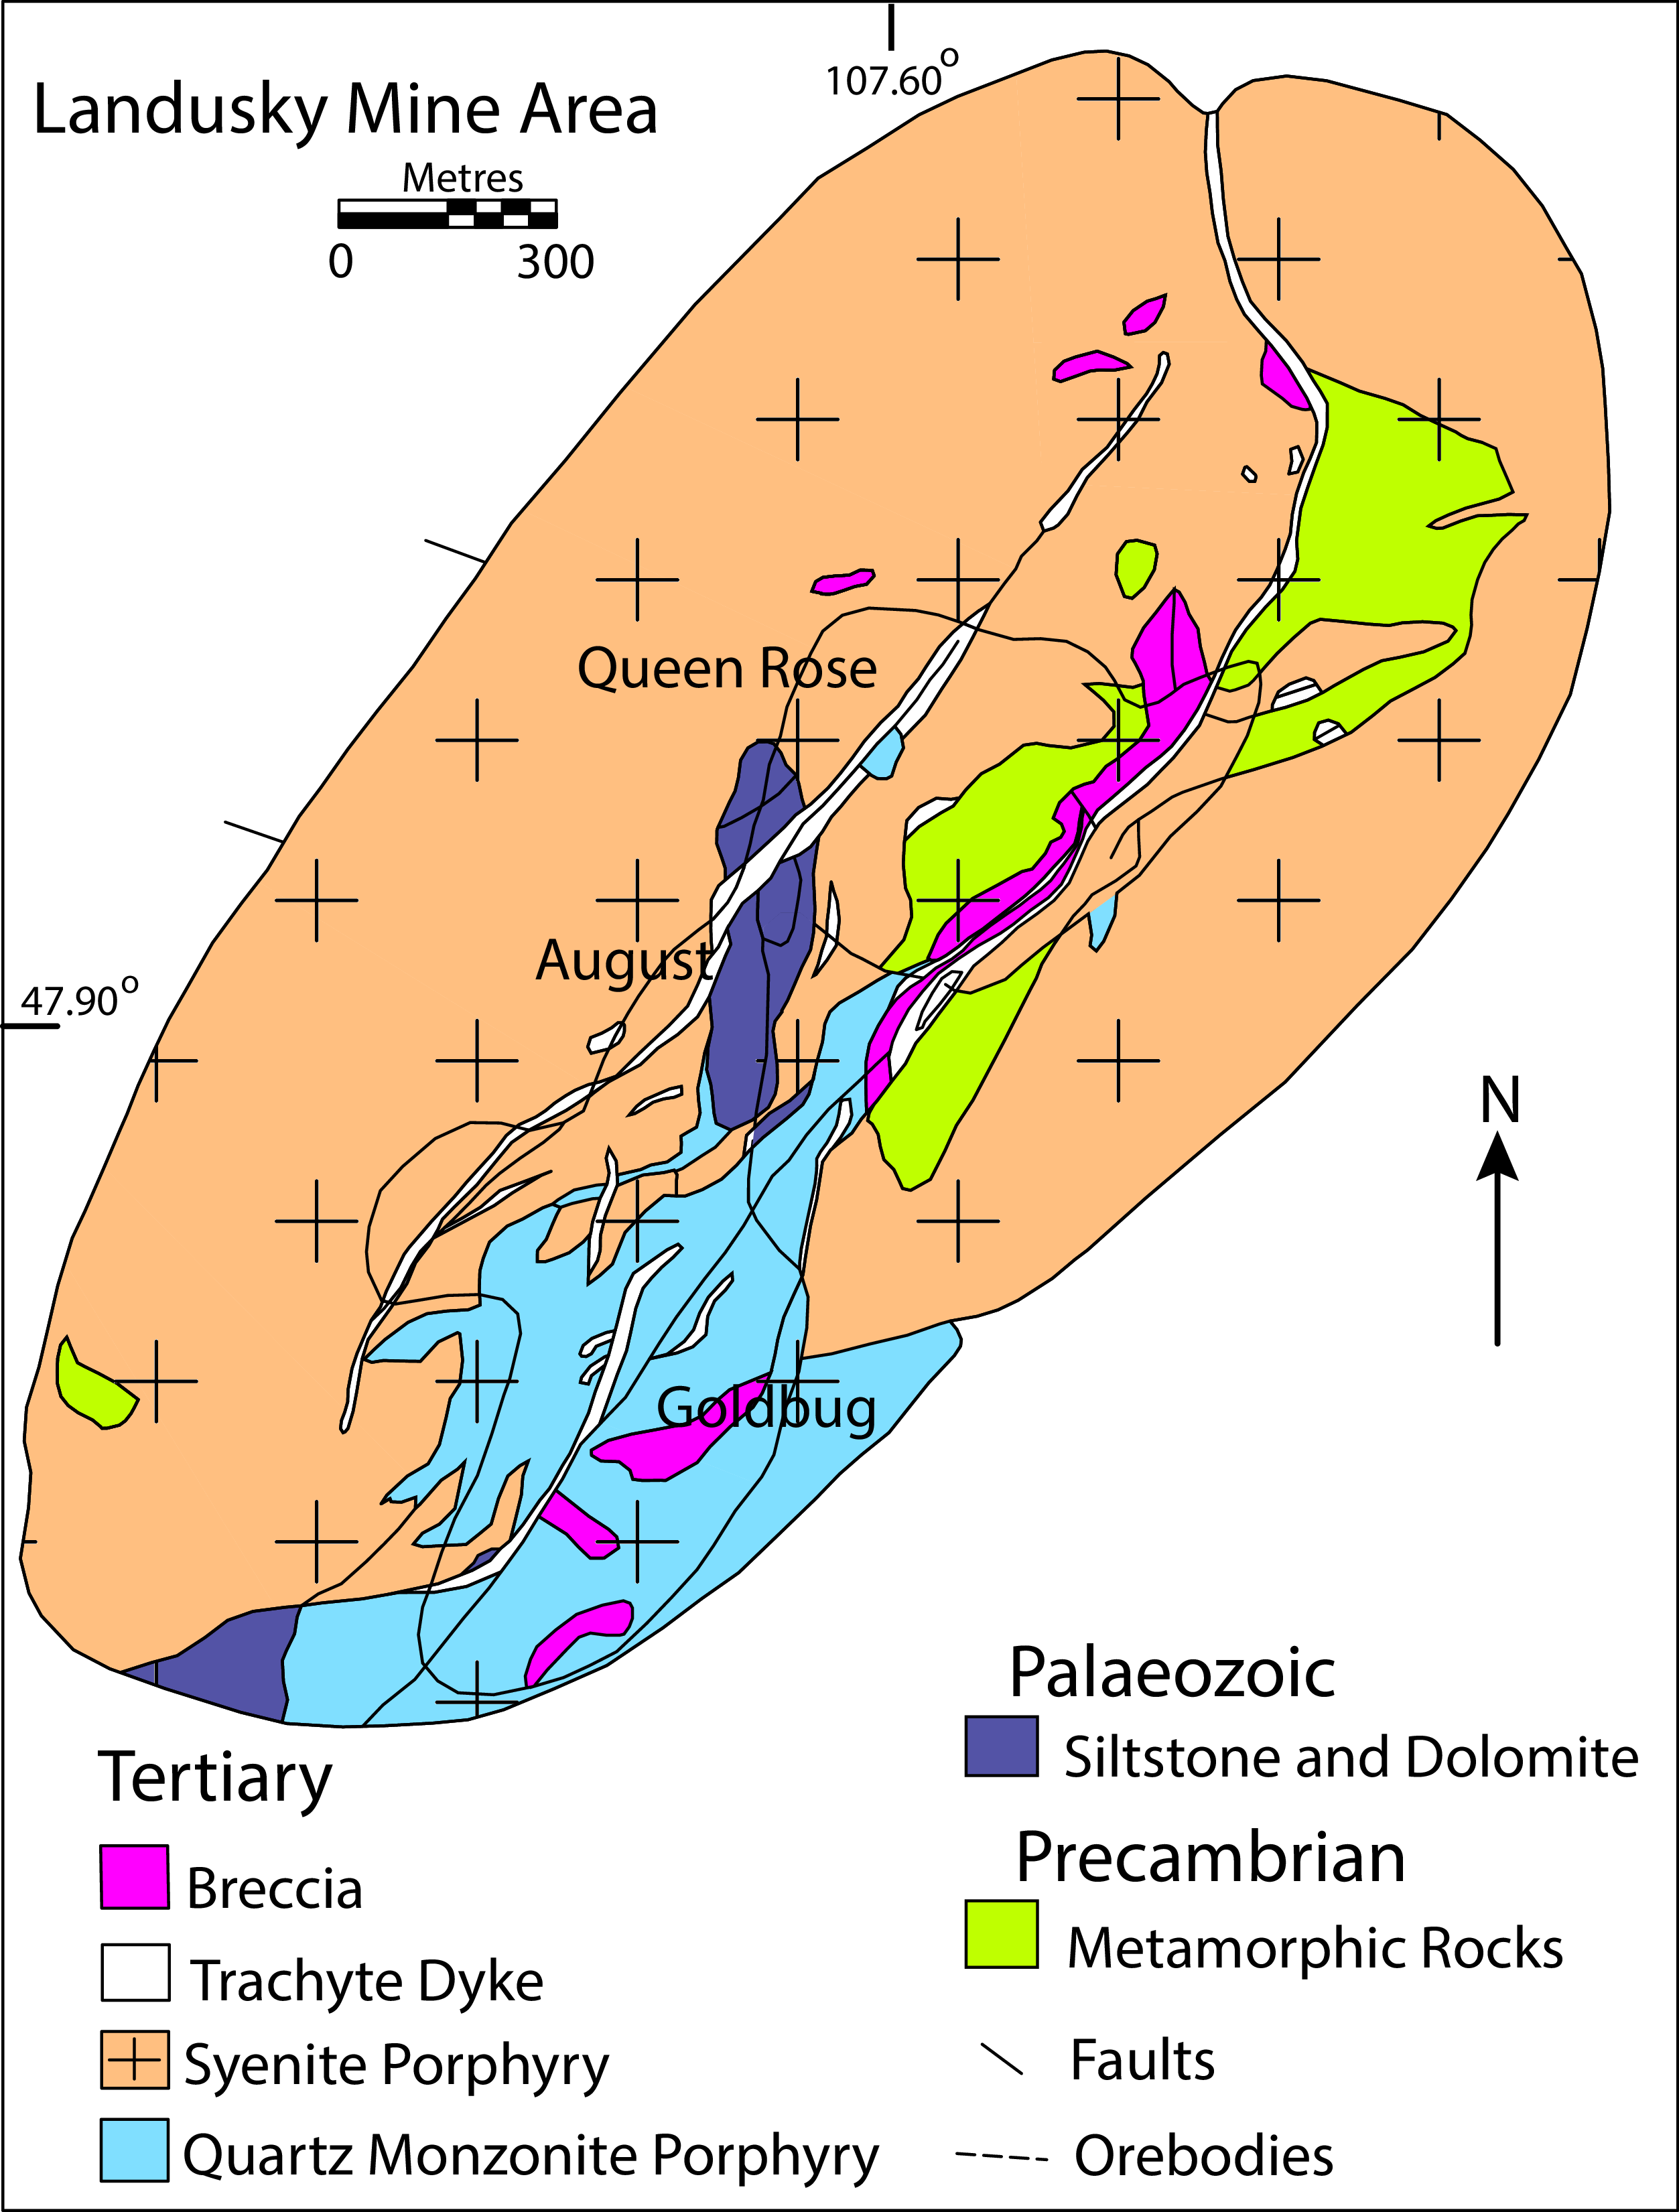
The Zortman (Fig. 14) and Landusky deposits (Fig. 15) contain reserves and resources of ∼ 110 t Au with an average grade of 0.54 g/t and a Au/Ag ratio of ∼1:7 (Wilson & Kyser, Reference Wilson and Kyser1988; Foster & Childs, Reference Foster and Childs1993). Previous studies of the Zortman and Landusky deposits include the geological setting, structure, igneous petrology, hydrothermal alteration, and gold mineralisation (Emmons, Reference Emmons1908; Corry, Reference Corry1933; Dyson, Reference Dyson1939; Hastings, Reference Hastings, Schafer, Cooper and Vikre1988; Wilson & Kyser, Reference Wilson and Kyser1988; Ryzak, Reference Ryzak1990; Russell, Reference Russell, Baker and Berg1991, 1992). Wilson and Kyser (Reference Wilson and Kyser1988) presented isotopic (H, O, S, Ar, Sr, and Nd) and fluid inclusion evidence in concert with field and petrographic data to constrain the age and origin of the intrusive rocks and spatially associated hydrothermal mineralisation.
Generalised geological map of the Zortman mine (after Hastings, Reference Hastings, Schafer, Cooper and Vikre1988).
Generalised geological map of the Landusky mine (after Hastings, Reference Hastings, Schafer, Cooper and Vikre1988).
4.e.1. Geological setting
The regional geological setting of the Little Rocky Mountains is described by Knechtel (Reference Knechtel1959), Collier and Cathcart (Reference Collier and Cathcart1922), Hastings (Reference Hastings, Schafer, Cooper and Vikre1988), Ryzak (Reference Ryzak1990) and Russell (Reference Russell, Baker and Berg1991), and only a brief summary is given here. The Little Rocky Mountains consist of Palaeocene syenite, quartz syenite, and quartz monzonite porphyries that intruded Archaean schists and gneisses, and Palaeozoic clastic and carbonate rocks. The composition of very weakly altered igneous rocks obtained by Wilson and Kyser (Reference Wilson and Kyser1988) and Russell (Reference Russell, Baker and Berg1991) is plotted in Figure 3. Although volumetrically insignificant, trachyte dykes are spatially associated with gold mineralisation particularly in the Landusky deposit. Studies by Knechtel (Reference Knechtel1959) show that the alkaline igneous rocks intruded a Palaeozoic sequence, which is over 300 m thick of Cambrian sandstone and shale, Ordovician dolomites, and Devonian to Mississippian shales and limestones. Greater than 100 m of Upper Jurassic limestone, glauconitic sandstone, mudstone, and shale (in places carbonaceous) as well as more than 1,200 m of Cretaceous shales, sandstones, conglomerates, and siltstone unconformably overlie the Palaeozoic sequence. The Archaean basement rocks consist of hornblende schists, amphibolites, amphibolite-bearing gneisses, biotite gneisses, quartz-feldspar gneisses, and mafic granofelses (Peterman, Reference Peterman1980; Russell, Reference Russell, Baker and Berg1991) and occur in fault contact with the margin of the Palaeocene rocks and as blocks in the intrusive rocks.
4.e.2. Hydrothermal mineralisation and alteration
The Zortman and Landusky deposits are structurally controlled and occur as veins, high-grade stockworks, breccia replacements, and fractured ‘sheeted’ zones (e.g. Hastings, Reference Hastings, Schafer, Cooper and Vikre1988). Orebodies are typically about 300 m long, 75 m wide, and 150 m deep. Various alkaline porphyritic rocks are associated with mineralisation in both deposits. In the Zortman deposit, mineralisation occurs predominantly at the intersection of north- and northwest-trending fractures, although there is a preferential alignment of orebodies with north-trending faults. Minor mineralisation is aligned in an ENE direction, which parallels the orientation of the Montana lineament (see Fig. 1). Hydromagmatic breccias associated with mineralisation vary from being clast dominant to matrix dominant. Mineralised zones in the Landusky area occur in northeast-trending fracture zones, which parallel the orientation of the GFTZ. Trachyte dykes along zones of mineralisation are characteristic of the Landusky area. Russell (Reference Russell, Baker and Berg1991) noted that a variant of trachyte, locally referred to as the ‘Possum porphyry’, possesses a fetid hydrocarbon odour when fractured.
Samples of hydrothermally altered syenite porphyry produced K-Ar dates of 63.9 ± 1.5 to 62.4 ± 1.4 Ma and were considered by Marvin et al. (Reference Marvin, Hearn, Mehnert, Naeser, Zartman and Lindsey1980) to date the hydrothermal activity associated with gold mineralisation. These dates are similar to K-Ar dates of 67.8 ± 16, 62.3 ± 3, and 57.6 ± 3 Ma, obtained by Wilson and Kyser (Reference Wilson and Kyser1988), which were derived from illite in altered intrusive rocks spatially associated with gold mineralisation.
The upper portions of the mined orebodies are oxidised, whereas zones of sulphides occur below this zone. In the oxidised zones, native gold occurs in fractures with haematite, goethite, and rare jarosite. Based on mineralogical studies herein coupled with previous published studies (e.g. Ryzak, Reference Ryzak1990), including unpublished company reports, we provide a new paragenetic sequence (Supplementary Figure S5). Stage 1 consists of early silicification accompanied by gold-free pyrite, while stage 2 mineralisation is composed of pyrite, marcasite, arsenopyrite, galena, sphalerite (Fig. 11g), chalcopyrite, acanthite and minor amounts of precious metal tellurides and native gold. The coarsest gold grains (up to 120 μm) occur in this stage. Stage 3 is free of precious metal minerals and is composed primarily of pyrite, marcasite, and arsenopyrite. According to Ryzak (Reference Ryzak1990), stage 4 mineralisation is the main gold stage, where it occurs as sub-micron gold on the surfaces of pyrite and as tellurides. Minor pyrite and base metal sulphides characterise stage 5, whereas orthoclase flooding, microcline, adularia, quartz veining, and fluorite (Fig. 11h) typify stage 6. It should be noted that reflected studies by us reveal that trace quantities of pyrite, marcasite, chalcopyrite, and rutile in the August pit are intergrown with fluorite and, in places, replace stage 6 fluorite.
Pyrite possesses a variety of forms and textures. Most common is euhedral pyrite that is > 50 μm in size, and occasionally > 2 mm. This form of pyrite is commonly overgrown by aggregate-textured, atoll-textured, or zoned pyrite. In the aggregate-textured pyrite, individual grains are commonly 2 to 6 μm in diameter, whereas pyrite atolls may vary in size from about 10 to 100 μm in diameter. The aggregate texture of pyrite has a pitted or melnikovite appearance where, in places, it is replaced by greigite (Fe3S4). A late variety of pyrite is a feather-textured form, which resembles textures described by Murowchick and Barnes (Reference Murowchick and Barnes1987) in which pyrite forms as a replacement of marcasite. Note that marcasite aggregates occur as rims on the early pyrite or as a replacement of euhedral pyrite.
Various Te-bearing minerals have been identified in Zortman-Landusky ores, including calaverite, krennerite, sylvanite, hessite, petzite, empressite, stützite, altaite, coloradoite, melonite, native tellurium, tellurobismuthite, weissite (Cu2-xTe), rickardite (Cu7Te5) and an unnamed sulphotelluride of silver (C. Paterson unpub. report to Zortman Mining, 1988; Russell, Reference Russell, Baker and Berg1991; R.M. Honea, unpub. reports to Zortman Mining, 1992a, b, c, and d; Supplementary Figure S5). A qualitative scanning electron microscope analysis by R.M. Honea (unpub. report to Zortman Mining, 1992d) of the sulphotelluride suggested a formula of Ag(Te0.2-0.4S0.6-0.8). Although it is unclear which tellurides belong to stage 2 and which formed in stage 4, gold in the form of tellurides is more common at Zortman than Landusky, whereas native gold is more abundant in the Landusky ores. Calaverite, krennerite, sylvanite, stützite, melonite, native tellurium, tellurobismuthite and cervelleite have been reported from the Zortman area only (R.M. Honea, unpub. report to Zortman Mining, 1992d). There are no tellurides that are exclusive to the Landusky area. Silver also occurs as native silver, acanthite, freibergite, polybasite, stromeyerite (AgCuS), jalpaite (Ag3CuS2), and the unnamed sulphotelluride.
The most widespread types of alteration are argillic and sericitic, which appear to be spatially linked (Ryzak, Reference Ryzak1990; Russell, Reference Russell, Baker and Berg1991). Argillic-sericitic alteration affects nearly all intrusive rocks, but some unaltered rocks have been identified. Weak to moderate argillic alteration extends hundreds of metres from orebodies and decreases away from gold mineralisation. Illite, sericite, pyrite, and kaolinite appear to be the most common minerals associated with this style of alteration, however, smectite and leucoxene are also present. Argillic-sericitic alteration manifests itself as a replacement of feldspars and hornblende.
Localised zones of propylitic and potassic alteration along with zones of silicification and fluoritisation are also present (Fig. 11h). The replacement of feldspar by epidote, carbonates and chlorite characterise the propylitic alteration. Although the development of quartz veins is rare, silica and very fine-grained pyrite occur as a replacement of coarse feldspars and groundmass in intrusive porphyritic rocks in and adjacent to gold mineralisation. The silicification of breccias is also common. Opaline silica in open spaces of breccias is locally present (Russell, Reference Russell, Baker and Berg1991). Petrographic studies by Russell (Reference Russell, Baker and Berg1991) showed that potassic alteration is characterized by masses of fine-grained potassium feldspar (20-50 μm) that replaced the groundmass and plagioclase phenocrysts of various porphyritic rocks. This style of alteration may be early and associated with the late deuteric/early hydrothermal history of the porphyry system, but the presence of orthoclase flooding along shear zones and adularia in silicified breccias suggests that potassic alteration may have had a protracted history. The presence of late-stage pervasive purple fluorite spatially associated with gold mineralisation is common in and adjacent to the Alabama and Ruby pits of the Zortman area. It occurs as fluorite masses and as a replacement of feldspar phenocrysts and groundmass of brecciated porphyritic rocks (Fig. 11h). Fluorite is rare in the Landusky area.
5. Analytical results
5.a. Sulphur isotope studies
Sulphur isotope compositions were obtained herein from thirty-two samples of pyrite from the Mayflower (δ34S = −29.4 to +4.1 ‰; n = 17) and West Mayflower ore shoots (δ34S = −26.3 to +1.4 ‰; n = 14) and one sample of galena from the Mayflower ore shoot (δ34S = −2.5‰) (Table 5; Fig. 16). The study was limited in scope because of the lack of sulphides available that were associated with tellurides. All the pyrite analysed was from the earliest pre-gold stage.
Sulphur isotope data from the Mayflower, Zortman-Landusky, and Judith Mountains deposits
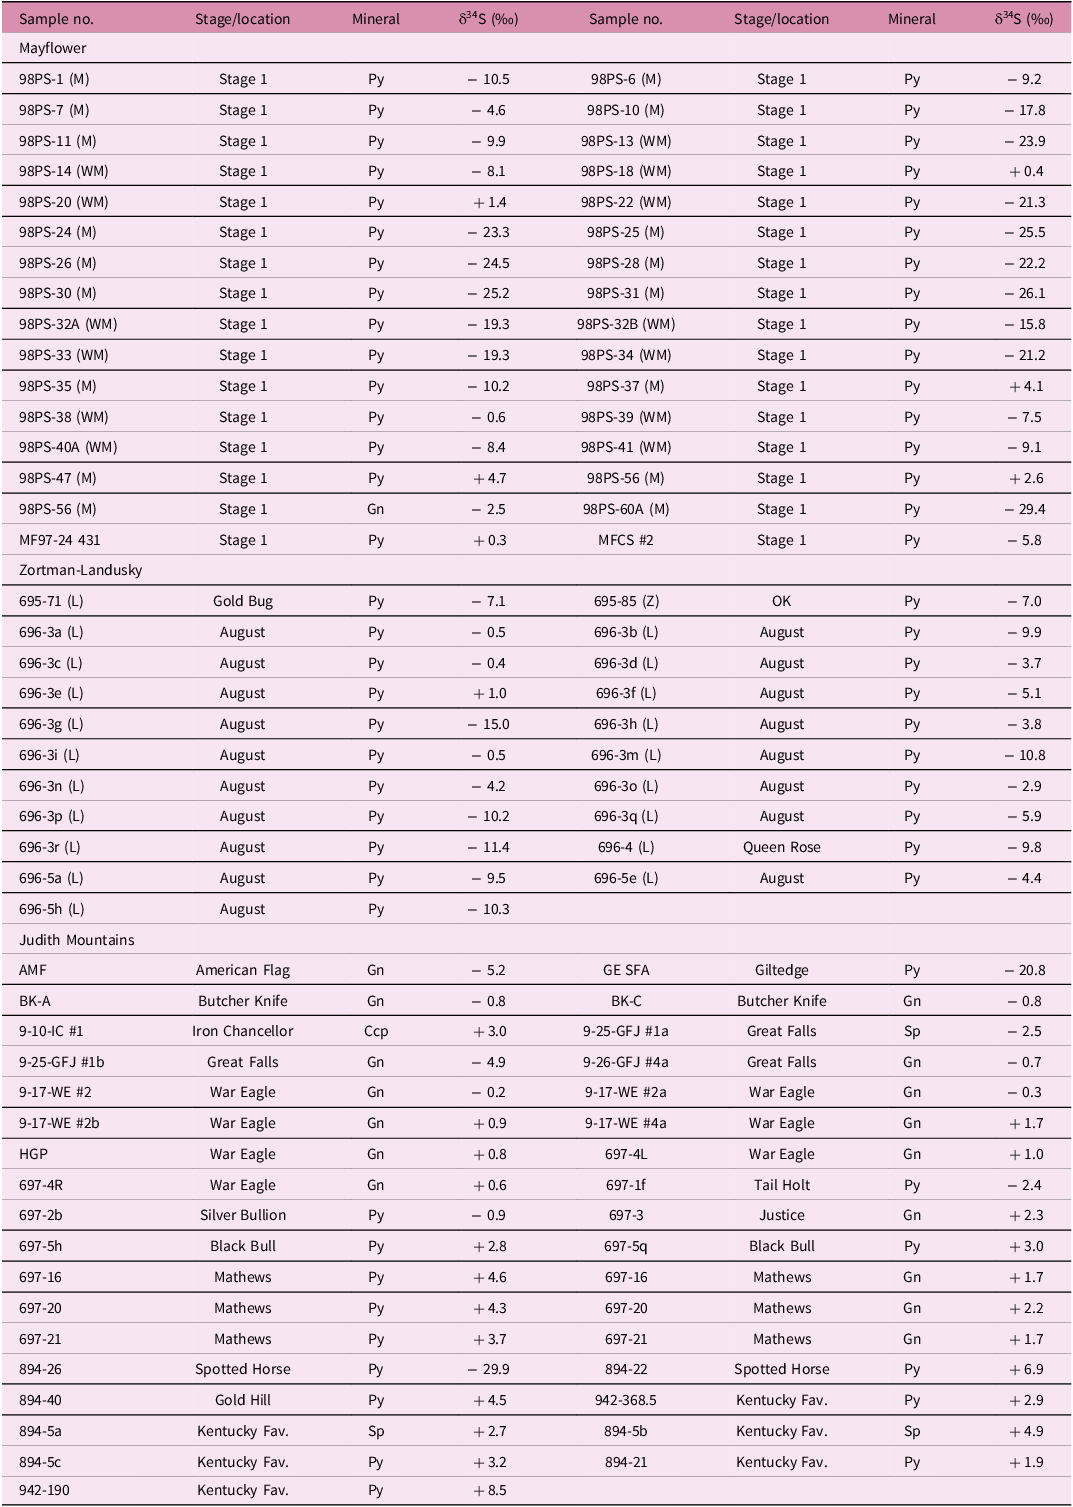
Abbreviations: Fav. = Favourite, L Landusky, Z Zortman, Ccp chalcopyrite, Gn galena, Py pyrite, Sp sphalerite.
Sulphur isotope compositions of Au-bearing deposits in the Judith Mountains and epithermal Au-Te deposits in central Montana. Data are for the following deposits. a. Judith Mountains (this study); b. Gies (Zhang & Spry, Reference Zhang and Spry1994b); c. Zortman-Landusky (Wilson & Kyser, 1977; this study); d. Mayflower (this study, Gammons & Poulson, Reference Gammons and Poulson2022); and e. Golden Sunlight (Porter & Ripley, Reference Porter and Ripley1985; Spry et al. 1996; Gammons et al. Reference Gammons, Gnanou, Odt and Poulson2020b; Zhao et al. Reference Zhao, Zhai, Keith, Voudouris, Tombros, Zhang and Liu2025). Filled square symbols represent new data collected herein, while filled circles are from previously published studies.
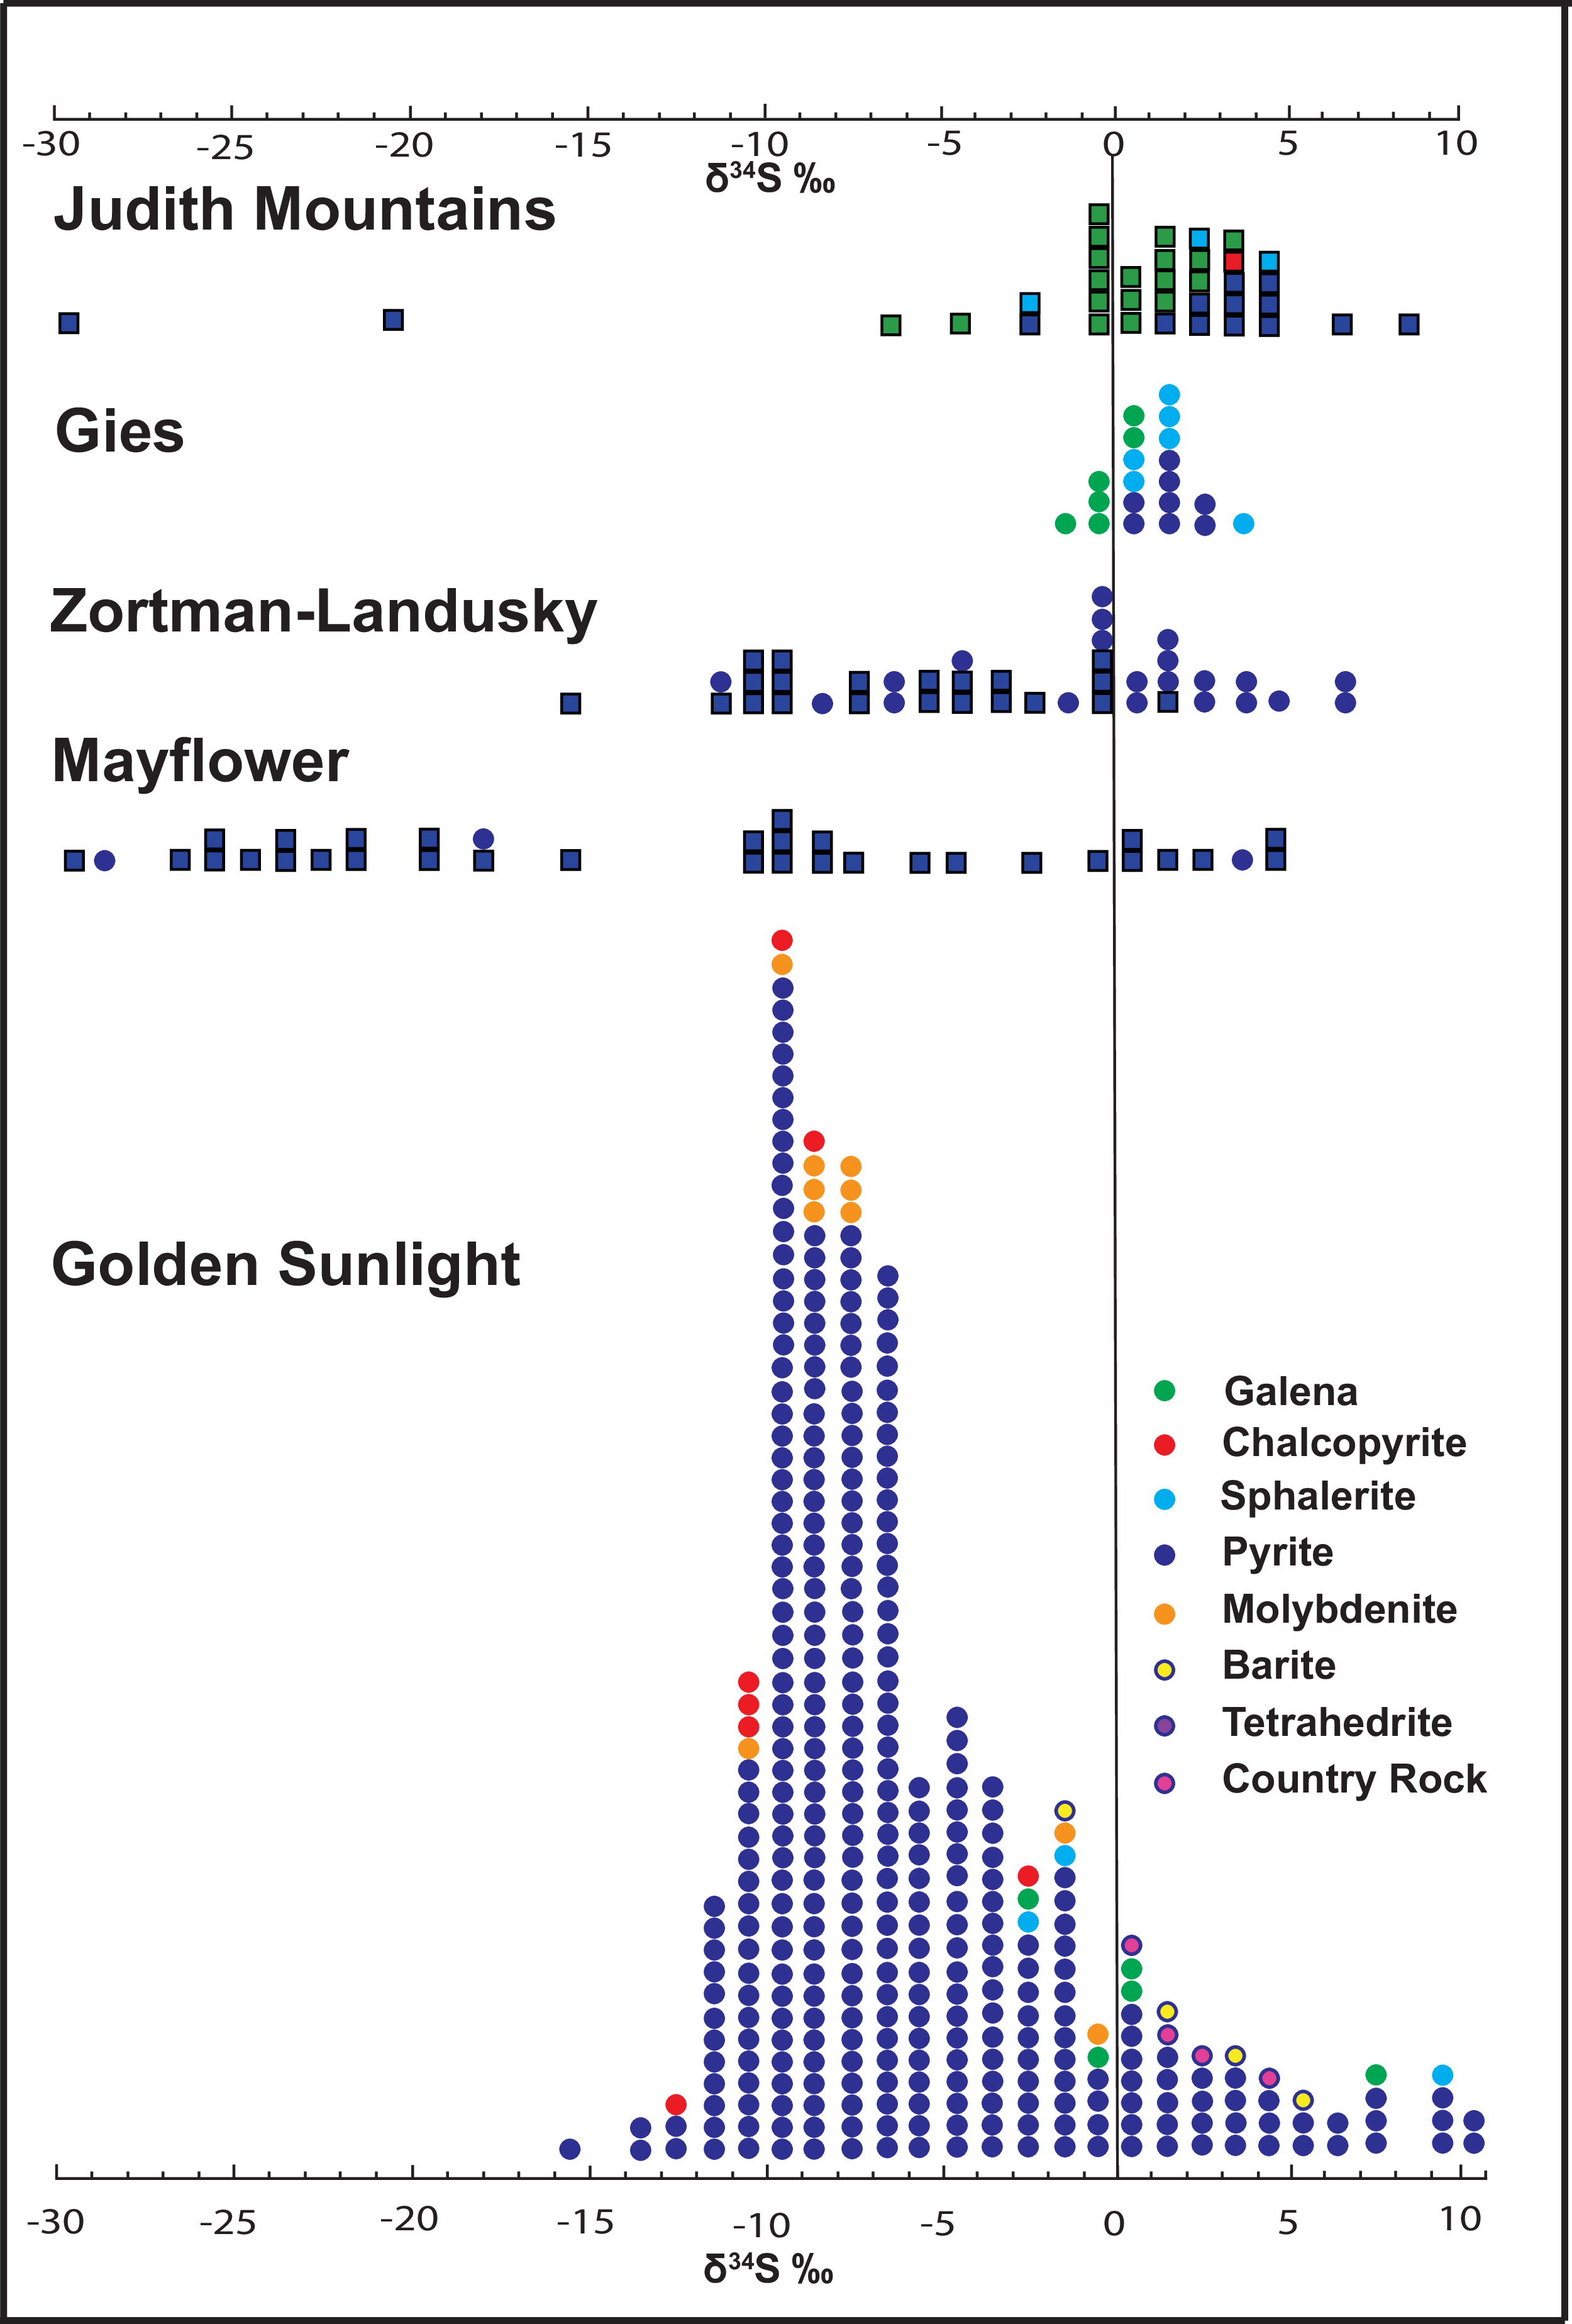
Wilson and Kyser (Reference Wilson and Kyser1988) obtained values of δ34S = −6.7 to +2.6 ‰ (n = 7) for disseminated pyrite in intrusive rocks, −0.9 to 4.1 ‰ (n = 4), disseminated pyrite in quartz-carbonate-fluorite fractures and −11.4 to 6.3 ‰ (n = 10) for massive pyrite in fracture fillings and breccias from the Zortman and Landusky areas. These values are complemented by twenty-one new sulphur isotope values of pyrite obtained herein from fracture and breccia fillings from the August (δ34S = −15.0 to +1.0; n = 18 ‰), OK (δ34S = −7.8 ‰; n = 1), Gold Bug (δ34S = −7.1 ‰; n = 1), and Queen Rose pits (δ34S = −9.8 ‰; n = 1) (Table 5; Fig. 16).
Sulphur isotope compositions of sulphides in gold telluride deposits in the Judith Mountains, other than those reported previously for the Gies deposit (Zhang & Spry, Reference Zhang and Spry1994b; δ34S = −0.4 to +3.1 ‰; n = 20; with one sample of pyrite from Jurassic Ellis shale yielding δ34S = −15.9 ‰) were analysed here: Spotted Horse-Kentucky Favourite (δ34Spyrite = +1.9 to +8.5 ‰, n = 6; δ34Ssphalerite = +2.7 ‰, n = 1, with one anomalous sample of pyrite (δ34S = −29.9 ‰); Tail Holt (δ34Spyrite = −2.4 ‰; n = 1), and Gilt Edge (δ34Spyrite = −20.8 ‰; n = 1). Twenty five additional sulphur isotope analyses of pyrite (n = 7), galena (n = 16), chalcopyrite (n = 1), and sphalerite (n = 1) were obtained from the following non-telluride deposits for comparative purposes: American Eagle, Black Bull, Butcher Knife, Iron Chancellor, Gold Hill, Great Falls, Justice, Matthews and Last Chance, Silver Bulletin and War Eagle (Table 5, Fig. 16). The compositions range from δ34S = −5.2 to +4.6 ‰ and overlap compositions obtained from gold telluride deposits and three analyses of galena −0.3 ‰, +1.7 ‰ and +3.0 ‰ for the Spotted Horse, Maginnis, and Mathews and Last Chance deposits reported by Woodward (Reference Woodward1995).
5.b. Lead isotope studies
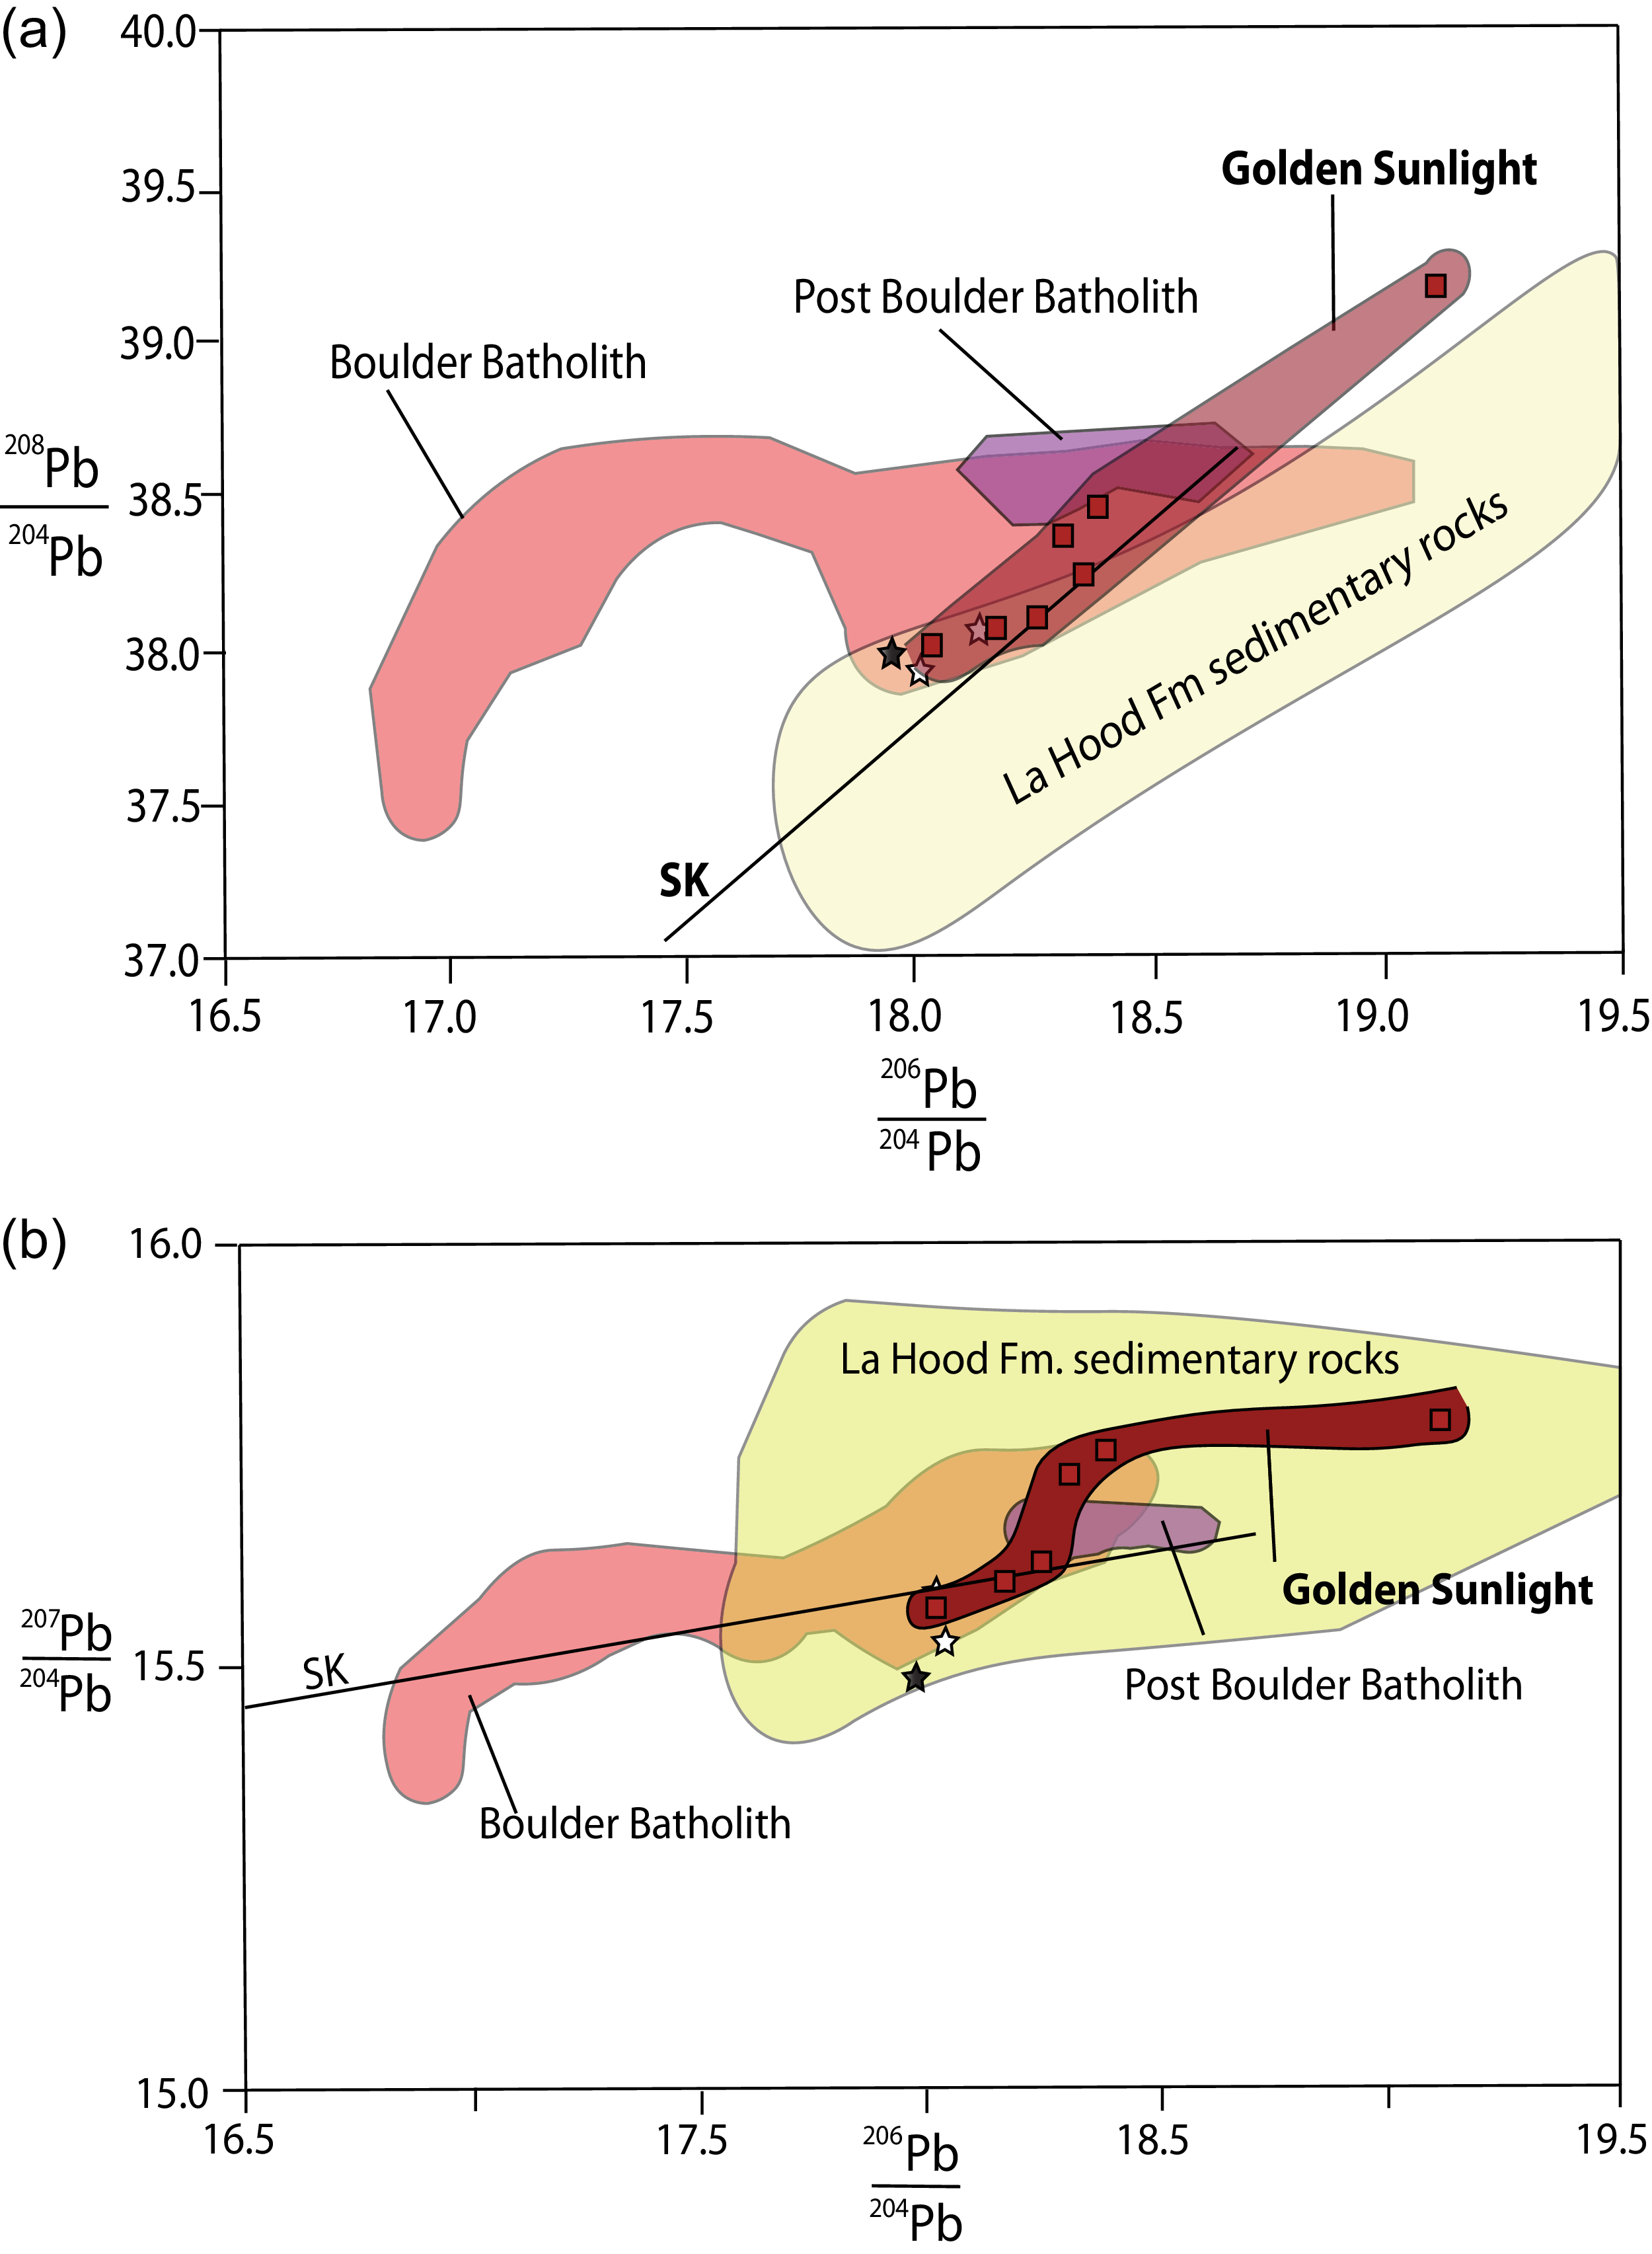
Lead isotopes compositions of seven samples of galena analysed here from the Golden Sunlight deposit (206Pb/204Pb = 18.021–19.105, 207Pb/204Pb = 15.574–15.790, 208Pb/204Pb = 38.002–39.151; Table 6) plot slightly above or overlap the crustal lead growth curve of Stacey and Kramers (Reference Stacey and Kramers1975) (Fig. 17a and b). They also overlap two whole-rock lead isotope compositions of rhyolite in the Mineral Hill breccia pipe and sedimentary rocks of the Proterozoic LaHood Formation that were obtained by DeWitt et al. (Reference DeWitt, Foord, Zartman, Pearson and Foster1996). Since plutonic rocks in the mine area may be related to the Boulder batholith (DeWitt et al. Reference DeWitt, Foord, Zartman, Pearson and Foster1996), Pb isotope compositions of K-feldspar in the Boulder batholith and post-Boulder batholith volcanic rocks (Doe et al. Reference Doe, Tilling, Hedge and Klepper1968) and intrusive volcanic rocks from Korzeb (Reference Korzeb2019) have also been included in Figures 17a and b for comparative purposes.
Lead isotope compositions of galena from the Golden Sunlight deposit and the Judith Mountains
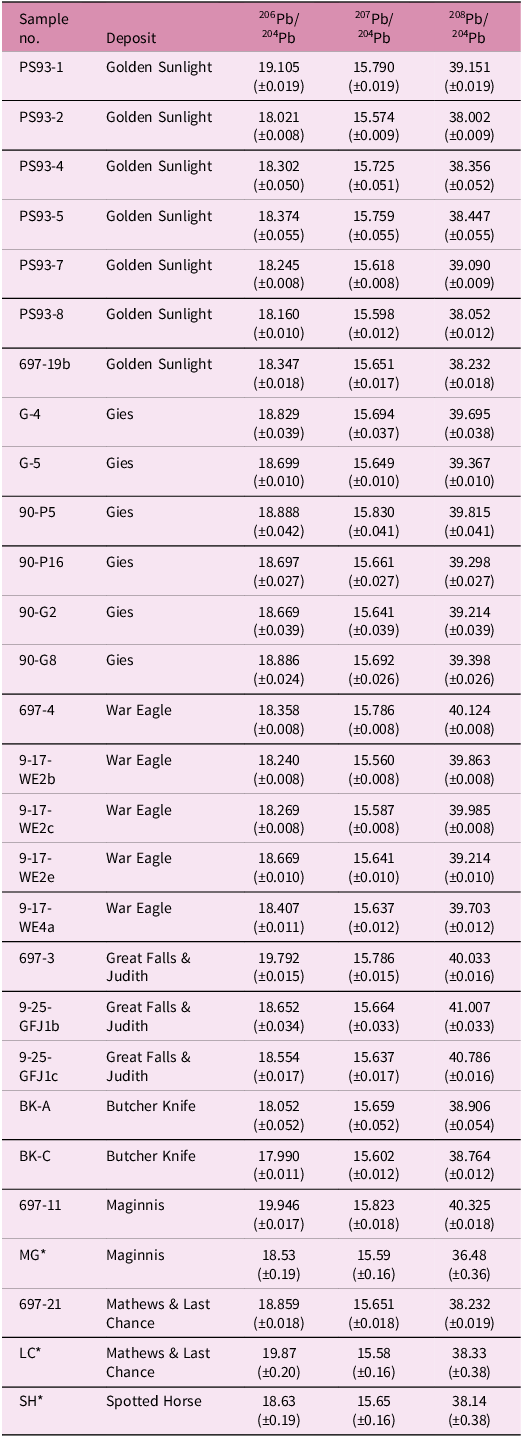
* lead isotope data are from Woodward (Reference Woodward1995).
Lead isotopic composition of galena in terms of a. 208Pb/204Pb versus 206Pb/204Pb and b. 207Pb/204Pb versus 206Pb/204Pb for the Golden Sunlight deposit (this study), whole-rock lead isotope composition of the host rhyolite (shown as open stars) in the Mineral Hill breccia pipe and Proterozoic LaHood sedimentary rocks (DeWitt et al. Reference DeWitt, Foord, Zartman, Pearson and Foster1996) as well as a diorite (Korzeb, Reference Korzeb2019, shown as a black star). Lead isotopes of K-feldspar in the Boulder batholith and post-Boulder batholith volcanic rocks (Doe et al. Reference Doe, Tilling, Hedge and Klepper1968) and whole-rock lead isotope compositions of Boulder Batholith granite and intrusive volcanic rocks are from Korzeb (Reference Korzeb2019).
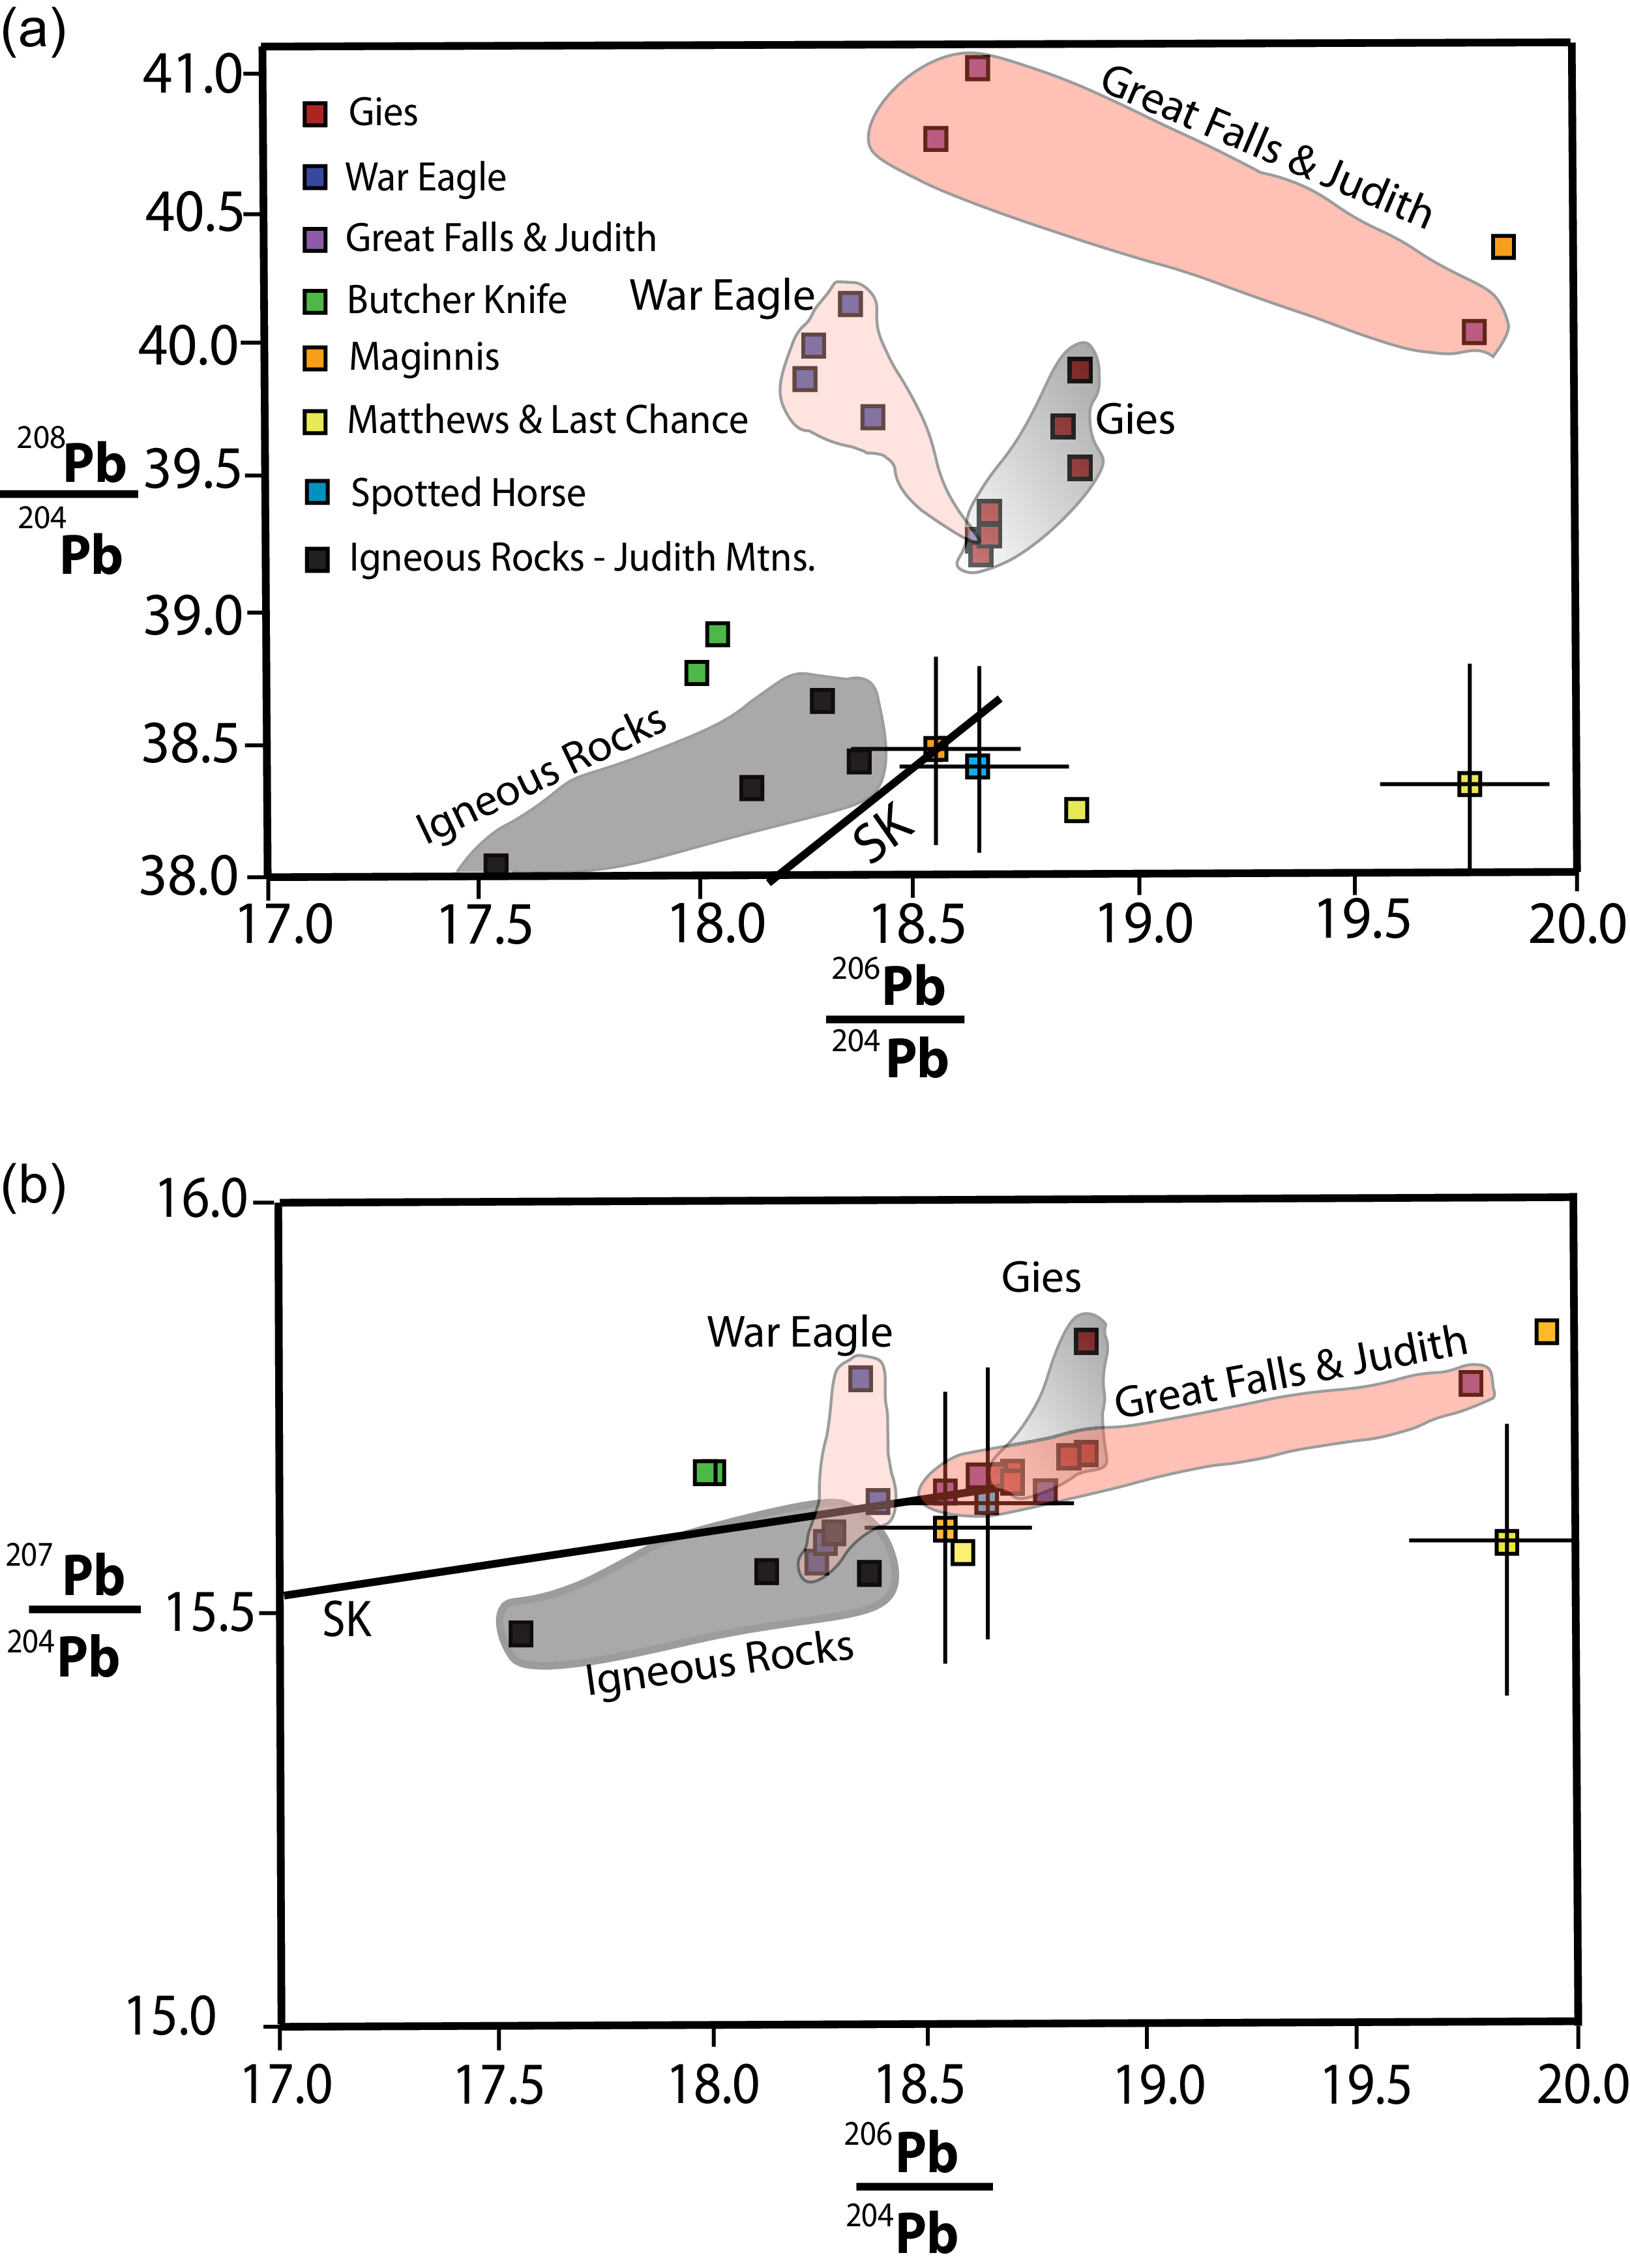
Lead isotope compositions were obtained here from 18 samples of galena in ore deposits from the Judith Mountains (Gies Au-Ag-Te-F-V, n = 6; War Eagle Pb-Zn, n = 5; Great Falls and Judith Pb-Zn-Au, n = 3; Butcher Knife Pb-Zn-Cu-Ag-Au, n = 2; Maginnis Au-Ag-Te-F-V, n = 1; Matthews and Last Chance Pb-Zn-Ag-Au, n = 1). It should be noted that the deposits are located in three geographic areas. The Gies deposit is spatially associated with the monzonite-syenite of the Elk Peak laccolith, while the Butcher Knife, War Eagle, and Great Falls and Judith deposits occur on the margins of the Crystal Peak laccolith. Maginnis and Matthews and Last Chance deposits are spatially associated with the Alpine laccolith. Figure 18a and b shows the data, which are listed in Table 6, as functions of 208Pb/204Pb vs 206Pb/204Pb and 207Pb/204Pb vs 206Pb/204Pb, respectively. In the plot of 208Pb/204Pb vs 206Pb/204Pb (Fig, 18a), most of the data fall above the crustal lead growth curve of Stacey and Kramers (Reference Stacey and Kramers1975). Data for the individual deposits generally cluster together, notwithstanding one sample of galena from the Great Falls and Judith deposit, which has a value of 206Pb/204Pb = 19.792 that is considerably higher than the other samples analysed here.
Lead isotopic composition of galena in terms of a. 208Pb/204Pb versus 206Pb/204Pb and b. 207Pb/204Pb versus 206Pb/204Pb for the Butcher Knife, Gies, Great Falls and Judith, Maginnis, Matthews and Last Chance, Spotted Horse and War Eagle deposits. Three samples are from Woodward (Reference Woodward1995): Maginnis, Matthews and Last Chance, and Spotted Horse. The error bars on these three samples are an order of magnitude larger than those obtained here, which are within the size of the symbol. The igneous field is derived from Pb isotope analyses of K-feldspar and titanite (Marvin et al. Reference Marvin, Hearn, Mehnert, Naeser, Zartman and Lindsey1980).
5.c. Fluid inclusion studies
Fluid inclusion studies were conducted previously on the Golden Sunlight (Porter & Ripley, Reference Porter and Ripley1985; Spry et al. Reference Spry and Thieben1996), Gies, (Zhang & Spry, Reference Zhang and Spry1994b) and Landusky-Zortman deposits (Wilson & Kyser, Reference Wilson and Kyser1988; Russell, Reference Russell, Baker and Berg1991). To complement these studies, we conducted a preliminary investigation of four samples of stage 1 quartz from the Spotted Horse deposit (Table 7, Fig. 19). The fluid inclusions, which are considered primary given their isolated nature (Roeder, Reference Roedder1984), consist of simple two-phase liquid-vapour inclusions (15–25% vapour). They homogenised into the liquid phase at temperatures (Th) of 113.3o to 199.6 oC (n = 50) with salinities of 1.1 to 11.9 wt. NaCl equivalent. Eutectic temperatures of −42.0o to −23.8 oC suggest the presence of CaCl2 as well as NaCl in the ore-forming fluid (Oakes et al. Reference Oakes, Bodnar and Simonson1990). The Th range of secondary inclusions, which occur in crosscutting planes, is lower than the primary inclusions and ranges from 84.7o to 102.0 oC.
Thermometric data for primary fluid inclusions in quartz from the Spotted Horse deposit

Tme eutectic melt, Tmf final ice melt, Th homogenisation temperature (into the liquid phase).
Histograms of a. homogenisation temperature and b. salinities of primary two-phase (liquid-vapour) fluid inclusions in quartz from the Spotted Horse deposit.
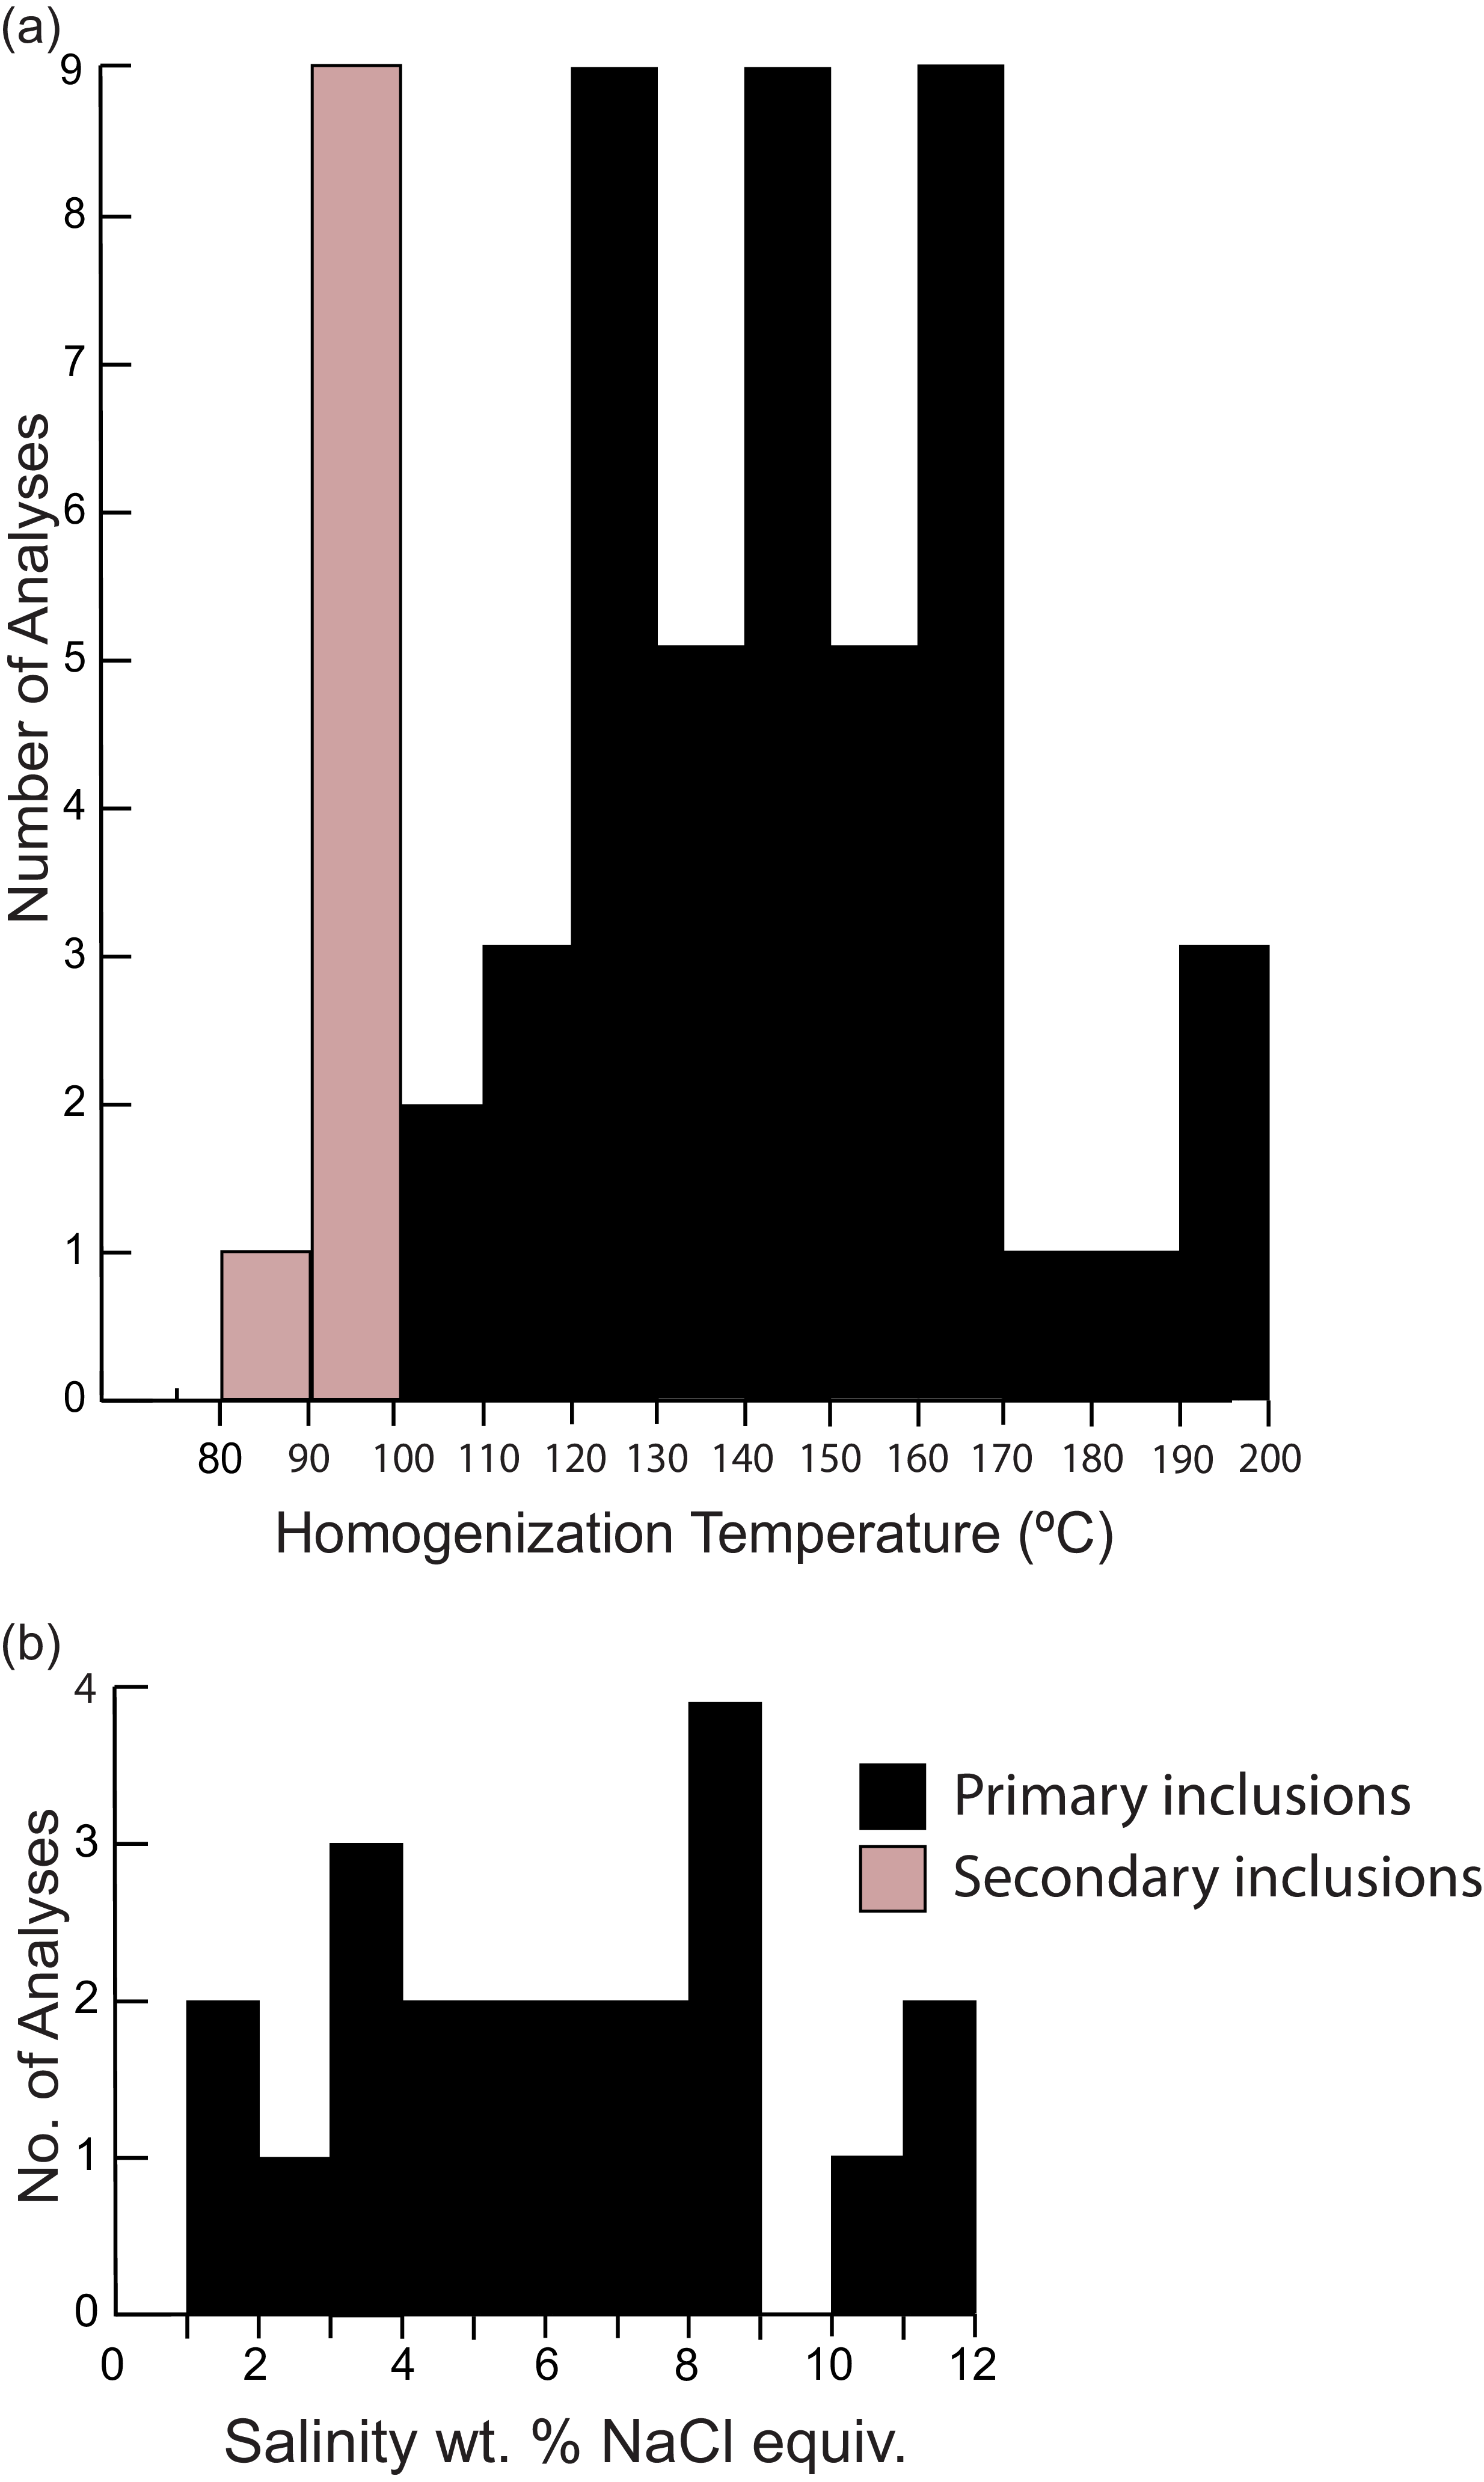
5.d. Secondary ion microprobe (SIMS) analyses of pyrite
Secondary ion microprobe analyses of stage 3 pyrite in sample 696-3p from the August pit (Landusky deposit) contain 0.07 to 6.4 μg/g Au (n = 9), whereas marcasite in the same sample contains 0.05 to 0.08 Au μg/g and 67 to 603 As μg/g (n = 5) (Table 8). SIMS analyses of stage 3 pyrite in sample 695-85 from the OK pit (Zortman deposit) contain 0.06 to 0.44 Au μg/g and 0.49 to 4,697 As μg/g (n = 13). The data collected herein are probably not representative of the range of gold values observed in pyrite from the Zortman-Landusky deposits, as it was only the coarse euhedral pyrite that was analysed. It is likely that the fine aggregate-textured pyrite contains higher gold and arsenic contents than the coarse variety, in keeping with what has been described elsewhere in the literature (e.g. Simon et al. Reference Simon, Huang, Penner-Hahn, Kesler and Kao1999; Spry & Thieben, Reference Spry and Thieben2000).
Secondary ion microprobe analyses of Au and As in pyrite and marcasite from the Zortman and Landusky deposits
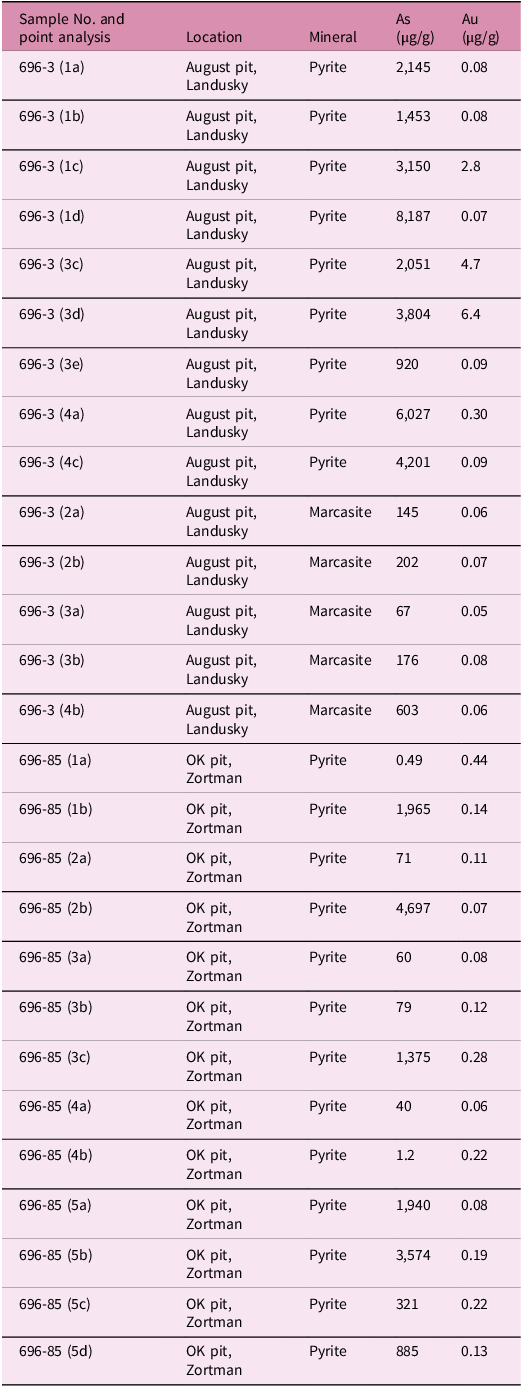
6. Discussion
6.a. Petrography
The compositions of igneous rocks associated with epithermal gold telluride-bearing deposits were determined for the Zortman-Landusky (Wilson & Kyser, Reference Wilson and Kyser1988; Russell, Reference Russell, Baker and Berg1991), Gies (Zhang & Spry, 1994), and Golden Sunlight deposits (DeWitt et al. Reference DeWitt, Foord, Zartman, Pearson and Foster1996). In addition, whole rock analyses of intrusive rocks in the Judith Mountains were reported by Wallace (Reference Wallace1953), Nockolds (Reference Nockolds1954) and GL Kirchner (unpub MS thesis Univ of Montana, 1982). To complement these data, whole rock compositions of quartz monzonite porphyries were obtained here from the Spotted Horse, Cumberland, Matthews/Last Chance and Tail Holt deposits in the Judith Mountains (analyses 12-16, Table 2). Trachyte, trachyandesite, syenite and dacite were analysed from the Elkhorn Mountains Volcanics spatially associated with the Mayflower deposit (analyses 1-11, Table 2). The compositions of these rocks and those previously published from epithermal gold telluride deposits in Montana are shown in Figure 3 in terms of Na2O + K2O vs SiO2 and show that most rocks plot in the alkaline field. The quartz monzonite porphyries from the Judith Mountains plot in the alkaline field, while EMV from Mayflower drape the alkaline-subalkaline fields.
6.b. Mineralogy
Telluride-bearing deposits in the CMAP consist of a variety of types, including bonanza veins (Gies, Spotted Horse, Mayflower), low-grade carbonate-replacement at igneous rock-carbonate contacts (Kendall, Kentucky Favourite, Gilt Edge), breccia pipe-hosted (Golden Sunlight) and igneous-hosted (Zortman, Landusky). The mineralogy of the gold-silver telluride deposits is complex, especially in bonanza veins and breccia-hosted ores. In addition to sulphides, Bi sulphosalts, native elements, tellurides, and rare sulphotellurides are also present.
Paragenetic studies show that the precious metal mineralogy varies between deposits (Supplementary Figures S1-S5). Assemblages in the system Au-Ag-Te for the various deposits indicate calaverite is the most common telluride at Golden Sunlight, while sylvanite coexisting with stützite is more prevelant in the Gies deposit, and sylvanite and petzite are the most common tellurides in the Spotted Horse deposit (Fig. 20). Of the deposits studied here, the Mayflower deposit is dominated by the Ag-rich tellurides hessite and stützite, although Au-rich tellurides sylvanite and calaverite are also present. Textural relationships show that Au-rich tellurides generally preceded the formation of the Ag-rich tellurides, a feature commonly reported in other epithermal precious metal telluride deposits (e.g. Pals & Spry, Reference Pals and Spry2003; Scherbarth & Spry, Reference Scherbarth and Spry2006). The presence of fluorite and the vanadium mica roscoelite, along with the presence of Bi minerals (e.g. Golden Sunlight, Spotted Horse) and molybdenite (Golden Sunlight, Landusky-Zortman), suggests an elemental signature characterised by Au-Ag-Te±F±V±Bi±Te±Mo for the alkaline igneous rock-related gold telluride deposits.
While precious metals have been reported here as native elements, tellurides, sulphides, and sulphotellurides, it must be noted that Au also occurs as microinclusions in As-bearing pyrite. For example, SIMS analyses of stage I pyrite in the Golden Sunlight deposit by Spry and Thieben (Reference Spry and Thieben2000) contain up to 0.6 wt. % As and approximately 1 μg/g invisible gold. Their calculations showed that invisible gold accounts for about 6-7% of the total gold content of the Golden Sunlight deposit. Similarly, SIMS analyses here of pyrite and marcasite from the Zortman-Landusky deposits contain elevated concentrations of invisible gold (up to 6.4 μg/g) and As (up to 6,027 μg/g) (Table 8) A plot of Au vs As (Supplementary Figure S6) shows that there is no systematic relationship between these elements and that concentrations fall well below the solubility limit of gold in pyrite (Reich et al., Reference Reich, Kesler, Utsunomiya, Palenik, Chryssoulis and Ewing2005) suggesting that microinclusions of Au in pyrite are absent.
Furthermore, compositionally zoned pyrite from Mayflower with up to 6 wt. % As in the cores and <0.1 wt. % As in the rims were reported by M.D. Cocker (unpub. report to Anaconda Minerals, 1983). Pyrite with > 2 wt. % As was documented in a stage 3 pyrite (Table 4); As-free pyrites are present in all other stages. Nevertheless, it is apparent that arsenian pyrite spatially associated with the Au-Ag telluride deposits in Montana can also be a significant repository of gold.
6.c. Ore genesis
In a brief review of the geology, mineralogy, and fluid inclusion, and stable isotope characteristics of alkaline igneous rock-related gold telluride deposits of Montana, Thieben and Spry (Reference Thieben, Spry, Pašava, Kříbek and Žák1995) identified six major ore types: 1. bonanza veins; 2. carbonate replacement at igneous-carbonate contacts; 3. breccia pipe-hosted; 4. igneous-hosted; 5. contact metamorphic (skarns); and 6. sediment-hosted. As Giles (Reference Giles and Babcock1983) and Thieben and Spry (Reference Thieben, Spry, Pašava, Kříbek and Žák1995) pointed out, multiple types of ore can occur in any one deposit. For example, at the Golden Sunlight deposit, sulphides occur in Proterozoic sediments, low-grade porphyry molybdenum mineralisation, hydrothermal breccias and auriferous veins (Spry et al. Reference Spry and Thieben1996). Similarly, gold telluride mineralisation in the small Spotted Horse-Kentucky Favourite ore system occurs in limestone replacement bodies, fissure fillings and veins, porphyry replacement, and breccias. The Kendall deposit differs from other disseminated gold zones in carbonate rocks in the CMAP in that they are enriched in As, Sb, Hg and Tl along with Au (Ikramuddin et al. Reference Ikramuddin, Asmeron, Nordstrom, Kinart, Martin, Digby and Afemari1983, Reference Ikramuddin, Besse and Nordstrom1986). While resembling Carlin-type Au deposits, mineralisation at Kendall differs in that ore zones also contain anomalous amounts of Te, F and V.
Given the variable geological settings of ore in any given deposit, the ore-forming conditions will also vary for each ore type. Here, we focus on ore-forming conditions for the hydrothermal vein and breccia-hosted ores, which are the dominant telluride-bearing ore types in the CMAP. We have chosen to focus on these ore types because ore-forming conditions are constrained in several deposits via fluid inclusion, stable isotope and radiogenic isotope studies, although the origin of other ore types will also be discussed.
The Golden Sunlight deposit and peripheral mineralisation are the best studied of all the alkaline igneous rock-related gold telluride deposits in Montana. Combining the fluid inclusion studies of Porter and Ripley (Reference Porter and Ripley1985) and Spry et al. (1996) suggests a broad range of ore-forming temperatures from 145o to 345oC and fluid salinities of 1 to 10 wt. percent NaCl equivalent for the formation of the gold-bearing breccia and vein ore, while the earlier formed quartz-pyrite-K feldspar-molybdenite veins yielded values of Th, of 132o to 398 oC. These inclusions showed highly variable liquid to vapour ratios and rare three-phase H2O–CO2 and multiphase inclusions (one or more daughter crystals), suggesting that these fluids were associated with phase separation (i.e. boiling). Sulphur isotope studies by Porter and Ripley (Reference Porter and Ripley1985), Spry et al. (Reference Spry and Thieben1996), Gammons et al. (2020b), and Zhao et al. (Reference Zhao, Zhai, Keith, Voudouris, Tombros, Zhang and Liu2025) show a large range of δ34S values from −15.8 to 11.0 ‰ (Fig.16), with the isotopically sulphur isotope values (> 0 ‰) being from Proterozoic sedimentary rocks and the isotopically lightest (mostly < 0 ‰) from the porphyry and breccia-pipe hosted ores. A magmatic sulphur contribution to the porphyry and breccia-hosted ores was associated with phase separation of a highly oxidised fluid (as indicated by the presence of haematite in ore-forming pyrite) whereby fractionation between H2S and SO4 2- in a cooling magmatic hydrothermal fluid with SO4 2- > H2S accounts for the isotopically light S isotope values (Gammons et al. 2020b). This view is in contrast to that proposed by Zhao et al. (Reference Zhao, Zhai, Keith, Voudouris, Tombros, Zhang and Liu2025), who suggested that H2S partitioned into the vapour phase and resulted in the broad range of isotopic values of the sulphides. However, the loss of H2S should make the remaining H2S heavier and make it difficult to account for the very light S isotope compositions. He-Ar isotopic studies of fluids in pyrite by Zhao et al. (Reference Zhao, Zhai, Keith, Voudouris, Tombros, Zhang and Liu2025) suggested a mixing of mantle and crustal components to the ore fluid, while O and H isotopic studies by Porter and Ripley (Reference Porter and Ripley1985) and Spry et al. (Reference Spry, Paredes, Foster, Truckle and Chadwick1996) are consistent with the mixing of meteoric waters with magmatic fluids during the late stages of ore formation (Fig. 21). Lead isotope studies of galena from Golden Sunlight suggest a crustal source consistent with the origin proposed by DeWitt et al. (Reference DeWitt, Foord, Zartman, Pearson and Foster1996) for the alkaline igneous rocks in the area (Fig. 17). Although DeWitt et al. (Reference DeWitt, Foord, Zartman, Pearson and Foster1996) proposed a deep crustal source, our data when plotted on the two lead isotope evolution curves of Zartman and Doe (Reference Zartman and Doe1981) do not allow for a discrimination between deep and shallow crustal sources (Fig. 22a, b).
Plot of hydrogen versus oxygen isotope compositions of fluids from Montana Au-Te deposits. Data for the various deposits are: Gies (Zhang & Spry, 1994), Golden Sunlight (Spry et al. 1996), Spotted Horse (this study), Zortman-Landusky (Wilson & Kyser, Reference Wilson and Kyser1988). Symbols: SH Spotted Horse, SMOW standard mean ocean water.
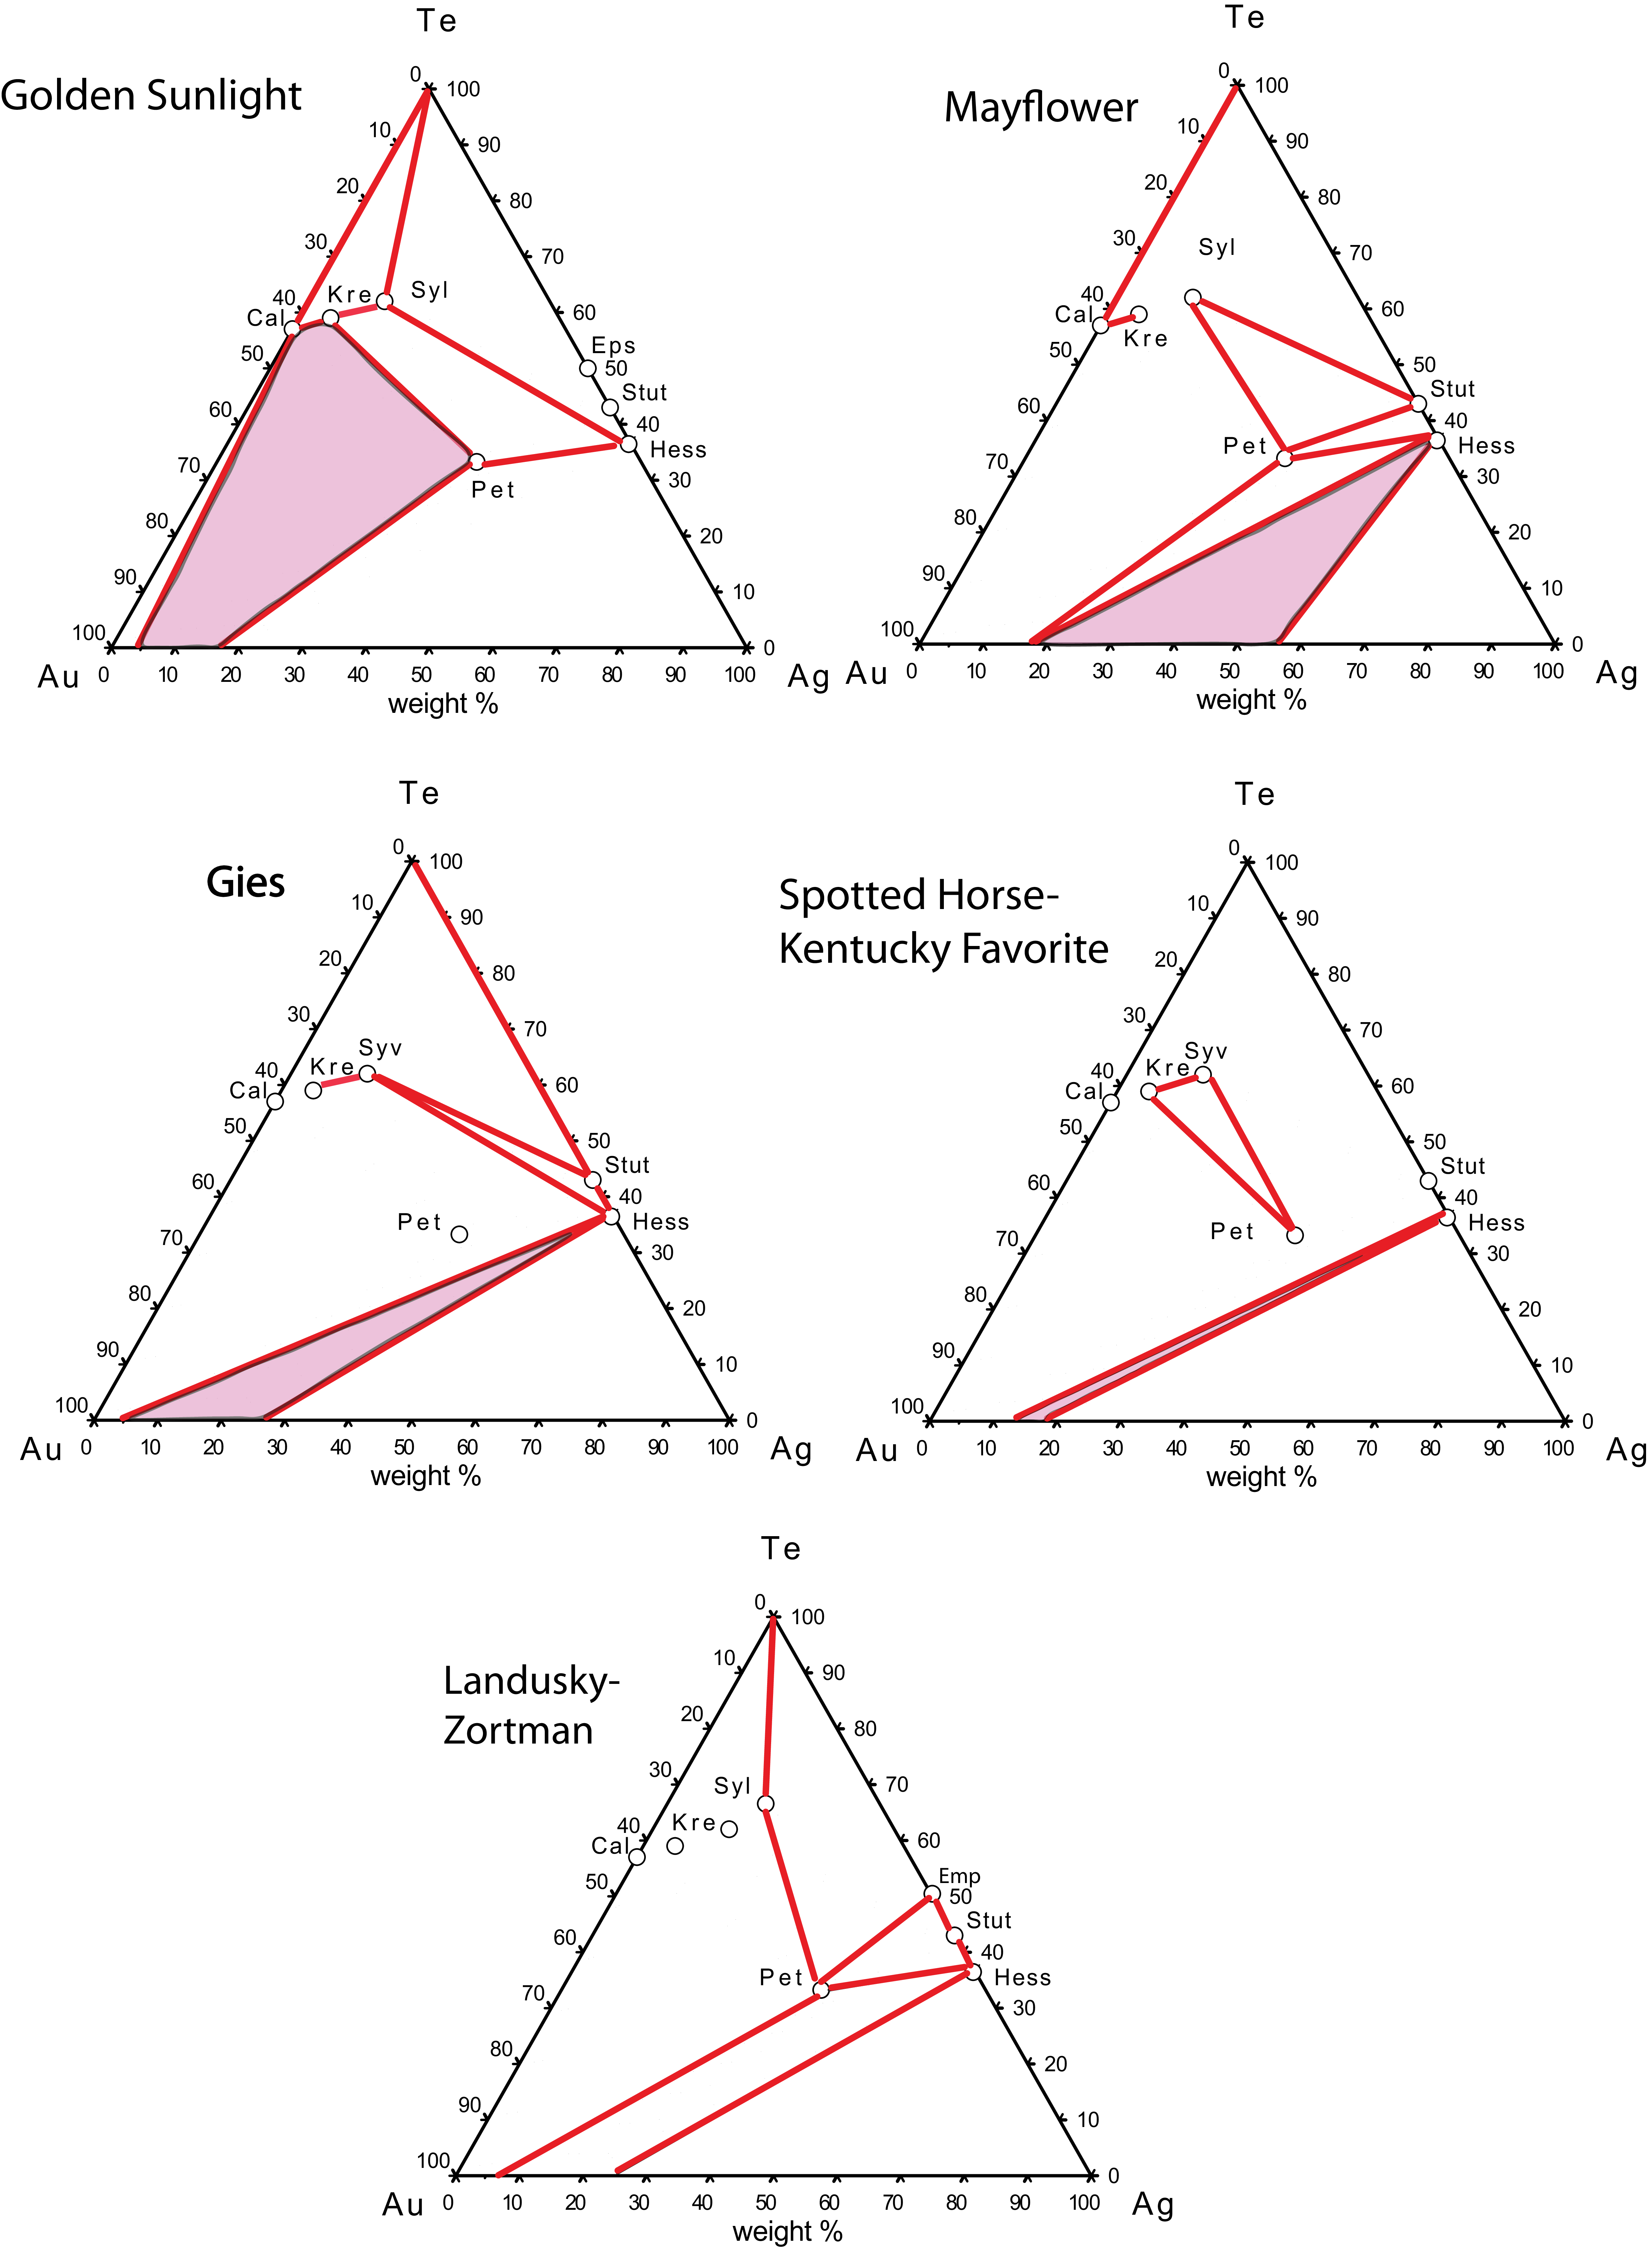
Lead isotopic composition of galena in terms of a. 208Pb/204Pb versus 206Pb/204Pb and b. 207Pb/204Pb versus 206Pb/204Pb for the Butcher Knife, Gies, Great Falls and Judith, Maginnis, Matthews and Last Chance, Spotted Horse and War Eagle deposits. Three samples are from Woodward (Reference Woodward1995): Maginnis, Matthews and Last Chance, and Spotted Horse. The error bars on these three samples are an order of magnitude larger than those obtained here, which are within the symbols. Also shown are the Pb isotope evolution curves generated by the plumbotectonics model of Zartman and Doe (Reference Zartman and Doe1981) for the mantle (A), orogene (B), upper crust contributed to the orogene (C), and lower crust contributed to the orogene (D).

The Zortman-Landusky deposits are igneous-hosted (quartz syenite and monzonite) deposits with tellurides occurring in steeply dipping veins and stockworks. Fluid inclusion studies of sphalerite and quartz by Wilson and Kyser (Reference Wilson and Kyser1988) and Russell (Reference Russell, Baker and Berg1991), respectively, suggest the ore-forming fluids boiled between 240o and 340 oC with later non-boiling fluids in fluorite forming at lower temperatures (110o to 200 oC). These latter inclusions exhibited salinities between 0.5 and 3.5 equiv wt percent NaCl.
Ternary plots of members in the system Au-Ag-Te showing precious metal assemblages for the various gold telluride deposits in Montana: Golden Sunlight, Mayflower, Gies, Spotted Horse-Kentucky, Landusky-Zortman. Details of the assemblages for each deposit is given in the text.
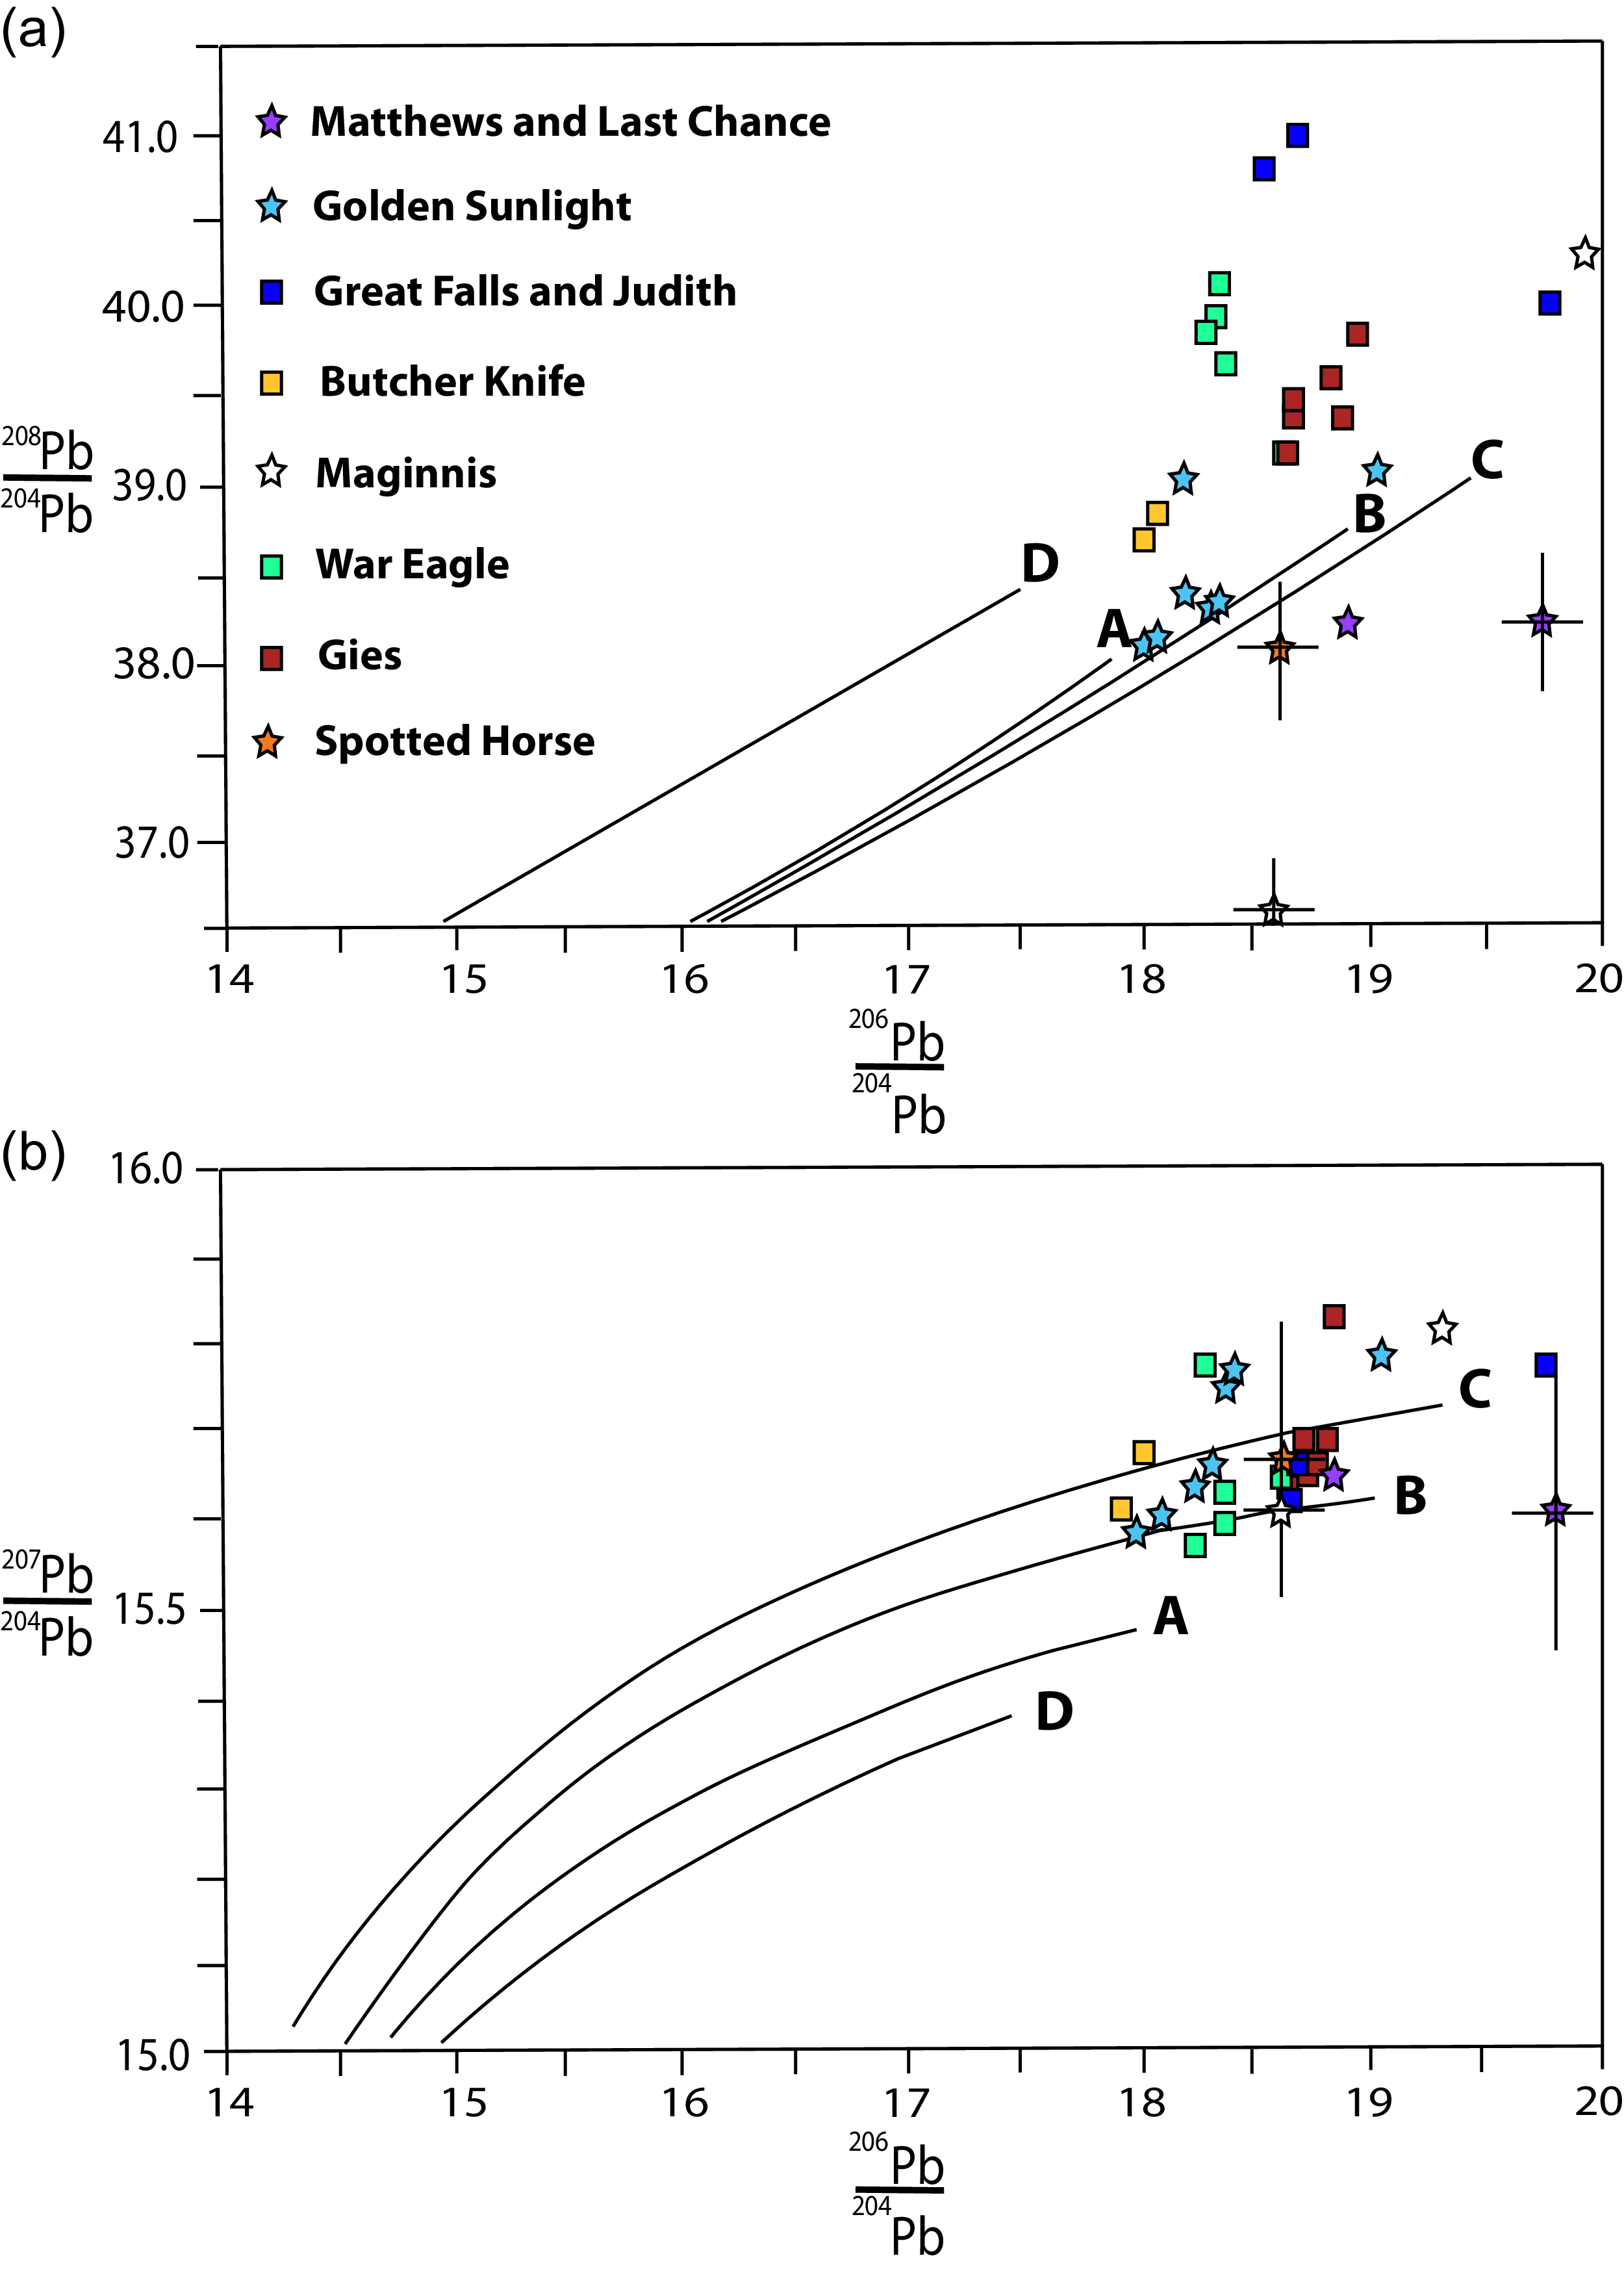
On the basis of mass balance equations, Wilson and Kyser (Reference Wilson and Kyser1988) argued that oxygen and hydrogen isotope data for illite, which they considered to be the alteration product most intimately associated with pyrite and gold, was most consistent with the interaction of a meteoric ore fluid with the Precambrian gneisses at Landusky (Fig. 21). They noted that the only scenario in which the ore fluid could have interacted with the intrusive rocks is at very low water/rock ratios (i.e. <0.01). Wilson and Kyser (Reference Wilson and Kyser1988) proposed that further support for the involvement of the ore fluid with the basement gneisses was provided by Sr isotope data. Strontium isotope ratios of whole rock samples and feldspar separates from the intrusive rocks have 87Sr/86Sr ratios of 0.7043 to 0.7061, whereas a single sample of Lodgepole limestone has a 87Sr/86Sr ratio of 0.7081. These values are low by comparison to ratios obtained from Precambrian gneisses (0.7104 to 0.7646) by Peterman (Reference Peterman1980) and for illite (0.7168 to 0.7784), when corrected to an age of 60 Ma, which were derived by Wilson and Kyser (Reference Wilson and Kyser1988) for the age of the mineralization. Later formed fluorite and dolomite have values of 0.7070 to 0.7090, which appear to have been derived from a source with much lower 87Sr/86Sr ratios, such as the Palaeozoic limestones and the Cretaceous-Tertiary intrusive rocks.
Wilson and Kyser (Reference Wilson and Kyser1988) argued that the wide range of sulphur isotope compositions of sulphur was derived from mixing of igneous, sedimentary, and metamorphic sources. Combining Wilson and Kyser’s (1988) data from fracture fillings and breccias with those obtained in the present study from the same rock types yields a range of δ34S values of −15.0 to +6.3 ‰ (Fig. 16). Although this range is greater than the narrow range of disseminated pyrite in spatially associated intrusive rocks (−6.7 to +4.0 ‰), it is likely that there is a source of sulphur other than the intrusive rocks. Since no data were obtained from disseminated sulphides in the Precambrian basement, it is unclear whether it contributed sulphur to the ore fluids. One possibility is a contribution of biogenic sulphur from the Palaeozoic sedimentary rocks. Such a source would explain the light sulphur isotope compositions and the wide range of isotopic values. To this end, it is significant to note that gilsonite, black carbonaceous material, was reported by Knechtel (Reference Knechtel1959) in vugs in the Mission Canyon limestone near Landusky and in vugs in quartz monzonite porphyry 50 m north of the old Goldbug mine. Knechtel (Reference Knechtel1959) proposed that the gilsonite represented carbonaceous material that migrated into the porphyry from the enclosing Palaeozoic sedimentary rocks. However, given that most of the pyrite analysed in the current study yields negative sulphur isotope values and that the ore-forming was likely boiling, raises the possibility that, like the ore-forming fluids associated with the Golden Sunlight deposit, the ore fluid possessed a high SO4 2-/H2S ratio with H2S partitioning into the vapour phase. However, the oxidised nature of the ore fluid remains in doubt, given the absence of sulphates and the rarity of haematite (just present in stage 4, Supplementary Figure S5), making this scenario less likely.
For deposits in the Judith Mountains, fluid inclusion data from Spotted Horse (this study) and the Gies deposit (Zhang & Spry 1994) suggest that gold was deposited from non-boiling fluids. Mean primary fluid inclusion temperatures for three quartz-bearing stages (1, 2 and 3) at the Gies deposit decreased from 293o ± 10 oC, to 256o ± 9 oC and then to 220o ± 13 oC), respectively. These temperatures are higher than the homogenisation temperatures (113.3o to 199.6 oC) in quartz from the Spotted Horse deposit (Fig. 19). Oxygen and hydrogen isotope compositions of waters from the Gies and Spotted Horse deposits (Zhang & Spry, 1994; Thieben & Spry, Reference Thieben, Spry, Pašava, Kříbek and Žák1995), like those from the Golden Sunlight deposit, support the concept of a mixing of magmatic and meteoric fluids during the precipitation of gold tellurides (Fig. 21). Lead isotope studies of galena in the Judith Mountains (Fig. 18) show that the data occur beyond the 0 age of Stacey and Kramers (Reference Stacey and Kramers1975) and do not overlap the Pb isotope compositions of igneous rocks in the Judith Mountains, which occur below their crustal growth curve. The Pb isotope data for deposits in the Judith Mountains are radiogenic, suggesting interaction with sedimentary rocks through which the ore-forming fluids passed. Regardless of the source of Pb, our data do not allow discrimination of crustal sources based on the orogene arrays of Zartman and Doe (Reference Zartman and Doe1981) (Fig. 22 a, b).
In the absence of fluid inclusion, radiogenic and O-H isotope data, we largely rely on the mineralogy and sulphur isotope compositions to help determine the conditions of formation of the Mayflower deposit. The presence of coexisting sylvanite and petzite in veins implies, on the basis of the experimental data of Cabri (Reference Cabri1965), a maximum temperature of formation of these Te-bearing minerals of 170oC. However, it is possible that these higher temperature phases may have reequilibrated to lower temperatures upon cooling. The range of δ34S values of sulphides in the deposit is large (−29.4 to +4.1 ‰). The possible sources of sulphur and the reasons for the large isotopic variation are: 1. Biogenic reduction of seawater sulphate; 2. Boiling of the ore fluid, which will result in the loss of H2S and produce an increase in fO2 and result in significant variations in the isotopic composition of precipitating sulphides; and 3. Inorganic reduction of seawater sulphate near the pyrite-haematite boundary. The biogenic reduction of seawater sulphate is a viable reason for the wide range of sulphur isotope values. A major part of the Jefferson Dolomite is a thinly bedded, coarsely crystalline fetid dolomite. According to Cocker (Reference Cocker1993), ‘hydrocarbons occur in films on individual grains and in tiny interstitial pellets’. The circulation of hydrothermal fluids through the fetid dolomite could result in highly variable isotopic values. However, given the absence of sulphur isotope compositions of S-bearing species in the Jefferson Formation, this hypothesis remains speculative. The question of whether boiling was an important process in the deposition of ore mineralization at Mayflower also remains uncertain because of the lack of direct evidence for the process. The absence of lattice-textured bladed calcite, which is commonly ascribed to boiling (e.g. Simmons & Christenson, Reference Simmons and Christenson1994), and the lack of transparent minerals for fluid inclusion studies hinder efforts to determine whether or not the ore mineralisation was deposited from a boiling hydrothermal fluid. Nonetheless, high dissolved gas contents of ore fluids can extend the depth of first boiling (Hedenquist & Henley, Reference Hedenquist and Henley1985), which Cooke et al. (Reference Cooke, McPhail and Bloom1996) proposed was the reason for the large vertical extent (> 700m) of precious metal mineralisation in the Baguio district. Although there is no direct evidence for high dissolved gas contents of the ore-forming fluid at Mayflower, this may account for the large vertical extent (> 400 m) of gold-silver mineralisation at Mayflower. However, variations in temperatures and pressures of the ore fluid could also produce phase separation. Negative sulphur isotope values are consistent with sulphide precipitation under oxidising conditions (e.g. near the pyrite-haematite boundary where large variations in the ratio ΣSO4/ΣH2S are expected). However, the only members of the system Fe-S-O present at Mayflower are pyrite and marcasite. Haematite is notably absent, even as inclusions in pyrite, which is a common feature of ores elsewhere in the CMAP, including the nearby Golden Sunlight deposit.
7. Comparisons with other alkaline igneous rock-related gold telluride deposits
Alkaline-igneous rock-related gold telluride deposits occur in rocks of Mesozoic to Neogene age (Kelley et al. Reference Kelley, Spry, McLemore, Fey and Anderson2020). Most of the largest deposits are low-sulphidation (adularia-sericite) epithermal deposits, similar to those in Montana. Worldwide deposits occur as veins (e.g. Emperor, Pals & Spry, Reference Pals and Spry2003), breccia-fillings and disseminations (e.g. Cripple Creek, Kelley et al. Reference Kelley, Romberger, Beaty, Pontius, Snee, Stein and Thompson1998; Kadel-Harder et al. Reference Kadel-Harder, Spry, Layton-Mathews, Voinot, von der Handt and McCombs2021) and may be genetically related to low-grade porphyry Mo or Cu deposits (e.g. Emperor, Cripple Creek). They occur in various geological settings, including post-subduction or back-arc rifts and continent-arc collision zones (e.g. Richards, Reference Richards and Thompson1995; Kelley et al. Reference Kelley, Spry, McLemore, Fey and Anderson2020). They are spatially related to deep structures that allow for the upwelling of magmatic-hydrothermal fluids and alkaline magmas. This also appears to be the case for the location of alkaline igneous rock centres in Montana that are spatially related to the regional NE-SW trending Great Falls Tectonic Zone and the NW-SE trending Lewis and Clark Line (Fig. 1), the latter of which is a prominent zone of oblique-slip, dip-slip and strike-slip faults (Sears et al. Reference Sears, MacDonald, Lonn, Morgan and Quane2010). Host rocks are varied and include monzonite, quartz monzonite, monzogranite, diorite, syenite, phonolite, and lamprophyre. While the alkaline-igneous rock-related gold deposits contain varying proportions of native metals, sulphides, sulphosalts, tellurides and sulphotellurides, they also commonly contain adularia, sericite, carbonates, fluorite, and roscoelite (e.g. Emperor and Tuvatu, Fiji; Pals & Spry, Reference Pals and Spry2003; Scherbarth & Spry, Reference Scherbarth and Spry2006). These ores have the following characteristic elemental signature: Au-Ag-Te-F-V, which is part of the elemental signature recognised for deposits in central Montana (e.g. Golden Sunlight, Spotted Horse, Gies).
In summarising the results of fluid inclusion studies, Kelley et al. (Reference Kelley, Spry, McLemore, Fey and Anderson2020) showed that homogenisation temperatures in various minerals in worldwide gold telluride deposits range from ∼80o to 350 oC with most reported salinities ranging from 0.5 to 10 wt. percent NaCl. The telluride-bearing stages primarily occur between 130o and 270 oC, which is commensurate with the range of temperatures derived from fluid inclusion studies for minerals in gold telluride deposits in Montana, with similar fluid salinities. In some deposits, metallic mineral precipitation is associated with phase separation (e.g. Tuvatu, Golden Sunlight). Similar to the gold telluride deposits in Montana, oxygen and hydrogen isotope studies suggest a magmatic contribution with meteoric waters (and possibly evolved groundwater) associated with ore formation (e.g. Emperor and Tuvatu, Fiji; Pals & Spry, Reference Pals and Spry2003; Scherbarth & Spry, Reference Scherbarth and Spry2006). Sulphur isotopes also indicate magmatic values for most gold telluride deposits worldwide, including those in Montana, although a sedimentary contribution is also indicated for some deposits (e.g. Emperor, Ahmad et al. Reference Ahmad, Solomon and Walshe1987; Mayflower, Zortman-Landusky). Lead and noble gas isotopic constraints (He, Ne, Ar) of Te-bearing low sulphidation precious metal deposits in NE China point to the derivation of ore fluids from mafic magmas from the mantle and mixing with meteoric waters at shallow levels (e.g. Zhai et al 2015; Gao et al. Reference Gao, Hofstra, Qin, Zou, Pribil, Hunt, Manning, Lowers and Xu2024). Lead isotope studies of alkaline igneous rock-related deposits in Montana (Golden Sunlight, Gies, Spotted Horse, Maginnis) suggest the involvement of crustal Pb in a manner similar to that proposed by Kelley et al. (Reference Kelley, Romberger, Beaty, Pontius, Snee, Stein and Thompson1998) for Cripple Creek, Colorado. While Te and Au can be carried in the vapour and liquid phases under varying physicochemical conditions (e.g. Williams-Jones & Heinrich, Reference Williams-Jones and Heinrich2008; Zhu et al. 2011; Grundler et al. Reference Grundler, Brugger, Etschmann, Helm, Liu, Spry, Tian, Testemale and Pring2013; Zhai et al. 2018; Hurtig et al. Reference Hurtig, Adams, Marion, Slodczyk, Gysi and Midisov2025), it is also apparent that immiscible polymetallic Te-Au-rich melts may interact with hydrothermal fluids and result in the precipitation of telluride-rich gold ores (e.g. Jian et al Reference Jian, Mau, Lehmann, Cook, Xie, Liu, Duan, Alles and Niu2021; Fan et al. Reference Fan, Li, Zhong, Gleeson, Yao, Harlov, Deng, Cui, Yu and Gao2025). Experimental studies of Cabri (Reference Cabri1965) showed that the eutectic in the system Au-Ag-Te is 304 oC while Fan et al. (Reference Fan, Li, Zhong, Gleeson, Yao, Harlov, Deng, Cui, Yu and Gao2025) showed that it can be as low as 243o to 270 oC due to the presence of minor elements including Ag, Pb, Bi, Cu, Fe and S in the melt. The system Au-Bi has a eutectic at 241 oC (Nathans & Leider, Reference Nathan and Leider1962; Okamoto & Massalski, Reference Okamoto and Massalski1983), suggesting, in the case of the Golden Sunlight deposit, where Gammons and Singh (Reference Gammons and Singh2024) identified polymineral inclusions in high-grade calaverite-tetradymite ore and proposed that they are melt inclusions. Fluid inclusions in quartz with homogenisation temperatures as high as 398 oC (Spry et al. 1996) are well above eutectic temperatures in this system. The elemental association Au-Bi-Te-Cu-S is also characteristic of metallic mineral assemblages in the Zortman and Spotted Horse-Kentucky Favourite deposits and raises the possibility that polymetallic Te-bearing melts may have formed elsewhere in the central Montana alkali belt.
8. Conclusions
The major conclusions of the present study are as follows:
-
1. Epithermal gold telluride deposits in the CMAP of Montana are spatially related to alkaline igneous rocks (monzonite, quartz monzonite, diorite, syenite, tinguaite, and lamprophyre) that upwelled along regional faults within the Great Falls Tectonic Zone and the Lewis and Clark Line.
-
2. Metallic mineralisation exhibits a variety of types, including: low-grade carbonate-replacement zones at igneous rock contacts, bonanza veins, breccia pipe-hosted deposits, igneous-hosted and disseminations, with multiple types occurring at any given location.
-
3. The deposits are characterised by a complex metallic mineralogy involving tellurides, sulphotellurides, sulphides and native elements with Au:Ag ratios from <4 to 20, and an adularia-sericite±roscoelite±fluorite alteration.
-
4. An elemental signature of Au-Ag-Te±F ± V ± Mo can be used for exploration purposes for both Au and Ag, as well as the critical element Te, and resembles the elemental association for other worldwide alkaline igneous rock-related epithermal deposits. Gold telluride mineralisation in hydrothermal breccias at Golden Sunlight is telescoped on a low-grade porphyry Mo system while molybdenite occurs in the igneous-hosted Zortman-Landusky deposits.
-
5. Mineralogical, paragenetic and O and H isotope data suggest that gold-silver tellurides generally formed late in the paragenetic sequence of multiple stages of hydrothermal mineralisation from meteoric fluids that were preceded by fluids with a magmatic component. Metallic minerals were precipitated from fairly oxidised, moderately saline, and near-neutral pH fluids at around 130o to 270 oC. Although the source of sulphur is considered to be magmatic in most deposits, a sedimentary contribution from disseminated sulphides in spatially related Palaeozoic and Palaeoproterozoic sedimentary rocks may also be important in some deposits in Montana. The deposits that are associated with a boiling fluid commonly have negative sulphur isotope values, suggesting fractionation between H2S and SO4 2- in a cooling magmatic-hydrothermal fluid. Lead isotopes are commensurate with a crustal source of Pb.
-
6. The presence of bonanza-grade ores in some deposits (e.g. Golden Sunlight, Spotted Horse-Kentucky Favourite) may be the result of the precipitation of Au and Te from a boiling fluid or to the interaction between an immiscible polymetallic melt and ore fluids under epithermal conditions.
-
7. Epithermal gold telluride deposits in the CMAP share geological and geochemical characteristics with alkaline igneous rock-related Au-Te deposits elsewhere in the world (e.g. Cripple Creek, Ladolam, Porgera, Emperor, Tuvatu) in that they are commonly associated with upwelling alkaline magmas spatially related to major structures, hydrothermal breccias and, in the case of the Golden Sunlight deposit, is spatially related to a porphyry system. The Au-Ag-Te±F ± V hydrothermal signature generally related to alkaline igneous rock-related Au-Te deposits worldwide is also recognised in the CMAP deposits.
Supplementary material
To view supplementary material for this article, please visit https://doi.org/10.1017/S0016756825100290
Acknowledgements
We would sincerely like to thank Allan Kirk for allowing us access to the Mayflower property and for discussions concerning the geology of the Mayflower deposit. Dick Berg and Lester Zeihen, formerly of the Montana Bureau of Mines, are gratefully acknowledged for kindly providing samples from the Mayflower deposit, as is Mark Cocker, who furnished us with additional samples and sections. Richard Forrest provided sulphide samples from some occurrences in the Judith Mountains for sulphur isotope studies. Alfred Kracher aided with electron microprobe analyses. Bruce Nelson (University of Washington) analysed lead isotope compositions, while sulphur isotope compositions were determined by Doug Crowe (University of Georgia) and Ed Ripley (Indiana University). Various discussions with Fess Foster, Taras Bryndzia, Tom Chadwick, Jack Truckle, David Odt, and Chris Gammons improved our understanding of the geology of the Golden Sunlight deposit. The constructive reviews of Chris Gammons and an anonymous reviewer are greatly appreciated and significantly improved the quality of the manuscript. Tim Johnson is thanked for his editorial handling of the paper and for his comments.
Competing interests
The authors declare none.

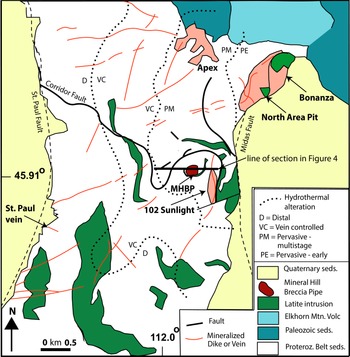
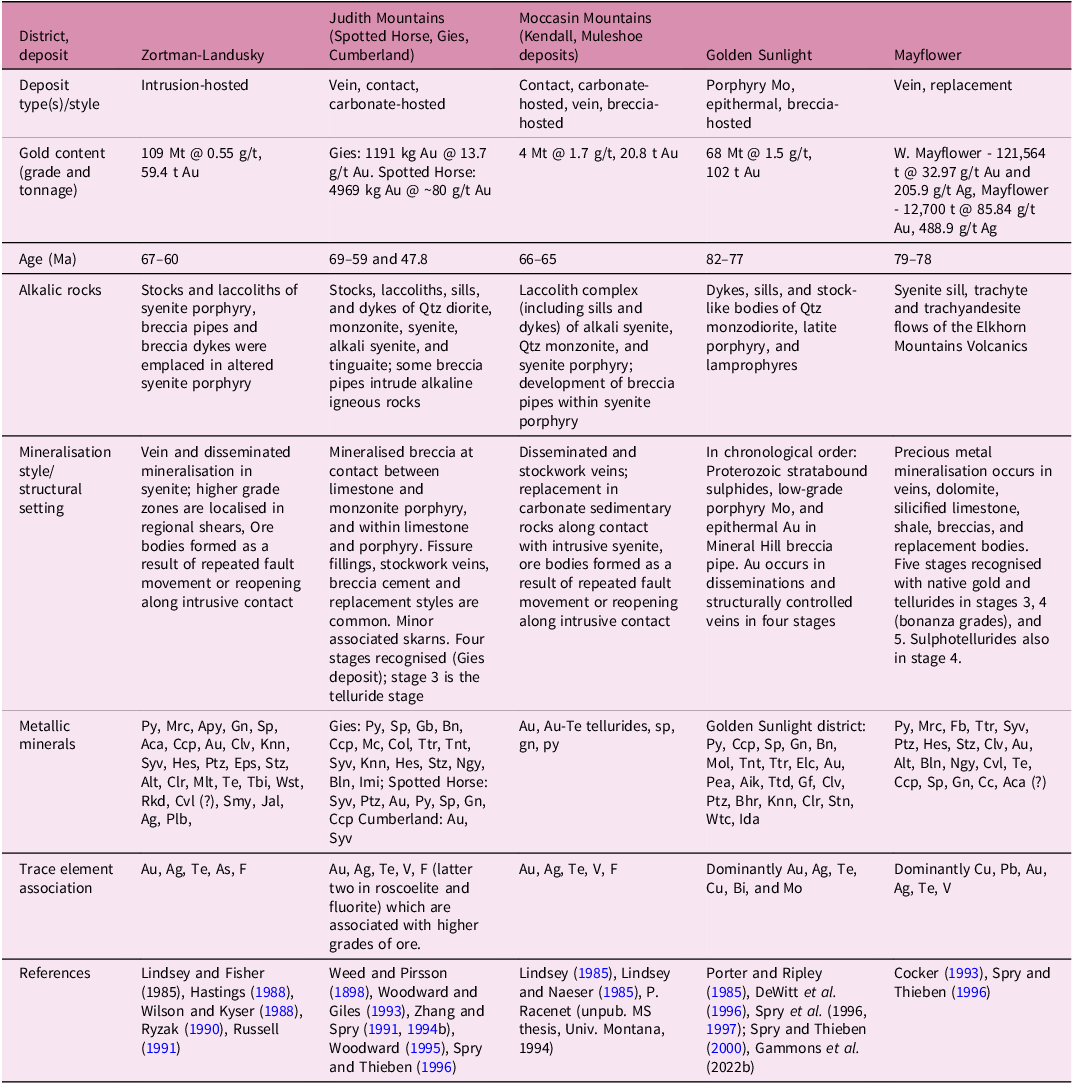


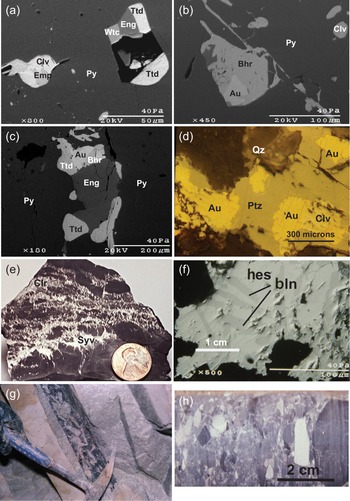
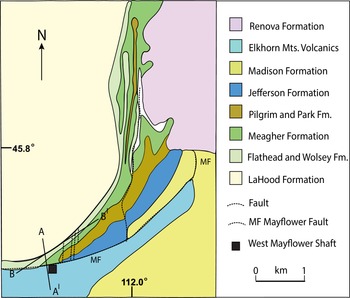
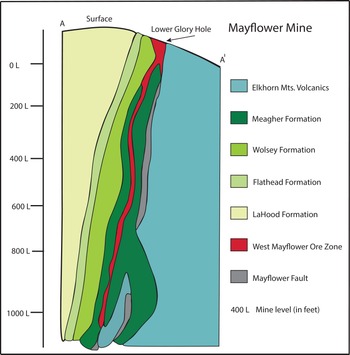
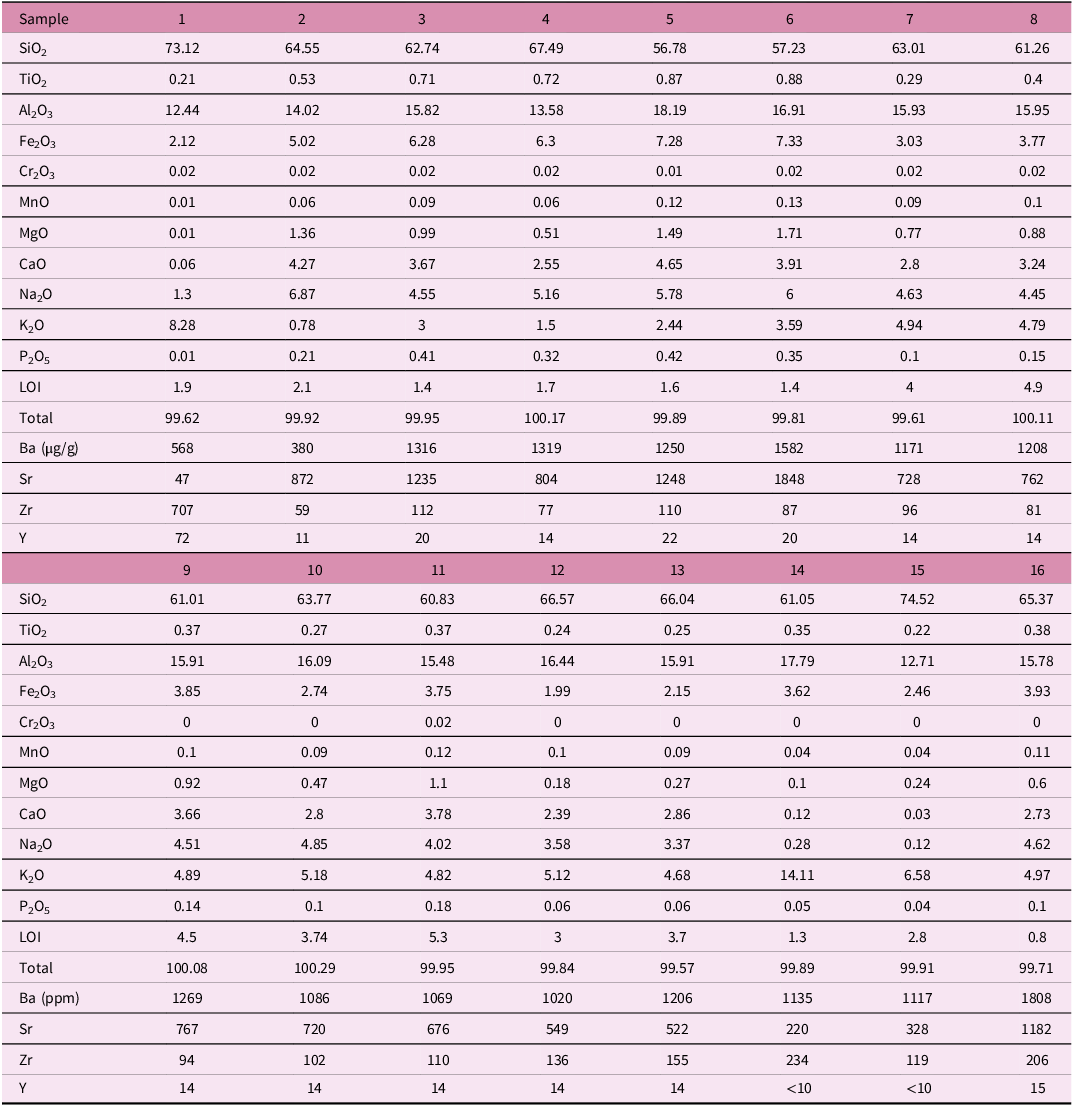
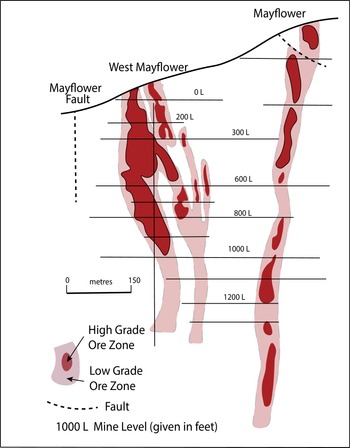
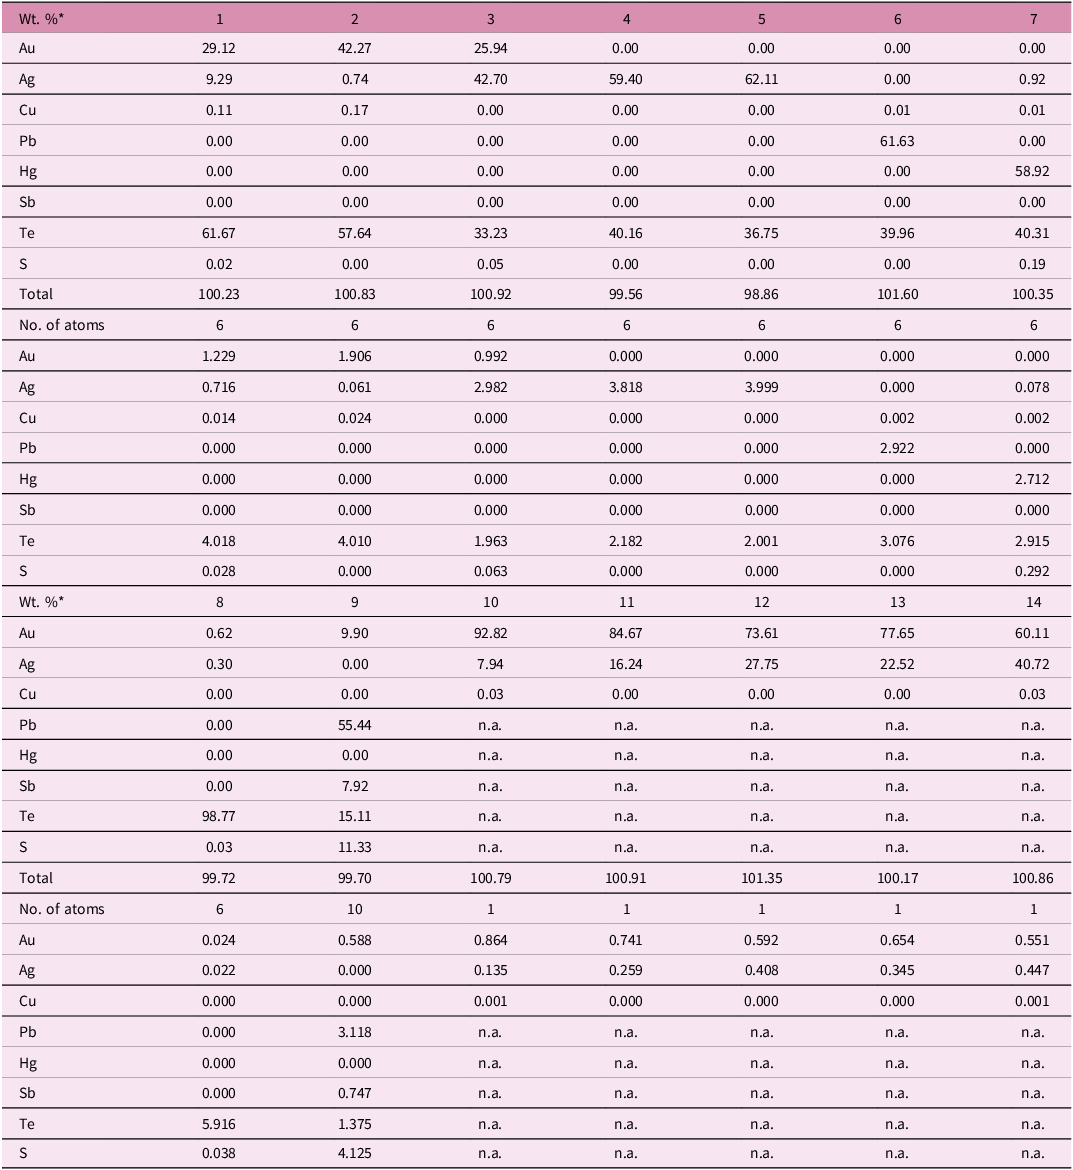
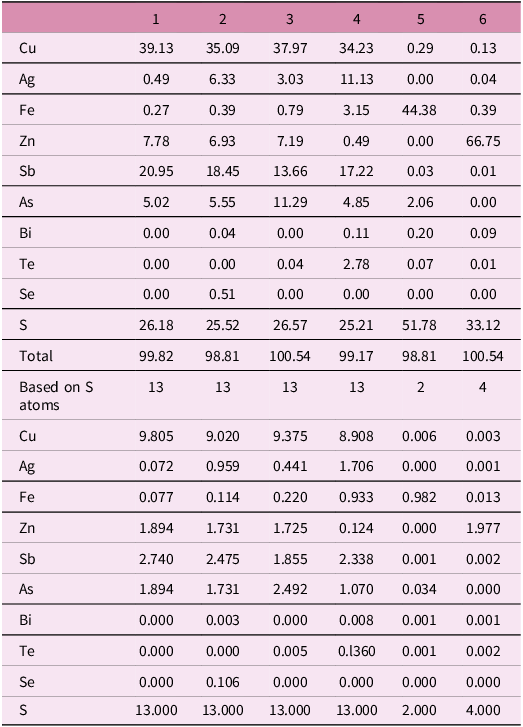
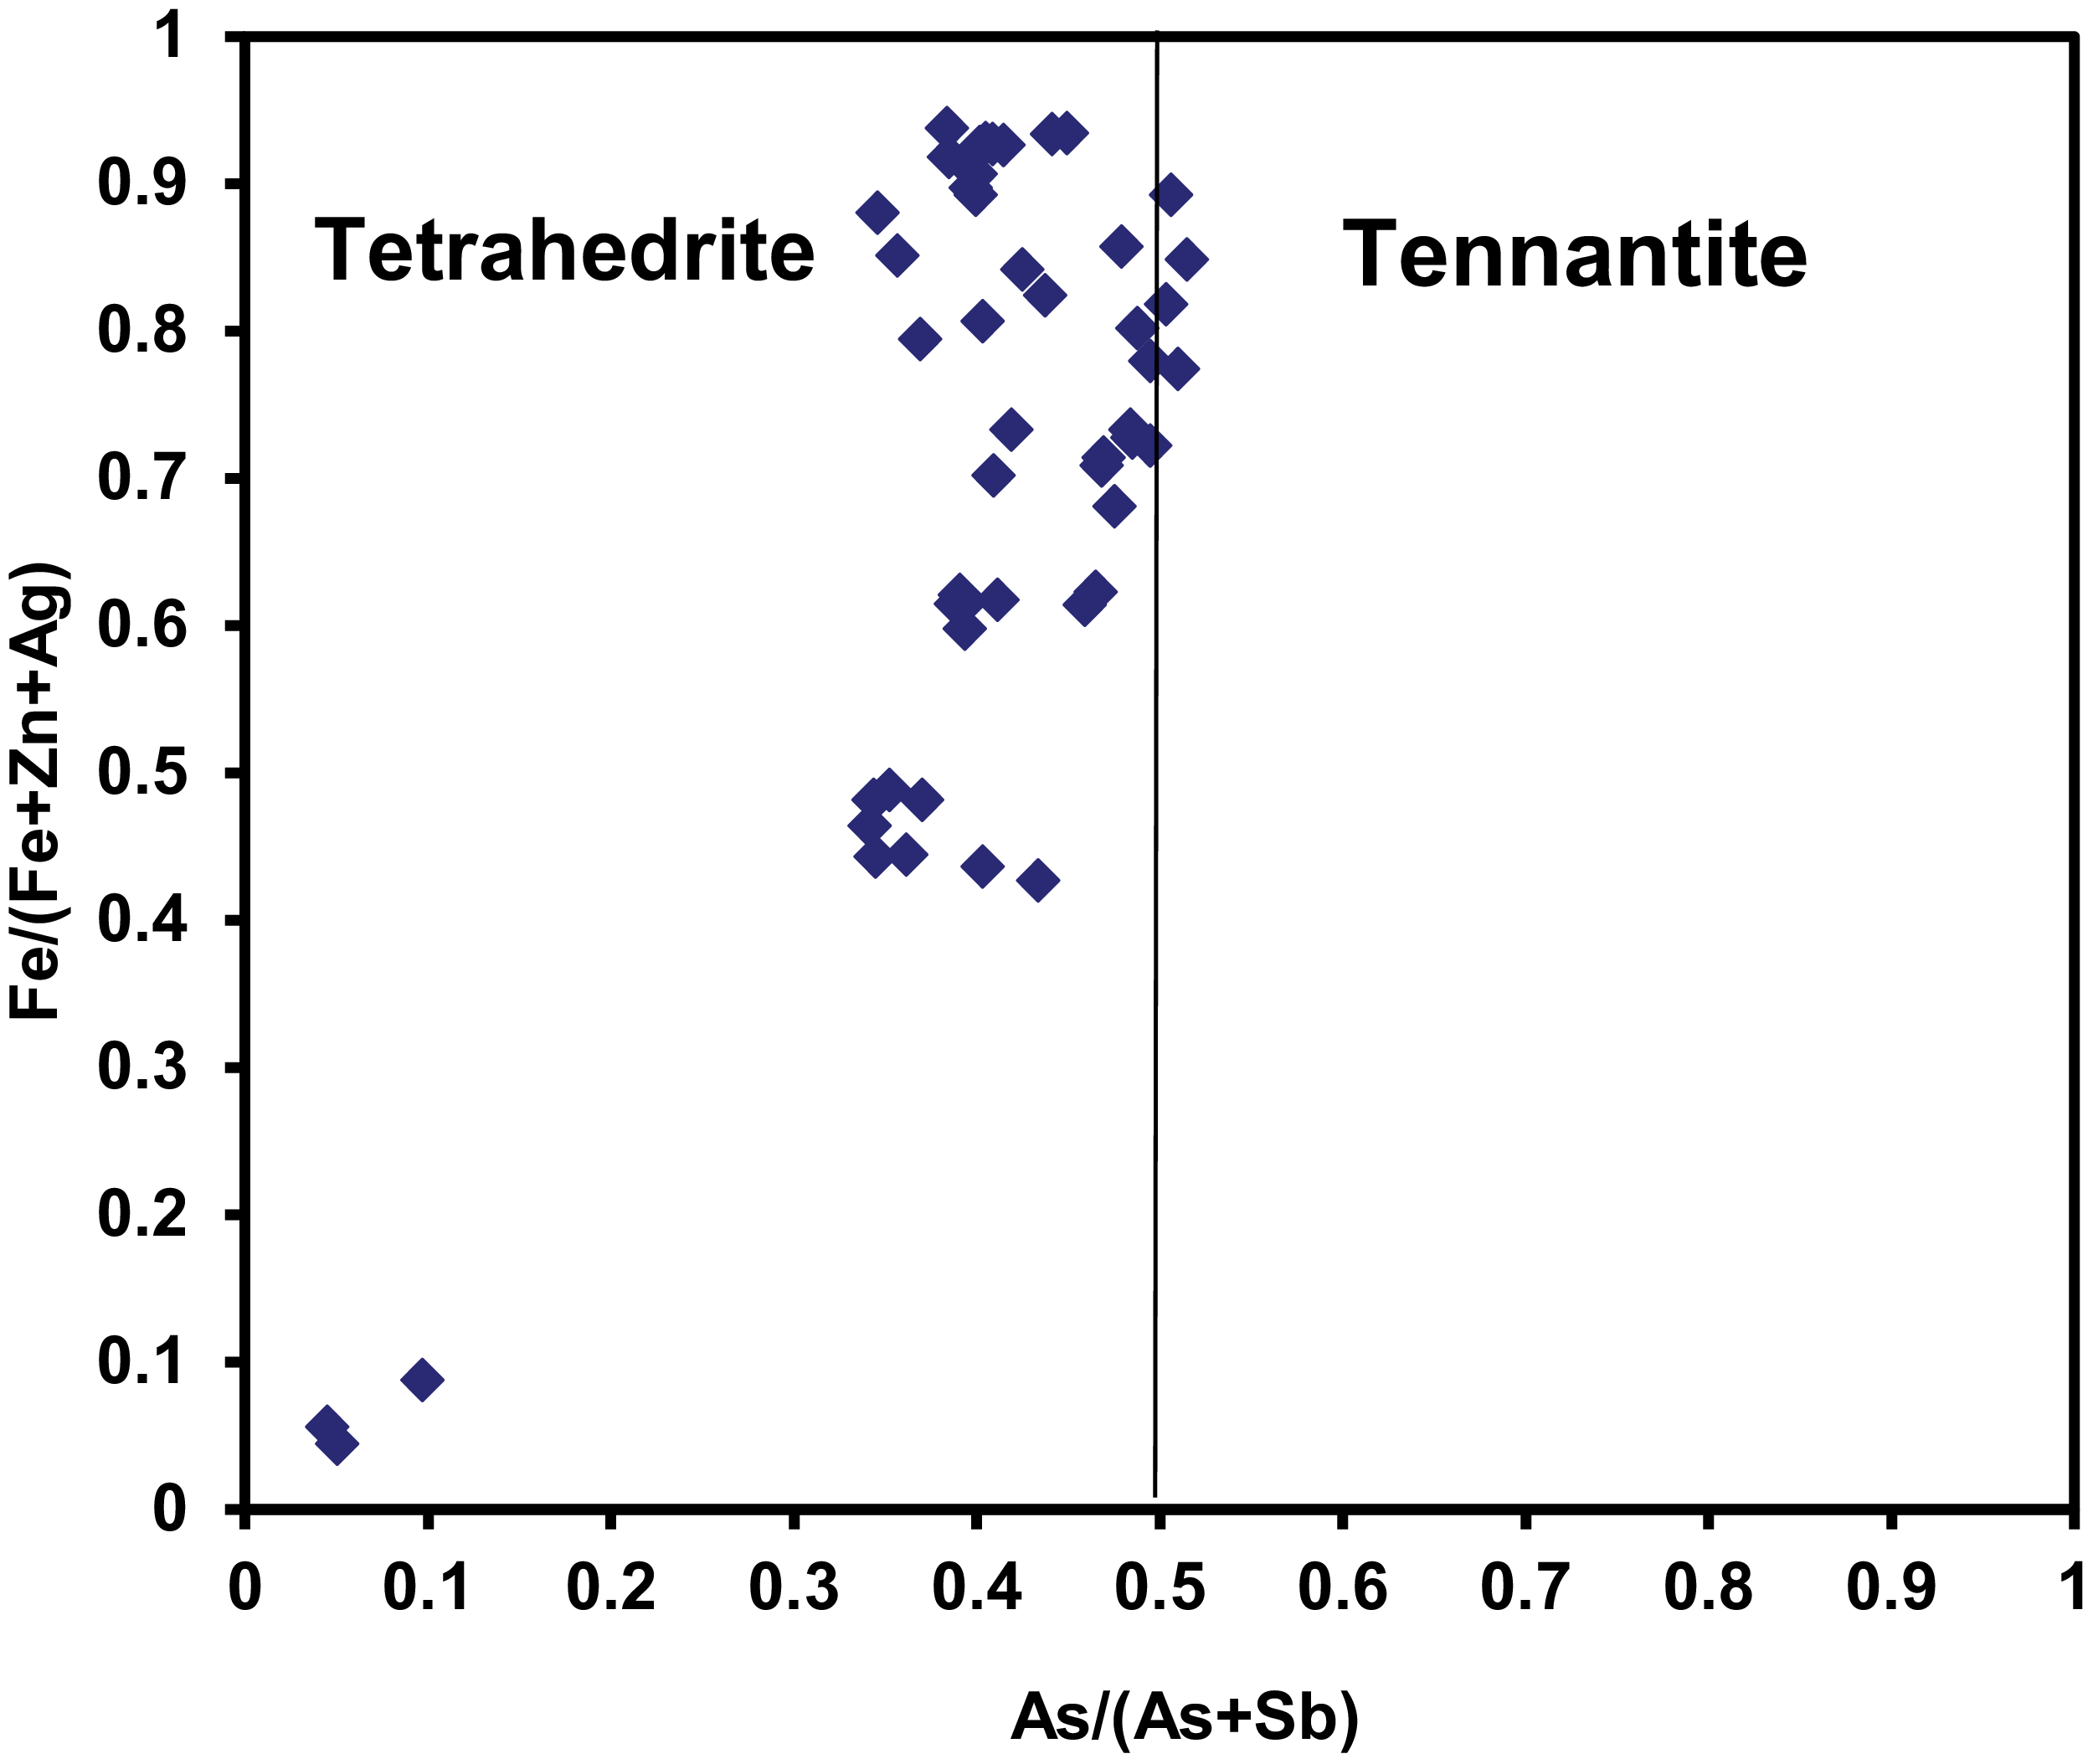


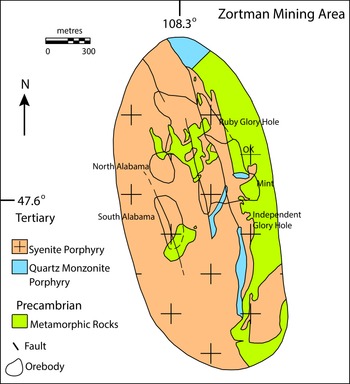

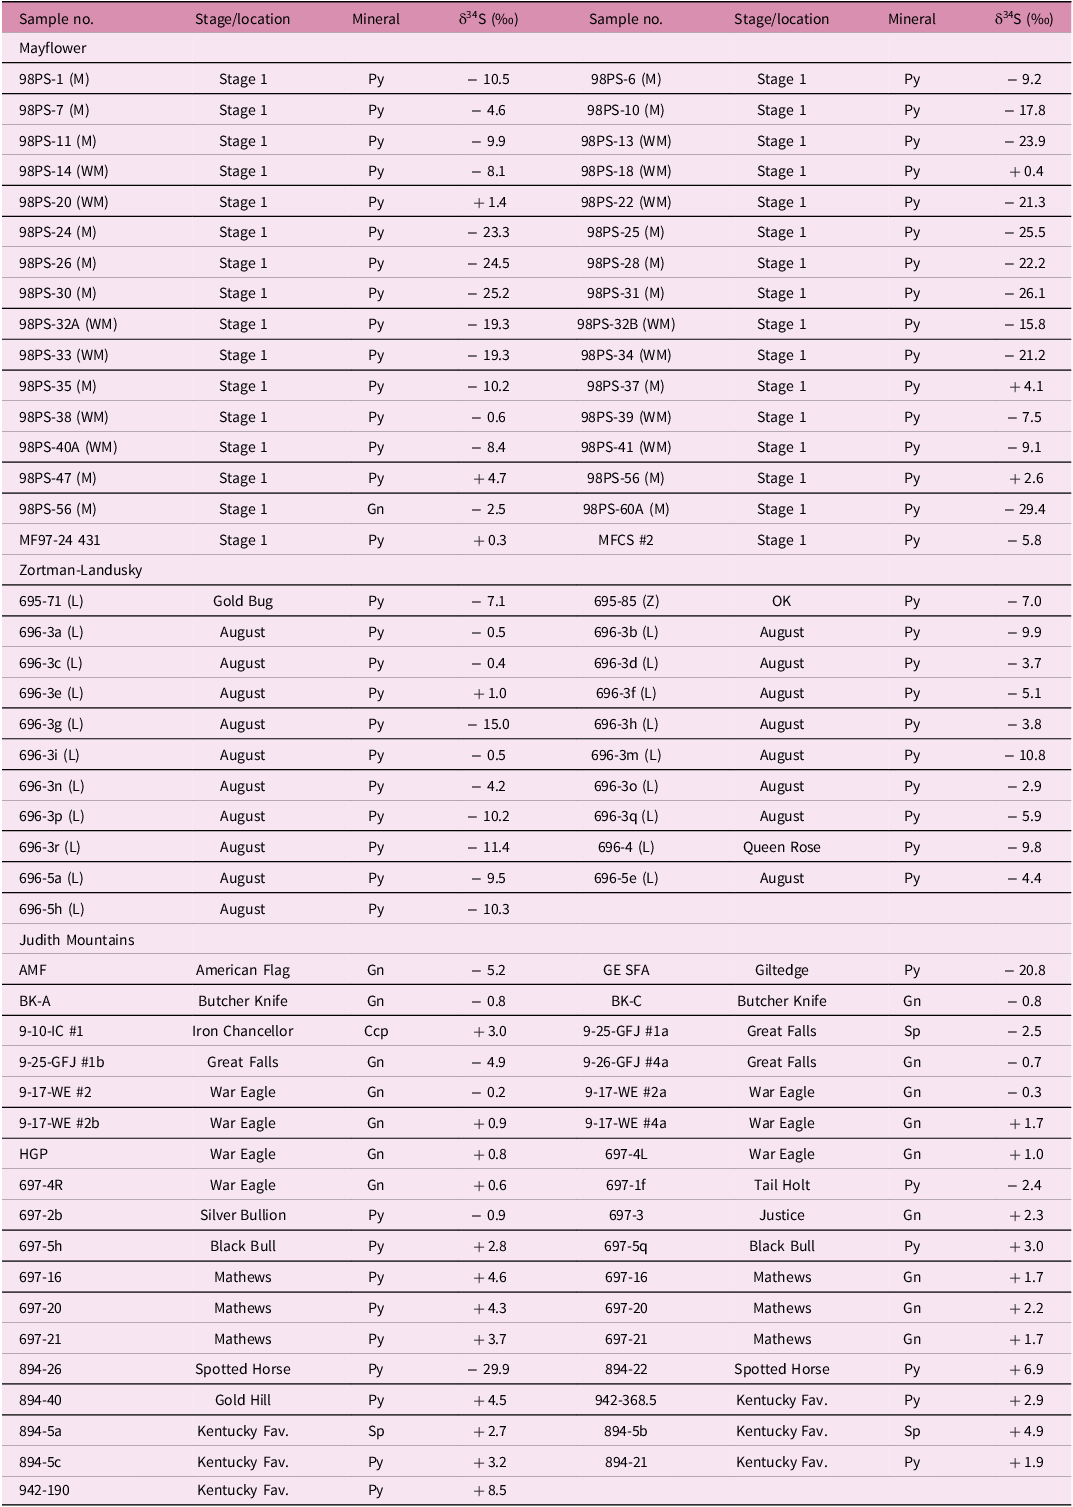

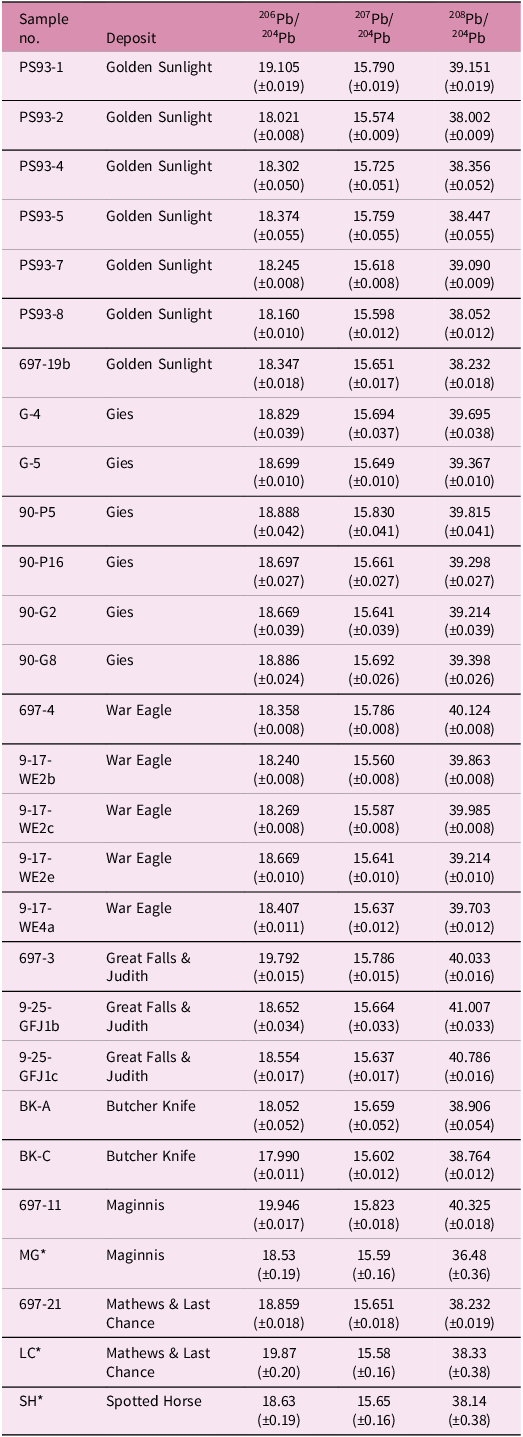



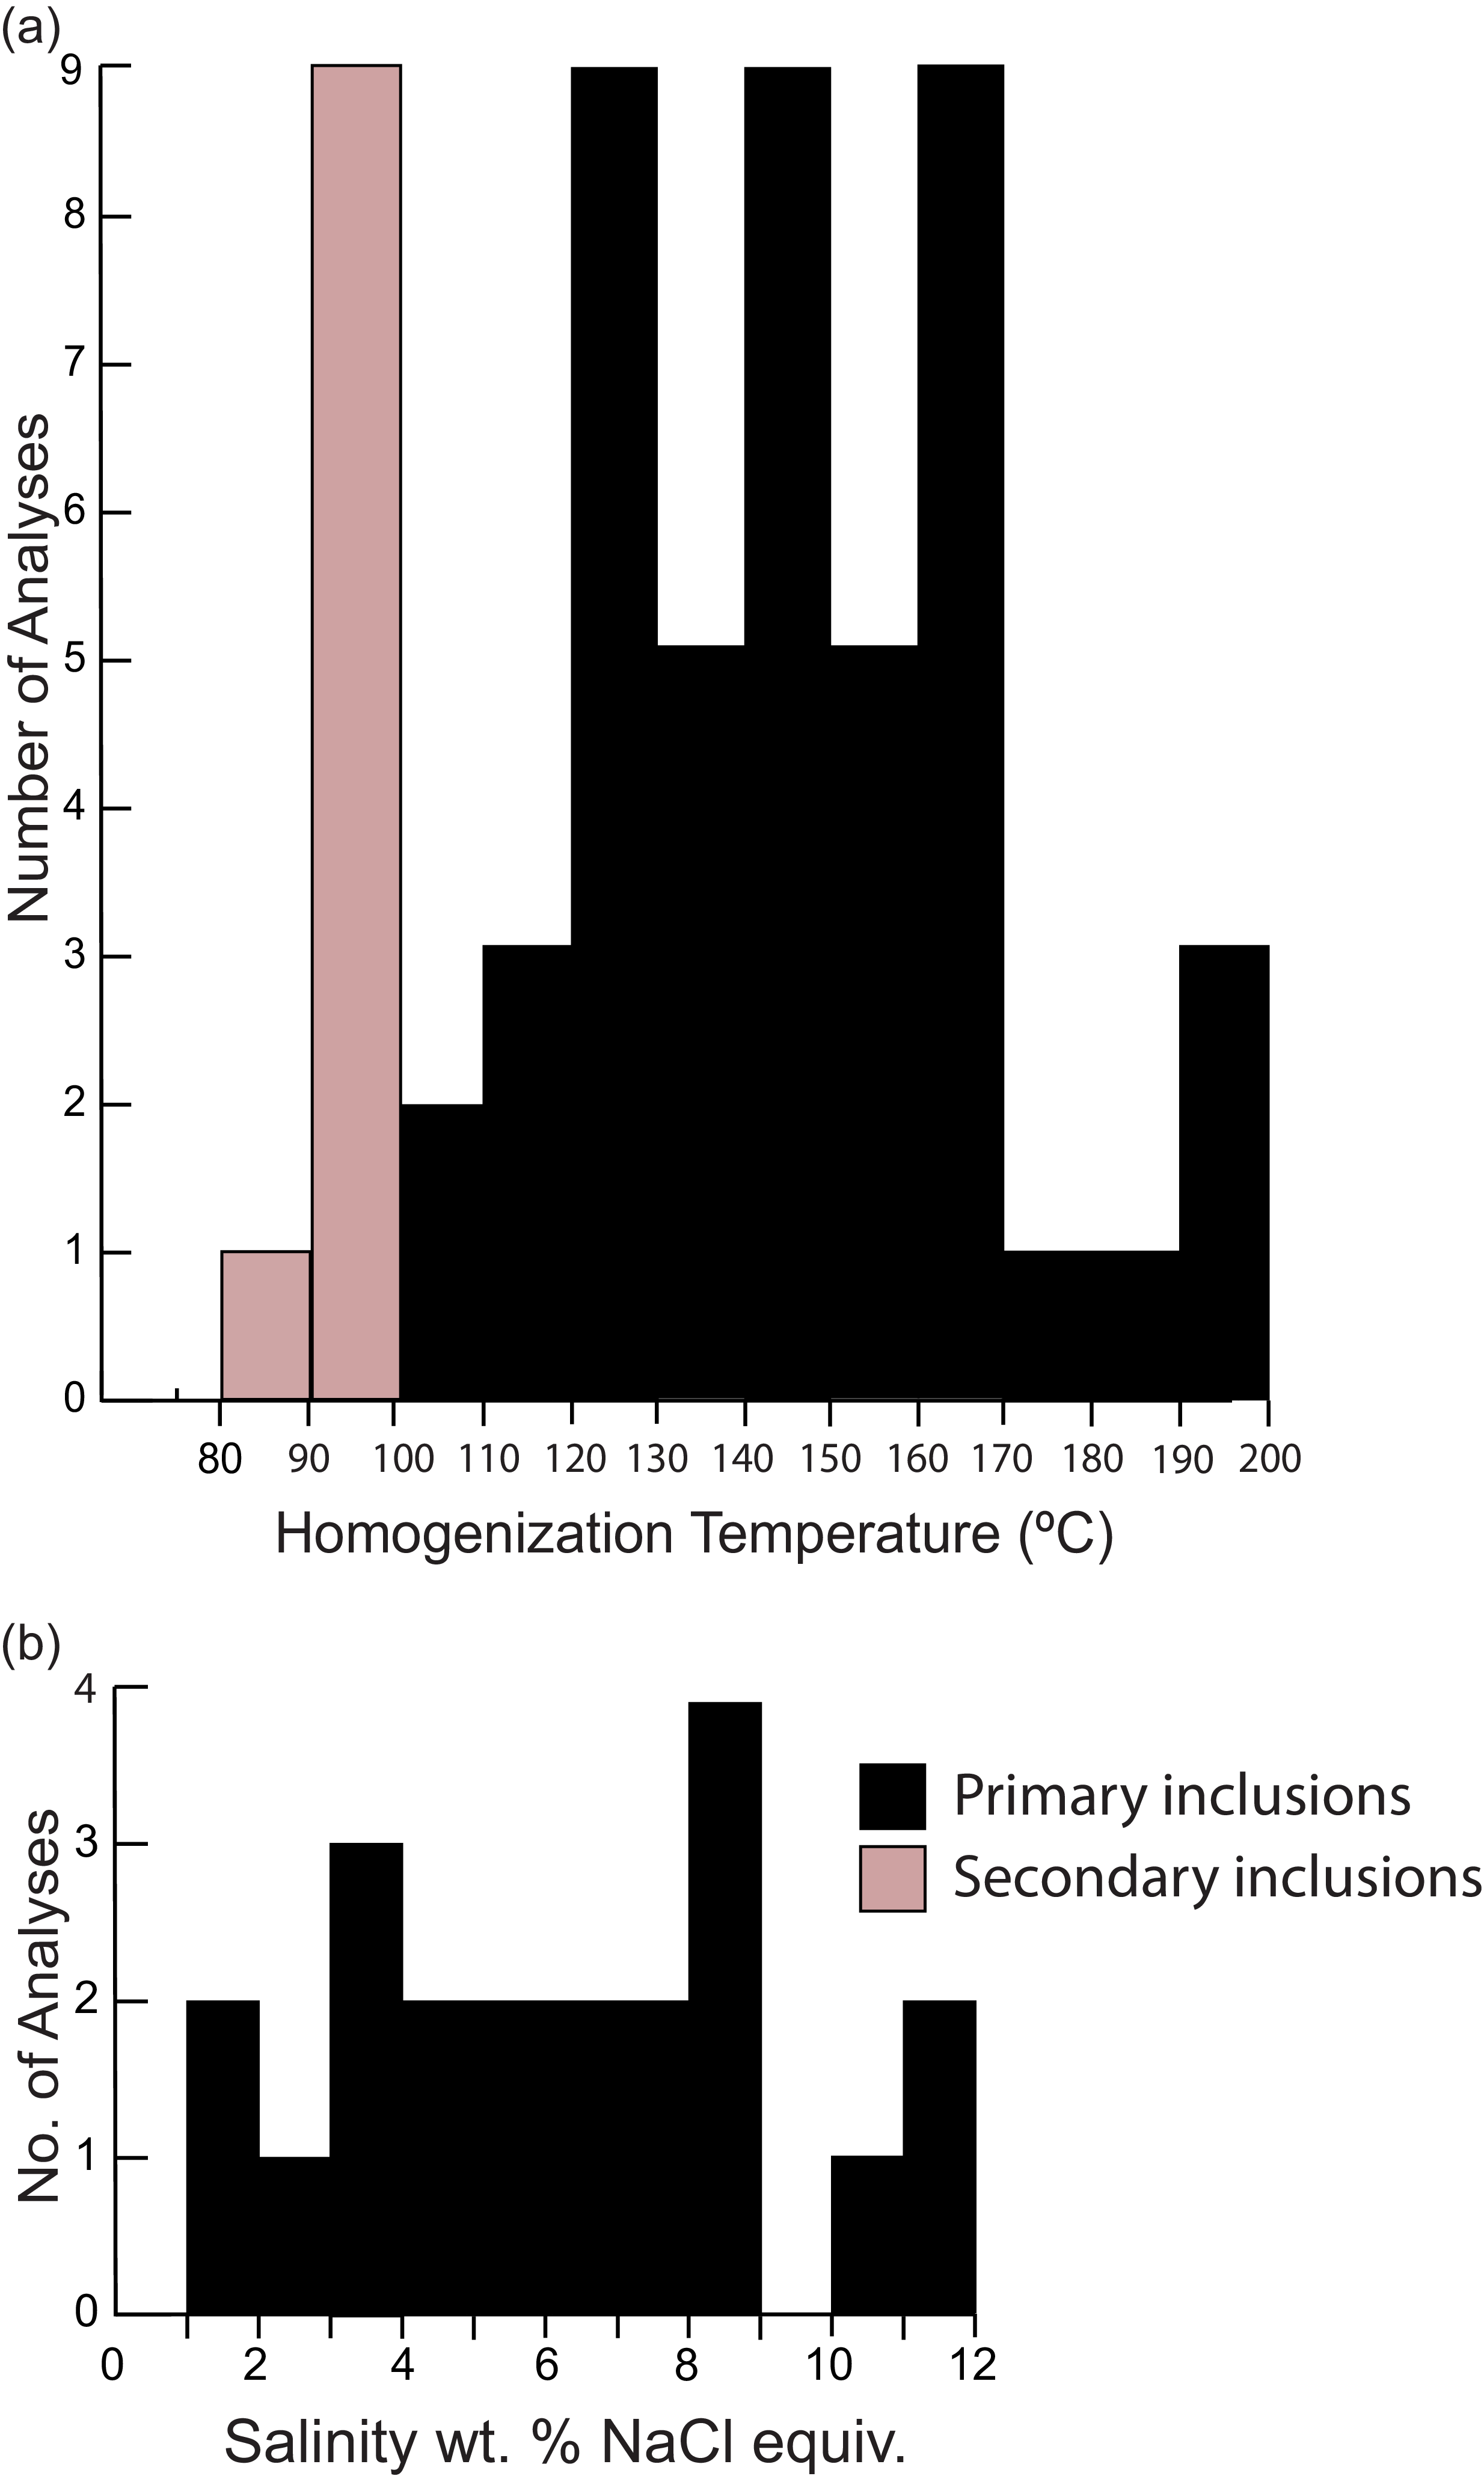
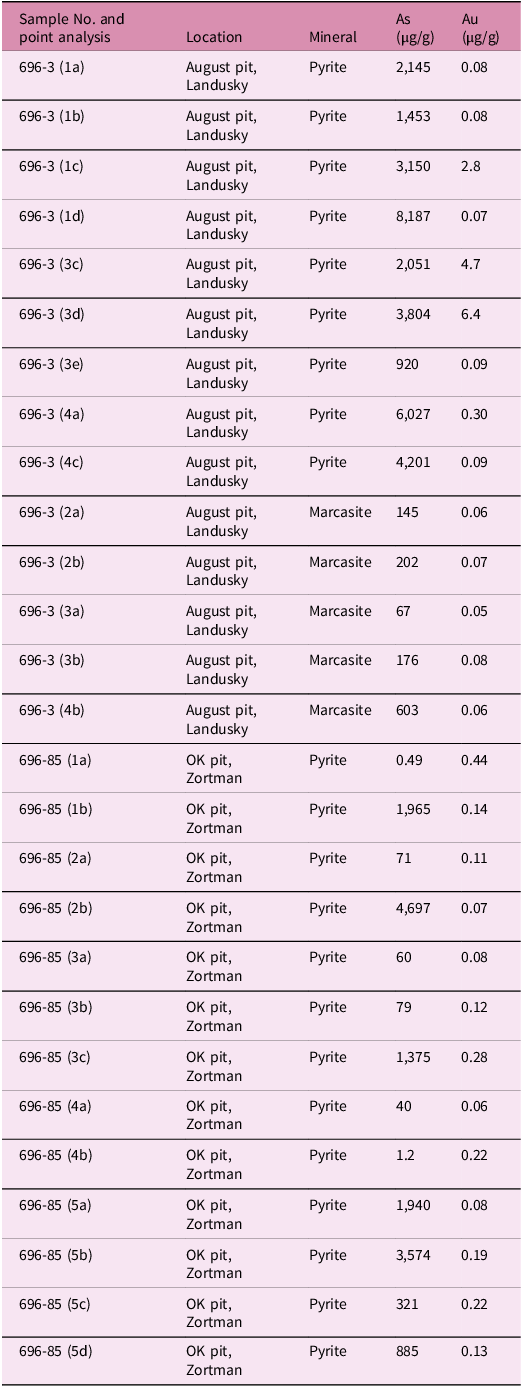


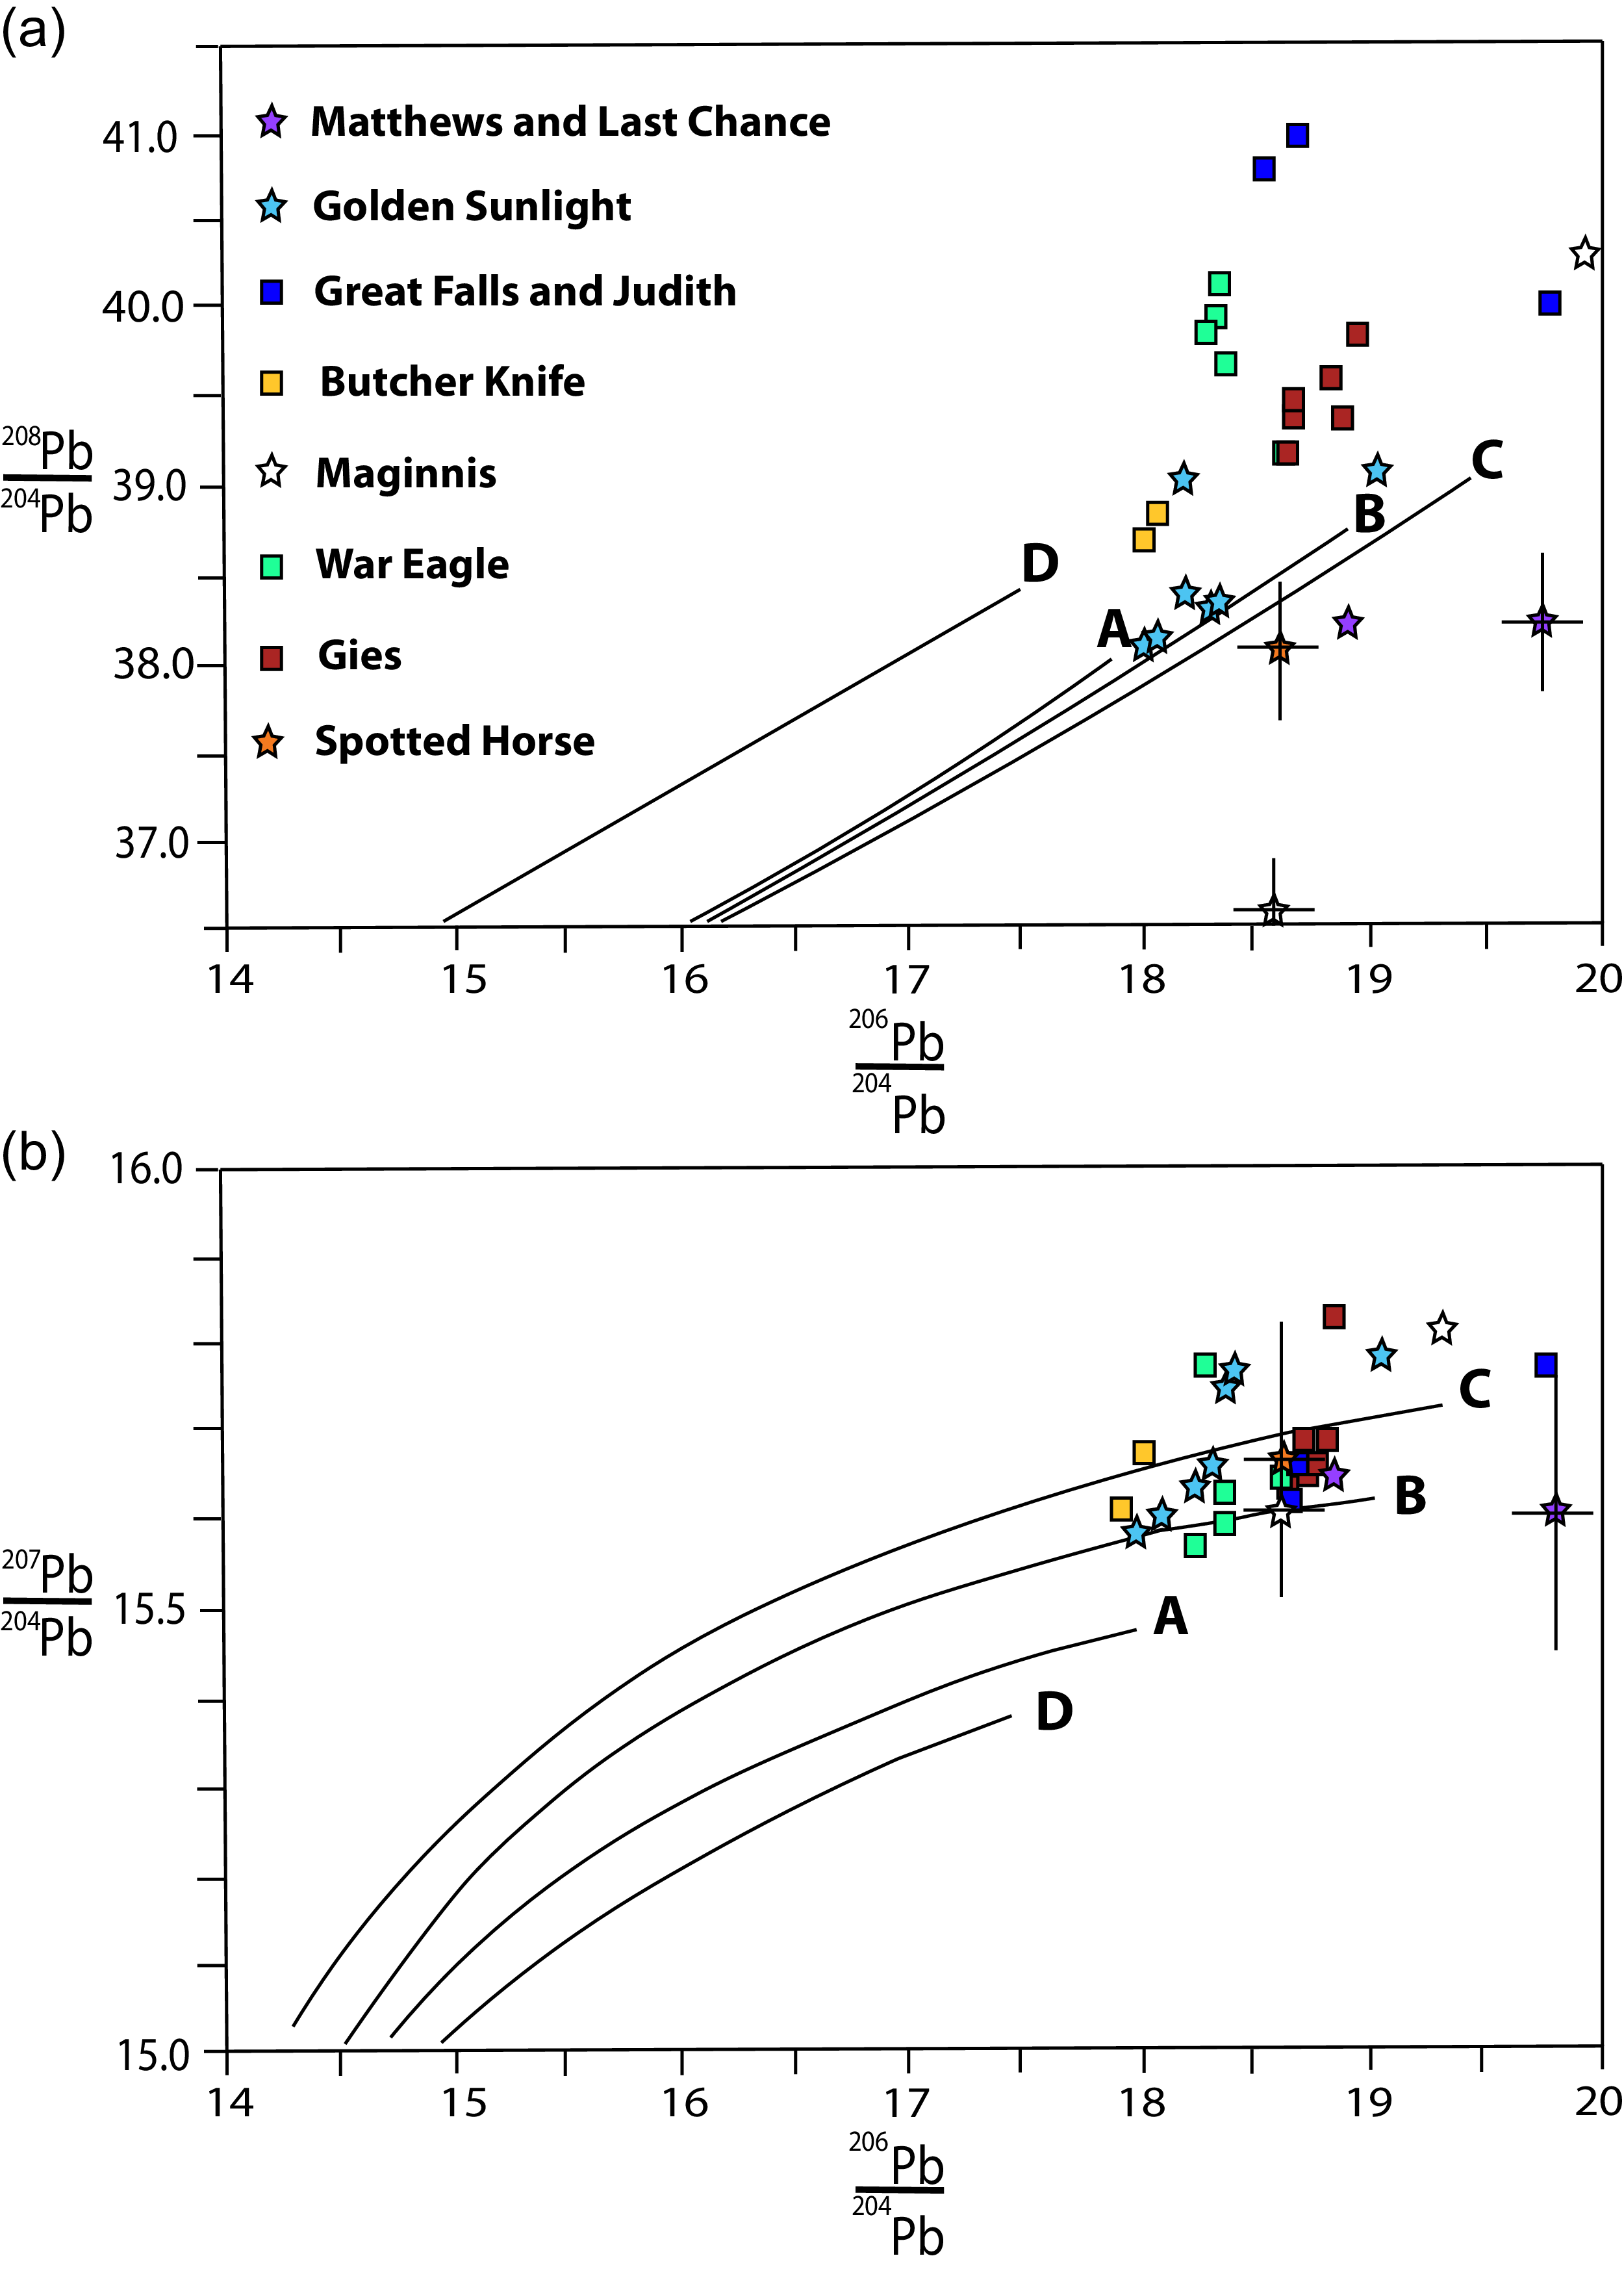


 Open access

