


The Dead Sea is a hypersaline terminal desert lake located in the Dead Sea Valley and terminates the drainage system of the Jordan River (Fig. 1). The Dead Sea Valley is the lowest exposed land on Earth. From a geological point of view, the Dead Sea Basin is an active pull-apart basin located within the morphotectonic depression of the Dead Sea Rift (Garfunkel & Ben-Avraham, Reference Garfunkel and Ben-Avraham1996; Garfunkel, Reference Garfunkel, Niemi, Ben-Avraham and Gat1997). The Dead Sea includes the northern deep Dead Sea (Fig. 1b), with the deepest submarine bottom point today at ~730 m below the mean sea or ocean level (BMSL) and the southern shallow part separated by the Lisan Peninsula and occupied by evaporation ponds (Neev & Hall, Reference Neev and Hall1979).
The Dead Sea region. (a) Location map of the Dead Sea. (b) Site map of the Dead Sea area.

A generalized geological map of the Dead Sea Basin and adjacent regions is presented in Fig. 2. The main units exposed at the margins of the Dead Sea Basin are Upper Cretaceous carbonate rocks (Fig. 2). On the eastern side of the Dead Sea Basin, Cambrian to Lower Cretaceous clastic rocks are also exposed.
Generalized geological map of the Dead Sea Basin and adjacent regions (modified from the generalized geological map of Israel of the Geological Survey of Israel).

The main units exposed in the periphery of the Dead Sea are Late Neogene–Quaternary (Fig. 2). These units are classified in the Dead Sea Group, which comprises clastic, detrital, evaporitic, lacustrine and fluvial sediments (Stein, Reference Stein2001). This group includes the Sedom, Amora, Samra, Lisan and Ze'elim formations, which were deposited from the Late Neogene Sedom Lagoon (Shoval & Zlatkin, Reference Shoval and Zlatkin2009), throughout the Quaternary lakes of Amora, Samra and Lisan and up to the Holocene Dead Sea (Bookman et al., Reference Bookman, Enzel, Agnon and Stein2004; Stein, Reference Stein, Garfunkel, Ben-Avraham and Kagan2014).
The Holocene clayey sediments of the mudflats studied here are classified in the stratigraphic unit ‘Ze'elim Formation’ (Yechieli et al., Reference Yechieli, Magariz, Levy, Weber, Kafri, Woelfli and Bonani1993; Stein, Reference Stein, Garfunkel, Ben-Avraham and Kagan2014). This Formation also consists of gravel deposits that occur in alluvial fans. The Ze'elim Formation reaches a thickness of ~20–30 m in the north-western Dead Sea shore and ~80 m in the south-western part (Stein, Reference Stein2001). A subsurface salt-rock unit, ~20–30 m thick, usually occurs at the base of the Ze'elim Formation (Yechieli et al., Reference Yechieli, Abelson, Wachs, Shtivelman, Crouvi, Baer, Yuhr, Alexander and Beck2003, Reference Yechieli, Abelson, Bein, Crouvi and Shtivelman2006; Abelson et al., Reference Abelson, Yechieli, Crouvi, Baer, Wachs, Bein, Shtivelman, Enzel, Agnon and Stein2006; Stein, Reference Stein, Garfunkel, Ben-Avraham and Kagan2014; Avni et al., Reference Avni, Lensky, Dente, Shviro, Arav and Gavrieli2016).
The clayey sediments of the Ze'elim Formation are characterized by a fine-grained laminated texture, in which a dark lamina of detritus alternates with a light lamina of authigenic minerals (Bookman et al., Reference Bookman, Enzel, Agnon and Stein2004). The laminated texture reflects seasonal deposition (Lu et al., Reference Lu, Bookman, Waldmann and Marco2020). The dark lamina consists of transported detritus material: clay minerals and fine-grained calcite and dolomite (Garber et al., Reference Garber, Levy and Friedman1987; Bookman et al., Reference Bookman, Enzel, Agnon and Stein2004). The light lamina consists of precipitated authigenic aragonite and frequently gypsum and halite (Belmaker et al., Reference Belmaker, Lazar, Stein, Taha and Bookman2019). Reports on the clays of the Dead Sea were made by Nathan et al. (Reference Nathan, Shoval and Sandler1990, Reference Nathan, Shoval and Sandler1992, Reference Nathan, Sandler and Shoval1994). Clays of the north-eastern shores of the Dead Sea were analysed by Salameh et al. (Reference Salameh, Alraggad and Amaireh2019).
In recent decades, the Dead Sea has been subject to a rapid drop in water level (e.g. Lipchin et al., Reference Lipchin, Antonius, Rishmawi, Afanah, Orthofer and Trottier2004; Vey et al., Reference Vey, Al-Halbouni, Haghighi, Alshawaf, Vüllers and Güntner2021) and rapid retreat (Arkin & Gilat, Reference Arkin and Gilat2000; Ghazleh et al., Reference Ghazleh, Abed, Kempe, Badescu and Cathcart2011). During the last 47 years, the water level of the Dead Sea has dropped by ~39 m and on 1 September 2023 was –438.21 m BMSL (https://data.gov.il/dataset/https-www-data-gov-il-dataset-683/resource/823479b4-4771-43d8-9189-6a2a1dcaaf10). These processes led to the exposure of the littoral clayey sediments on the shore, the occurrence of exposed mudflats (e.g. Arkin & Gilat, Reference Arkin and Gilat2000), the development of subsidence features (Baer et al., Reference Baer, Schattner, Wachs, Sandwell, Wdowinski and Frydman2002; Yechieli et al., Reference Yechieli, Abelson, Wachs, Shtivelman, Crouvi, Baer, Yuhr, Alexander and Beck2003, Reference Yechieli, Abelson, Bein, Crouvi and Shtivelman2006, Reference Yechieli, Abelson and Baer2016; Abelson et al., Reference Abelson, Yechieli, Crouvi, Baer, Wachs, Bein, Shtivelman, Enzel, Agnon and Stein2006; Al-Halbouni et al., Reference Al-Halbouni, Holohan, Saberi, Alrshdan, Sawarieh and Closson2017; Shviro et al., Reference Shviro, Haviv and Baer2017; Vey et al., Reference Vey, Al-Halbouni, Haghighi, Alshawaf, Vüllers and Güntner2021) and the emergence of sinkholes (e.g. Abelson, Reference Abelson, Kafri and Yechieli2021; Ezersky & Frumkin, Reference Ezersky and Frumkin2021).
Most of this previous work relates to the origins of the Dead Sea sinkholes. The present study characterizes the clayey sediments in the environment of the exposed mudflats on the western Dead Sea shore based on field observations and laboratory analyses. The mineral composition and the clay mineral composition of the mudflat sediments sampled from subsidence strips and in clustered sinkholes are analysed, the effect of the saline environment on the clay minerals is examined and the contribution of the clayey sediments to the origins of the subsidence strips is investigated.
Field observations
Clayey sediments of the exposed mudflats
Exposed mudflats have been occurring in recent decades on the western shore of the Dead Sea as part of the adjustment of the Dead Sea periphery to the retreat of the Dead Sea. Figure 3 demonstrates clayey sediments of the exposed mudflats on the Dead Sea shore in the studied area. The mudflat sediments were deposited in a lacustrine–littoral environment of the Dead Sea periphery (Yechieli et al., Reference Yechieli, Magariz, Levy, Weber, Kafri, Woelfli and Bonani1993). They were exposed on the shore in recent decades as a result of the retreat of the Dead Sea (Fig. 3a). Exposed mudflats with lines of coastal regression herald the progressive retreat of the Dead Sea (Fig. 3a). A fine-grained laminated texture of the mudflat sediments is observed on the walls of the sinkholes.
Clayey sediments of the exposed mudflats on the Dead Sea shore in the studied area. (a) Exposed mudflats with lines of coastal regression herald the progressive retreat of the Dead Sea (north of Ein Gedi coast). (b) A fine-grained laminated texture of the mudflat sediments is observed on the walls of the sinkholes (at Shalem coast).

Subsidence strips with sinkholes in the exposed mudflats
Figure 4 demonstrates subsidence strips with clustered sinkholes in the exposed mudflats in the studied area. These features extend approximately parallel to the shoreline; they gradually widen over time and progressively inundate with saline water. The sinkholes evolved from narrower holes with steep walls to widening ones and to coalesced sinkholes (Fig. 4a). A collapse in the mudflat sediments is observed on the walls of the sinkholes (Fig. 4b).
Subsidence strips with clustered sinkholes in the exposed mudflats in the studied area. (a) The sinkholes evolved from narrower holes with steep walls to widening ones and to coalesced sinkholes (at Shalem coast). (b) A collapse in the mudflat sediments is observed on the walls of the sinkholes (at Shalem coast).

The saline environment of the mudflat sediments
The saline environment of the mudflat sediments in the studied area is indicated by accumulation of brine and precipitation of salts at the bottoms of subsidence strips and in sinkholes (Fig. 5). The mineral precipitates from the sinkhole brine are halite and gypsum, with some carnallite and bischofite (Zilberman-Kron, Reference Zilberman-Kron2008).
The saline environment of the mudflat sediments in the studied area is indicated by accumulation of brine and precipitation of salts at the bottom of (a) subsidence strips (at Ein Gedi coast) and (b) in sinkholes (at Shalem coast).

Experimental
Materials
Table 1 presents the list of the analysed mudflat sediments sampled from subsidence strips and in clustered sinkholes (Fig. 4). Samples of sinkhole brine (Fig. 5), local saline water and sea water were also collected (Table 1). The sampling sites are Ein Samar, Shalem and Ein Gedi coasts (Fig. 1b).
List of the analysed mudflat sediments sampled from subsidence strips and in clustered sinkholes. Samples of sinkhole brine, local saline water and sea water were also collected.

For the analysis of the mineral composition, the samples of the mudflat sediments were homogenized using a ball shaker. For the analysis of the clay mineral composition, decalcified clay fractions from the samples of the mudflat sediments were obtained according to the standard preparation protocol (Eslinger & Pevear, Reference Eslinger and Pevear1988; Moore & Reynolds, Reference Moore and Reynolds1997).
Methods
The clayey sediments in the environment of exposed mudflats on the western Dead Sea shore were analysed using mineralogical and chemical methods. Mineralogical and chemical methods for the study of clayey rocks and clayey sediments have recently been applied by Trindade et al. (Reference Trindade, Rocha, Dias and Prudêncio2013, Reference Trindade, Dias, Rocha, Prudêncio and Marques2018), Leontopoulou et al. (Reference Leontopoulou, Christidis, Rousakis, Müller, Papatheodorou and Geraga2021) and Rogoziński & Maciejewska (Reference Rogoziński and Maciejewska2021).
Details of the analysing methods in our experiments are described by Shoval & Zlatkin (Reference Shoval and Zlatkin2009). The samples were analysed using X-ray powder diffraction (XRD) with a Philips PW-3710 diffractometer using Cu-Kα radiation at 35 kV and 40 mA and a curved graphite monochromator. Fourier-transform infrared (FTIR) spectroscopy was conducted using a Jasco-4100 FTIR spectrometer with pressed KBr discs of 1 mg of the powdered sample and 150 mg of KBr. Scanning electron microscopy (SEM) was conducted using a JEOL SEM (JSM-840) microscope equipped with a LINK-10000 energy-dispersive spectrometer (EDS; Oxford ISIS), using carbon-coated samples. The saline water types were analysed using wet chemical analysis methods. The concentrations of Na, K, Ca, Mg and Sr were obtained using a Perkin Elmer inductively coupled plasma–optical emission spectrometer (Optima 3300); that of Br was obtained using a Dionex (4000I) ion chromatograph; and that of Cl was obtained via titration with a Metrohm (Titroprocessor 636) apparatus.
Curve-fitting of the XRD traces and the FTIR spectra was preformed using the GRAMS/AI 32 software package of Thermo Electron Corporation (Shoval et al., Reference Shoval, Yariv, Michaelian, Lapides, Boudeuille and Panczer1999; Shoval & Zlatkin, Reference Shoval and Zlatkin2009).
Results
XRD analysis of the bulk mudflat sediments
Figure 6 demonstrates XRD traces of selected mudflat sediments sampled from subsidence strips and clustered sinkholes. The bulk mudflat sediments consist of clay minerals and carbonates (calcite, aragonite and dolomite) with some quartz and feldspar, and frequently gypsum and halite (Fig. 6).
XRD traces of selected mudflat sediments (a) from a subsidence strip and (b) in a sinkhole. Arg = aragonite; Cal = calcite; CM = clay minerals; Dol = dolomite; Gp = gypsum; Hl = halite; Kfs = K-feldspar; Qz = quartz. The mineral abbreviations are according to Warr (Reference Warr2020).

Table 2 presents the XRD results of the relative amounts of the minerals present in the bulk mudflat sediments sampled from subsidence strips and in clustered sinkholes. The determination of the relative amounts of these minerals in the bulk mudflat sediments is based on the peak height (counts s–1) of the major XRD peak of each mineral (Fig. 6) using the apparatus's software. Table 2 includes the d (nm)/°2θ values of the major XRD peak for each of the identified minerals and the conversion factors used to calculate the proportions of the various minerals (Ganor et al., Reference Ganor, Deutsch and Foner2000). The factors used were determined under conditions used in the operating Geological Survey of Israel laboratory and based on calibrations with known proportions of local minerals (thus, the conversion factors are not universally applicable between laboratories).
Semi-quantitative mineralogical composition (normalized to 100%) of the bulk mudflat sediments sampled from subsidence strips and in clustered sinkholes.
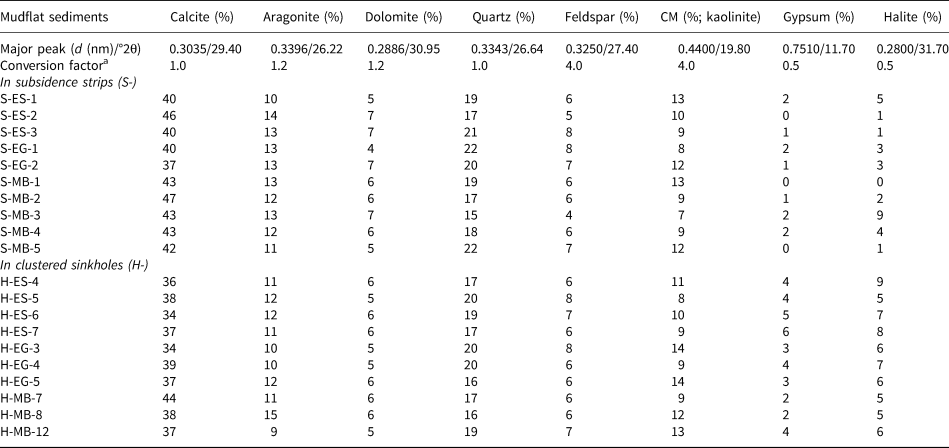
a The conversion factors are according to Ganor et al. (Reference Ganor, Deutsch and Foner2000).
CM = clay minerals.
FTIR spectroscopy analysis of the bulk mudflat sediments
Figure 7 shows the FTIR spectra in the range 1800–400 cm–1 of selected mudflat sediments. The FTIR spectroscopy results confirm the presence of clay minerals, calcite, aragonite, quartz and frequently gypsum in these sediments (Fig. 7). The minerals were identified by their characteristic bands in the FTIR spectra, supported by spectral standards of minerals (Farmer, Reference Farmer and Farmer1974; Shoval, Reference Shoval and Hunt2017).
FTIR spectra of selected mudflat sediments (a) from subsidence strips and (b) in clustered sinkholes. Arg = aragonite; Cal = calcite; CM = clay minerals; Gp = gypsum; Qz = quartz.

Clay mineral composition in decalcified clay fractions
The clay mineral composition in decalcified clay fractions obtained from the mudflat sediments was analysed using XRD and FTIR spectroscopy. The clay mineralogy was determined on air-dried, ethylene glycol-solvated oriented clay fractions before and after heating at 550°C for 2 h (Eslinger & Pevear, Reference Eslinger and Pevear1988). Figure 8 shows XRD traces of the clay fraction obtained from a selected mudflat sediment before and after baseline correction and curve-fitting with GRAMS/AI 32 software (Fig. 8a & 8b, respectively). The clay minerals identified are smectite-rich R0 mixed-layer illite–smectite and kaolinite with some discrete illite and palygorskite (Fig. 8). The identification of R0 mixed-layer illite–smectite is based on the (001) diffraction maxima at ~1.7 nm after ethylene glycol solvation (Table 3) and on the asymmetry and the width of this peak in the original XRD traces (Fig. 8a; Eslinger & Pevear, Reference Eslinger and Pevear1988; Moore & Reynolds, Reference Moore and Reynolds1997). The XRD traces of the heated samples indicate the presence of minor to trace amounts of chlorite (<3%).
XRD traces of the clay mineral composition obtained from a selected mudflat sediment. (a) Original XRD trace and (b) XRD trace after baseline correction and curve-fitting. Ilt = discrete illite; Ilt-Sme: R0 mixed-layer illite–smectite; Kln = kaolinite; Plg = palygorskite.

XRD results of the relative amounts (normalized to 100%) of the clay minerals in decalcified clay fractions obtained from the mudflat sediments. The d-values of the (001) peak of R0 mixed-layer illite–smectite in the decalcified clay fractions of the individual samples after ethylene glycol solvation have been included.
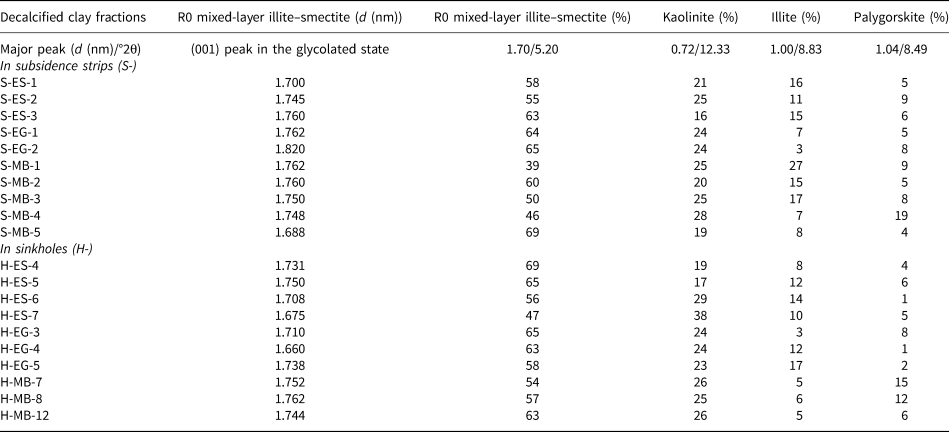
Table 3 lists the relative abundances of the clay minerals (namely R0 mixed-layer illite–smectite, kaolinite, discrete illite and palygorskite) in the decalcified clay fractions obtained from the mudflat sediments. Clay minerals usually have broad XRD peaks; therefore, their relative amounts were calculated from the areas of the major XRD peak of each clay mineral after ethylene glycol solvation (Fig. 8b) using curve-fitting in GRAMS/AI 32 software (Shoval & Zlatkin, Reference Shoval and Zlatkin2009). Table 3 gives the d (nm)/°2θ values of the major XRD peak for each of the identified clay minerals.
The fraction of the illite layers in the R0 mixed-layer illite–smectite is estimated to be <15%. This is obtained by calculating the ‘saddle’ value of the major peak of the clay mineral in the original XRD traces (e.g. Fig. 8a; Inoue et al., Reference Inoue, Bouchet, Velde and Meunier1989; Sandler & Herut, Reference Sandler and Herut2000). The identified discrete illite (Table 3) is non-expandable without mixed layering.
FTIR spectroscopy analysis of the decalcified clay fractions
Figure 9 shows a curve-fitted FTIR spectrum in the OH-stretching region of a decalcified clay fraction obtained from a selected mudflat sediment. Curve-fitting of the FTIR spectrum enables the identification of illite–smectite in a mixture along with kaolinite (Shoval, Reference Shoval2004), according to their characteristic OH-stretching bands (Farmer, Reference Farmer and Farmer1974). The sharp OH-stretching band of the kaolinite at 3620 cm–1 overlaps with the broad OH-stretching band of the illite–smectite, whereas the kaolinite band at 3696 cm–1 does not overlap with any illite–smectite band (Fig. 9). The results confirm the coexistence of illite–smectite and kaolinite in the decalcified clay fractions.
Curve-fitted FTIR spectrum in the OH-stretching region of a decalcified clay fraction obtained from a selected mudflat sediment. Ilt-Sme = illite–smectite; Kln = kaolinite.

SEM images of decalcified clay fractions
Figure 10 shows a SEM (secondary electron) image of a decalcified clay fraction obtained from a selected mudflat sediment. The image shows fine-grained textures of clay platelets and grains of minerals of ~2 μm in size. The microstructure of the clay platelets observed in the SEM image is typical of a detrital clay (Fig. 10).
SEM (secondary electron) image of a decalcified clay fraction obtained from a selected mudflat sediment. The microstructure of the clay platelets is typical of a detrital clay.

Major element composition of mudflat sediments
The EDS results regarding the major element composition (wt.%) of mudflat sediments sampled from subsidence strips and in clustered sinkholes are listed in Table 4. The elements identified are Na, K, Ca, Mg, Al, Si, Sr and Cl. This composition confirms the existence of precipitated salts in the mudflat sediments. Al and Si sources are mainly from clay minerals, Ca is from calcite, aragonite and dolomite, Mg is from dolomite and Mg-salts, K is from illite–smectite, K-feldspar and K-salts and Na and Cl are from halite.
EDS results regarding the major element composition (wt.%) of mudflat sediments sampled from subsidence strips and in clustered sinkholes. The analytical error is ~2%.

Major element composition of the sinkhole brine
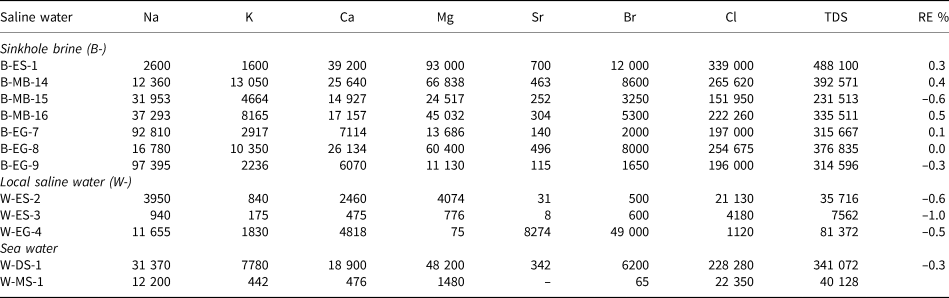
Table 5 lists the chemical analysis results regarding the major element composition (mg L–1) of sinkhole brine, local saline water and sea water. The elements detected in the saline water are Na, K, Ca, Mg, Sr, Br and Cl. Variations in the amounts of Na and Mg in sinkhole brine (Table 5) are related to the precipitation of halite crystals from the brine (Fig. 5), which decreases the proportion of dissolved Na and thus increases the proportion of the dissolved Mg. The total dissolved salts (TDS; mg L–1) of some sinkhole brines exceed that of the Dead Sea water, is higher than that of the local saline water and is much higher than that of the Mediterranean Sea water (Table 5).
Chemical analysis results regarding the major element composition (mg L–1) of sinkhole brine, local saline water, Dead Sea water and Mediterranean Sea water. The TDS (mg L–1) and the reproducibility error (RE %) of the analytical data are included.
Discussion
Clayey sediments in the environment of the exposed mudflats
The retreat of the Dead Sea and the lowering of the base level in recent decades exposed the littoral clay sediments on the shore, the mudflats (Fig. 3a) and the developed subsidence strips and clustered sinkholes (Fig. 4). Based on field observations and laboratory analyses, the present study characterizes the clayey sediments in the environment of the exposed mudflats on the western Dead Sea shore.
Composition of the mudflat sediments
The mineralogical composition of the bulk mudflat sediments sampled from the subsidence strips and in clustered sinkholes (Fig. 4) includes clay minerals and carbonate minerals (calcite, aragonite and dolomite) with some quartz and feldspar (Table 2), and frequently gypsum and halite (Fig. 6). The clay mineral composition of these samples is R0 mixed-layer illite–smectite and kaolinite with some discrete illite and palygorskite (Fig. 8 & Table 3). The microstructure of the clay platelets is typical of a detrital clay (Fig. 10).
Sources of detrital clays in the mudflat sediments
Source of the detrital clay minerals and fine-grained calcite and dolomite in the Late Quaternary units deposited in the Dead Sea periphery (Fig. 2) were reported by Bookman et al. (Reference Bookman, Enzel, Agnon and Stein2004), Garber et al. (Reference Garber, Levy and Friedman1987) and Lu et al. (Reference Lu, Bookman, Waldmann and Marco2020). Haliva-Cohen et al. (Reference Haliva-Cohen, Stein, Goldstein, Sandler and Starinsky2012) studied the sources of the fine detritus material that was transported and deposited in the Late Quaternary units in the Dead Sea periphery and reported several sources of the fine detritus materials, namely flood material, desert dust and loess from the Dead Sea watershed. The main minerals of the detritus material in the lake formations are quartz and calcite, minor dolomite, clays and feldspars. The clays are predominantly mixed-layer illite–smectite with small amounts of kaolinite and minor to trace amounts of palygorskite and chlorite.
An imported source for the detrital clay in the Late Quaternary sediments of the Dead Sea periphery was the material of the seasonal floods (Haliva-Cohen et al., Reference Haliva-Cohen, Stein, Goldstein, Sandler and Starinsky2012; Lu et al., Reference Lu, Bookman, Waldmann and Marco2020) that was transported to the Dead Sea periphery from the weathering and erosion of the rocks exposed at the margins of the Dead Sea Basin and adjacent regions (Fig. 2). The main units exposed at the margins are Upper Cretaceous carbonate rocks (Fig. 2). On the eastern side of the Dead Sea Basin, Cambrian to Lower Cretaceous clastic rocks are also exposed.
Data on the accessory clay minerals in the Upper Cretaceous carbonate rocks are available from the studies of the corresponding units in the Negev region. Illite is dominant in the Lower Palaeozoic rocks, illite and kaolinite are dominant in the Nubian Mesozoic rocks and smectite is dominant in rocks of the large marine transgression of the Upper Cretaceous (Bentor et al., Reference Bentor, Bodenheimer and Heller1963). The clays in the Turonian sequence in the north-eastern Negev are dominated by R0 or R ≥ 1 mixed-layer illite–smectite along with minor discrete illite and trace chlorite, quartz and goethite (Sandler & Saar, Reference Sandler and Saar2007). Finally, the Senonian to Eocene clays at the south-eastern Negev are dominated by smectitic illite–smectite accompanied by detrital kaolinite, discrete illite, palygorskite and occasional sepiolite (Shoval, Reference Shoval2004). Following these observations, a large part of the R0 mixed-layer illite–smectite in the composition of the mudflat sediments (Fig. 8 & Table 3) was derived from the transport of detritus from weathering and erosion of the Upper Cretaceous rocks exposed at the margins of the Dead Sea Basin and adjacent regions (Fig. 2).
The contribution of wind-blown materials that settle over the exposed surfaces provided an additional source for the detritus in the Late Quaternary units deposited in the Dead Sea periphery and the Negev region. The contribution of desert dust transported from North African and Arabian deserts has been documented in previous studies (Ganor et al., Reference Ganor, Foner, Brenner, Neeman and Lavi1991; Ganor & Foner, Reference Ganor and Foner2001: Israelevich et al., Reference Israelevich, Ganor, Levin and Joseph2003; Sandler, Reference Sandler2013).
The desert dust deposits over the Dead Sea region consist of smectite, kaolinite, illite and minor amounts of palygorskite with calcite, dolomite, quartz, feldspars, some apatite and soluble salts (Singer et al., Reference Singer, Ganor, Dultz and Fischer2003). In addition, the most common minerals in the suspended dust over the Dead Sea region include quartz and kaolinite with feldspar, apatite and dolomite (Singer et al., Reference Singer, Dultz and Argaman2004). Thick sequences of desert loess have accumulated from desert dust settling in the northern Negev (Bruins & Yaalon, Reference Bruins and Yaalon1979). In addition, desert dust constitutes an important part of soils in these northern regions (Yaalon, Reference Yaalon1997).
Following these observations, a large part of the kaolinite in the composition of the mudflat sediments (Fig. 8 & Table 3) was derived from desert dust that has settled in the region (Singer et al., Reference Singer, Dultz and Argaman2004).
Saline environment of the mudflat sediments
The mudflat sediments are situated in the saline environment of the Dead Sea shore, which is affected by the contact with the Dead Sea water (Table 5). Deposition of the mudflat sediments took place in a lacustrine–littoral environment of the Dead Sea periphery (Yechieli et al., Reference Yechieli, Magariz, Levy, Weber, Kafri, Woelfli and Bonani1993). Their exposure in recent decades is a result of the retreat of the Dead Sea (Fig. 3a).
The Dead Sea water is saturated to oversaturated with respect to aragonite, anhydrite and halite (Gavrieli et al., Reference Gavrieli, Starinsky and Bein1989, Reference Gavrieli, Lensky, Gazit-Yaari and Aharon2002). Gypsum is the actual Ca-sulfate mineral that precipitates from the Dead Sea water. Crystallization of aragonite (possibly with some gypsum) from the surface water formed the white aragonite laminae of the Dead Sea sediments, whereas gypsum was crystallized on exposed and submerged surfaces along the Dead Sea shores (Neev & Emery, Reference Neev and Emery1967). In recent decades, halite precipitates from the Dead Sea water (Steinhorn, Reference Steinhorn1983).
The saline environment of the mudflat sediments is indicated by the accumulation of brine and precipitation of salts at the bottoms of subsidence strips and in sinkholes (Fig. 5). The TDS of some sinkhole brine exceeds that of the Dead Sea water (Table 5), which results in precipitation of salts (Fig. 5). The mineral precipitates from the sinkhole brine are halite and gypsum with some carnallite and bischofite (Zilberman-Kron, Reference Zilberman-Kron2008).
Clays in the saline environment of the mudflat sediments
Clay diagenesis under saline environmental conditions has been reported in alkaline lakes (e.g. Singer & Stoffers, Reference Singer and Stoffers1980) and continental evaporitic environments (Calvo et al., Reference Calvo, Blanc-Valleron, Rodriguez-Arandia, Rouchy, Sanz, Thiry and Simon-Coinçon1995). Although the detrital R0 mixed-layer illite–smectite in the mudflat sediments is situated in the saline environment of the Dead Sea shore, no significant illitization is observed in the detrital clay. The R0 mixed-layer illite–smectite in the mudflat sediments (Table 3) is similar to that in the depositional detrital clay (Nathan et al., Reference Nathan, Shoval and Sandler1990, 1992; Haliva-Cohen et al., Reference Haliva-Cohen, Stein, Goldstein, Sandler and Starinsky2012). The clay platelet microstructure of the mixed-layer illite–smectite observed in the SEM image (Fig. 10) is typical of a detrital, not authigenic clay.
The presence of small amounts of palygorskite in the composition of the mudflat sediments is explained by the contribution from the detritus sources. However, the larger amounts of palygorskite occurring in several samples (Table 3) may reflect some authigenic origin of this clay in the saline environment. Palygorskite authigenesis has been reported in continental saline evaporitic environments (Calvo et al., Reference Calvo, Blanc-Valleron, Rodriguez-Arandia, Rouchy, Sanz, Thiry and Simon-Coinçon1995). This process occurs in conditions of magnesium-enriched brine in a hot-arid climate (Jones, Reference Jones1986).
The lack of significant clay diagenesis in the sub-recent sediments of the Dead Sea has been attributed to the young Holocene age of these sediments, the relatively low burial temperature and the low pH (6.1–6.7; Nathan et al. Reference Nathan, Shoval and Sandler1990, Reference Nathan, Shoval and Sandler1992). Diagenesis most likely occurs only after deeper burial, at temperatures >50–60°C and for a longer period under saline conditions (Nathan et al., Reference Nathan, Sandler and Shoval1994).
By contrast to the detrital smectitic illite–smectite in the composition of the mudflat sediments, a gradual illitization of smectite and a greater authigenesis of palygorskite were reported in the calcareous shale units of the Pliocene Sedom Formation in the Mount Sodom salt diapir in the Dead Sea Basin (Shoval & Zlatkin, Reference Shoval and Zlatkin2009). The illitization was attributed to deeper burial conditions and a longer period in contact with the rock salts of this Formation. Diagenesis of trioctahedral clays in a Miocene to Pleistocene sedimentary–magmatic sequence in the Dead Sea Rift was reported by Sandler et al. (Reference Sandler, Nathan, Eshet and Raab2001).
Formation of the subsidence strips in the exposed mudflats
The subsidence strips with clustered sinkholes were formed in the exposed mudflats as part of the adjustment of the Dead Sea periphery to the lowering of the base level as a result of the retreat of the Dead Sea. The origin of the sinkholes on the shore of the Dead Sea is related to the subsiding of sediments following dissolution and salt karstification within a subareal rock-salt unit (Frumkin & Raz, Reference Frumkin and Raz2001; Yechieli et al., Reference Yechieli, Abelson and Baer2016; Ezersky et al., Reference Ezersky, Legchenko, Eppelbaum and Al-Zoubi2017; Watson et al., Reference Watson, Holohan, Al-Halbouni, Saberi, Sawarieh and Closson2019; Ezersky & Frumkin, Reference Ezersky and Frumkin2020, 2021; Abelson, Reference Abelson, Kafri and Yechieli2021).
The field observations in the studied area reveal that the subsidence of mudflat sediments during the formation of the subsidence strips usually involves mud sagging of wet clayey sediments in the subsurface and sediment collapse of dry clayey sediments near the surface (Fig. 11a). The mud sagging of wet clayey sediments is observed within subsidence strips inundated with water, and sediment collapse of dry clayey sediments is visible on their walls (Fig. 11a). Figure 11b provides an illustration of the subsiding processes by mud sagging and sediment collapse.
The formation of the subsidence strips in the exposed mudflats. (a) Subsidence of mudflat sediments forms subsidence strips and involves mud sagging of wet clayey sediments in the subsurface and sediment collapse of dry clayey sediments near the surface (at Ein-Samar coast). (b) An illustration of the subsiding processes by mud sagging and sediment collapse.

The development of the subsidence strips in the Dead Sea shore may serve as a preferential subsurface pathway for groundwater that allows dissolution and salt karstification within a subareal rock-salt unit and promotes the formation of clustered sinkholes.
Contribution of the clay sediments to the subsiding
The geotechnical characteristics of sediments on the western shore of the Dead Sea were reported by Ezersky & Livne (Reference Ezersky and Livne2013) and on the eastern shore by Taqieddin et al. (Reference Taqieddin, Abderahman and Atallah2000), Khlaifat et al. (Reference Khlaifat, Al-Khashman and Qutob2010) and Salameh et al. (Reference Salameh, Alraggad and Amaireh2019). Geotechnical studies of evaporitic, lacustrine sediments in the saline environment of the Dead Sea area were reported by Frydman et al. (Reference Frydman, Charrach and Goretsky2008, Reference Frydman, Charrach and Goretsky2014). Viscoelastic modelling of sinkhole precursory subsidence was proposed by Baer et al. (Reference Baer, Magen, Nof, Raz, Lyakhovsky and Shalev2018).
The analyses of the mudflat sediments reflect the contribution of the clayey sediments to the origin of the subsidence strips on the exposed mudflats. During development of the subsidence strips, the mud sagging of wet clayey sediments in the subsurface (Fig. 11a) is favoured by their muddy behaviour under wet conditions due to the majority of swelling smectitic clay (Table 3) and the soaking in saline water and brine rich in sodium (Table 5). The sediment collapse of the dry clayey sediments near the surface (Fig. 11) is promoted by their fine-grained unconsolidated textures (Fig. 3b) consisting of clay and carbonate particles (Table 2), which are devoid of significant cohesion (Ezersky & Livne, Reference Ezersky and Livne2013).
Future prospects
The extending of the clustered sinkholes along the shore of the Dead Sea is usually attributed to subsidence of the sediments along lineaments that track some of the existing tectonic faults of the Dead Sea Rift in the Dead Sea shore. The field observations reveal features of mass movement seaward in the mudflat sediments on the Dead Sea shore. As a future prospect, it is recommended that we examine whether the seaward mass movement (sediment creep) leads to tension in the mudflat sediments that breaks continuity and generates subsidence strips. Indeed, the subsidence strips extend approximately parallel to the shoreline, they gradually widen over time and they are progressively inundated with saline water. In addition, it is recommended that we examine whether the narrow coastal bays along the curved Dead Sea shoreline are scars resulting from the slumping of littoral clayey sediments on the coastal edge towards the subsea slope.
Summary and conclusions
(1) Exposed mudflats appeared in recent decades on the western shore of the Dead Sea as part of the adjustment of the Dead Sea periphery to the retreat of the Dead Sea. Based on field observations and laboratory analyses, the present study characterizes the clayey sediments in the environment of the exposed mudflats on the western Dead Sea shore.
(2) The mudflat sediments in subsidence strips and clustered sinkholes consist of clay minerals and carbonates (calcite, aragonite and dolomite) with some quartz and feldspar and frequently gypsum and halite. The clay minerals present are R0 mixed-layer illite–smectite and kaolinite with minor discrete illite and palygorskite.
(3) A large part of R0 mixed-layer illite–smectite in the mudflat sediments was derived from the transport of detritus from weathering and erosion of the Upper Cretaceous rocks that were exposed at the margins of the Dead Sea Basin and adjacent regions. A large part of the kaolinite in the composition of the mudflat sediments was derived from desert dust that settled in the region.
(4) Although the detrital R0 mixed-layer illite–smectite in the mudflat sediments occurs in the saline environment of the Dead Sea shore, it does not show significant illitization. The R0 mixed-layer illite–smectite in the composition of the mudflat sediments is similar to that in the depositional detrital clay. The clay platelet microstructure of the R0 mixed-layer illite–smectite observed using SEM is typical of a detrital origin.
(5) The presence of small amounts of palygorskite in the composition of the mudflat sediments is explained by the contribution from the detrital sources. However, the larger amounts of palygorskite occurring in several samples may reflect some authigenic origin of this clay in the saline environment.
(6) Subsidence strips with clustered sinkholes were formed in the exposed mudflats. The subsidence of mudflat sediments in the subsidence strips usually involves mud sagging of wet clayey sediments in the subsurface and sediment collapse of dry clayey sediments near the surface.
(7) The mud sagging of wet clayey sediments in the subsurface during the development of the subsidence strips is favoured by their muddy behaviour under wet conditions due to the majority of swelling smectitic clay and the soaking in saline water and brine rich in sodium. The sediment collapse of the dry clayey sediments near the surface is promoted by their fine-grained unconsolidated textures consisting of clay and carbonate particles, which are devoid of significant cohesion.
Acknowledgements
The analyses were performed using the laboratory facilities of the Geological Survey of Israel and of the Institute of Earth Sciences, The Hebrew University of Jerusalem. Part of this study was conducted whilst the author was a visiting scientist at the Institute of Earth Sciences at The Hebrew University of Jerusalem. The author expresses his appreciation for Professor Oded Navon of this institute for his collaboration.
Financial support
This research was supported by the Open University of Israel's Research Authority (Award Number: 37226 in year 2018). This support is gratefully acknowledged.
Conflicts of interest
The contributing author has no conflicts of interest to declare. The author is the sole contributor. The work submitted is an original scientific study (research article) and was prepared and written by the author as a professor at the Open University of Israel. The contributing author consents for publication in this journal. There are no biological applications.
Data availability
The raw database is available from the contributing author. The data are mainly based on field observations and laboratory analyses by the contributing author. All field photographs are of the author and were taken by the author himself in the field.
Declaration
This manuscript has not previously been published elsewhere, either in full or in part. While under review for Clay Minerals, it will not be submitted to any other publication.


 Open access