


Introduction
Since the end of the 19th century, echinoderm gametes have been extensively used as model systems to study oocyte maturation, sperm activation, species-specific sperm–egg interaction, as well as structural, electrical, and Ca2+ changes regulating signal transduction events at fertilization necessary for normal embryonic development (Kanatani, Reference Kanatani1973; Meijer and Guerrier, Reference Meijer and Guerrier1984; Trimmer and Vacquier, Reference Trimmer and Vacquier1986; Wessel et al., Reference Wessel, Brooks, Green, Haley, Voronina, Wong, Zaydfudim and Conner2001; Santella et al., Reference Santella, Vasilev and Chun2012; Santella and Chun, Reference Santella and Chun2022). Indeed, due to the availability of large amounts of gametes that can be allowed to undergo external fertilization in seawater, starfish and sea urchins have offered numerous advantages for performing experiments related to sexual reproduction.
In starfish, oocyte maturation can be induced in vitro using 1-methyladenine, which is a significant advantage in studying the conditions of fertilizability acquired during meiotic maturation (Chun et al., Reference Chun, Vasilev, Limatola and Santella2018; Kishimoto, Reference Kishimoto2018; Chiba, Reference Chiba2020; Santella et al., Reference Santella, Limatola and Chun2020; Santella and Chun, Reference Santella and Chun2022). Conversely, sea urchins have facilitated studies on fertilization and early embryonic development due to the easiness of handling mature eggs and their synchronous cleavages (Steinhardt et al., Reference Steinhardt, Lundin and Mazia1971; Epel, Reference Epel1978; Trimmer and Vacquier, Reference Trimmer and Vacquier1986; Wessel et al., Reference Wessel, Brooks, Green, Haley, Voronina, Wong, Zaydfudim and Conner2001; Vacquier, Reference Vacquier2011). Moreover, echinoderm eggs have a large diameter and transparent cytoplasm, which makes them particularly suitable for imaging experiments that utilize fluorescent molecular probes. In laboratories, to facilitate electrophysiological measurements, Ca2+ detection, and the visualization of structural changes on the egg surface at fertilization, sea urchin eggs were often deprived of their external layers (jelly and vitelline) or attached to polylysine-coated glasses. Indeed, these ‘dejellied or denuded eggs’ may adhere better to solid substrates and are relatively immobilized during sperm-induced egg activation (Epel et al., Reference Epel, Weaver and Mazia1970; Steinhardt et al., Reference Steinhardt, Lundin and Mazia1971; Mazia et al., Reference Mazia, Schatten and Steinhardt1975; Schatten and Mazia, Reference Schatten and Mazia1976). However, this manipulation or treatment of the egg surface may inevitably alter the egg’s morphology and physiology, leading to a fertilization response that may differ from natural conditions (Just, Reference Just1939). In line with this, in recent studies investigating the role of the structural dynamics of the actin cytoskeleton of the egg cortex in the fertilization response, only ‘intact eggs’ of sea urchin have been used for imaging Ca2+, F-actin changes, and sperm incorporation into the zygotes in combination with light and electron microscopy (Chun et al., Reference Chun, Limatola, Vasilev and Santella2014; Limatola et al., Reference Limatola, Vasilev, Chun and Santella2019, Reference Limatola, Chun and Santella2020b, Reference Limatola, Chun and Santella2021b; Vasilev et al., Reference Vasilev, Limatola, Chun and Santella2019).
In sea urchins, ‘egg activation’ by the fertilizing sperm includes a rapid influx of Ca2+ over the entire surface of the egg a few seconds after the fusion of the sperm with the egg plasma membrane (cortical flash, CF) and a subsequent increase of intracellular Ca2+ level (Ca2+ wave, CW; Whitaker, Reference Whitaker2006; Parrington et al., Reference Parrington, Davis, Galione and Wessel2007; Ramos and Wessel, Reference Ramos and Wessel2013). Recent studies have indicated that the early CF event strictly depends on the actin-based microvillar morphology and microfilaments associated with the cortical granules (CG; Spudich et al., Reference Spudich, Wrenn and Wessells1988; Chun et al., Reference Chun, Limatola, Vasilev and Santella2014; Vasilev et al., Reference Vasilev, Limatola, Chun and Santella2019). The following CW with a precise spatiotemporal pattern of Ca2+ release is concomitant with the dissolution (or superficial cytolysis) of the egg’s cortical region (ectoplasm) and the breakdown of the CG positioned just below the plasma membrane (Just, Reference Just1939; Gillot et al., Reference Gillot, Ciapa, Payan and Sardet1991; Santella et al., Reference Santella, Limatola and Chun2015; Vasilev et al., Reference Vasilev, Limatola, Chun and Santella2019). The extrusion of the contents of CG promotes the separation of the vitelline layer bound to the plasma membrane covering microvilli, resulting in the lifting of the newly formed fertilization envelope (FE). Then, the Ca2+ increase induces a dramatic reorganization of the egg cortex, including microvilli elongation due to the polymerization of the actin filaments caused by an intracellular pH increase (Steinhardt et al., Reference Steinhardt, Lundin and Mazia1971; Johnson and Epel, Reference Johnson and Epel1976; Begg and Rebhun, Reference Begg and Rebhun1979; Tilney and Jaffe, Reference Tilney and Jaffe1980; Begg et al., Reference Begg, Rebhun and Hyatt1982; Yonemura and Mabuchi, Reference Yonemura and Mabuchi1987; Limatola et al., Reference Limatola, Chun, Cherraben, Schmitt, Lehn and Santella2021a, Reference Limatola, Chun and Santella2022b). Indeed, the microvilli, filled with actin filaments, impressively extend to the perivitelline space (PS; Tilney and Jaffe, Reference Tilney and Jaffe1980; Spudich et al., Reference Spudich, Wrenn and Wessells1988; Byrd and Belisle, Reference Byrd and Belisle1985; Chun et al., Reference Chun, Puppo, Vasilev, Gragnaniello, Garante and Santella2010; Limatola et al., Reference Limatola, Chun and Santella2022b). Subsequently, the actin filaments in the subplasmalemmal zones undergo centripetal translocation to the inner cytoplasm (Terasaki, Reference Terasaki1996; Limatola et al., Reference Limatola, Vasilev, Santella and Chun2020a, Reference Limatola, Chun and Santella2020b, Reference Limatola, Chun and Santella2022b). At the sperm incorporation site, the fertilization cone is formed by thick actin filaments to bring the fertilizing sperm into the activated egg (Limatola et al., Reference Limatola, Chun, Cherraben, Schmitt, Lehn and Santella2021a). Therefore, the state of the cortical actin cytoskeleton of the unfertilized eggs and its remodelling after insemination determine the progressive structural and physiological changes in cortical protoplasm leading to the progressive differentiation from egg to embryo (Just, Reference Just1928).
Actin is one of the most abundant and conserved proteins in eukaryotic cells. The spatiotemporal shift of equilibrium between filamentous actin (F-actin) and monomeric globular actin (G-actin) and the consequent changes in the actin cytoskeleton play crucial roles in several biological processes within the cells, contributing to the plasticity of the cell shape, as well as cell motility, exocytosis and endocytosis, cytokinesis, and even gene regulation (Pollard and Cooper, Reference Pollard and Cooper2009; Balasubramanian et al., Reference Balasubramanian, Srinivasan, Huang and Ng2012; Hyrskyluoto and Vartiainen, Reference Hyrskyluoto and Vartiainen2020; Rausch and Hansen, Reference Rausch and Hansen2020). Moreover, phosphatidylinositol(4,5)bisphosphate (PIP2), which is a component of the plasma membrane, not only serves as the substrate of phospholipase C (PLC) to produce the Ca2+-mobilizing second messenger inositol 1,4,5-trisphosphate (InsP3), but also interacts with a host of actin-binding proteins and thereby modulates F-actin dynamics. Therefore, PIP2 may exemplify an intersection where the two signalling pathways meet (Yin and Janmey, Reference Yin and Janmey2003; Nusco et al., Reference Nusco, Chun, Ercolano, Lim, Gragnaniello, Kyozuka and Santella2006; dos Remedios and Nosworthy, Reference dos Remedios, Nosworthy, dos Remedios and Chhabra2008). Our previous studies have shown that the status of the actin filaments in the egg cortex is essential for the Ca2+-linked fertilization response. As actin is a Ca2+-binding protein with extremely high affinity, its polymerization and depolymerization may serve as highly efficient mechanisms for Ca2+ storage and release (Lange, Reference Lange1999; Lim et al., Reference Lim, Lange and Santella2002; Chun and Santella, Reference Chun and Santella2009). The polymerization status of the subplasmalemmal actin cytoskeleton also modulates the activity of enzymes, ion channels, and other proteins involved in the sperm-induced Ca2+ signalling pathways (Bose and Thomas, Reference Bose and Thomas2009; Chun et al., Reference Chun, Vasilev and Santella2013; Vasilev et al., Reference Vasilev, Limatola, Park, Kim, Santella and Chun2018, Reference Vasilev, Ezhova and Chun2021). Therefore, fine regulation of the actin filaments at the egg surface is essential for the proper fertilization response. Disturbance of the normal dynamics of the actin cytoskeleton of the unfertilized cortex of starfish and sea urchin eggs consistently affects the sperm-induced Ca2+ signals, induces polyspermy or inhibits sperm entry and cleavage (Puppo et al., Reference Puppo, Chun, Gragnaniello, Garante and Santella2008; Chun et al., Reference Chun, Limatola, Vasilev and Santella2014; Limatola et al., Reference Limatola, Vasilev, Chun and Santella2019, Reference Limatola, Vasilev, Santella and Chun2020a, Reference Limatola, Chun and Santella2022a, Reference Limatola, Chun, Schneider, Schmitt, Lehn and Santella2023).
Given the crucial role played by the dynamic regulation of the actin cytoskeleton in the ectoplasm of echinoderm eggs, it is equally important to have a method to detect rapid changes in actin filaments with minimal disturbance. Despite its advantages, the visualization of actin filaments in intact living sea urchin eggs using microinjected fluorescent probes such as Alexa-conjugated phalloidin and LifeAct-green fluorescent protein (LifeAct-GFP) is sometimes complicated because they work by binding to F-actin. Furthermore, the visualization of rapid cortical actin changes a few seconds after fertilization during the release of Ca2+ and separation of the vitelline membrane may be challenged by the contraction and movement of eggs characterizing this early event. Therefore, an alternative method of visualizing actin filament changes mimicking the natural F-actin dynamics would be highly appreciated in the microscopic studies of the actin cytoskeleton. In this regard, the present study aims to apply Raman spectroscopy to monitor F-actin changes (polymerization) in sea urchin eggs following fertilization, which is well documented over several decades of studies using a fixation time series combined with light and electron microscopy. More recent work with live confocal microscopy and LifeAct-GFP microinjected into the unfertilized eggs of several different species of sea urchin has visualized actin polymerization caused by hypertonic seawater and by the fertilizing sperm (Limatola et al., Reference Limatola, Chun and Santella2021b, Reference Limatola, Chun and Santella2022b), as well as in embryos (Pal et al., Reference Pal, Ellis, Sepúlveda-Ramírez, Salgado, Terrazas, Reyes, De La Rosa, Henson and Shuster2020). As no fluorescent dye is necessary to bind and visually report the presence of F-actin, Raman spectroscopy might be an attractive alternative for these experimental tasks.
Raman spectroscopy is a technique based on the inelastic scattering of laser photons by vibrating molecules in the sample (Short et al., Reference Short, Carpenter, Freyer and Mourant2005; Brauchle et al., Reference Brauchle, Thude, Brucker and Schenke-Layland2014). The energy shift of the scattered photons can be measured and displayed as a spectrum. Therefore, the relative intensity and spectral position of specific bands of the Raman spectrum provide valuable information about the biochemical composition, chemical and structural conformation, molecular interactions of the sample molecules, and their spatial distribution with minimally invasive measures (e.g. no need for microinjection of fluorescent markers). As such, Raman spectroscopy provides highly chemical-specific information on the sample, which can be interpreted for diagnostic purposes, as evidenced by previous work on cancer cell/tissue identification (Managó et al., Reference Managó, Valente, Mirabelli, Circolo, Basile, Corda and De Luca2016; Elumalai et al., Reference Elumalai, Managó and De Luca2020; Liu et al., Reference Liu, Zhao, Li and Zhao2022; Mangini et al., Reference Mangini, Ferrara, Zito, Managó, Luini, De Luca and Coppola2023). When a morphological change occurs in a selected cell or tissue during a biological process such as cell division, apoptosis, or stress response, this change can be identified, quantified, and visualized thanks to the consequent variation of the Raman spectrum (Short et al., Reference Short, Carpenter, Freyer and Mourant2005; Brauchle et al., Reference Brauchle, Thude, Brucker and Schenke-Layland2014). Moreover, Raman spectroscopy has been used for studying the biochemical composition of male gametes of different mammalian species (Movasaghi et al., Reference Movasaghi, Rehman and Rehman2007; Ferrara et al., Reference Ferrara, Di Caprio, Managó, De Angelis, Sirleto, Coppola and De Luca2015a; De Angelis et al., Reference De Angelis, Ferrara, Coppola, Di Matteo, Siani, Dale, Coppola and De Luca2019; Bogliolo et al., Reference Bogliolo, Leoni and Ledda2020) and for investigating the effect of vitrification/warming on the state of the actin cytoskeleton of sheep oocytes matured in vitro (Bogliolo et al., Reference Bogliolo, Murrone, Piccinini, Ariu, Ledda, Tilocca and Albertini2015), as well as for monitoring the beta-carotene granules content of sea urchin eggs (Nekvapil et al., Reference Nekvapil, Brezeştean, Tomšić, Müller, Chiş and Cintă Pinzaru2019). Raman spectroscopy can be applied to fixed and unfixed cells, providing biochemical information comparable and complementary to fluorescence microscopy.
In this contribution, we applied Raman spectroscopy to probe the structural changes of the actin filaments (depolymerization and polymerization) in sea urchin eggs caused by actin drugs or the fertilizing sperm. Raman maps of fixed eggs allowed the visualization of the actin cytoskeletal reorganization at different experimental conditions. These results correlated well with the fluorescent signals from living eggs microinjected with LifeAct-GFP. Therefore, Raman spectroscopy can serve as a valuably rapid and non-invasive method for evaluating F-actin dynamics that does not involve microinjection or exogenous expression but simple sample preparation.
Materials and methods
Gamete preparation and fertilization
Paracentrotus lividus samples were collected in the Gulf of Naples during the breeding season (from October to May) and maintained in circulating seawater (16°C). Artificial spawning was induced by intracoelomic injection of 0.5 M KCl. Eggs were then collected and stored in filtered seawater, while dry sperm were kept at 4°C and diluted in normal seawater (NSW pH 8.1) a few minutes before experiments. For treatments with actin drugs, eggs were treated with 3 μM latrunculin-A (LAT-A, purchased from Merck), 12 μM jasplakinolide (JAS; purchased from Molecular Probes), or 0.1% dimethyl sulphoxide (DMSO; drugs vehicle, Merck) for control eggs for 15 min at room temperature. Fertilization was performed using a final spermatozoa concentration of 1.84 × 10⁶ units/ml. The eggs were divided into six main groups: Unfertilized (eggs in seawater not inseminated), 15 s pf (eggs 15 s after insemination), 15 min pf (eggs 15 min after insemination), Control (DMSO) (untreated eggs exposed to DMSO for 15 min), LAT-A (eggs treated with LAT-A for 15 min), and JAS (eggs exposed to JAS for 15 min).
Microinjection and live cell imaging
Living P. lividus eggs were microinjected with 5 mg/ml of bacterially expressed LifeAct-GFP fusion protein (a generous gift from A. McDougall of UPMC Sorbonne University, France) using an air pressure transjector (Eppendorf FemtoJet, Hamburg, Germany). The extracellular layers of the eggs were left intact without preliminary treatment, as previously described (Chun et al., Reference Chun, Limatola, Vasilev and Santella2014). The visualization of the cortical F-actin structure and its dynamics at fertilization was observed by a Leica TCS SP8X inverted confocal laser scanning microscope equipped with a white light laser and hybrid detectors (Leica Microsystem, Wetzlar, Germany). Fluorescence images were collected on the confocal microscope to quantify the LifeAct-GFP signals representing F-actin on the confocal plane. A MetaMorph scan was performed to obtain the mean of the fluorescence intensity along the line.
Raman spectroscopy analysis and sample preparation
Aliquots of eggs were fixed before and after fertilization (15 s and 15 min after insemination) with 2% paraformaldehyde for 20 min at room temperature. Samples were washed twice in seawater and stored at 4°C until Raman spectroscopy analysis was performed. Raman spectra were collected using an inverted confocal Raman microscope (XploRA INV, Horiba Jobin Yvon, Villeneuve d’Ascq, France) equipped with a 532 nm wavelength diode laser (laser power = sample 2 mW) and a X60 water immersion objective (Nikon, Ti-2000 Eclipse, Nikon Instruments Europe BV, Amsterdam, Netherlands, Numerical aperture (NA) = 1.2). The excitation laser wavelength and intensity were selected to avoid any possible phototoxic effect on the cells (Ferrara et al., Reference Ferrara, De Angelis, De Luca, Coppola, Dale and Coppola2015b).
The scattered light from the sample was spectrally filtered by a holographic notch filter, then spatially filtered by a pinhole (300 μm), and finally directed to the spectrometer, equipped with a 600 lines/mm holographic grating. The Raman scattered light was focused into the spectrometer entrance slit (100 μm) and imaged using a thermoelectrically cooled charge-coupled device (CCD) camera.
Fixed eggs in NSW were sandwiched between two CaF2 coverslips and then sealed with standard nail polish. Each Raman spectrum was acquired with an integration time of 1 s. Spectra were normalized by subtracting the solvent background signal followed by an additional baseline correction. Data were analyzed using Origin software. Mean Raman spectra of the egg cortex were generated using 500 spectra (50 for each sample) acquired in the outer cytoplasmic region of the eggs (∼ 6–7 μm from the external egg edge) in the fingerprint region (between 1000–1800 cm−1) and CH region (between 2800–3000 cm−1). The spectrum Raman intensities were normalized by the maximum peak intensity and reported in arbitrary units. The analysis was repeated on 10 cells (n = 10) per each experimental condition. The actin Raman spectrum was obtained by analyzing in reference to the purified actin commercially available (Sigma Aldrich).
The Raman image was recorded using raster scanning over a selected cell region through the laser focus with a step size of 0.5 μm. Univariate intensity maps were constructed by integrating the Raman spectral region corresponding to F-actin (for instance, the band at 1440 cm−1) using the Horiba Scientific Laboratory Spec 6 software (Horiba Jobin Yvon, Villeneuve d’Ascq, France) (Managó et al., Reference Managó, Mirabelli, Napolitano, Zito and De Luca2018). The spectra used for the imaging map were baseline and cosmic ray corrected.
Results
Visualization of the actin filaments in living sea urchin eggs by use of microinjected LifeAct-GFP
To define the structural changes of the actin cytoskeleton in sea urchin eggs following the treatment with actin drugs or fertilizing sperm, intact P. lividus eggs were microinjected with LifeAct-GFP and exposed to 3 μM LAT-A, 12 μM JAS, or sperm. These two drugs were chosen because they induce F-actin depolymerization and polymerization, respectively. After incubation at certain intervals, the fluorescence images representing F-actin were analyzed using confocal microscopy (Figure 1). As expected, the control eggs, Control (DMSO), treated only with the drug vehicle 0.1% DMSO, (n = 3) displayed signals at the subplasmalemmal region where dense meshwork of actin filaments are located (Figure 1a).
Visualization of the actin filaments in live sea urchin eggs using microinjected LifeAct-GFP. Intact P. lividus eggs were microinjected with 5 μg/μl (pipette concentration) of LifeAct-GFP 10 min before various treatments. (a) Incubation with actin drugs for 15 min: Control (0.1% DMSO, vehicle of the drug), LAT-A (3 μM), and JAS (12 μM). (b) Fertilization: Control (unfertilized), 15 s after fertilization (15 s pf), and 15 min after fertilization (15 min pf). F-actin (green) confocal images were captured and quantified by MetaMorph line scanning across the confocal plane (dotted lines). The length of the line-scan path is 120 µm. Note the initiation of the fertilization envelope formation by 15 s after insemination and its total elevation by 15 min later (B, transmitted light view on the upper panel). Abbreviations: FE, fertilization envelope; JAS, jasplakinolide; LAT-A, latrunculin-A; pf, post-fertilization.
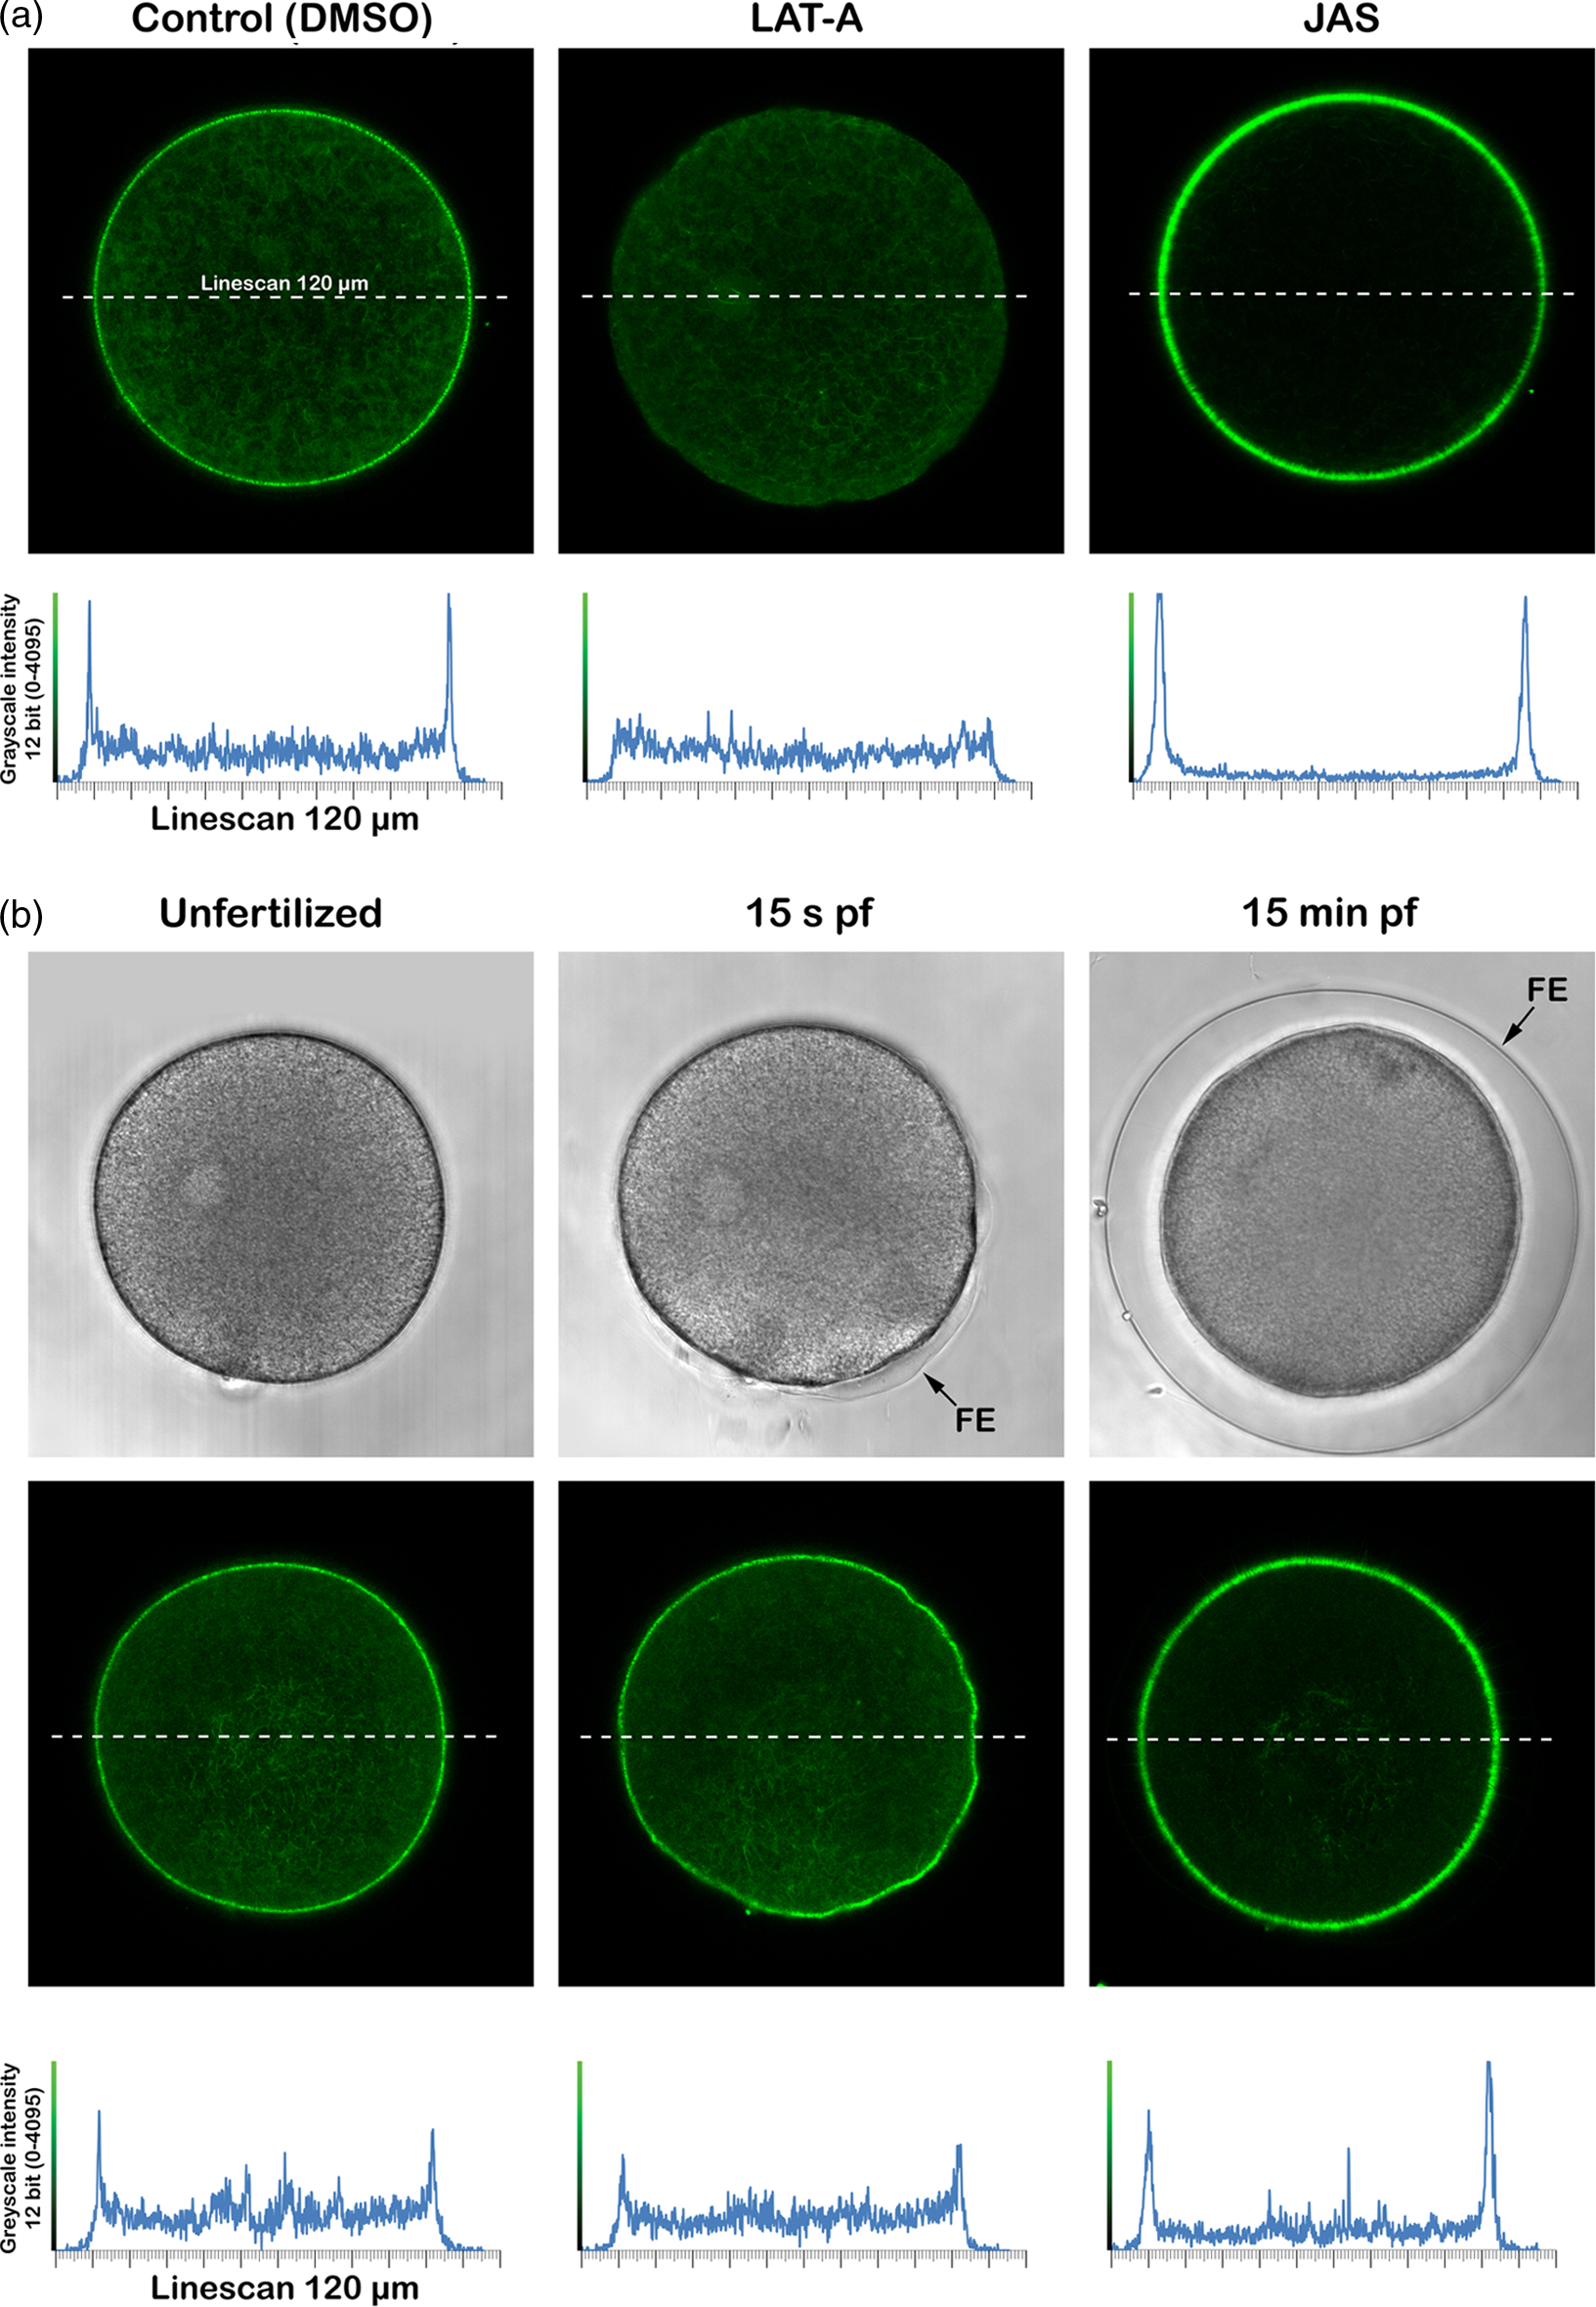
Following the exposure to LAT-A (3 μM, 15 min), which disrupts microfilament organization by inhibiting actin assembly, net depolymerization of actin filaments was most notable at the subplasmalemmal region of the eggs (n = 3). As shown in the line scanning profiles of the confocal plane (Figure 1A, lower panel), the two sharp peaks of the signals coming from the subplasmalemmal regions are eliminated by the drug treatment, indicating that this subcellular region is most active in actin tread-milling at the resting condition. Conversely, a similar treatment with JAS (12 μM, 15 min), which stabilized actin filaments, produced a net increment of the F-actin signals (Figure 1a) at the subplasmalemmal regions of the eggs (n = 3). Interestingly, the hyperpolymerization of actin filaments near the plasma membrane of these eggs caused the overall depletion of the actin pools in all other areas, as judged by the striking reduction of the fluorescent signals in the profile of line scanning at the regions representing the inner cytoplasm (Figure 1a, lower panel).
Following fertilization, conversely, the eggs (n = 4) also exhibited notable changes in the distribution of F-actin over the confocal plane (Figure 1b). By 15 s after fertilization, F-actin visualized in the tight subplasmalemmal zone of the same egg before insemination was appreciably reduced, as judged by the amplitude of the fluorescent signals emitted by LifeAct-GFP in the region (Figure 1b). At 15 s after fertilization, which is the time during which a Ca2+ increase is concomitant with the initiation of the elevation of the FE, less actin filaments are visible in the cortical area except for the core region of the zygote (Figure 1b lower panel, see also Figure 3c),. By contrast, at 15 min after fertilization, subplasmalemmal F-actin meshwork becomes dense again, as judged by the amplitude of the fluorescent signals reported by LifeAct-GFP in that region (Figure 1b). Both in fertilized eggs and in the eggs treated with JAS, it may be noteworthy that the F-actin signals in the subplasmalemmal area are not uniform, but preferentially denser on one side compared with the other. This result is not likely to be related to a margin of error in microinjection (e.g. the signals in the unfertilized eggs are relatively uniform) but may reflect the cytoskeletal asymmetry linked to the egg polarity constantly enhanced when actin undergoes polymerization following fertilization and after JAS treatment (Limatola et al., Reference Limatola, Vasilev, Chun and Santella2019).
Raman spectroscopic assessment of F-actin changes in the eggs treated with actin drugs
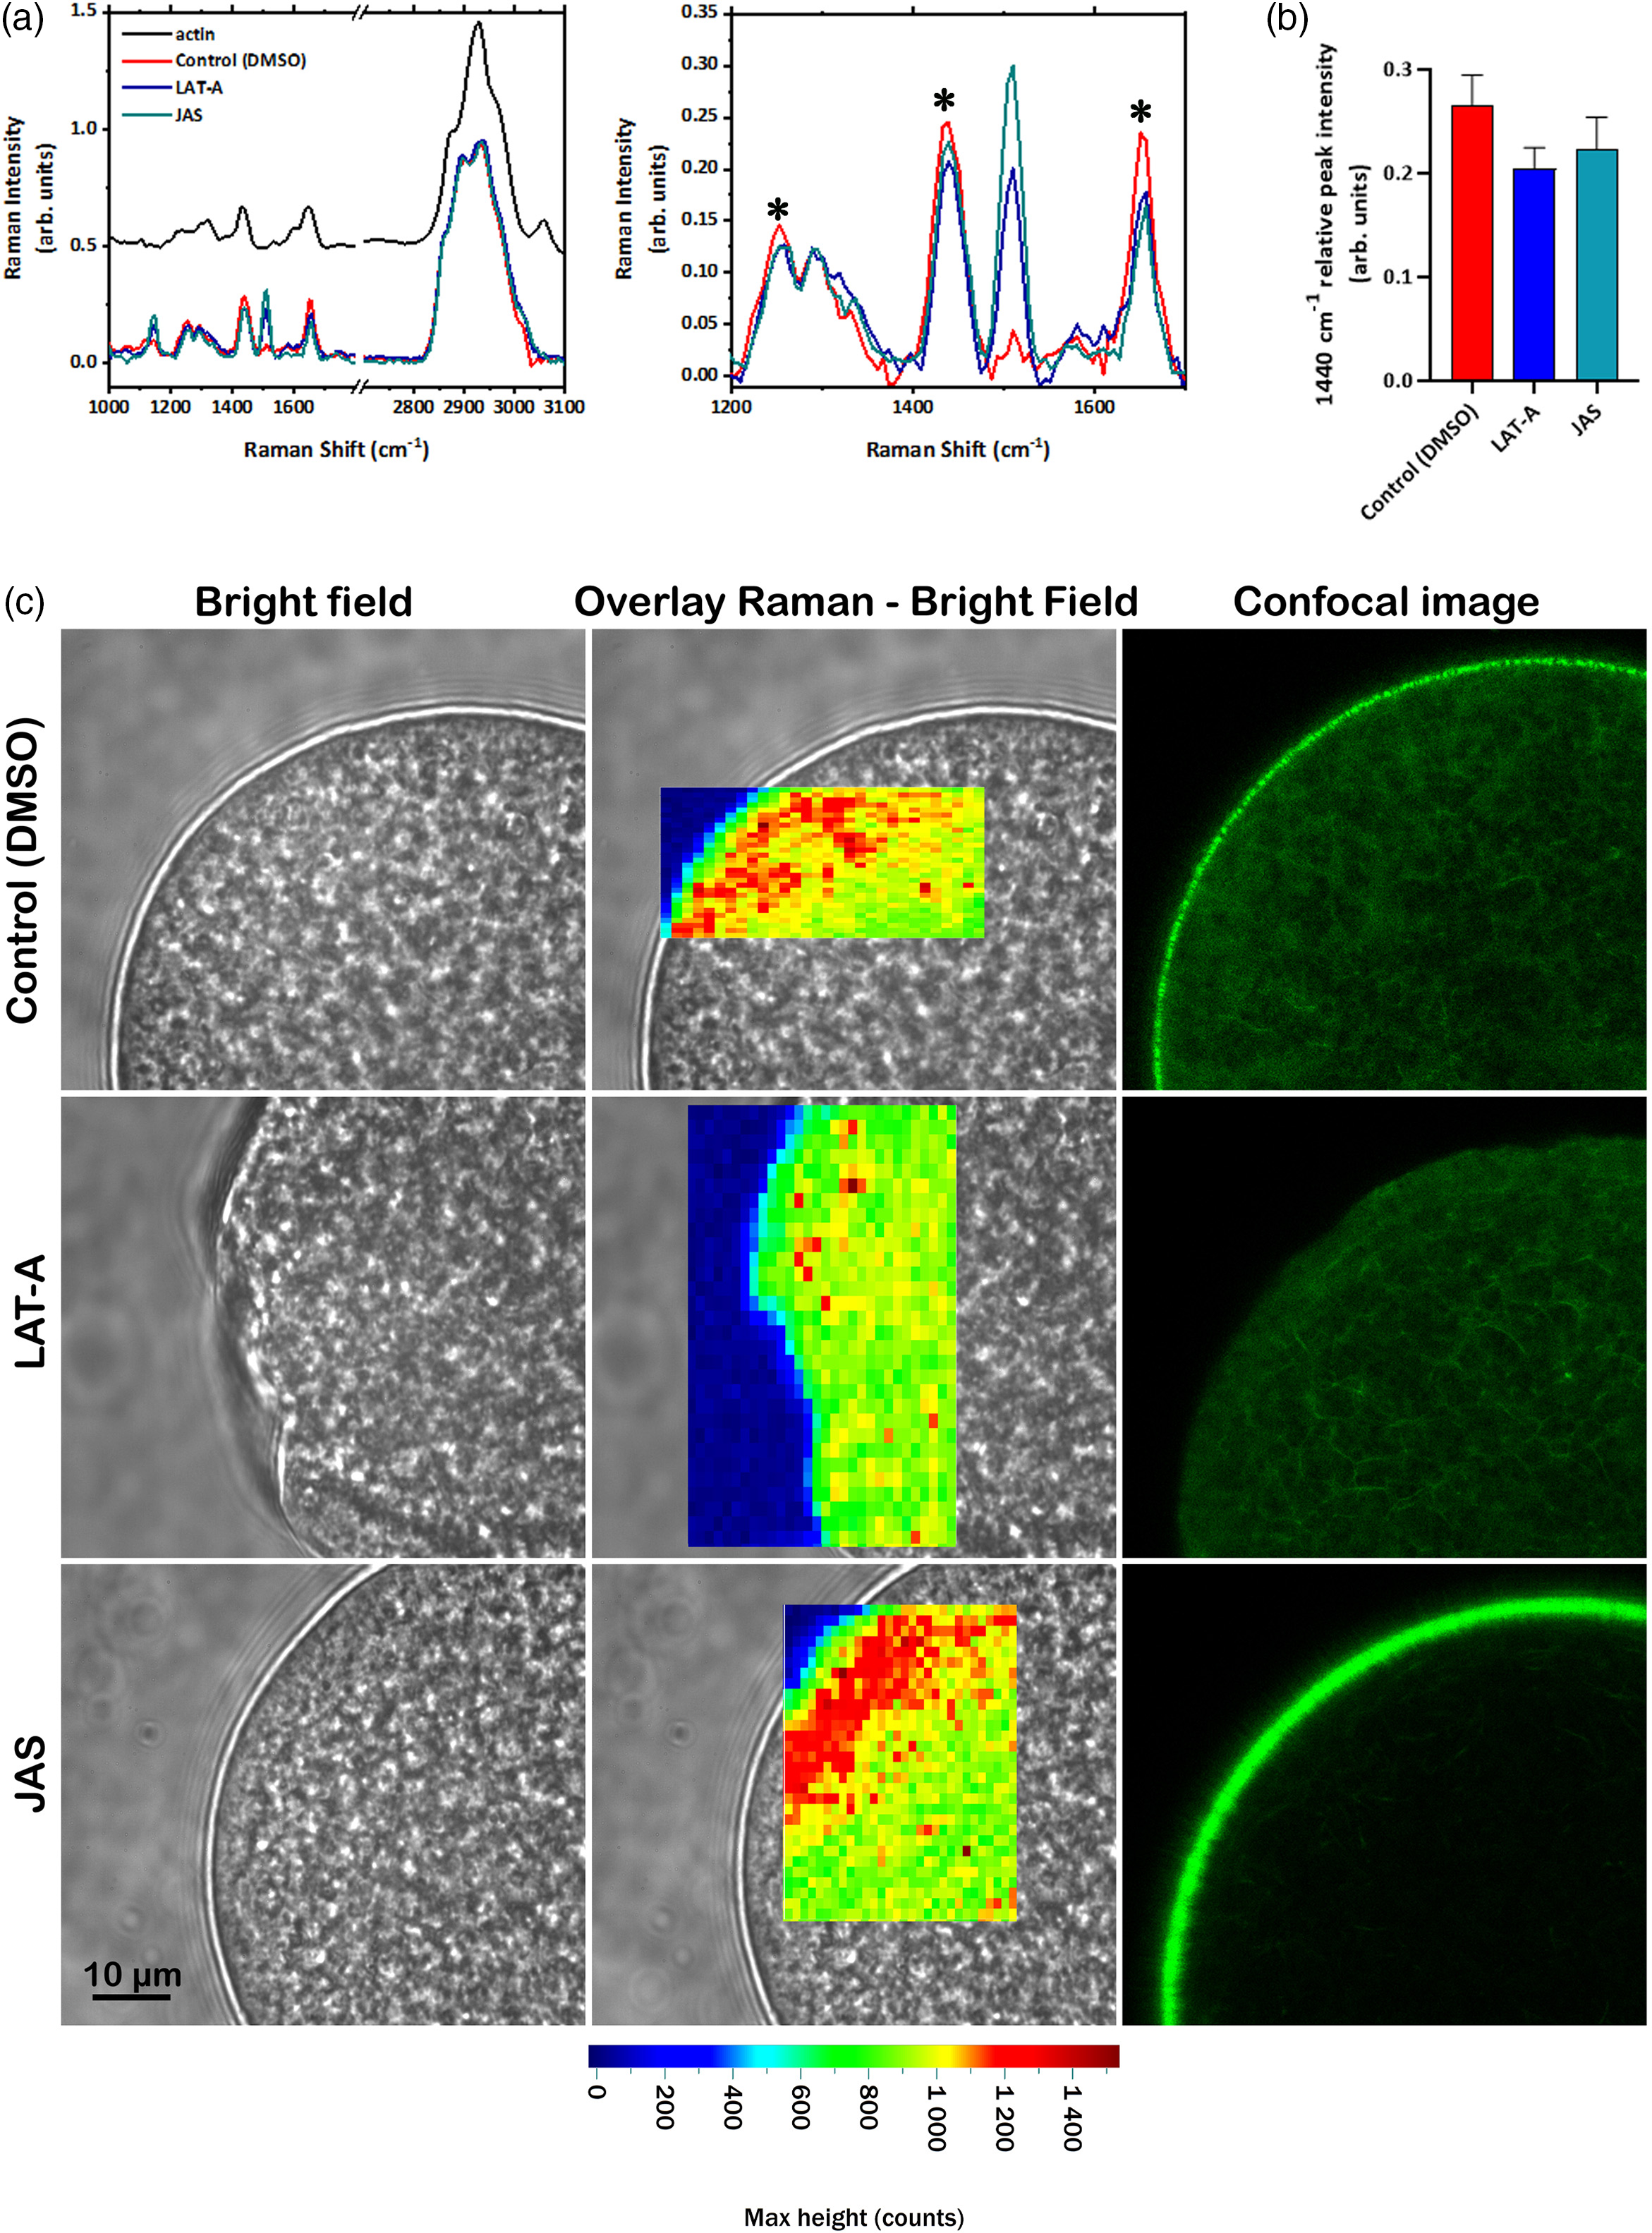
Label-free Raman spectroscopy was used for assessing the structural changes in the actin cytoskeleton of sea urchin eggs after the treatment with two actin drugs LAT-A and JAS. Following the procedure described in the Materials and Methods, the 500 Raman spectra, 50 spectra per egg (n = 10), were acquired from the subplasmalemmal region of the egg, ∼ 6–7 μm from the egg’s surface, where the most significant F-actin changes occur during fertilization. The spectrum Raman intensities were normalized by maximum peak intensity (band at 2930 cm−1) to emphasize the relative variation of specific Raman bands. These normalized spectra cannot provide information on the concentration/distribution of the cortical actin cytoskeleton but on the spectrum modification due to the drugs.
The average Raman spectra of untreated eggs, Control (DMSO), and those treated with LAT-A or JAS were then analyzed at the fingerprint region (1000–1800 cm−1). As a reference, the normalized spectrum of purified actin is also shown (Figure 2A). The mean spectra from the eggs mainly contained bands related to proteins and lipids: aromatic ring vibration of amide III at 1253 cm−1 and 1291 cm−1 (C–N stretch, N–H bend), CH2 vibrations of aliphatic side chains 1440 cm−1 and amide I at 1652 cm−1 (Movasaghi et al., Reference Movasaghi, Rehman and Rehman2007). These bands were also visible in the spectral profile of the purified actin (black line in Figure 2a). Moreover, the egg spectra also contained the characteristic bands typically associated with carotenoids, i.e. the peaks at 1150 cm−1 and 1508 cm−1 (Nekvapil et al., Reference Nekvapil, Brezeştean, Tomšić, Müller, Chiş and Cintă Pinzaru2019). The higher frequency region was characterized by the two bands between 2895 and 2930 cm−1 that were assigned to the CH3 and CH2 symmetric stretch of lipids, which was not visible in the spectra of purified actin. The band at 2895 cm−1 was assigned to the CH2 asymmetric stretch, and the one at 2930 cm−1 to the CH stretch. Both bands contained contributions from lipids and proteins and were visible with different relative intensities in the spectra of eggs and purified actin.
Raman spectroscopic evaluation of the F-actin distribution before and after exposure of sea urchin eggs to actin drugs. P. lividus eggs were fixed after the bath incubation with 0.1% DMSO (control), 3 μM LAT-A, or 12 μM JAS for 15 min), and subjected to Raman spectroscopy. For comparison, the distribution of F-actin was examined using confocal fluorescence microscopy in living eggs pre-injected with LifeAct-GFP under the same conditions. (a) Raman spectra of actin (black line), control (DMSO, red line), LAT-A (blue line), and JAS-treated eggs (green line). The zoomed profile of the spectra in the region from 1200 to 1700 cm−1 is shown in the right panel. Data are presented as a mean of 500 spectra (50 for each sample) acquired from sea urchin eggs (n = 10). Asterisks indicate the peaks that changed their intensity and/or shapes under treatment with the actin-binding drugs. The spectra are horizontally shifted. (b) Histogram showing the relative intensity of the 1440 cm−1 peak in the normalized spectra of Control (DMSO), LAT-A and JAS-treated eggs. The data are shown as mean ± SDs of 500 spectra (50 spectra for each sample, 10 eggs for experimental condition). (c) Representative eggs in each experimental condition were visualized by brightfield (left panel), and Raman imaging (middle panel). The Raman map was obtained by plotting the intensity of the 1440 cm−1 peak (Amides I and III). The same intensity scale (in photon counts) has been used for all the maps. Eggs in the same experimental condition, analyzed using LifeAct-GFP by confocal fluorescence microscopy, were additionally shown for comparison (right panel).
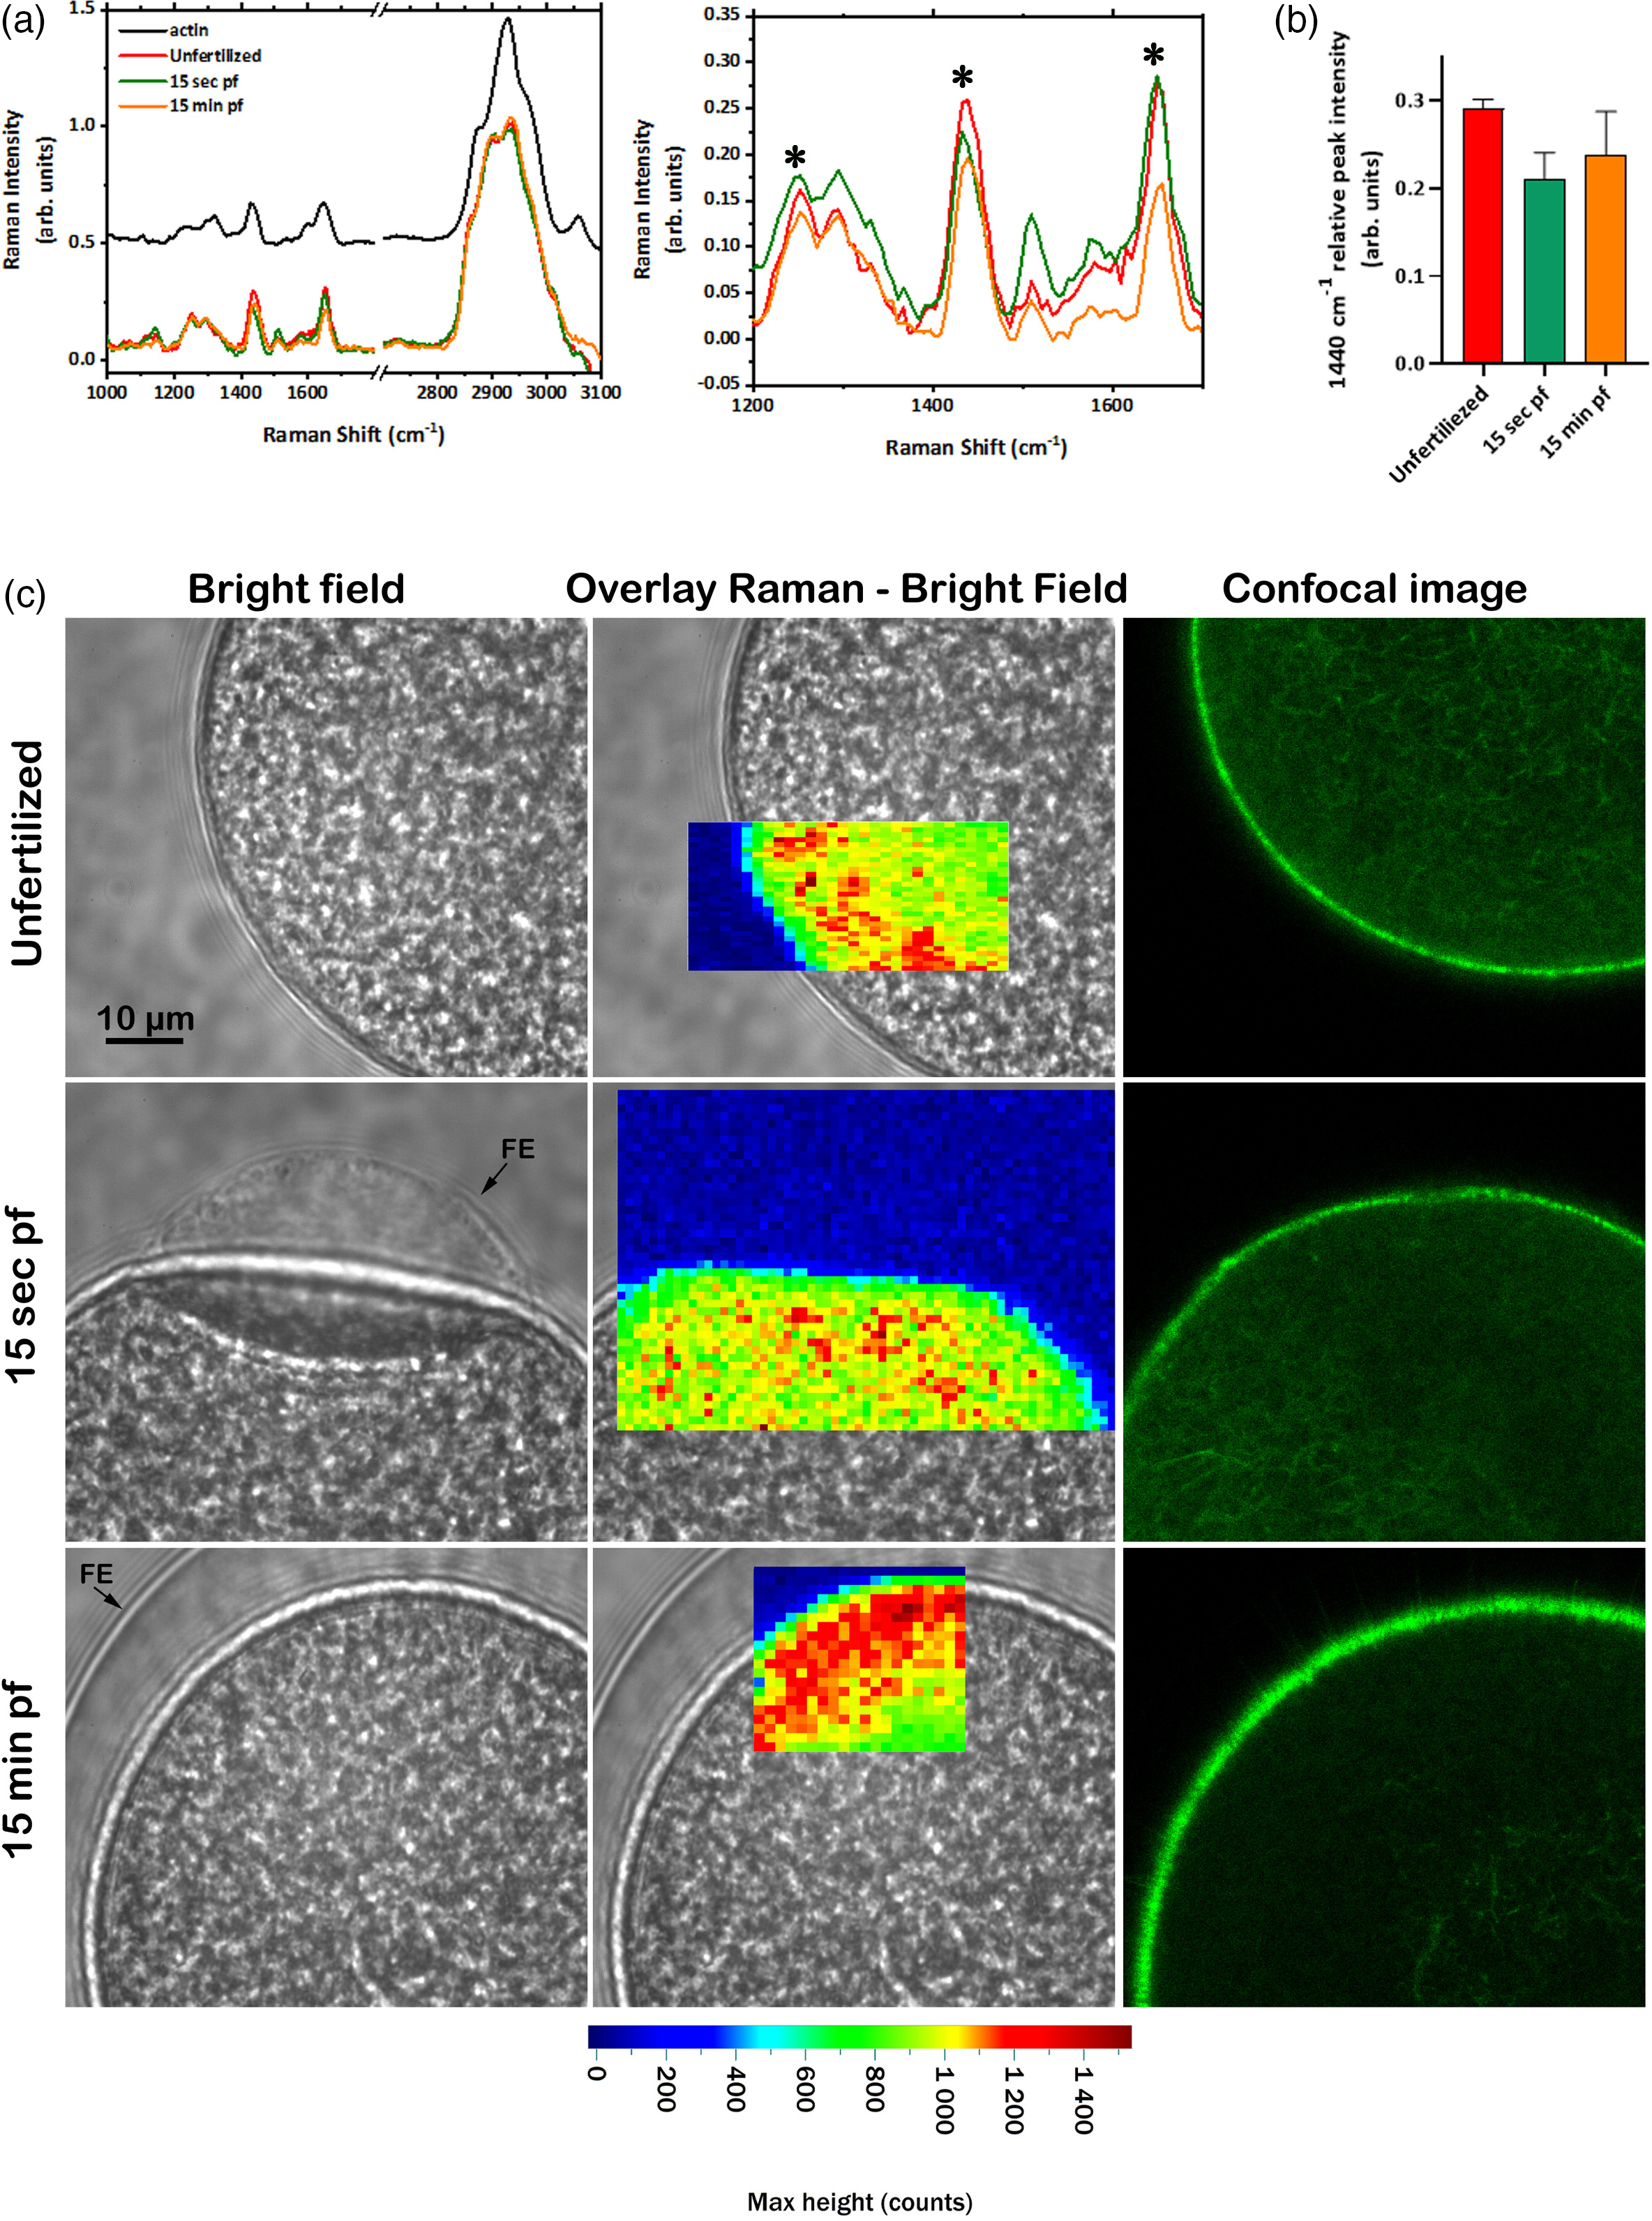
Raman spectroscopic evaluation of the F-actin distribution and its changes in fertilized eggs of sea urchin. P. lividus eggs were fixed before or after fertilization (15 s or 15 min) and subjected to Raman spectroscopy. For comparison, the distribution of F-actin was examined by conventional confocal microscopy in live eggs pre-injected with LifeAct-GFP. (a) Results of Raman spectra at each time interval. Spectral profiles: Raman spectra of purified actin (black line); unfertilized (red line); fertilized eggs after 15 s (green line); fertilized eggs after 15 min (orange line). The panel on the right represents the zoomed spectra in the region from 1200 to 1700 cm−1. Data are presented as a mean of 500 spectra (50 for each sample) acquired from sea urchin eggs (n = 10), normalized by the highest band. Asterisks indicate the peaks that changed their relative intensity and/or shapes after fertilization. The spectra are horizontally shifted. (b) Graph showing the relative intensity of the 1440 cm−1 peak in the normalized spectra of unfertilized, 15 s and 15 min after fertilization. The data are presented as the mean ± standard deviation (SD) of 500 spectra. (c) Representative eggs in each experimental condition were visualized by brightfield (left panel), Raman (middle panel), and confocal fluorescence microscopy (right panel). The Raman map was obtained by plotting the intensity of the 1440 cm−1 peak. Abbreviations: FE, fertilization envelope; pf, post-fertilization.
By comparing the spectra of the control eggs and those treated with the actin drugs normalized to the highest lipid ban, it is possible to highlight the variations in the fingerprint spectral regions. Overall, most spectral peaks were shared by actin and control eggs, indicating that actin is the major component of the subplasmalemmal region. In the spectral profiles of the eggs treated with the two drugs, the intensity, and shape of the bands were mainly changed in the spectral regions at ∼1253, 1291, 1440, and 1652 cm−1, which precisely correspond to the areas of the secondary protein structure, namely, amide I, amide III and C–C stretching regions (Figure 2b; Roessl et al., Reference Roessl, Leitgeb, Pieters, De Beer and Nidetzky2014). These spectral changes indicated that the drugs induced a change in the vibration characters of the protein, as actin forms a more disordered structure (Zeng et al. Reference Zeng, Xu and Wang1997). This effect was particularly evident for the band at 1440 cm−1, as shown in Figure 2b. Therefore, these Raman spectral peaks could serve as useful physical ‘markers’ to monitor the cortical actin cytoskeletal changes in a label-free way. In the eggs treated with LAT-A or JAS, the band intensity is also markedly strong at 1150 cm−1 and 1508 cm−1. This shift at the bands, which are characteristic of carotenoids but are nearly absent in the spectra of purified actin, is probably due to a mechanical rearrangement of the whole cortical structure of the eggs, which affects the relocation of the carotenoid granules rather than the actin cytoskeletal changes directly related to the protein structure.
For spatial localization of the actin rearrangement and reconstruction of false colour Raman maps, the Amide I and III bands at 1440 cm−1 were analyzed in the control (DMSO), LAT-A- and JAS-treated eggs (Figure 2c). Indeed, as previously reported (Bogliolo et al., Reference Bogliolo, Murrone, Piccinini, Ariu, Ledda, Tilocca and Albertini2015), this band which was used to identify changes in the cortical F-actin network of in vitro matured ovine oocytes following exposure to cryoprotectants and vitrification, showed marked relative intensity changes in sea urchin eggs after the treatment with the actin drugs (Figure 2c). The colour scale bar indicates the absolute intensity of the 1440 cm−1 band (in photon counts) in Figure 2C and all other Raman maps in this study. For the control eggs, high actin clustering was observed in the cortical region, and this effect was more evident in JAS-treated eggs, suggesting a more compact rearrangement of actin. As for the LAT-A-treated eggs, the Raman spectrum is less intense, probably due to cortical actin depolymerization and the signal of the 1440 cm−1 band being more delocalized compared with the control eggs. When Raman maps were compared with confocal fluorescence analysis with Life-Act-GFP staining performed in the three experimental conditions (Control, LAT-A- and JAS-treated eggs), there was a good agreement between the results obtained by the two methods. This observation validates the use of Raman imaging and the band at 1440 cm−1 for label-free assessment of the cortical actin cytoskeleton changes, as exemplified by the fixed eggs pretreated with LAT-A and JAS, which depolymerizes and hyperpolymerizes actin, respectively.
Raman spectroscopic assessment of F-actin changes in the fertilized eggs
Sea urchin eggs (P. lividus) were fertilized and fixed 15 s and 15 min after insemination and subsequently analyzed using Raman spectroscopy (Figure 3a). The average spectra collected from the cortical region of the eggs before and after fertilization exhibited the expected results analogous to those observed with LAT-A- and JAS-treated eggs. Therefore, the spectral bands at ∼ 1253, 1440, and 1652 cm−1, mainly associated with Amide I and Amide III, altered relative intensity during fertilization. After 15 s of sperm addition, a significant change of the bands at 1253 cm−1 was similar to the observation in the eggs treated with LAT-A-treated eggs (Figure 2b), suggesting depolymerization of the F-actin. Moreover, spectral changes are accompanied by a substantial shift of the carotenoid band at 1150 cm−1, which was also observed in the eggs treated with actin drugs. Therefore, the consistent alteration of the Raman spectral patterns in the fertilized eggs suggests that both the actin cytoskeleton and carotenoid-rich granules are being reorganized in the cortex in a manner comparable with the eggs treated with the actin drugs. For example, 15 min after fertilization, there was a reduction of the intensity of the bands at 1440 and 1652 cm−1 (Figure 3b), which is similar to the decrease in JAS-treated eggs (Figure 2b), suggesting a hyperpolymerization of the F-actin. Altogether, these results indicate that the actin polymerization status and the protein aggregation and reorganization can be monitored by Raman spectroscopy in a label-free way during sea urchin egg fertilization.
The spectral analysis demonstrated that the Amide I and III bands at 1253, 1440, and 1652 cm−1, mainly associated with the F-actin structure, were specifically modulated after fertilization and LAT-A- or JAS treatments. Therefore, we used these spectral bands to monitor the spatial rearrangements of the egg cortex following fertilization. For comparison, intact eggs (n = 4) pre-injected with LifeAct-GFP were fertilized, and the distribution of F-actin was analyzed by live cell imaging confocal microscopy at the same time points (Figure 3c). In the cortical region, the Raman map obtained by plotting the intensity of the band at 1440 cm−1, showed a less intense signal, reflecting the disturbed distribution of actin filaments 15 s after the insemination. This change and the spectral analysis suggest F-actin depolymerization in the fertilized egg cortex in the early phase of egg activation comprising the measured intracellular Ca2+ release, as confirmed by fluorescence imaging of the actin visualization. After 15 min from the fertilization, the Raman map shows a more compact actin rearrangement. Therefore, this change and the spectroscopic analysis can be interpreted as cortical actin hyperpolymerization and the formation of the dense actin meshwork, further confirmed by confocal fluorescence microscopy (Figure 3C).
Discussion
It is widely accepted that the correct development of mammalian embryos after fertilization relies on the quality of gametes, particularly the female ones (Movasaghi et al., Reference Movasaghi, Rehman and Rehman2007). Devising a non-invasive method to evaluate the quality of oocytes and eggs is one of the significant objectives in embryology and in the practice of assisted reproductive technologies because it will enhance the success rate of reproduction in both medical and veterinary fields. Quality control of oocytes and eggs is usually performed considering morphological criteria. Still, this method needs to be more accurate because the morphology of a cell often does not reflect its quality. For this reason, oocytes and eggs need to be subjected to more invasive analysis to obtain more structural and biochemical information that ensures gamete quality. In particular, one of the most decisive characteristics is the state of the actin cytoskeleton. It is indeed well known that the quality of oocytes and eggs strictly relies on the structure and function of the actin cytoskeleton because it plays a central role during oocyte maturation, oocyte polarity control, and the fertilization process (Maro et al., Reference Maro, Johnson, Pickering and Flach1984; Terada et al., Reference Terada, Morito, Tachibana, Morita, Nakamura, Murakami, Yaegashi and Okamura2005; Li and Albertini, Reference Li and Albertini2013; Lee et al., Reference Lee, Wang, Spate, Murphy, Prather and Machaty2014). In particular, the changes in the actin cytoskeleton dynamics in fertilized eggs of sea urchins have been traditionally investigated for decades, mainly by light and electron microscopy observations of fixed samples. The latter provided a high resolution at the ultrastructural level of the organization of the actin filaments before and following fertilization (Begg and Rebhun, Reference Begg and Rebhun1979; Begg et al., Reference Begg, Rebhun and Hyatt1982; Henson and Begg, Reference Henson and Begg1988).
Recent live cell experiments with confocal microscopy conducted in our laboratory using different fluorescent actin probes microinjected into unfertilized eggs have visualized two different cortical actin pools. Specifically, an actin ring immediately beneath the egg plasma membrane is more prominently visualized by LifeAct-GFP than by Alexa-Phalloidin, which starts to undergo polymerization 5 min after insemination (Limatola et al., Reference Limatola, Chun and Santella2022b; this contribution). Conversely, actin filaments translocating from the cortical region to the centre of the fertilized egg are more efficiently visualized by AlexaPhalloidin (Limatola et al., Reference Limatola, Vasilev, Santella and Chun2020a, Reference Limatola, Chun and Santella2020b, Reference Limatola, Chun, Cherraben, Schmitt, Lehn and Santella2021a, Reference Limatola, Chun and Santella2022b). In addition, the fact that the actin fibres oriented perpendicularly to the surface of a mature egg of starfish (Santella and Chun, Reference Santella and Chun2022) was not observed in living sea urchin eggs and suggests the diverse morpho-functionality of the egg cortex of the two echinoderm species that are fertilized at different meiotic stages (Just, Reference Just1939). The morpho-functional status of the actin filaments also depends on experimental conditions. Obviously, live intact cells without much manipulation are closer to their natural physiological conditions compared with isolated cortices, often utilized in ultrastructural studies (Sardet, Reference Sardet1984; Henson and Begg, Reference Henson and Begg1988). The crucial role of the structural organization of the actin of the cortex of unfertilized eggs in controlling a series of fast and slow events triggered by sperm stimulation has been amply demonstrated. They include sperm–egg interaction, Ca2+ signals starting a few seconds after insemination, CG exocytosis, and the associated lifting of the FE. To these early events, the cortical actin polymerization encompassing microvilli elongation follows in preparation of sperm entry and cleavage (Limatola et al., Reference Limatola, Chun and Santella2020b, Reference Limatola, Chun and Santella2021b, Reference Limatola, Chun and Santella2022a, Reference Limatola, Chun and Santella2022b). Indeed, if the cytoskeletal structure of the egg cortex is altered before insemination, binding and fusion with spermatozoa and the subsequent Ca2+ signalling go astray, resulting in polyspermy or failure of sperm entry. Even for monospermy, the prior alteration of the cortical actin cytoskeleton of the unfertilized eggs also compromises the subsequent embryonic development (Limatola et al., Reference Limatola, Vasilev, Chun and Santella2019). However, even if the live cell imaging methods with fluorescent compounds have the advantage of providing information on the structural dynamics of the actin of intact eggs in experimental conditions that recapitulate what happens at sea, their application still requires considerable individual technical skills. For these reasons, a non-invasive method that quickly enables the visualization and structural identification of the actin cytoskeleton changes without cell labelling would be highly desirable. Therefore, in the present communication, we applied Raman spectroscopy and imaging to detect the changes in the actin cytoskeleton in sea urchin eggs during the physiological response (early and late phases of the fertilization process) and following pharmacological treatments (LAT-A and JAS). The treatment with LAT-A and JAS affects actin peaks at 1253, 1291, 1440, and 1652 cm−1 of the Raman spectrum. Indeed, these peaks have already been associated with actin changes in sheep oocytes (Bogliolo et al., Reference Bogliolo, Murrone, Piccinini, Ariu, Ledda, Tilocca and Albertini2015). The subtle spectral changes observed in these peaks compared with the spectral profile of purified actin are likely to reflect the conformation of the protein induced by depolymerization or hyperpolymerization of actin in the subplasmalemmal zone. By plotting the intensity of the band at 1440 cm−1, showing the most important modulation, it was possible to visualize the actin cytoskeleton rearrangement during sea urchin eggs before and after pharmacological treatment. Indeed, in the cortical region of the control eggs, it manifested high actin concentration, and this effect was even more evident in JAS-treated eggs, suggesting a more compact rearrangement of the actin in the latter case (F-actin hyperpolymerization). Due to actin depolymerization, the actin Raman signal was less intense and more delocalized for the LAT-A-treated eggs. The reconstructed Raman maps were in very good agreement with confocal fluorescence images, confirming that the intensity of the band at 1440 cm−1 could be used for studying actin localization.
A substantial increase in the hallmark bands of carotenoids was observed after the LAT-A and JAS and was attributed to the secondary changes inflicted on the organization of the vesicles in the egg cortex, which are rich in carotenoids (Roessl et al., Reference Roessl, Leitgeb, Pieters, De Beer and Nidetzky2014). Indeed, the actin cytoskeleton is involved in rearranging the whole cortical structure of the eggs by mobilizing vesicles. In doing so, carotenoid granules may be relocated, and their protein component may be indirectly affected by their vibration kinetics.
The spectral results have shown a similar structural change of the F-actin after fertilization, i.e., relative intensity variation of the actin Raman bands and Raman imaging allowed identification of the actin depolymerization 15 s after and polymerization 15 min after insemination (n = 10). After 15 s from fertilization, the Raman maps show that actin filament signals are less intense and uniformly distributed in the egg cortex, resembling the distribution obtained after LAT-A treatment. Instead, 15 min after insemination, actin was polymerized at the egg cortex, where F-actin forms a very dense layer under the plasma membrane. Therefore, the Raman images correlated reasonably well with the LifeAct-GFP signals of F-actin in living eggs.
The main issue of detecting actin disassembly in eggs 15 s after sperm addition was rather challenging due to the movement and contraction of the fertilized eggs that undergo separation of the vitelline layer from the egg plasma membrane following the exocytosis of the content of CG into the PS (Figure 3). The actin depolymerization in the fertilized egg cortex which coincides with the early Ca2+ release event is followed by actin polymerization during the late phase of egg activation, starting 5 min after insemination, as shown previously (Limatola et al., Reference Limatola, Chun and Santella2022b). The results of this contribution demonstrated that the characteristic changes of the Raman spectral peaks in the eggs fixed 15 s and 15 min after insemination were comparable with the cortical actin depolymerization and polymerization phases scarcely visualized by injected LifeAct-GFP. Compared with confocal fluorescence microscopy or other microscopy techniques, Raman microscopy may provide a lower spatial resolution but allow biochemical identification of the actin ‘status.’
Even if we had used fixed samples for Raman analysis, it is worth mentioning that the excitation laser’s wavelength and intensity had been selected to avoid any possible phototoxic effect on the cells. We have not evaluated directly if the laser-irradiated zygotes develop normally; further analysis is required to confirm this point. However, the data reported by Perevedentseva et al. (Reference Perevedentseva, Krivokharchenko, Karmenyan, Chang and Cheng2019) confirm that we had selected safe parameters for the living embryo measurements.
Label-free Raman imaging of eggs treated with drugs or fertilized at two different times has been used to correlate the biochemical and morphological information. Therefore, it can be used in correlation with standard imaging protocols for analyzing samples with no or minimal manipulation and, therefore, for exploring the samples in the most physiological possible condition to avoid data misinterpretation.
In conclusion, our work has shown that Raman spectroscopy could help to monitor the actin cytoskeletal modifications during fertilization without microinjecting fluorescent probes. Nonetheless, it bears an emphasis that the new approach based on this technique may detect subtle changes that are often very difficult to resolve in confocal microscopy using living eggs due to the rapid morphological changes of the actin filaments that it was easier to capture using fixed samples. Therefore, each method supplements the other.
Acknowledgements
The authors thank Davide Caramiello from CAPE Department for maintaining sea urchins in the tanks and Giovanni Gragnaniello and Stefano Managó for helping to prepare the figures.
Financial support
This research received no specific grant from public, commercial, or non-profit funding agencies. It was financially supported by institutional funds (fellowship) the Stazione Zoologica Anton Dohrn granted to N.L. M.M. is supported by a PON IMPARA fellowship. The authors thank the POR CIRO infrastructure and Euro-Bioimaging for Raman imaging.
Competing interests
The authors declare no conflict of interest.
Ethical standard
Sea urchins (Paracentrotus lividus) used for the present study were collected according to the Italian legislation (DPR 1639/68, 19 September 1980 and confirmed on 1 October 2000). All the experimental procedures were carried out following the guidelines of the European Union (Directive 609/86).


 Open access