

1. INTRODUCTION
Surge-type glaciers experience well-defined cyclical non-steady flow, with alternation between short active phases (months--years) characterized by rapid terminus advance, and longer quiescent phases (years--decades) characterized by terminus stagnation or retreat (Meier and Post, Reference Meier and Post1969; Copland and others, Reference Copland2011). Glacier surges can cause disasters, such as the 2002 Kolka glacier catastrophe in the Caucasus, which killed more than 100 people (Kotlyakov and others, Reference Kotlyakov, Rototaeva and Nosenko2004), the largest recorded glacial-lake outburst flood events in historical time caused by 1986 and 2002 surges of Hubbard Glacier (Motyka and Truffer, Reference Motyka and Truffer2007), and the 2015 surge and avalanche of Karayaylak Glacier, which swallowed 1000 ha of grazing meadow and damaged over 61 herdsmen's houses (Lv and others, Reference Lv2016; Shangguan and others, Reference Shangguan2016). Although glacier surging has been recognized by scientists since the earliest study of Alaska glacier surges during the 1890s, the mechanism of surging remains poorly understood (Guo and others, Reference Guo, Liu, Wei and Bao2013); thus, identification and study of glacier surge helps not only to understand the mechanics of glacier surging but also to protect human life and property.
High Mountain Asia (HMA) hosts the largest glacier concentration outside the polar regions. In HMA, some glaciers surging in the Karakoram and West Kunlun regions have been identified by satellite remote sensing (Copland and others, Reference Copland2011; Yasuda and Furuya, Reference Yasuda and Furuya2013, Reference Yasuda and Furuya2015; Quincey and others, Reference Quincey, Glasser, Cook and Luckman2015; Bhambri and others, Reference Bhambri, Hewitt, Kawishwar and Pratap2017; Usman and Furuya, Reference Usman and Furuya2018; Chudley and Willis, Reference Chudley and Willis2019), but comprehensive study of surge behaviors in this area is still limited. In this letter, by utilizing remote-sensing data, we are able to estimate and present the changes in surface velocity, terminus, morphological features and glacier thickness of Alakesayi Glacier during its recent surge and thus expand the knowledge of Alakesayi Glacier surge dynamics.
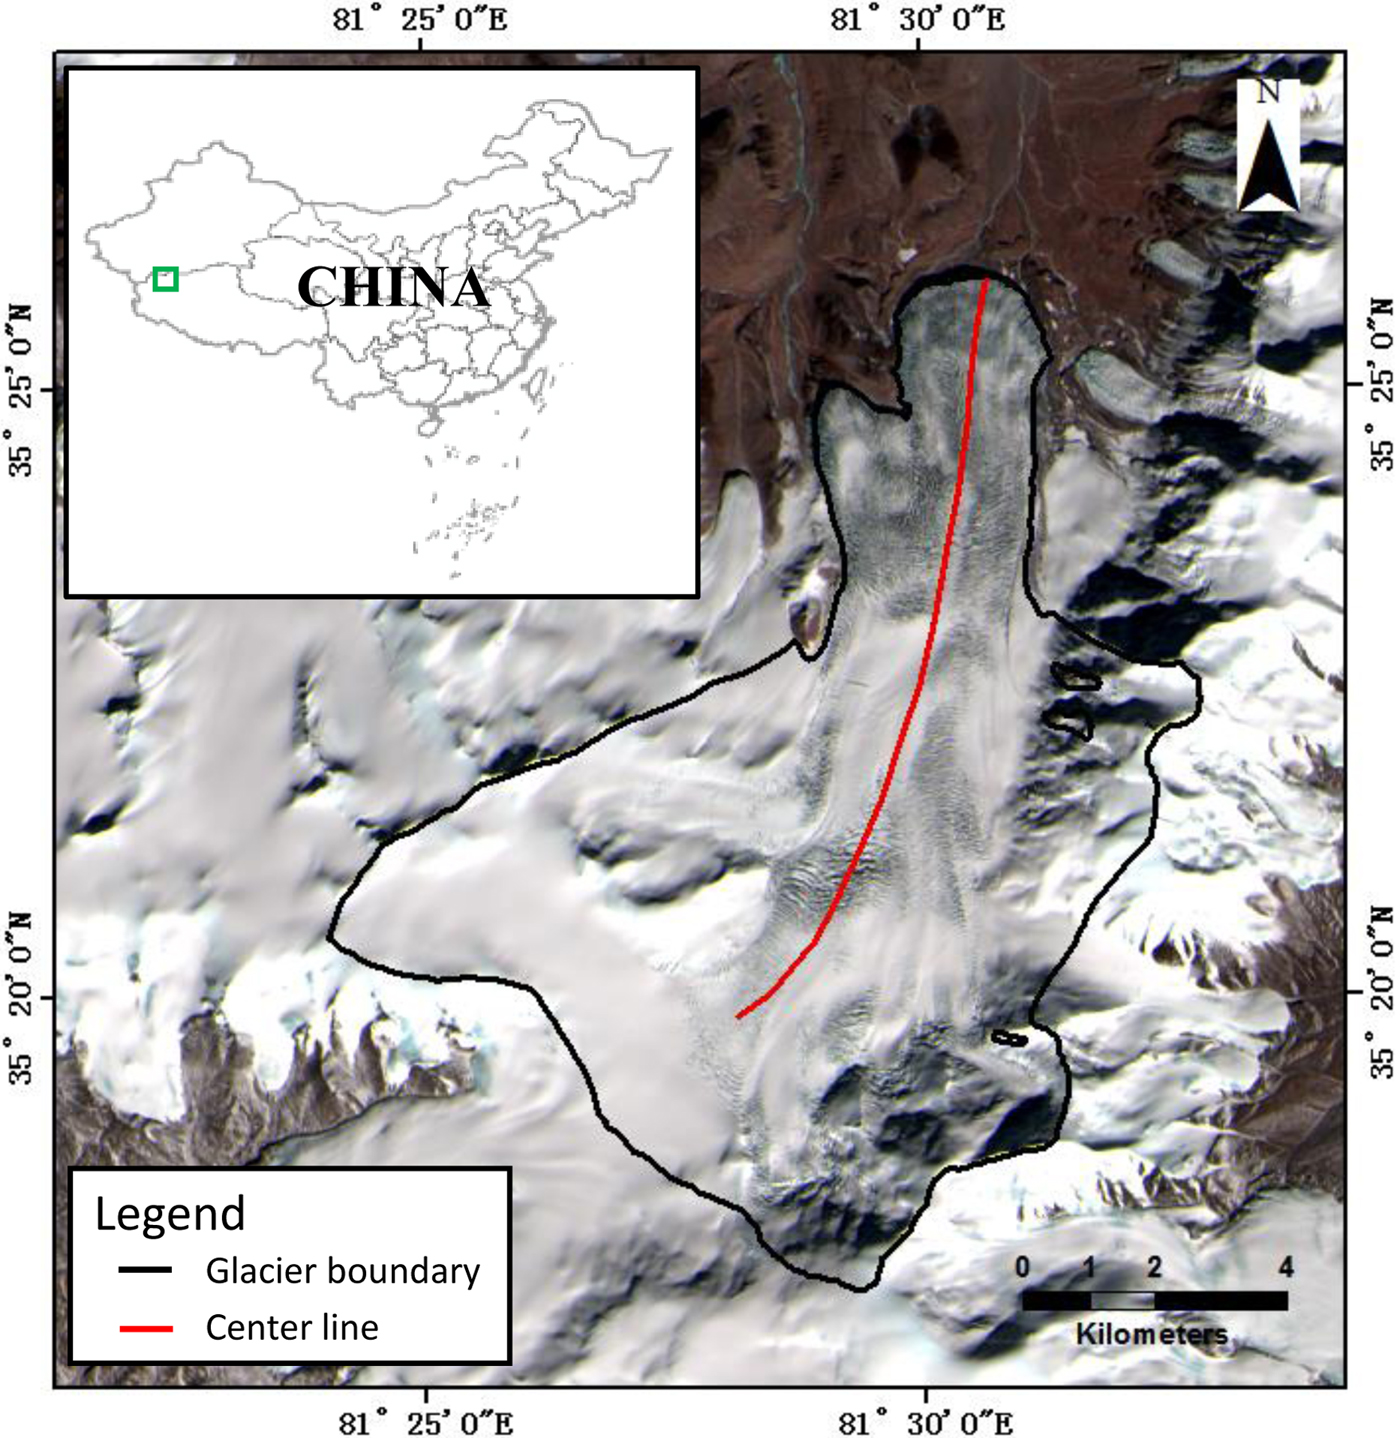
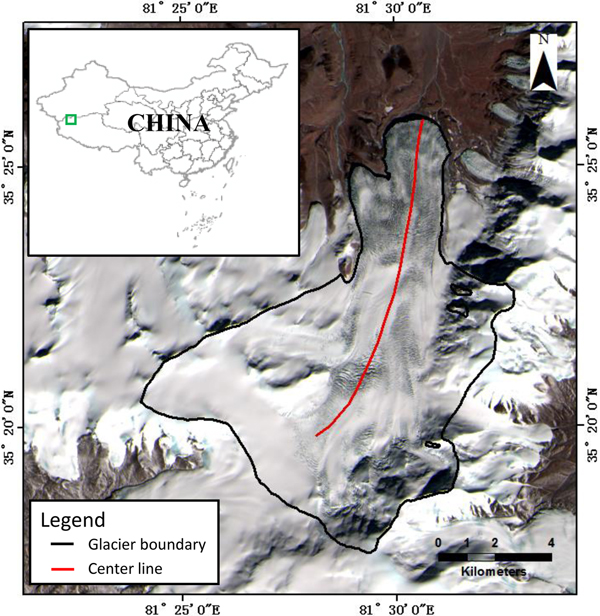
Alakesayi Glacier (N 35°21′52″; E 81°29′43″, GLIMS ID: G081483E35351N) is in the eastern part of the West Kunlun Shan (WKS), northwestern Tibetan Plateau, China (Fig. 1), which is one of the regions with the most densely concentrated mountain glaciers in the Tibetan Plateau. The glacier is 18.5 km long and covers an area of 92.82 km2. It flows northward from an elevation of 6786 m a.s.l. and terminates at 5280 m a.s.l., with a snowline elevation of 5740 m a.s.l.. Previous studies have shown that Alakesayi Glacier flowed at relatively low speed of ~0.1 md−1 during 2006–09 (Yasuda and Furuya, Reference Yasuda and Furuya2013; Yan and others, 2015), and its terminus retreated from the 1970s until about 2000 when it may have slightly advanced (Yasuda and Furuya, Reference Yasuda and Furuya2015).
Landsat 8 scene of Alakesayi Glacier on 15 November 2017, with glacier outline (black) and manually delineated center line (red). The green rectangle in the inset indicates the location of Alakesayi Glacier in China.
2. METHODS
We derived glacier surface velocity from Landsat 8 OLI images, which have been extensively used to estimate glacier velocities (Fahnestock and others, Reference Fahnestock2016; Lv and others, Reference Lv2016; Paul and others, Reference Paul, Strozzi, Schellenberger and Kääb2017). Sixteen images in the same path/row (Path 145, Row 035) were chosen and downloaded from the website of the USGS (https://earthexplorer.usgs.gov/). Image correlation algorithm in the frequency domain implemented in Cosi-corr (Co-registration of Optically Sensed Images and Correlation) software package (Leprince and others, Reference Leprince, Barbot, Ayoub and Avouac2007) was used to estimate the glacier surface displacement measurements because this algorithm has already been proven to obtain accurate results (Leprince and others, Reference Leprince, Barbot, Ayoub and Avouac2007; Herman and others, Reference Herman, Anderson and Leprince2011). We used an initial search window of 128 × 128 pixels and a 32 × 32-pixel window as the final window, which was obtained empirically after extensive testing. The threshold of the signal-to-noise ratio was set to 0.95 to avoid the occurrence of a correlation bias, and four robustness iterations were applied. We set the step size to 8 pixels to produce velocity maps with 120 m resolution. The correlating results were first filtered by a median low-pass filter, velocity vector fields were then inspected visually and any remaining anomalous vectors were manually removed. Finally, the vector fields were scaled into units of m d−1 to be comparable with each other. The uncertainty is obtained by measuring displacement in the off-glacier area and was smaller than 8 m for each Landsat-derived displacement map with a time span of 16--96 days, which is consistent with previous studies (Dehecq and others, Reference Dehecq, Gourmelen and Trouve2015; Kääb and others, Reference Kääb2016).
The glacier terminus fluctuations were measured manually at ~1-year intervals. Because the Landsat 8 images were well co-registered within subpixel, the accuracy of terminus advance was considered to be within 30 m. Surface morphological features were also interpreted visually from remote-sensing images.
The change in surface elevation during the surge can be estimated by the DEM difference method (Round and others, Reference Round, Leinss, Huss, Haemmig and Hajnsek2017; Wendt and others, Reference Wendt, Mayer, Lambrecht and Floricioiu2017).We adopted the Shuttle Radar Topography Mission (SRTM) 1 arc-second DEM and Advanced Spaceborne Thermal Emission and Reflection Radiometer (ASTER) DEM to evaluate the surface elevation changes. The SRTM DEM was acquired in February 2000 and ASTER DEMs were acquired on on 5 December 2012 and 28 January 2018, respectively. Before DEM differencing, the quality of ASTER DEMs was checked using the SRTM DEM. The ASTER DEMs were first co-registered to the SRTM DEM using the method proposed by Nuth and Kääb (Reference Nuth and Kääb2011) and then evaluated by calculating the difference between ASTER DEMs and the SRTM DEM in off-glacier area. The standard deviations in off-glacier area were 5.3 m and 6.1 m for the ASTER DEM of 5 December 2012 and 28 January 2018, respectively, which proved the usability of ASTER DEMs to quantify the glacier elevation change of Alakesayi Glacier. Then, the ASTER DEM of 28 January 2018 was co-registered to that of 5 December 2012, with a standard deviation of 7.1 m, to quantify the elevation change between 5 December 2012 and 28 January 2018. The differencing maps were filtered by a 3 × 3 low-pass filter to produce smoothing results and some visual artefacts in the accumulation area induced by clouds and snow cover were removed since optical images have poor textures due to the saturation in the snow-covered regions.
3. RESULTS
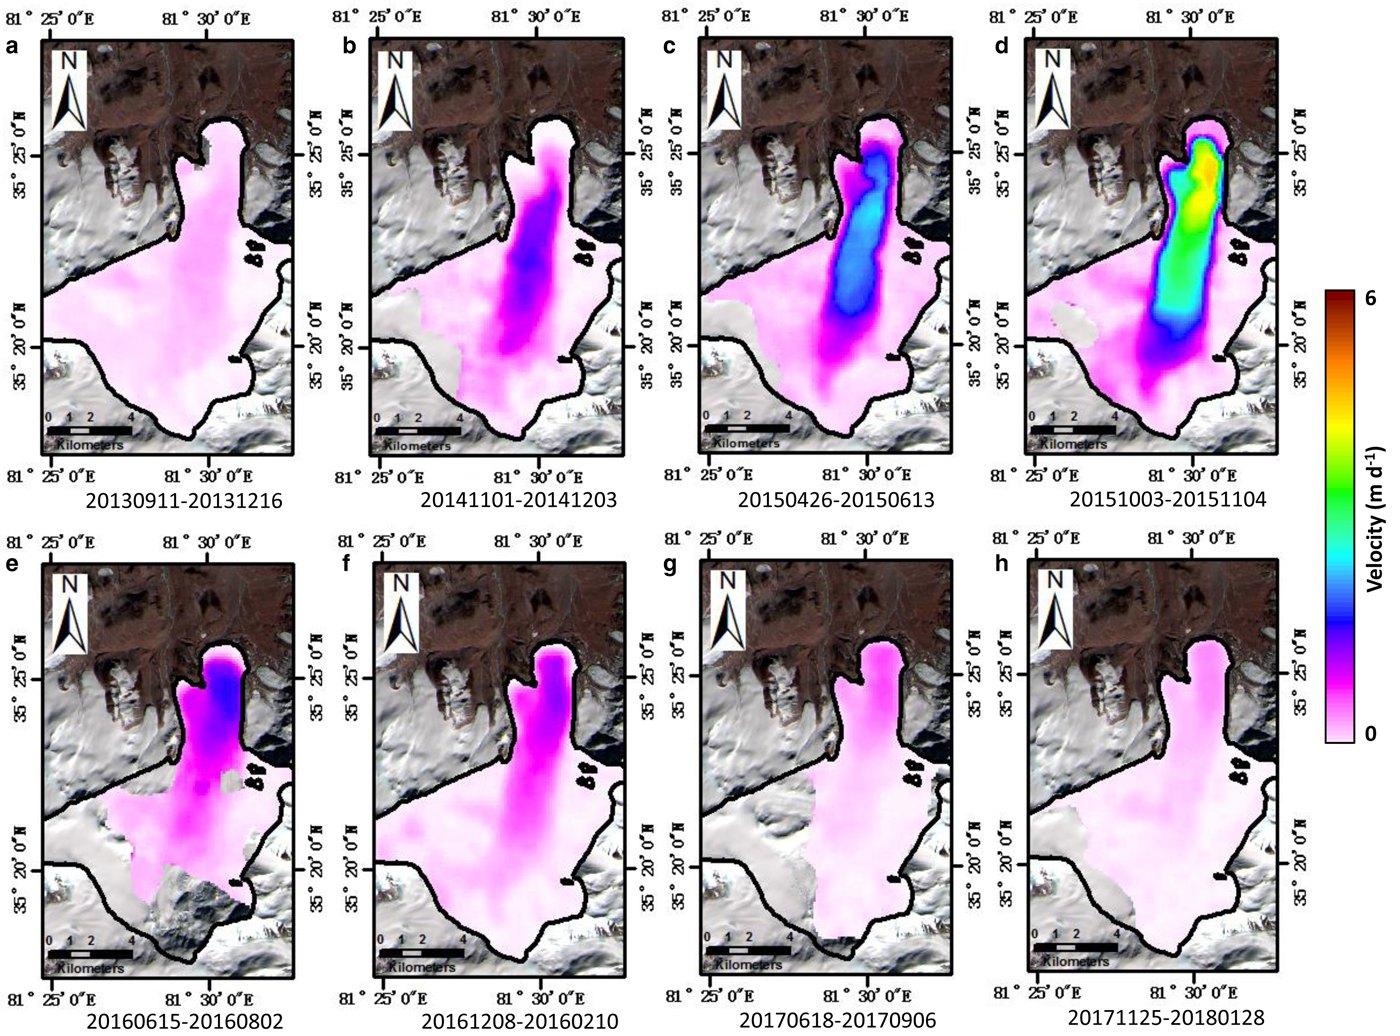
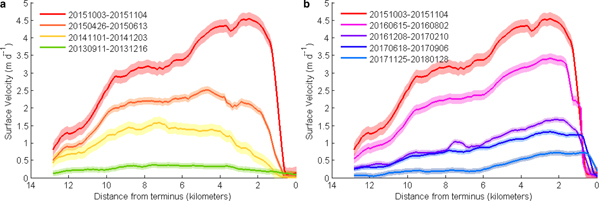
We derived eight surface velocity maps at different surge times, as displayed in Figure 2. Profiles were extracted from these velocity maps using the manually delineated center line shown in Figure 1 to provide some insight into the evolution of glacier surge. An increasing trend and a decreasing trend in velocity can be seen clearly in Figure 3a and b, respectively. In Figure 3a, the velocity between 11 September 2013 and 16 December 2013 was ~0.3 md−1, which was three times the velocity of ~ 0.1 m d−1 in previous studies (Yasuda and Furuya, Reference Yasuda and Furuya2013; Yan and others, Reference Yan, Liu, Wang, Perski and Ruan2015), meaning that the glacier may have been in the pre-surge phase. Velocity then increased slowly, reaching ~1.5 m d−1 in the time span of 1 November 2014 to 3 December 2014. After this time, the velocity increased rapidly until it reached a peak between 3 October 2015 and 4 November 2015 with a magnitude of ~ 4.5 m d−1, which is an order of magnitude greater than the velocity in 2006–09 (Yasuda and Furuya, Reference Yasuda and Furuya2013; Yan and others, Reference Yan, Liu, Wang, Perski and Ruan2015). The glacier then decelerated until the period between 8 December 2016 and 10 February 2017 (Fig. 3b). From 8 December 2016, the velocity decreased more slowly until 28 January 2018 when it reached almost below 0.5 m d−1 (Fig. 3b). A surge front could be identified at different surge stages, and it moved towards the glacier terminus as the surge continued.
Velocity maps derived from Landsat image correlation between 11 September 2013 and 1 January 2018. Panels (a)–(h) correspond to 1--3-month intervals indicated by the dates.
Center velocity lines extracted from the eight velocity maps in Figure 2. (a) Center line velocity profiles between 11 September 2013 and 4 November 2015; (b) Center line velocity profiles between 3 October 2015 and 28 January 2018. Shading envelopes represent the errors in velocity measurements. Note that profile 20151003--20151104 is shown in both panels.

The dynamics of the glacier terminus can be revealed by the lengths of the red lines shown in Figure 4. From 16 December 2013 to 3 December 2014, the glacier advanced 29 m (Fig. 4a and b), which is consistent with the low surface velocity speed at this time. During 3 December 2014 and 6 December 2016 when the surface velocity was higher, the terminus moved forward rapidly over distance of 641 m for the period from 3 December 2014 to 6 December 2015 and 512 m from 6 December 2015 to 8 December 2016 (Fig. 4b, c and d). The terminus advance reduced to 93 m from 8 December 2016 to 25 November 2017 (Fig. 4d and f), which agrees well with the velocity decrease during this period.
Changes in the glacier terminus and morphological features from 16 December 2013 to 25 November 2017. (a)–(e) correspond to changes of glacier terminus and morphological features. (f) is an enlargement of the green box in (a), and (g) is an enlargement of the green box in (d).
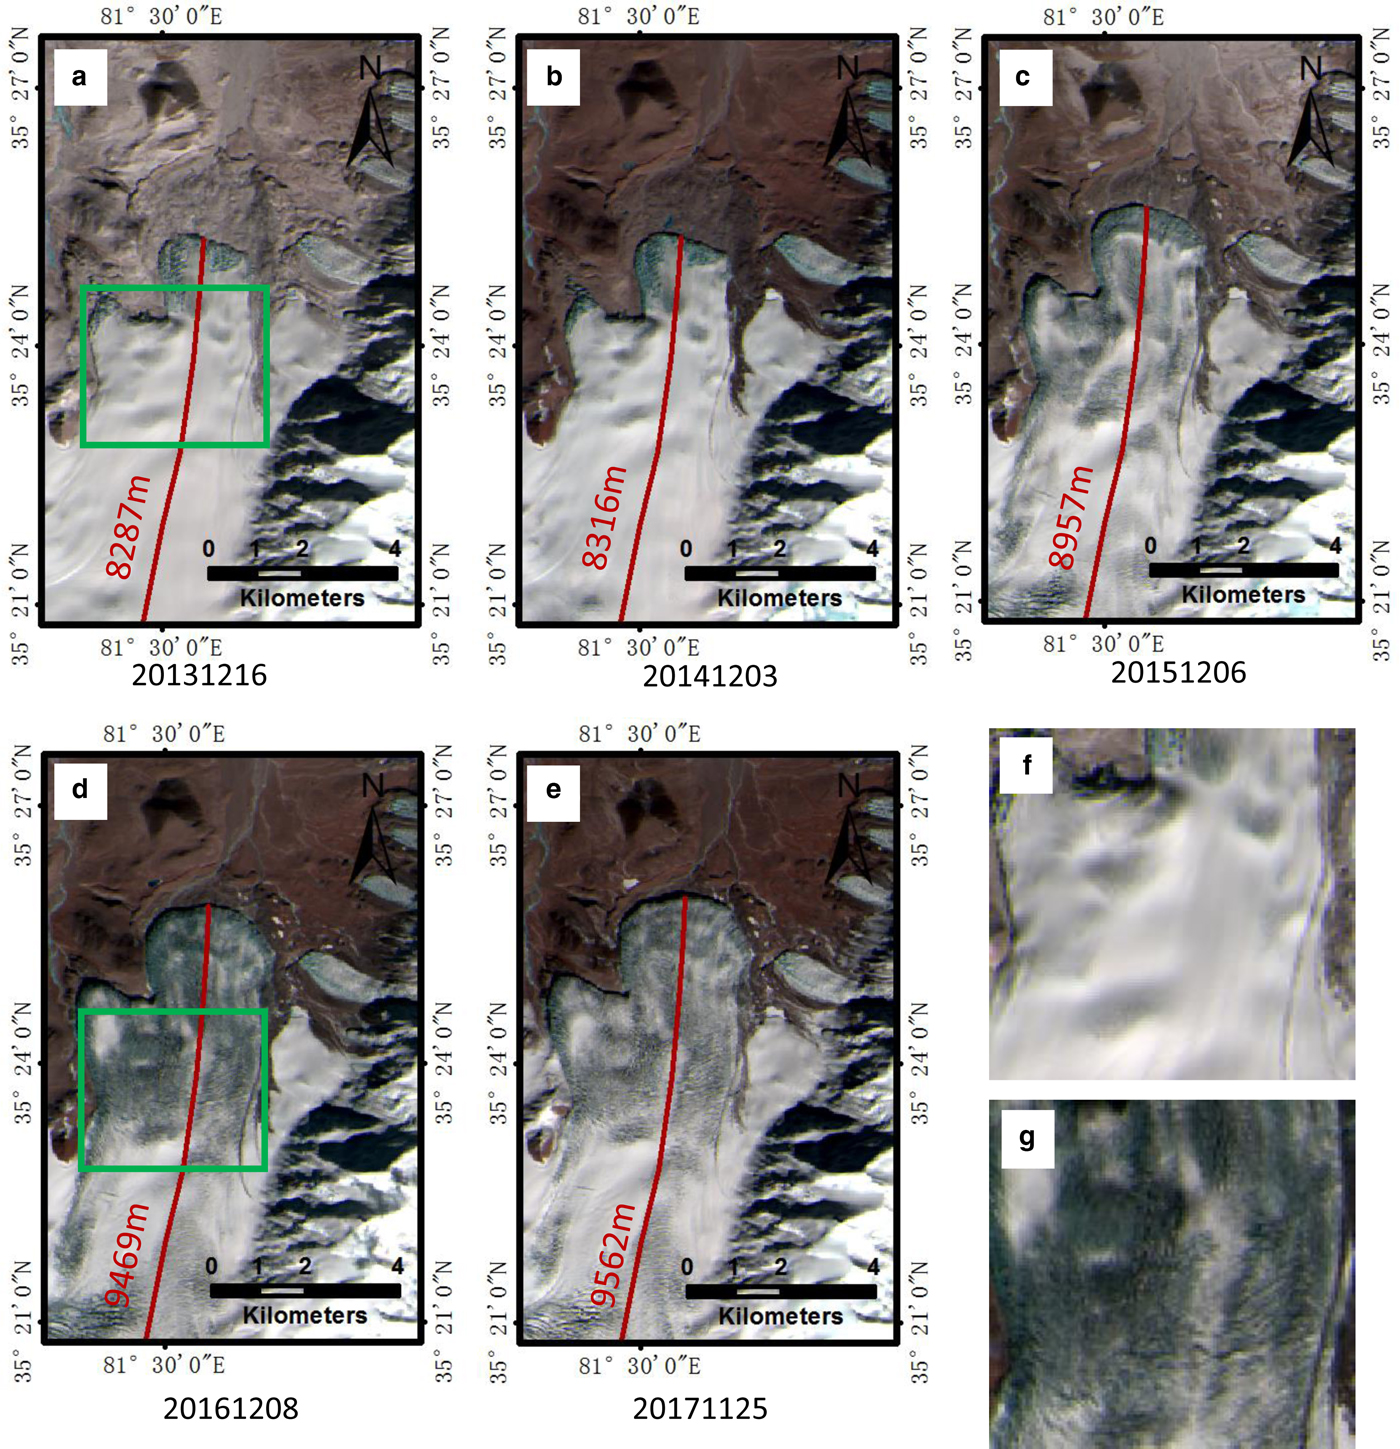
In WKS, the glaciers are almost free of debris and with clean ice (Scherler and others, Reference Scherler, Bookhagen and Strecker2011) which is also true for Alakesayi Glacier. In winter of 2013 and 2014, crevasses appeared only at the terminus of the Alakesayi Glacier, and most of the Alakesayi Glacier surface was still covered by snow and clean ice, which showed a white color in the images (Fig. 4a and b). From 3 December 2014 to 6 December 2015, as the velocity increased rapidly, the formerly smooth surface began to be broken by crevasses and fractures (Fig. 4b and c), and by 8 December 2016, the glacier surface was almost covered by such features as shown in Figure 4d. A detailed comparison of glacier surfaces between 16 December 2013 and 8 December 2016 can be seen in Figure 4f and g. The relative absence of fresh crevasses on the glacier surface on 25 November 2017 (Fig. 4e) implied that the rate of glacier flow was much reduced, which can also be confirmed from the velocity data during this period.
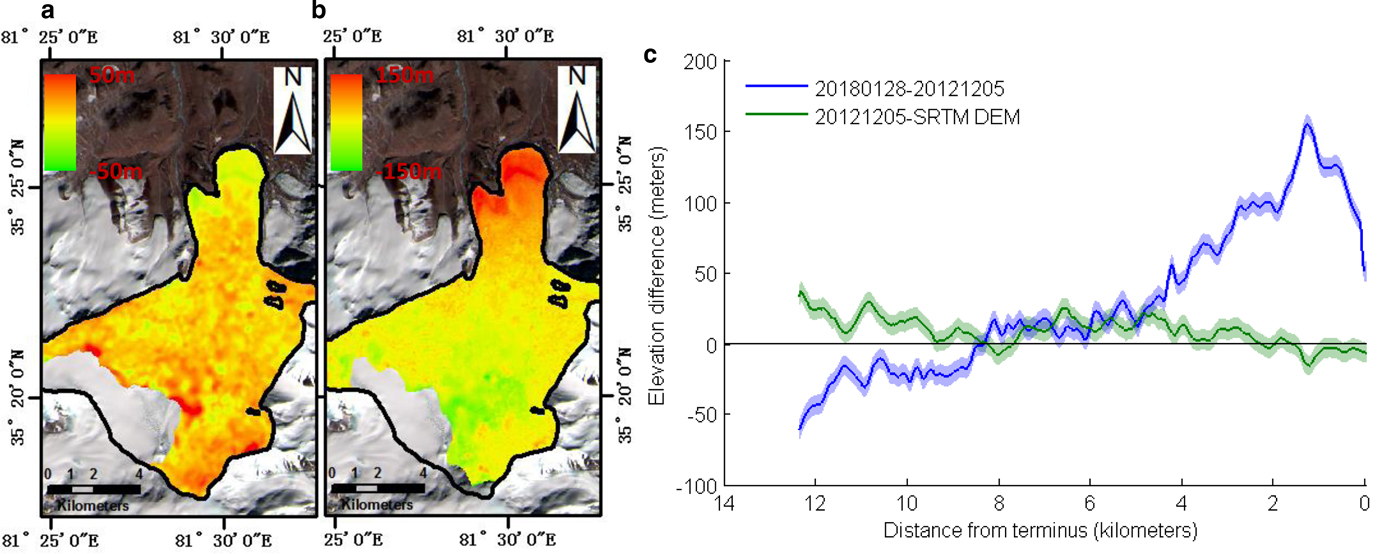
The DEM differencing results are shown in Figure 5a and b, respectively. The center line profiles extracted from the two DEM differencing results are shown in Figure 5c. The profile of DEM difference between the SRTM DEM and the DEM of 5 December 2012 shows that there was a slight increase in glacier surface elevation, which is consistent with previous study of mass balance in West Kunlun Shan (Lin and others, Reference Lin, Li, Cuo, Hooper and Ye2017). The profile of DEM difference between 5 December 2012 and 28 January 2018 indicates that the surface elevation at 0–4 km from the terminus had increased, with a maximum increase exceeding 150 m, while the surface elevation at the upper part of the glacier had decreased in the region up-glacier of the 8 km mark from the terminus.
DEM differencing results of Alakesayi Glacier. (a) DEM differencing results of 5 December 2012 and SRTM DEM. (b) DEM differencing results for 28 January 2018 and 5 December 2012. (c) Center line profiles extracted from two DEM differencing results; the light color shadings represent the errors in DEM differencing results. Note that the scale of the color bar is different between (a) and (b).
4. DISCUSSION AND CONCLUSION
In this letter, remote-sensing data were utilized to characterize the surge behaviors of Alakesayi Glacier from 2013 to 2018. Glacier surface velocities at different stages were estimated by the image correlation algorithm, and changes in glacier surface elevation were extracted by the DEM differencing method; terminus and surface morphological features were also measured and interpreted visually from remote-sensing images. Although the exact timing of the initiation and termination of the surge remains uncertain, our results show that the surge lasted at least 4 years from 11 September 2013 to 28 January 2018. During 3 December 2014 to 8 December 2016, the ice flowed at a velocity of order of magnitude greater than that of 2006–09 (Yasuda and Furuya, Reference Yasuda and Furuya2013; Yan and others, Reference Yan, Liu, Wang, Perski and Ruan2015); the terminus advanced 1153 m, and crevasses and fractures formed by dramatic fluctuations in glacier velocity were clearly visible on the glacier surface. The rapid flow of ice, the advance of the terminus and the rapid formation of morphological features suggested that active phase spanned ~2 years from 3 December 2014 to 8 December 2016. From the maximum flow velocity of ~ 4.5 m d−1 and recurrence interval of several decades it is not clear whether the surges of Alakesayi Glacier are of Svalbard-type with thermal regulation (Murray and others, Reference Murray, Strozzi, Luckman, Jiskoot and Christakos2003), as is suggested for other surge-type glaciers in this region (Yasuda and Furuya, Reference Yasuda and Furuya2015). The active phase of ~2 years is shorter than the surge phase duration of more than 5 years in other surge-type glaciers in the region. Moreover, no obvious seasonal modulation in surface velocities was observed in Alakesayi Glacier, which may partly be due to the shorter active phase of 2 years and relatively low temporal velocity observations. The DEM differencing results show a thickening of the receiving zone up to ~150 m, and a thinning of the upstream reservoir zone. These surge behaviors revealed by remote-sensing data provide useful insight into the Alakesayi Glacier surge dynamics and will be of interest for the research of glacier mass balance in this area.
ACKNOWLEDGMENTS
This work was supported in part by the National Key Research and Development Program of China (grant numbers 2016YFB0501501, and 2016YFA0600304), the National Natural Science Foundation of China (grant numbers 41471066 and 41471065), and the International Partnership Program of Chinese Academy of Sciences (grant number 131C11KYSB20160061). We greatly appreciate the Editor and the anonymous reviewers for their constructive and valuable comments.


 Open access