

1. Introduction
Prior to the discovery of antimicrobial peptides (AMPs), most research efforts on membrane-active agents focused on elucidating discrete ion channel conductance observed in black lipid membrane (BLM) experiments. Initially, the interest on membrane-active compounds was due to their ability to create single channel electric excitability in a BLM. Such compounds were called excitability-inducing materials (EIMs) (Latorre & Alvarez, Reference Latorre and Alvarez1981; Mueller & Rudin, Reference Mueller and Rudin1968). Most of EIMs were isolated from cultures of microorganisms and many of them were antibiotics. At the time there was a great deal of interest in excitable membranes but no channel structure had yet been isolated or characterized biochemically. Investigators were looking for molecular mechanisms of channel opening and closing that could shed light on similar processes in excitable cell membranes. Because of the low background conductance of a BLM (typically 10 pS for 1 mm2 of membrane), it is possible to measure channel conductance in the order of 1 pS induced by EIMs.
Discrete single channel electrical conductance, displayed by a series of randomly fluctuating open and closed states, was typically observed in a BLM exposed to an EIM concentration in the nanomolar range (Latorre & Alvarez, Reference Latorre and Alvarez1981). These channel activities were explained by a barrel-stave model, namely a pore in the membrane composed of a bundle of EIM molecules inserted in the membrane (Baumann & Mueller, Reference Baumann and Mueller1974; Latorre & Alvarez, Reference Latorre and Alvarez1981). This was particularly successful for alamethicin, whose crystal structure was determined by X-ray diffraction (Fox & Richards, Reference Fox and Richards1982). The barrel-stave model could indeed account for the details of single channel kinetic behavior induced by alamethicin (Mak & Webb, Reference Mak and Webb1995). However, alamethicin turned out to be a rather special case.
Host-defense AMPs from animals were first discovered in insects in the early 1980s, and subsequently found in almost every organism (Boman & Hultmark, Reference Boman and Hultmark1987; Boman et al. Reference Boman, Marsh and Goode1994; Steiner et al. Reference Steiner, Andreu and Merrifield1988; Wade et al. Reference Wade, Boman, Wahlin, Drain, Andreu, Boman and Merrifield1990; Zasloff, Reference Zasloff1987). Initially the discoverers and pioneers of the field wrestled with the questions about the molecular targets of these antibiotics (Boman & Hultmark, Reference Boman and Hultmark1987; Boman et al. Reference Boman, Marsh and Goode1994; Steiner et al. Reference Steiner, Andreu and Merrifield1988; Wade et al. Reference Wade, Boman, Wahlin, Drain, Andreu, Boman and Merrifield1990; Zasloff, Reference Zasloff1987). By the late 1980s, accumulated evidence, especially the experimental result showing that the natural all-L peptides and their D enantiomers were equally active (Wade et al. Reference Wade, Boman, Wahlin, Drain, Andreu, Boman and Merrifield1990), convincingly concluded that the main targets of AMPs were the bacterial cytoplasmic membranes, rather than stereospecific molecular receptors (Boman et al. Reference Boman, Marsh and Goode1994). Yet, experiments designed to investigate potential discrete ion channel conductance from AMPs led to atypical results; most natural AMPs are much more electrically charged than the exceptional case of alamethicin, and their resulting ion conductivities were unlike that of alamethicin (Christensen et al. Reference Christensen, Fink, Merrifield and mauzerall1988). Since then a major question on the AMPs concerns the details of their molecular mechanisms acting on the bacterial cytoplasmic membranes. While studies with live bacteria have been carried out (Barns & Weisshaar, Reference Barns and Weisshaar2013; Fantner et al. Reference Fantner, Barbero, Gray and Belcher2010; Rangarajan et al. Reference Rangarajan, Bakshi and Weisshaar2013; Sochacki et al. Reference Sochacki, Barns, Bucki and Weisshaar2011; Steiner et al. Reference Steiner, Andreu and Merrifield1988), they are complicated by both the presence of outer membranes and the fact that the action of antimicrobials could induce secondary effects including activation of autodigestive enzymes resulting in cell membrane lysis (Bierbaum & Sahl, Reference Bierbaum and Sahl1987; Elsbach & Weiss, Reference Elsbach and Weiss1993). Thus how AMPs actually kill microbes is more or less an open question (Zasloff, Reference Zasloff2002), although permeabilization of membranes should be sufficient to kill a cell.
A second major reason for believing that AMPs target the membranes rather than specific molecular receptors is that the effects of AMPs on lipid vesicles were strongly correlated with their effects on bacteria (Steiner et al. Reference Steiner, Andreu and Merrifield1988). Since the 1980s it was believed that the primary action of AMPs is compromising the permeability of bacterial membranes (Merrifield et al. Reference Merrifield, Merrifield, Juvvadi, Andreu, Boman, Boman, Marsh and Goodel1994b). Thus biophysical studies on AMPs have been performed primarily with model membranes or lipid bilayers. Essentially this is a particular form of material research, i.e. studying the material property of lipid bilayers in the presence of antimicrobials. Not surprisingly, almost all the known spectroscopies and techniques in material research have been applied to these studies. However there is no standard way of relating the material properties to the mechanism of an antimicrobial and no single measurement is able to fully characterize the interaction of AMPs with membranes. As such, there have been many different interpretations based on as many different measurements. Additionally, the lack of correlations between several different types of experiments results in often incomplete descriptions of a mechanism. A common clause in the literature of AMPs is ‘but the mechanism is still unknown.’ Yet there is no consensus as to what constitutes a mechanism. This is perhaps the most confusing issue in the field.
Another cause of confusion is due to the strong concentration dependence of AMP behavior in membranes. Phenomenologically, in the range of nanomolar concentrations, AMPs induce transient events of ion conduction in a membrane, but no leakage of glucose or larger molecules (Christensen et al. Reference Christensen, Fink, Merrifield and mauzerall1988; Duclohier et al. Reference Duclohier, Molle and Spach1989; Merrifield et al. Reference Merrifield, Merrifield, Juvvadi, Andreu, Boman, Boman, Marsh and Goode1994a). With the exception of alamethicin (Gordon & Haydon, Reference Gordon and Haydon1972; Mak & Webb, Reference Mak and Webb1995), AMPs produced irregular transient ion conductance that yielded little information about the molecular actions (Boman et al. Reference Boman, Marsh and Goode1994; Christensen et al. Reference Christensen, Fink, Merrifield and mauzerall1988). At concentrations higher than 100 micromolar, these molecules act as surfactants or detergents that disintegrate lipid bilayers (Nomura et al. Reference Nomura, Nagata, Inaba, Hiramatsu, Hotani and Takiguchi2001; Urbaneja et al. Reference Urbaneja, Goni and Alonso1988). The biological activities of AMPs are typically measured in the micromolar range. Indeed, the measured minimal inhibitory concentrations (MICs) are all in this range (Boman et al. Reference Boman, Marsh and Goode1994). Therefore the appropriate range of solution concentration for the study of antimicrobial mechanisms must be in micromolar range.
We believe that a common view follows the structure–function relationship doctrine regarding AMPs as membrane pore-formers. In this spirit, one emphasizes the local peptide–lipid interactions as the mechanism. However, we have taken a different view. While the local peptide–lipid interactions partially explain the resulting peptide-lipid structures, it is the collective peptide–lipid interactions over the whole membrane domain that transform the membrane structure; there are global effects on the membrane domain induced by AMPs that play key roles in the formation of pores and the resulting molecular leakage.
Conventional antibiotics are known to target specific protein receptors in bacteria, interrupting metabolic reactions and cell growth. In contrast to such microbistatic effects, the gene-encoded self-defense AMPs do not have specific protein targets. Instead, they permeabilize the lipid matrix of cell membranes and kill cells (Boman et al. Reference Boman, Marsh and Goode1994). Well-known examples of these microbicidal peptides are cecropins from insects, magainins from amphibians, and defensins from mammals etc. Their mechanisms of permeabilizing the bacterial membranes have been controversial, since molecular events in the target membrane are often difficult to discern due to timescale and spatial resolution limits. Nevertheless, in view of the alarming rise of bacterial resistance to the conventional antibiotics, there are strong incentives to bring non-conventional antimicrobial agents into clinical use. This calls for a deeper understanding of the membrane-acting mechanisms. A well understood membrane permeabilization mechanism is also potentially utilizable for drug and gene delivery.
Our research on membrane-active peptides started with two unique channel formers, gramicidin (Huang, Reference Huang1986; Olah et al. Reference Olah, Huang, Liu and Wu1991) and alamethicin (Huang & Wu, Reference Huang and Wu1991; Wu et al. Reference Wu, Huang and Olah1990), using X-ray diffraction and oriented circular dichroism. Once we started our research on antimicrobial peptides magainin (Ludtke et al. Reference Ludtke, He, Wu and Huang1994, Reference Ludtke, He and Huang1995, Reference Ludtke, He, Heller, Harroun, Yang and Huang1996), protegrin (Heller et al. Reference Heller, Waring, Lehrer and Huang1998, Reference Heller, Waring, Lehrer, Harroun, Weiss, Yang and Huang2000) and others, we were struck by the similarity exhibited by different AMPs from diverse sources in their interactions with membranes. Pore formation in membranes seems to be a natural consequence of the cationic/amphipathic molecular structures of AMPs, as evidenced by X-ray and neutron diffraction experiments; commonly studied peptides such as melittin, LL37, and alamethicin all exhibited characteristic pore-forming behaviors in lipid membranes. However this view was overturned by the experimental results of penetratin. Despite having a cationic/amphipathic molecular structure similar to magainin, LL37, and melittin, penetratin does not induce membrane pores. Furthermore, the FDA-approved antibiotics daptomycin, a cyclic lipopeptide, and anti-fungal amphotericin B, a polyene macrolide, both kill target cells by membrane permeabilization to atomic ions, but they do not form pores for leakage of molecules. The mechanisms of daptomycin and amphotericin B remain unknown despite years of clinical usage, research, and demonstrated membrane affinity. This review will primarily focus on the techniques and results of AMP research with the bigger picture of membrane-active molecules in mind. While the characteristics of AMP-membrane systems may not be representative of all membrane-active peptides and macrolides, we believe there is a distinct benefit in approaching the study of these other agents in the same soft matter systemic fashion.
Over two decades, we have developed various methods for extracting structural information from peptide-lipid systems. All data and conceptual ideas that will be mentioned here have been published, but they have not been discussed together from a coherent view. The review starts with a recent close comparison between Escherichia coli spheroplast membranes and lipid membranes that suggested no major differences in their reactions to AMPs. We believe that this result justifies the use of lipid membranes for the studies of AMP molecular mechanisms. To mimic the attack of AMPs on bacteria we observed a giant unilamellar vesicle (GUV) in a solution containing AMPs. We then correlate the phenomena observed in GUVs to nano-scale structural data obtained from peptide-lipid mixtures prepared in multilamellar forms. Phenomenologically, the complete mechanism of AMPs appears to involve an evolution of the peptide-membrane system through different structural states. We discuss the thermodynamic basis for such structural transformations, which we believe give further motivation for studying membrane-active antimicrobials in this fashion.
Finally, a supplemental information provides comments on sample preparation and experimental procedures for the studies that have been done in support of this paper. We feel that it is important to reiterate and demonstrate the importance of sample preparation and quality, as well as some not commonly discussed aspects of these commonly used methods. We focus primarily on the techniques related to multilayer samples, as structure/state determination of a soft matter peptide-membrane system is susceptible to several subtle but important pitfalls.
2. Comparison of the action of AMPs on E. coli spheroplasts and lipid bilayers
The collective review of our AMP research begins by inspecting the interaction of AMPs with bacteria. The action of dye-labeled AMPs on live bacteria has been observed with fluorescence microscopy, showing permeabilization of the cytoplasmic membranes, allowing the AMPs to enter the cell (Barns & Weisshaar, Reference Barns and Weisshaar2013; Fantner et al. Reference Fantner, Barbero, Gray and Belcher2010; Pogliano et al. Reference Pogliano, Pogliano and Silverman2012; Rangarajan et al. Reference Rangarajan, Bakshi and Weisshaar2013; Sochacki et al. Reference Sochacki, Barns, Bucki and Weisshaar2011; Steiner et al. Reference Steiner, Andreu and Merrifield1988). But the permeabilization was neither characterized nor quantified.
Our approach is to compare the actions of AMPs in bacterial and lipid membranes as closely as possible, to detect the similarities and dissimilarities between the two types of membranes. We can then decide if it is meaningful to use the model membranes to reproduce the action on bacterial membranes. To focus on the interactions of AMPs with bacterial membranes, we used E. coli spheroplasts, the cells from which the outer membranes have been removed. The spheroplasts can be stabilized in a STOP solution (Sun et al. Reference Sun, Sun and Huang2014) in which they exhibit no cell division, but they can revert to the normal form of E. coli when returned to a growth medium (Ruthe & Adler, Reference Ruthe and Adler1985). Before we studied the effect of AMPs, we investigated the physical properties of the spheroplast membranes by the micropipette aspiration method (Sun et al. Reference Sun, Sun and Huang2014). We found that the properties of the bacterial cell membranes are best described as lipid bilayers with membrane reservoirs, such as membrane folds (Sun et al. Reference Sun, Sun and Huang2014). The spheroplast membranes are without a surface tension, unless the spheroplast is swollen to its limit (Sun et al. Reference Sun, Sun and Huang2014). Nonetheless, if a spheroplast is subject to an aspiration pressure, a surface tension will develop reversibly with the applied suction pressure (Sun et al. Reference Sun, Sun and Huang2014). This tension arises from unfolding and refolding of the membrane reservoir, rather than stretching the lipid bilayer; the apparent area-stretching elastic constant is of order of magnitude smaller than that of stretching a lipid bilayer.
To study the effect of AMPs, spheroplasts were kept in a solution containing dye molecule calcien and LL37, melittin, or alamethicin. The results are shown in Fig. 1 (Faust et al. Reference Faust, Yang and Huang2017; Sun et al. Reference Sun, Sun and Huang2016). Under a well-defined condition, the response seen in Fig. 1 is highly reproducible. No calcein leakage into the spheroplast was observed during the initial 5 min control period before the introduction of AMPs. After melittin was added, no leakage was observed for approximately 15 min. Calcein then leaked into the spheroplast and the intracellular fluorescence intensity sigmoidally rose to a steady-state level. The steady-state level of intracellular fluorescence intensity was always less (~0·8 times) than the extracellular intensity level (Sun et al. Reference Sun, Sun and Huang2016). This rise to steady state was captured using a 60 s interval between image acquisitions, which amounted to very little photobleaching. The interval between acquisitions was then shortened to 5 s and an exponential decay of the intracellular intensity was observed – we call this a photobleaching period. After the photobleaching period, the image acquisition interval was increased back to 60 s and the intracellular fluorescence intensity recovered to the previous steady state. The 5 s photobleaching was repeated at least once during each experiment to make sure that the steady-state levels and exponential decays were internally consistent. When the intracellular fluorescence intensity reached a steady state, the influx and outflux are constant. We employed a method of balancing the transmembrane fluxes with photobleaching (Faust et al. Reference Faust, Yang and Huang2017; Sun et al. Reference Sun, Sun and Huang2016) to monitor the instantaneous membrane permeability to a dye molecule, defined by the flux rate j c (see online S.2 Method 6.2).
Membrane permeability induced by melittin in E. coli spheroplasts and GUV. A confocal time series of an immobilized E. coli spheroplasts (left) and a GUV (right) in a perfusion chamber were collected. Solution containing calcein, but no melittin was perfused from 0 to 5 min. followed by perfusion of calcein with 1 µM melittin from 5 to 10 min (shaded pink region, left). Normalized extracellular (open circles) and intracellular (filled circles) calcein fluorescence intensities are shown. The interval between scans was 60 s, until the photobleaching periods where the interval was 5 s. The upper, pink, dashed line (left) is the steady-state level of intracellular fluorescence intensity with negligible photobleaching when the scan interval was 60 s. The lower, pink, dashed line is the steady-state level of intracellular fluorescence intensity during photobleaching when the scan interval was 5 s. This reproducible fluorescence intensity pattern is remarkably similar in spheroplasts and in GUVs (right). Furthermore, the steady-state membrane permeability values measured in spheroplasts and GUVs are the same (Faust et al. Reference Faust, Yang and Huang2017).

We then performed the same experiment with GUVs (Fig. 1). Given the differences between spheroplast membranes and model lipid bilayers in their mechanical properties as measured by aspiration experiments (Sun et al. Reference Sun, Sun and Huang2014), one might expect different responses to the attack of AMPs. Surprisingly, what occurred in GUVs is very similar to what occurred in spheroplasts (Fig. 1). Firstly, AMPs induced an intra-vesicular fluorescence intensity pattern very similar to that induced in spheroplasts. Secondly, the steady-state permeabilities per unit area induced in spheroplasts and GUVs are in good agreement despite the size variations (Faust et al. Reference Faust, Yang and Huang2017).
We then compared the action of AMPs with metabolic inhibitor carbonyl cyanide m-chlorophenylhydrazone (CCCP), and daptomycin, which causes cell death by inducing membrane permeability to atomic ions. The patterns of leakage induced by CCCP or daptomycin are irregular, very different from the action by AMPs.
We concluded that there are understandable differences between spheroplasts and GUVs, chiefly due to the membrane tension often present in GUVs whereas the spheroplasts maintain a tensionless condition. But the comparisons strongly support the validity of model membranes studies with AMPs. Although there are some aspects of spheroplast experiment that are probably difficult to reproduce by GUVs, ultimately it is clear that experiments with live cells are more limited than those with lipid bilayers. Thus, we rely on model membrane studies to understand the molecular interactions.
3. Mechanistic studies in lipid membranes
We use a GUV to mimic the attack of AMPs on bacteria. We then correlate the GUV experiment to high resolution measurements performed in multilamellar lipid bilayers. In the following experiments we use melittin as an example of AMPs. The same experiments have been performed with many other AMPs with similar results (see online Supplemental S2).
3.1 Interaction with a GUV
Many investigators have observed molecular leakage through GUVs membranes when AMPs were introduced into the solution (Fuertes et al. Reference Fuertes, Garcia-Saez, Esteban-Martin, Gimenez, Sanchez-Munoz, Schwille and Salgado2010; Lee et al. Reference Lee, Hung, Chen and Huang2008; Tamba & Yamazaki, Reference Tamba and Yamazaki2005). A crucial missing piece of information in such experiments is the bound peptide concentration on the membrane when the leakage occurs. So the question is how to correlate the leakage to a molecular mechanism? Our method is to measure the membrane area change during the GUV experiment. In all membrane-active peptide experiments we have performed, there was always a membrane area expansion as peptides bound to the membrane, as quantitatively measured by micropipette aspiration. What was unexpected was that when we repeated the experiment many times, we discovered a well-defined average fractional membrane area expansion coinciding with the occurrence of molecular leakage. Figure 2 shows an example of such measurements.
A run of the GUV experiment (see online Movie S1 in Supplemental). (Upper) Confocal images of an aspirated GUV, in green color to measure the binding of FITC-melittin on the GUV and in red color to measure the fluorescence intensity of TRsc (MW 625) inside the GUV. A GUV of DOPC/DOPG 7:3 composition encapsulating TRsc was introduced into a solution containing 2 µM FITC-melittin at time zero. Within ~400 s, photobleaching of the dyes was negligible. Scale bar = 20 µm. (The red line on the micropipette is an optical artifact.) (Lower) The fractional GUV area change ΔA/A (solid and empty diamonds, calculated from the protrusion length change ΔL p inside the micropipette, scale on the right ordinate) and relative fluorescence intensities in time (scale on the left ordinate): green squares for the FITC-melittin on the GUV surface; red circles for the dye TRsc inside the GUV. The strongest fluorescence intensity for each color is taken as 1. (Lee et al. Reference Lee, Sun, Hung and Huang2013).

In these experiments, which were repeated at least 10 times with different vesicles (Lee et al. Reference Lee, Sun, Hung and Huang2013), the value of the fractional membrane area increase ΔA/A when the leakage began was measured to be 3·42 ± 0·59%. Note that this numerical value is specific to the lipid composition of the GUV, DOPC/DOPG 7:3 and the peptide melittin (Lee et al. Reference Lee, Sun, Hung and Huang2013).
3.2 Peptide-lipid mixtures in oriented multilayers
One sample type that has produced high resolution structural information for peptide-membrane systems is oriented multilayers, i.e. a stack of parallel bilayers of peptide-lipid mixtures intercalated by water layers of controllable thickness. In such a sample, the majority of the bilayers are free of the influence of the supporting substrate, and the amount of the sample is not limited. However, it is important to be able to ascertain the sample's homogeneity and the uniformity of the multilayers’ alignment. The alignment is most conveniently measured by X-ray diffraction (see online S.2 Methods).
There are lyophilization procedures by which peptides, lipids and other components, such as ions, can be homogeneously mixed in a dry powder form, and then hydrated into oriented parallel bilayers. Alternatively, depending on the added components, one may use evaporative deposition of dissolved and mixed lipids and components on a substrate, though this often requires some trial and error (online S.1 Sample preparation). The degree of hydration for a multilayer sample is controllable by the ambient relative humidity (RH), which effectively changes the average thickness of water layers between bilayers. Multilamellar samples can be purposefully overhydrated [e.g. (Lee et al. Reference Lee, Sun, Qian and Huang2011)]. In overhydrated multilayers, bilayers exhibit thermal undulations similar to a free bilayer (Lee et al. Reference Lee, Sun, Qian and Huang2011; Safinya et al. Reference Safinya, Sirota, Roux and Smith1989; Wack & Webb, Reference Wack and Webb1989). At the condition equilibrated by ~100% RH, the thermal undulations of individual bilayers are dampened. In this condition, the physical state of the peptide-lipid mixture is close to a free membrane and can be precisely measured by diffraction and other methods.
To correlate with the GUV membrane immersed in a solution containing AMPs, we imagine that the state of membrane continuously changes with an increasing number of bound peptides. The same lipid composition used in the GUV experiment, i.e. DOPC/DOPG 7:3, was mixed with melittin in a series of peptide-to-lipid molar ratios, P/L, and prepared in the multilamellar form, in order to emulate the evolution of the GUV experiment at specific points in time from the initial exposure to the onset of leakage.
3.2.1 X-ray diffraction and oriented circular dichroism
X-ray lamellar diffraction serves two purposes. The first is to examine the quality of the multilayer sample. By rotating the plane of substrate against the incident X-ray beam (which produces the rocking curve), one examines the alignment of the multiple layers. By measuring the multilayer repeat distance D versus RH, one can determine if the sample is close to the full hydration (Weiss et al. Reference Weiss, Van Der Wel, Killian, Koeppe and Huang2003). Without this crucial examination of sample quality, the subsequent measurement from the sample could produce very misleading results. For instance, if the multilayers are not well aligned, the peptide orientation will not be uniform and any subsequent peptide orientation measurement will be averaged out through the sample. Specifically oriented circular dichroism measurements rely on the uniform layer alignment throughout the sample.
The second purpose of X-ray diffraction is to reconstruct the electron density profiles of the bilayers. From the precisely measured phosphate-to-phosphate distance, PtP, across the bilayer (Fig. 3), we obtained the thickness of the hydrocarbon region h (online S2. Methods). In the case of melittin in DOPC/PG 7:3, the membrane thickness initially decreased linearly with the peptide-to-lipid molar ratio P/L, but above a critical value P/L* ~ 1/45, the membrane thickness leveled off. The fractional membrane thinning was
 $ - \Delta h/h = 3.3 \pm 0.2\% $
at P/L = P/L*.
$ - \Delta h/h = 3.3 \pm 0.2\% $
at P/L = P/L*.
Melittin and lipid (DOPC/PG 7:3) mixtures in a series of molar ratio P/L, in fully hydrated multilayers. (a) The membrane thickness, PtP, as a function of P/L measured by X-ray lamellar diffraction. PtP linearly decreases with P/L until P/L* ~ 1/45. (b) The same samples were measured by the method of OCD to determine the fraction of melittin helices oriented normal to the plane of bilayers (the remaining fraction were parallel to the plane). The fraction is linear when plotted against 1/(P/L) (Lee et al. Reference Lee, Chen and Huang2004) for P/L above a transition point P/L* ~ 1/45. The error bars are that of reproducibility using two to three independently prepared samples (Lee et al. Reference Lee, Sun, Hung and Huang2013).

The same samples were also measured by oriented circular dichroism (OCD) (Wu et al. Reference Wu, Huang and Olah1990; Yang et al. Reference Yang, Harroun, Weiss, Ding and Huang2001) to characterize the orientation of melittin helices in membranes (Fig. 3). All melittin helices were found to lie parallel to the plane of membrane in the region the thickness decreased linearly with P/L; but above the critical P/L* ~ 1/45 an increasing fraction of melittin helices changed orientation to perpendicular to the membrane (Fig. 3). This correlation between the membrane thinning and the peptide orientation change has been observed for melittin and other antimicrobial peptides in many different lipid compositions (Huang, Reference Huang2000; Lee et al. Reference Lee, Chen and Huang2004, Reference Lee, Hung, Chen and Huang2005). Only the value of P/L* and the degree of thinning varied with peptide and lipid composition.
Both X-ray lamellar diffraction and OCD provide valuable information about the state of peptides in the membrane, as well as their important effects on the bulk of the multilayer system. By investigating the multilayer samples in varying peptide to lipid ratios, the evolution of the entire soft matter system can be investigated. Furthermore, the orientation states of peptides in the multilayer may be directly correlated with hydrocarbon thickness modulations, suggesting that physical changes in the peptides results in a global effect on the sample. This is precisely why we believe that a full understanding of AMP mechanisms originates from considering the global state changes of a soft matter peptide-membrane system.
3.2.2 Neutron in-plane scattering
The GUV experiments show that molecular leakage occurs at a certain peptide-to-lipid ratio. On the other hand, X-ray lamellar diffraction and OCD show that a critical peptide concentration marks a global transition of the peptide-membrane system, i.e. a structural and peptide orientation changes occur at the peptide-to-lipid ratio P/L* in multilamellars. These two observations suggest that leakage is correlated with a specific global structural transition. One explanation for structurally induced molecular leakage is the formation of pores. If pores are present in the bilayers, there is an easy way to detect them by neutron in-plane scattering off oriented multiple bilayers (He et al. Reference He, Ludtke, Huang and Worcester1995, Reference He, Ludtke, Worcester and Huang1996; Ludtke et al. Reference Ludtke, He, Heller, Harroun, Yang and Huang1996). The water through the pores can be replaced with D2O, simply by replacing the hydrating H2O vapor with D2O vapor. Viewed along the plane of the bilayer, the D2O columns through the pores will stand out in high contrast against the lipid background for neutron scattering, due to the very high deuterium–neutron scattering length (Fig. 4).
Neutron in-plane scattering of LL37 in DOPC at P/L = 1/50 in three conditions: red–equilibrated at 100%RH D2O; blue–equilibrated with excessive D2O in an overhydrated state; green – equilibrated with excessive H2O in an overhydrated state. Inset: Reduced data obtained from the blue curve after removing the background (the empty sample cell). The shoulder peak was fit with a Gaussian curve (orange) at 0·085 Å−1 corresponding to a D spacing of 74 Å in the overhydrated state. The broad peak at 0·041 Å−1 is due to the presence of D2O columns in the membrane, implying the presence of transmembrane pores. The sample was a LL37/lipid mixture prepared in a multilamellar form. We found that LL37 oriented parallel to the bilayers in all hydrations up to 100% RH (perhaps due to its length). Only in the overhydrated condition (i.e. with thick water layers), LL37 turned into the perpendicular orientation (Lee et al. Reference Lee, Sun, Qian and Huang2011).

We have tested at least five different peptides in various compositions of lipids (online Supplemental S2). We found that pores were present when P/L was above P/L* but not when it was below (He et al. Reference He, Ludtke, Huang and Worcester1995; Lee et al. Reference Lee, Sun, Qian and Huang2011; Ludtke et al. Reference Ludtke, He, Heller, Harroun, Yang and Huang1996; Yang et al. Reference Yang, Harroun, Heller, Weiss and Huang1998, Reference Yang, Harroun, Weiss, Ding and Huang2001). Neutron results show that the density and size of pores in multilayers are constant in time. A GUV with stable pores can last for an hour or longer, apparently in an equilibrium state (Last & Miranker, Reference Last and Miranker2013; Lee et al. Reference Lee, Hung, Chen and Huang2008). Therefore, we conclude that pores formed by peptides in ratios above P/L* are stable membrane structures.
The density of the pores in the membrane and the fraction of melittin oriented normal to the plane of bilayers (as measured by OCD) suggested that there are 4–7 melittin helices in the luminal surface of a fully hydrated pore (Ludtke et al. Reference Ludtke, He, Heller, Harroun, Yang and Huang1996; Yang et al. Reference Yang, Harroun, Weiss, Ding and Huang2001). The molecular cross section of a melittin helix along its axis has been measured to be 4·00 nm2 (DeGrado et al. Reference Degrado, Kezdy and Kaiser1981; Terwilliger et al. Reference Terwilliger, Weissman and Eisenberg1982). The total area contributed by a maximum of 7 melittin helices to the luminal surface is ~28 nm2 (Yang et al. Reference Yang, Harroun, Weiss, Ding and Huang2001) out of a total area of
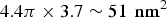 $4.4\pi \times 3.7 \sim 51\; \,{\rm nm}^2 $
(assuming a bilayer height 3·7 nm based on the PtP in Fig. 3). Thus 50% or more of the luminal surface is lined by the lipid headgroups.
$4.4\pi \times 3.7 \sim 51\; \,{\rm nm}^2 $
(assuming a bilayer height 3·7 nm based on the PtP in Fig. 3). Thus 50% or more of the luminal surface is lined by the lipid headgroups.
3.3 Correlation of leakage in GUVs with pores detected in multilayers
By comparing the results of X-ray and OCD studies in multilamellar samples with the microscopy studies of GUVs, a close correlation can be found between the state of membrane in the GUV before dye leakage and the state of membrane in multilayers before pore formation. Again, we examine the representative case of melittin: In a GUV, the membrane area expansion is linearly proportional to the fluorescence intensity due to the binding of dye-labelled melittin (Fig. 2); in multilayers, the membrane thinning is linearly proportional to P/L (Fig. 3). The fractional membrane area expansion reached
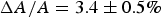 $\Delta A/A = 3.4 \pm 0.5\% $
when dye leakage began (Fig. 2); the fractional membrane thickness decrease was
$\Delta A/A = 3.4 \pm 0.5\% $
when dye leakage began (Fig. 2); the fractional membrane thickness decrease was
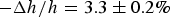 $ - \Delta h/h = 3.3 \pm 0.2\% $
when stable pores began to appear in the multilayers Fig. 3. This close correlation reasonably suggests that the state of membrane in the GUV and the state of membrane in the multilayers was the same before the formation of stable pores. Furthermore, noting that multilayer samples are prepared with peptides evenly distributed on both sides of lipid bilayers, it suggests that melittin monomers initially bound to the outer leaflet of GUV had redistributed to both sides of the membrane before the formation of stable pores in the GUV.
$ - \Delta h/h = 3.3 \pm 0.2\% $
when stable pores began to appear in the multilayers Fig. 3. This close correlation reasonably suggests that the state of membrane in the GUV and the state of membrane in the multilayers was the same before the formation of stable pores. Furthermore, noting that multilayer samples are prepared with peptides evenly distributed on both sides of lipid bilayers, it suggests that melittin monomers initially bound to the outer leaflet of GUV had redistributed to both sides of the membrane before the formation of stable pores in the GUV.
The equality of ΔA/A and − Δh/h comes from the volume conservation of the hydrocarbon region (area A times thickness h), assuming that melittin binding has insignificant penetration into the hydrocarbon region (Terwilliger et al. Reference Terwilliger, Weissman and Eisenberg1982). The samples studied by X-ray were also measured by OCD (Wu et al. Reference Wu, Huang and Olah1990; Yang et al. Reference Yang, Harroun, Weiss, Ding and Huang2001) for the orientation of melittin helices in membranes (Fig. 3). The results showed that the α-helical peptides bound parallel to the plane of the bilayer before the pore formation when P/L < P/L*. It is under this condition, the equality of ΔA/A and − Δh/h applies (A · h = constant. Δ(A · h) = 0 implys ΔA/A = −Δh/h). As the pores began to appear, a fraction of peptides also turned to the perpendicular orientation, and this fraction increased as P/L increased above P/L*. The equality of ΔA/A and − Δh/h is not applicable when P/L > P/L*.
3.4 The structure of AMP-induced pores
It is perhaps debatable based on the GUV experiment alone whether stable pores are formed by AMPs in membranes. There is no way of ascertaining the molecular structures or events responsible for membrane permeabilization using GUV experiments alone. These experiments may only indicate the presence of molecular leakage as well as ceratin bulk structural changes such as tension or area changes. More direct evidence is absolutely necessary to establish the existence of pores, let alone determining their structures. Fortunately, multilayer samples allow for the extraction of equilibrium structures that depend on peptide concentrations. The existence of pores was provided by neutron scattering in fully-hydrated multilayers of lipid-peptide mixtures (Ludtke et al. Reference Ludtke, He, Heller, Harroun, Yang and Huang1996; Yang et al. Reference Yang, Harroun, Weiss, Ding and Huang2001). The detected pores were in a two-dimensional fluid of lipid bilayer (Ludtke et al. Reference Ludtke, He, Heller, Harroun, Yang and Huang1996; Yang et al. Reference Yang, Harroun, Weiss, Ding and Huang2001). The radial distribution function deduced from the scattering curve had a narrow peak indicating a uniform pore size (Ludtke et al. Reference Ludtke, He, Heller, Harroun, Yang and Huang1996; Yang et al. Reference Yang, Weiss, Harroun, Heller and Huang1999, Reference Yang, Harroun, Weiss, Ding and Huang2001). The inner diameter of the melittin pore was found to be ~4·4 nm in either POPC (at P/L = 1/15) or DLPC (at P/L = 1/30) bilayers (Yang et al. Reference Yang, Harroun, Weiss, Ding and Huang2001). As discussed in Yang et al. (Reference Yang, Harroun, Weiss, Ding and Huang2001), these pores could not be formed by barrel-like assemblies of peptide helices (the so-called barrel stave model) (Baumann & Mueller, Reference Baumann and Mueller1974; Qian et al. Reference Qian, Wang, Yang and Huang2008a)) because the fraction of melittin helices measured to be oriented perpendicularly to the membrane was much less than what was required to line the inner circumferences of all the pores (in contrast, this was possible for alamethicin, which forms barrel-stave pores (He et al. Reference He, Ludtke, Worcester and Huang1996)). Therefore, it was argued that the pore must be at least partially lined by the lipid headgroups. This resulted in the development of the toroidal (or wormhole) pore concept (Ludtke et al. Reference Ludtke, He, Heller, Harroun, Yang and Huang1996). A defining topological difference exists between the barrel-stave and toroidal pores: in the former, the inner pore surface is completely lined with closely-packed peptides that punch directly through the length of the membrane such that the surface formed by the headgroups is discontinuous in the pore vicinity. In the latter, the partial lining of the inner pore surface results in a local bending of the lipids such that the surface formed by the headgroups is continuous through the inner surface of the pore. About the same time the same model was proposed by Matsuzaki et al. (Reference Matsuzaki, Murase, Fujii and Miyajima1996, Reference Matsuzaki, Yoneyama and Miyajima1997) based on their kinetic experiments.
Surprisingly it is possible to crystalize pores in multilayers (Yang et al. Reference Yang, Weiss and Huang2000). Upon dehydration, multilayers with pores as detected by neutron in-plane scattering transformed from the lamellar phase to a rhombohedral (R) phase (Fig. 5) (Lee et al. Reference Lee, Sun, Hung and Huang2013; Yang et al. Reference Yang, Weiss and Huang2000). In such a softmatter crystalline, the unit cell is composed of a liquid-like distribution of lipids and peptides. As a result, the diffraction is limited to small angles (Qian et al. Reference Qian, Wang, Yang and Huang2008a, Reference Qian, Wang, Yang and Huangb), even though the diffraction peaks are sharp (implying an excellent long-range order). To make use of such low-resolution diffraction, we simplified the detected component to highlight only the contour of the pore. This was accomplished by using a Br-labeled lipid, di18:0(9,10Br)PC, and developing a method of multiwavelength anomalous diffraction (MAD) to obtain the diffraction amplitudes for the Br atoms alone (online S2. Methods). (A note on the lipid di18:0(9,10Br)PC: melittin has been studied in a great variety of lipid compositions; the behavior of stable-pore formation is similar in all, including the phase transition from the lamellar phase to the R phase (Lee et al. Reference Lee, Chen and Huang2004, Reference Lee, Hung, Chen and Huang2005, Reference Lee, Hung, Chen and Huang2008; Yang et al. Reference Yang, Harroun, Weiss, Ding and Huang2001); there is nothing special about di18:0(9,10Br)PC). Figure 6 shows the distribution of Br atoms in a unit cell in which the top and bottom monolayers bend and merge through the pore, confirming the topological signature of the toroidal model (Lee et al. Reference Lee, Sun, Hung and Huang2013).
Grazing angle diffraction pattern of the R phase of a melittin-di18:0(9,10Br)PC mixture with P/L = 1/40 at 45% RH, 30 °C (Lee et al. Reference Lee, Sun, Hung and Huang2013).

X-ray contour of the melittin pore in the R phase of a melittin-di18:0(9,10Br)PC mixture (P/L = 1/40). To show the contour of the melittin pore clearly, we used the multiwavelength anomalous diffraction method to obtain the diffraction amplitudes for Br atoms alone. The solid lines define the unit cell of the R phase. The electron density is expressed in a relative scale by color. Br atoms are distributed in the high density (yellow-red-black) region. The non-uniformity in the low density region is due to the limited resolution of small angle diffraction. A cartoon for the lipid structure shows the basic topology: the silver layer represents the headgroup layer of the lipid bilayer, and the red layer represents the Br layer, which was detected by X-ray (Lee et al. Reference Lee, Sun, Hung and Huang2013).

The purpose of the crystal reconstruction is to provide the structural proof that the melittin pore is lined by the bilayer interface. In fully hydrated multilayers, neutron scattering determined the internal diameter of the melittin pores to be 4·4 nm (Yang et al. Reference Yang, Harroun, Weiss, Ding and Huang2001). Upon dehydration to the R phase, the inner diameter of the melittin pore was reduced to ~0·7 nm. The same results were found in pores induced by other AMP peptides (Qian et al. Reference Qian, Wang, Yang and Huang2008b). Reconstructions of barrel-stave pores formed by alamethicin can also be recovered in this fashion (Qian et al. Reference Qian, Wang, Yang and Huang2008a).
4. The free energy pathway
We now propose a conceptual framework for understanding the experimental observations described above. Before we do so, we note that most AMPs under consideration are ~20–40 amino acid long and they are most likely too small to have a single molecular function in a membrane. Also the molecular properties of AMPs are probably not designed to form multi-molecular complexes, since the majority of known AMPs are strongly cationic, e.g. 11 of 37 amino acids of LL37 are either lysine or arginine; strong electrical repulsion is not favorable for multi-peptide complexing or oligomerization. Alamethicin, an electrically-neutral amphipathic molecule, is an exception (Mak & Webb, Reference Mak and Webb1995). (We note that magainin can polymerize into filaments, but only at high ionic concentrations (Urrutia et al. Reference Urrutia, Cruciani, Barker and Kachar1989).)
4.1 Evolution of a lipid bilayer in a peptide solution
4.1.1 Initial binding of peptides
Motivated by experimental observations of peptides in lipid bilayer systems, a conceptual framework from basic physical principles can be developed. Let us imagine the process of melittin-based pore formation in a GUV as described in Section 3.1. Individual peptides spontaneously bind to the interface of the lipid bilayer due to their molecular amphiphilicity. Melittin has the conformation of a bent α-helical rod with a distinctive orientational segregation of hydrophobic and hydrophobic side chains.(Terwilliger et al. Reference Terwilliger, Weissman and Eisenberg1982). The hydrophobic side chains are oriented mainly towards the inside of the bend of the helix, and the charged and polar side chains are oriented mainly towards the outside of the bend. Thus melittin integrates into the surface of the lipid bilayers with the helical axis parallel to the bilayer (as shown by OCD) in which the hydrophobic inner surface penetrates shallowly in the non-polar portion of the membrane (Terwilliger et al. Reference Terwilliger, Weissman and Eisenberg1982).
The key feature of this interaction is that melittin occupies space in the headgroup region of the phospholipid molecules in the bilayer, but does not extend all the way to the center of the bilayer. In order that there may not be any empty space underneath the melittin molecule, the lipid chains must be distorted from a smooth planar bilayer to fill the space. By contrast, any protein of uniform cross section that naturally penetrates all the way across the bilayer or exactly half-way across the bilayer would not be expected to disturb the bilayer structure in the same manner as melittin. The presence of bound melittin peptides in the headgroup region also results in a membrane area increase, while the lipid chains distortion as described above results in a local thinning of the lipid bilayer.
It has been estimated that the free energy barrier for translocating a single melittin molecule across a lipid bilayer is about 30 k B T (Lee et al. Reference Lee, Sun, Hung and Huang2013; Moon & Fleming, Reference Moon and Fleming2011). Thus it is very unlikely for an individual peptide to translocate by itself from thermal fluctuations alone. However, we have seen that the initial membrane area expansion of the GUV by melittin binding was in agreement with the membrane thinning measured in the multilayers, implying that the melittin must be on both sides of the bilayer of the GUV before pore formation. Indeed it has been observed experimentally that bound peptides rapidly translocated from the outside leaflet to the inside leaflet of the bilayer (Matsuzaki et al. Reference Matsuzaki, Murase, Fujii and Miyajima1995).
Because thermal fluctuations of individual peptide cannot account for translocation, the most reasonable assumption for melittin translocation before the formation of stable pores is by way of transient pore fluctuations. It was known since the early days of its discovery that melittin (and other antimicrobial peptides) induces transient ion conduction at nanomolar peptide concentrations (Hanke et al. Reference Hanke, Methfessel, Wilmsen, Katz, Jung and Boheim1983; Merrifield et al. Reference Merrifield, Merrifield, Juvvadi, Andreu, Boman, Boman, Marsh and Goode1994a; Tosteson & Tosteson, Reference Tosteson and Tosteson1981). The ion conductivity increases with the peptide concentration all the way to the sub-micromolar range (Hanke et al. Reference Hanke, Methfessel, Wilmsen, Katz, Jung and Boheim1983; Tosteson & Tosteson, Reference Tosteson and Tosteson1981). We define the pores that induce atomic ion conduction but do not allow transmembrane passage of glucose or larger molecules as transient pores. The transient pores induced by melittin (or other AMPs) do not exhibit well-defined single-channel step-conductance, contrary to the exceptional case of alamethicin (Hanke et al. Reference Hanke, Methfessel, Wilmsen, Katz, Jung and Boheim1983; Merrifield et al. Reference Merrifield, Merrifield, Juvvadi, Andreu, Boman, Boman, Marsh and Goode1994a). The molecular configurations of transient pores are unknown and may very well be generally non-specific. Given how tightly melittin binds to the interface and the relatively low energy barrier for toroidal pore formation, the transient pore formation is likely due to the stress from one-sided binding that increases the area of the outer leaflet relative to the unperturbed inner leaflet (Terwilliger et al. Reference Terwilliger, Weissman and Eisenberg1982). Thus, transient pores can occur locally by fluctuations as evidenced by transient ion conductions at extremely low peptide concentrations.
Before molecular leakage occurs, the distribution of peptides throughout the bilayer appears to be uniform as measured carefully by fluorescence energy transfer experiments (FRET) (Gazit et al. Reference Gazit, Lee, Brey and Shai1994, Reference Gazit, Boman, Boman and Shai1995; Hirsh et al. Reference Hirsh, Hammer, Maloy, Blazyk and Schaefer1996; Schümann et al. Reference Schümann, Dathe, Wieprecht, Beyermann and Bienert1997). This finding is in agreement with a theoretical argument that the interfacial-bound peptides experience mutually repulsive membrane–mediated interactions (Huang, Reference Huang1995). The peptide binding incurs a positive energy of bilayer deformation, i.e. a local membrane thinning. According to the elasticity theory (Helfrich, Reference Helfrich1973), the energy of membrane deformation is proportional to the square of the amplitude of thinning. As a result of this square rule, the energy cost of bilayer deformation would increase if two far separated bound peptides approach each other. The repulsive force between two bound peptides extends over a separation distance of about 25 Å (Huang, Reference Huang1995). Therefore the peptides bound on the bilayer interface must be monomeric, in agreement with FRET experiment (Schümann et al. Reference Schümann, Dathe, Wieprecht, Beyermann and Bienert1997).
4.1.2 The transition to pore formation
In the region P/L ≳ 1/100, the membrane thinning by peptide binding is large enough to be measured by X-ray diffraction and the thinning is invariably in linear proportion to P/L, until P/L reaches a critical value P/L* whose value depends on the peptide as well as the lipid composition. For P/L > P/L*, the membrane thickness remains approximately constant despite increasing number of bound peptides. Coincidentally pores begin to appear in the bilayers as P/L exceeds P/L* as shown by leakage or neutron scattering. How can we understand this transition as a function of P/L? We believe that a complete quantitative theory is very complicated, but we can at least understand the key aspects of this transition at the qualitative level with some mathematical rigor. This will provide a conceptual framework for understanding the mechanism of AMPs.
Perhaps the simplest argument for the transition to a state of membrane with pores is as follows. Beginning with the initial exposure of the lipid bilayer to peptides, peptide binding continues as long as the binding energy is negative (relative to the peptides in solution). This binding causes membrane thinning but there must be some limit of thinning for a lipid bilayer. Therefore, after the bilayer thinning reaches a limit corresponding to the ratio P/L*, the bilayer forms pores to create additional binding surface on the walls of the pores.
This explanation, while plausible, leaves much to be desired and has no physical basis. Because the phenomena emergent from AMP interactions with lipid bilayers involves a phase transition of the entire system, statistical mechanics offers the appropriate tools for description. Specifically, we appeal to the Landau free energy expansion, a technique of statistical mechanics that offers a mathematical description of phase transitions. We start with the free energy that describes a pore in a lipid bilayer (Litster, Reference Litster1975; Taupin et al. Reference Taupin, Dvolaitzky and Sauterey1975):
 $$F_{\rm o} = 2\pi R\gamma - \pi R^2 \sigma $$
where R is the radius of a circular pore, σ is the membrane tension (which is the energy per unit area) and γ is the line tension (the energy cost for creating a unit length of pore edge). This free energy does not support a stable pore, because the free energy F o has an unstable maximum at R = γ/σ as a function of the radius R. This was demonstrated experimentally with a GUV (Brochard-Wyart et al. Reference Brochard-Wyart, De Gennes and Sander2000; Karatekin et al. Reference Karatekin, Sandre, Guitouni, Borghi, Puech and Brochard-Wyart2003; Puech et al. Reference Puech, Borghi, Karatekin and Brochard-Wyart2003), in which a pore could spontaneously open or be induced by perturbation. Its behavior was indeed governed by the Eq. (1). If the radius was smaller than R* = γ/σ, the pore closed; however, if the radius was larger than R* = γ/σ, the pore expanded indefinitely until the vesicle lysed, following the path of minimizing the free energy.
If, however, the membrane includes bound peptides, Eq. (1) needs to be modified, because the membrane energy per unit area, σ, is a function of the concentration of bound peptides, due to the membrane thinning effect. At the peptide lipid ratio P/L < P/L*, all peptides are bound on the interface of pore-free bilayer. The fractional change of the membrane area associated with peptide binding is ΔA/A = (A P /A L )(P/L), where A P is the area increment caused by one bound peptide and A L the area per lipid. This area expansion creates a stress equivalent to a membrane tension K a (ΔA/A), where K a is the membrane stretching elasticity coefficient. When P/L > P/L*, pore formation occurs and the peptides localized to the inner surface of the pores do not contribute to the membrane thinning. Therefore ΔA/A = (A P /A L )(P − P I )/L and the corresponding tension is σ = K a (A P /A L )(P − P I )/L. P I is the total number of peptides adsorbed to the inner surface of the toroidal pores, which is proportional to the radius of the pores: P I = αR, with a proportionality constant α.
Substituting this expression of σ into Eq. (1), we obtain a free energy for pore formation,
 $$F = 2\pi \gamma R - \pi \sigma _o R^2 + \alpha \pi K_a [A_P /(A_L L)]R^3 $$
where σ o = K a (A P /A L )P/L. This free energy can be viewed as a Landau free energy (Landau & Lifshitz, Reference Landau and Lifshitz1965) with an order parameter R in which the effect of decreasing temperature is replaced by the effect of increasing P/L (Fig. 7). There is a critical value P/L*, such that for P/L < P/L*, the stable state has R = 0, or no pores. But for P/L > P/L*, the minimum free energy state has a non-zero positive R, that results in the physical presence of pores (see details in Huang et al. (Reference Huang, Chen and Lee2004)). The free energy approach to describe the action of AMPs clearly highlights the need to consider an entire soft matter peptide-membrane system. It simultaneously motivates and physically explains the experimental investigations that we have carried out.
The schematic drawing of the free energy of pore formation induced by AMP (Eq. 2). The minimum of the free energy is at radius R = 0 for P/L < P/L*. But for P/L > P/L*, the minimum of the free energy is at a finite R, indicating a stable pore formation. The transition for the pore formation occurs at P/L = P/L* (Huang et al. Reference Huang, Chen and Lee2004).

Alternatively, the transition from a pore-free membrane to a membrane with pores can be studied by the equality of the chemical potentials of the peptides in two phases: the phase without pores and the phase with pores (Huang, Reference Huang2009). The essential feature of the chemical potential of peptides before pore formation is a term due to the membrane thinning effect. This term is positive, linearly increasing with P/L. On the other hand, the essential feature of the chemical potential of peptides bound to pores is an aggregation effect of multiple peptides in each pore. Specifically, let the number of peptides in each pore be n, and the fraction of the peptides in pores be X
n
and the fraction of the peptides bound on the planar interface be X
1. Then the chemical equilibrium demands that X
n
is proportional to
 $X_1^n $
.
$X_1^n $
.
In solution, the proportionality
 $X_n \propto X_{_1} ^n $
describes a micellization effect (Debye, Reference Debye1949) with a critical micellization concentration (CMC). That is, there are practically no micelles as long as the concentration X
1 is smaller than CMC. It is easy to show that, in solution, micellization is possible only if the number n is sufficiently large, at least 15 (Debye, Reference Debye1949; Huang, Reference Huang2009). But this is different in a membrane; pore formation in membrane can occur in a fashion similar to a micellization effect with n as small as 4, based on the chemical potential argument where the intrinsic reason is the membrane thinning effect as discussed above (Huang, Reference Huang2009). This agrees with the experimental observation that 4–7 melittin helices line the luminal surface of each toroidal pore (Ludtke et al. Reference Ludtke, He, Heller, Harroun, Yang and Huang1996).
$X_n \propto X_{_1} ^n $
describes a micellization effect (Debye, Reference Debye1949) with a critical micellization concentration (CMC). That is, there are practically no micelles as long as the concentration X
1 is smaller than CMC. It is easy to show that, in solution, micellization is possible only if the number n is sufficiently large, at least 15 (Debye, Reference Debye1949; Huang, Reference Huang2009). But this is different in a membrane; pore formation in membrane can occur in a fashion similar to a micellization effect with n as small as 4, based on the chemical potential argument where the intrinsic reason is the membrane thinning effect as discussed above (Huang, Reference Huang2009). This agrees with the experimental observation that 4–7 melittin helices line the luminal surface of each toroidal pore (Ludtke et al. Reference Ludtke, He, Heller, Harroun, Yang and Huang1996).
4.2 Conclusive remark, a lesson from penetratin
The theoretical arguments described above, mainly Eq. (2), are obviously not specific to a particular peptide; in a sense it describes the behavior of amphiphilic peptides that have a binding affinity to the bilayer interface, where the values of parameters γ, σ o , α, K a , A P , and A L all depend on the specific lipid and peptide mixture under investigation. However, this theoretical approach takes no other peptide properties into account. There exist some peptides that do not appear to be directly describable by the theoretical concept above. As a specific case, we are presently surprised by a counter-example in a peptide called penetratin, although it is not an AMP. Having developed both an experimental and theoretical framework for studying AMPs, it is instructive to investigate why penetratin is not a pore forming peptide.
Penetratin (RQIKI WFQNR RMKWK K) is a 16-residue peptide corresponding to the third helix of the Antennapedia homeodomian of Drosophila (Qian et al. Reference Qian, Billeter, Otting, Muller, Gehring and Wuthrich1989). This peptide is cationic, amphiphilic, and water soluble. It was studied as a cell-penetrating peptide but its purported membrane-penetrating mechanism remained controversial (Duchardt et al. Reference Duchardt, Fotin-Mleczek, Schwarz, Fischer and Brock2007; Fischer et al. Reference Fischer, Fotin-Mleczek, Hufnagel and Brock2006; Melikov & Chernomordik, Reference Melikov and Chernomordik2005). In water, penetratin is a random coil but it spontaneously binds to membranes and turns into an α helix. All of these properties are very similar to LL37, magainin, or melittin. Given the experimental results and the guiding theoretical framework developed above, one might expect penetratin to be a pore-forming peptide. It comes as a surprise, then, that penetratin behaves quite differently than the representative AMPs surveyed thus far.
Figure 8 shows a summary of X-ray diffraction and CD studies on penetratin mixed in four different lipid compositions (Lee et al. Reference Lee, Sun and Huang2010). Like all AMPs we have studied, the penetratin binding causes membrane thinning in proportional to P/L, and there is also a critical P/L* for the limit of linear thinning. But as P/L exceeds P/L*, we observed behavior strikingly different from AMPs. Normally one expects pores appear in the membrane at P/L > P/L*, but penetratin did not cause pore formation and no molecular leakage was detected from GUVs (Sun et al. Reference Sun, Lee, Chen and Huang2010). Instead, penetratin transformed into a β-sheet structure at concentrations higher than P/L* as shown by CD. Furthermore, the β-sheet penetratin aggregated and exited from the lipid bilayer, such that the bilayer eventually recovered its free-bilayer thickness when all of penetratin transformed into β-sheet aggregates.
Penetrain was studied in bilayers of four different lipid compositions as a function of the peptide to lipid ratio P/L. The bilayer thickness PtP and the fraction of penetratin in the α-helical form N α /L (the remaining in the β-sheet form) were measured. The lowest PtP point defines P/L*. For P/L<P/L*, there is a linear relation between PtP and P/L as shown by the dash line (a linear fit) and the peptide is 100% α-helical. The coordinate of N α /L (shown on the right-hand ordinate) was chosen to coincide with the P/L value on the dash line so that there is a one-to-one correspondence between the PtP value and the N α /L value. The agreement between PtP and N α /L for P/L > P/L* supports the assumption that membrane thinning was due to the α-helical bound peptides and that the peptides in the β conformation did not affect the membrane thickness. The peptide in β conformation exited from the lipid bilayer (Lee et al. Reference Lee, Sun and Huang2010).

Corresponding GUV experiments showed that when the GUV membrane area expansion reached
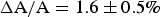 $\Delta {\rm A}/{\rm A} = 1.6 \pm 0.5{\rm \%} $
., penetratin helices transformed into visible aggregates that exited from the outer leaflet of the GUV (Sun et al. Reference Sun, Lee, Chen and Huang2010). In multilayer samples penetratin was mixed in both sides of bilayers, membrane thinning reached
$\Delta {\rm A}/{\rm A} = 1.6 \pm 0.5{\rm \%} $
., penetratin helices transformed into visible aggregates that exited from the outer leaflet of the GUV (Sun et al. Reference Sun, Lee, Chen and Huang2010). In multilayer samples penetratin was mixed in both sides of bilayers, membrane thinning reached
 $ - \Delta h/h = 4.7 \pm 0.5\% $
, before penetratin helices transformed to β-sheet aggregates and exited from both sides of the lipid bilayers. Unlike melittin and the other AMPs we have studied, penetratin experiments showed no correlations between the membrane thinning in multilayers and the GUV membrane area expansion. This suggests that penetratin does not translocate across the bilayer like AMPs. This observation corroborates the idea that AMPs’ propensity for pore formation enables their translocation across a bilayer by transient pores even at very low AMP concentration; whereas penetration does not.
$ - \Delta h/h = 4.7 \pm 0.5\% $
, before penetratin helices transformed to β-sheet aggregates and exited from both sides of the lipid bilayers. Unlike melittin and the other AMPs we have studied, penetratin experiments showed no correlations between the membrane thinning in multilayers and the GUV membrane area expansion. This suggests that penetratin does not translocate across the bilayer like AMPs. This observation corroborates the idea that AMPs’ propensity for pore formation enables their translocation across a bilayer by transient pores even at very low AMP concentration; whereas penetration does not.
Thus, penetratin is a proof that there is a criterion for a cationic, amphipathic peptide to be a pore-forming peptide that is yet to be determined (Boman et al. Reference Boman, Marsh and Goode1994). We have found that all amphipathic peptides initially bind to the interface of membranes as monomers and cause membrane thinning. As we argued above, the membrane thinning effect causes the chemical potential of the peptide to increase with P/L, equivalently the free energy of the peptide-lipid system increases with (P/L)2 (relative to the initial state of no binding). At a certain value of P/L, some other configuration of the peptide-lipid system may have a lower free energy than the state of membrane with monomeric peptides bound on its planar interface. For AMPs, this lower free energy state is for the peptides remaining α-helical but the membrane transforms to a state with pores where multiple peptides bound on the inner surface of the pores. For penetratin, however, the lower free energy state is one in which initially α-helical peptides transform into β-sheet aggregates and exit from the membrane.
Ultimately, the experimental and theoretical investigations outlined in this paper are all based on the belief that interactions of AMPs with membranes are best described by considering the evolution of a peptide-membrane system. The soft matter properties of this system may be investigated using microscopy and optical experiments as well as the traditional methods of solid state physics such as neutron and X-ray scattering/diffraction. We believe that we have demonstrated the basic principles for understanding the mechanism of common AMPs, often taking melittin as a representative example. Yet, there are other membrane-active peptides and agents, which are not describable using this seemingly general pore-forming model. The case of penetratin shows that remarkably similar peptides can display very different behavior in the membrane. Just as well, the cyclic lipopeptide daptomycin and the antifungal macrolide amphotericin B are not described by the AMP model.
Still, it is evident that experiments on these molecules that are guided by such a conceptual and experimental framework for studying pore-forming AMPs may reveal many unique properties and phenomena. We believe it is of interest to pursue novel research with both familiar and mysterious membrane-active peptides guided by the results obtained from pore-forming AMP studies.
Supplementary material
The supplementary material for this article can be found at https://doi.org/10.1017/S0033583517000087.
Acknowledgements
This work was supported by the NIH (US) Grant GM55203 and the Robert A. Welch Foundation Grant C-0991.


