


Drug Use Disorder (DUD), a highly multifactorial syndrome with major contributions from biological, psychological, and social factors(Blanco et al., Reference Blanco, Rafful, Wall, Ridenour, Wang and Kendler2013; Kendler, Ohlsson, Edwards, Sundquist, & Sundquist, Reference Kendler, Ohlsson, Edwards, Sundquist and Sundquist2017; West, Reference West2006), is often geographically and temporally concentrated (Brownstein, Green, Cassidy, & Butler, Reference Brownstein, Green, Cassidy and Butler2010; Faris & Dunham, Reference Faris and Dunham1939; Linton, Jennings, Latkin, Gomez, & Mehta, Reference Linton, Jennings, Latkin, Gomez and Mehta2014; Petronis & Anthony, Reference Petronis and Anthony2003; Stewart et al., Reference Stewart, Kendler, Westholm, Ohlsson, Sundquist and Sundquist2023; Thomas, Richardson, & Cheung, Reference Thomas, Richardson and Cheung2008). A long tradition of epidemiological studies has shown that risk for both illicit substance use and DUD are associated with low levels of education, unemployment, low income and residence in areas of high social deprivation (Faris & Dunham, Reference Faris and Dunham1939; Grant et al., Reference Grant, Goldstein, Chou, Huang, Stinson, Dawson and Compton2009; Hawkins, Catalano, & Miller, Reference Hawkins, Catalano and Miller1992; Kendler et al., Reference Kendler, Ohlsson, Edwards, Sundquist and Sundquist2017; Warner, Kessler, Hughes, Anthony, & Nelson, Reference Warner, Kessler, Hughes, Anthony and Nelson1995). With the widening availability of familial-genetic data in human populations, it has become possible to map genetic risk factors for traits or disorders some of which show spatial heterogeneity (Abdellaoui et al., Reference Abdellaoui, Hugh-Jones, Yengo, Kemper, Nivard, Veul and Wray2019; Fan et al., Reference Fan, McGrath, Appadurai, Buil, Gandal, Schork and Geschwind2018; Kerminen et al., Reference Kerminen, Martin, Koskela, Ruotsalainen, Havulinna, Surakka and Daly2019; Sohail, Izarraras-Gomez, & Ortega-Del Vecchyo, Reference Sohail, Izarraras-Gomez and Ortega-Del Vecchyo2021). A substantial genetic-epidemiological and molecular genetic literature now supports the important role of genetic risk factors in the etiology of DUD (Deak & Johnson, Reference Deak and Johnson2021), with heritability estimates from twin studies typically in the range of 50% (Kendler, Rosmalen, Ohlsson, Sundquist, & Sundquist, Reference Kendler, Rosmalen, Ohlsson, Sundquist and Sundquist2023e; Tsuang, Bar, Harley, & Lyons, Reference Tsuang, Bar, Harley and Lyons2001).
In this paper, we utilize the family-genetic risk score (FGRS), a quantitative measure of genetic risk based on the rates of a particular disorder in 1st through 5th degree relatives adjusted for age, sex, geographical area, year of birth and familial environmental effects. This FGRS has performed well in a number of empirical applications with simulations suggesting that it provides a good and relatively unbiased measure of genetic risk (Kendler et al., Reference Kendler, O., Bacanu, Sundquist, Edwards and Sundquist2023a, Reference Kendler, O., Mościcki, Sundquist, Edwards and Sundquist2023b, Reference Kendler, Rosmalen, Ohlsson, Sundquist and Sundquist2023e; Kendler, O., Sundquist, & Sundquist, Reference Kendler, O., Sundquist and Sundquist2023c; Kendler, Ohlsson, Sundquist, & Sundquist, Reference Kendler, Ohlsson, Sundquist and Sundquist2023d; Kendler, Ohlsson, Sundquist, & Sundquist, Reference Kendler, Ohlsson, Sundquist and Sundquist2021a; Kendler, Ohlsson, Sundquist, & Sundquist, Reference Kendler, Ohlsson, Sundquist and Sundquist2021b). Using the FGRS for DUD (FGRSDUD), we address the following three questions:
1) What is the geographical distribution of the FGRSDUD in the country of Sweden and its three major urban centers – Stockholm, Gothenburg, and Malmö – and to what degree does FGRSDUD display significant spatial heterogeneity?
2) What is the joint geographical distribution of FGRSDUD and social deprivation (s.d.)? That is, to what degree do these two major risk factors for DUD co-localize within regions of Sweden?
3) What is the temporal stability of the spatial distribution of FGRSDUD alone and the joint distributions of FGRSDUD and s.d.?
Methods
We collected information on individuals from Swedish population-based registers with national coverage linking each person's unique personal identification number which, to preserve confidentiality, was replaced with a pseudonymized serial number by Statistics Sweden. We secured ethical approval for this study from the Regional Ethical Review Board in Lund (No. 2008/409 and later amendments). In the database, we included for each individual a family genetic risk score (FGRSDUD) for Drug Use Disorder. For our definition of DUD, see Appendix Table 1. The FGRS is calculated from morbidity risks for disorders in first-degree through fifth-degree relatives, controlling for cohabitation effects, and thus arise from phenotypes in extended pedigrees, not from molecular genetic data. See Appendix Table 2 for more details. In the database, we also included, for the years 2012, 2015, and 2018, the DeSO area where the individual resided. The DeSO areas divide Sweden into 5983 regions which have between 700 and 2700 inhabitants. The division takes into account the geographical conditions so that the boundaries commonly follow streets, waterways and railways. Important building blocks used to create DeSOs are urban areas and electoral districts. For each of the DeSO areas we created a neighborhood social deprivation (s.d.) index based on register data for all residents in the neighborhood aged 25–64. We used deprivation indicators employed by past studies to characterize neighborhood environments and then used a principal component analysis to calculate a z-score (Winkleby, Sundquist, & Cubbin, Reference Winkleby, Sundquist and Cubbin2007). The following four variables were included: low educational status (defined as less than 10 years of formal education); low income (from all sources, including that from interest and dividends, which was defined as less than 50% of individual median income); unemployment (defined as not employed; excluding full-time students, those completing compulsory military service, and early retirees); and social welfare assistance.
For each DeSO area and year, we calculated the mean FGRSDUD for all individuals aged 15 to 35, peak years for DUD, who were born in Sweden to Swedish born parents. To account for differences in population size across areas, we used the predicted values from a multilevel model with individuals nested within DeSO areas in which we controlled for year of birth and sex. This means that areas with fewer individuals and larger variation within the area are shrunken towards the overall mean value. To uncover patterns of FGRS at the DeSO-level, a spatial clustering analysis was implemented to detect hot- and coldspots of FGRS using the Getis-Ord Gi*statistic (Getis & Ord, Reference Getis and Ord1992). The G* statistic has been commonly used in spatial statistics to quantify spatial clustering in a dataset (Amune & Amilian, Reference Amune and Amilian2023; Luenam & Puttanapong, Reference Luenam and Puttanapong2019; Tsai, Lin, Chu, & Perng, Reference Tsai, Lin, Chu and Perng2009).
Hotspots are identified as groups of DeSOs where high values cluster, resulting in higher G* scores. Conversely, coldspots are where low values cluster, leading to lower G* scores. In this study, the calculation of the G* statistic involved comparing the FGRS values of a DeSO and its neighboring DeSOs to the expected value from the whole dataset under the assumption of spatial randomness. The basic statistic can be calculated as:
where W ij is the spatial weight between ith and jth DeSOs; y j is the FGRS at DeSO j; and N is the number of DeSOs. Developing the spatial weights W ij is the first step to calculate G* statistic. In this study, adjacency was defined using a first order queen polygon continuity, which is constructed based on the DeSOs that share common boundaries and vertices. If two DeSOs are adjacent, the spatial weight is set as 1; otherwise, it is set as 0.
The z scores and p values resulting from the spatial statistical analysis indicate the spatial clustering of DeSOs with either high or low FGRS values. Note that a DeSO with a high FGRS value may not be a statistically significant hotspot. To be a statistically significant hotspot, a DeSO will have to have a high FGRS value and be surrounded by other DeSOs with high FGRS values. In this study, the hot- and coldspots were visualized at 90, 95, and 99% significance levels. To detect patterns of FGRS and s.d., we used spatial co-localization analysis. Such co-localization analysis uses bivariate color schemes to compare values. Each variable is categorized, and each category is associated with a specific color. In this study, the FGRS variable is divided into three categories using a quantile method, while the s.d. composite is categorized, based on previous studies(Winkleby et al., Reference Winkleby, Sundquist and Cubbin2007), into three groups: below one standard deviation (s.d.) from the mean (low deprivation), above one s.d. from the mean (high deprivation), and within one s.d. of the mean (moderate deprivation). The final bivariate choropleth map is produced based on the two variables with three discrete categories each, providing a total of nine categories for mapping.
Results
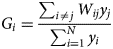
Figure 1 presents means in 2018 for each DeSO region in Sweden for ages 15–35, classified using natural breaks (with darker blue signifying higher mean FGRSDUD) with maps depicting Sweden as well as its three major cities: Stockholm, Malmö, and Gothenburg. Considerable heterogeneity is seen in the distribution of the genetic risk for DUD both for the country as a whole and in its three major urban centers. Each of the major urban areas contain DESOs with relatively high and low levels of mean genetic risk for DUD. Counting as high and low those in the upper two and lower two categories depicted in Fig. 1, Stockholm, which contained 544 DeSOs, had 24.9% with high and 55.9% with low mean levels of FGRSDUD. Parallel results for Gothenburg (306 DeSOs) were 29.1 and 51.3% and for Malmö (191 DeSOs) 26.2 and 47.1% (see Appendix Table 3 for full details).
The Mean FGRSDUD by DeSO in 2018 in the Country of Sweden and Its Three Largest Urban Areas – Stockholm, Gothenberg, and Malmö. For each DeSO, we take the mean for all individuals aged 15 to 35 who were born in Sweden to Swedish born parents. The mean FGRSDUD is by definition, 0.00 and for this figure is divided into 5 levels, very low – green, low – purple, intermediate – orange, high – yellow and very high – blue. The national map also contains bodies of water and major roads and names of a number of prominent cities. The insert maps for the three largest cities, also indicates, by hashing, the areas of urbanization.
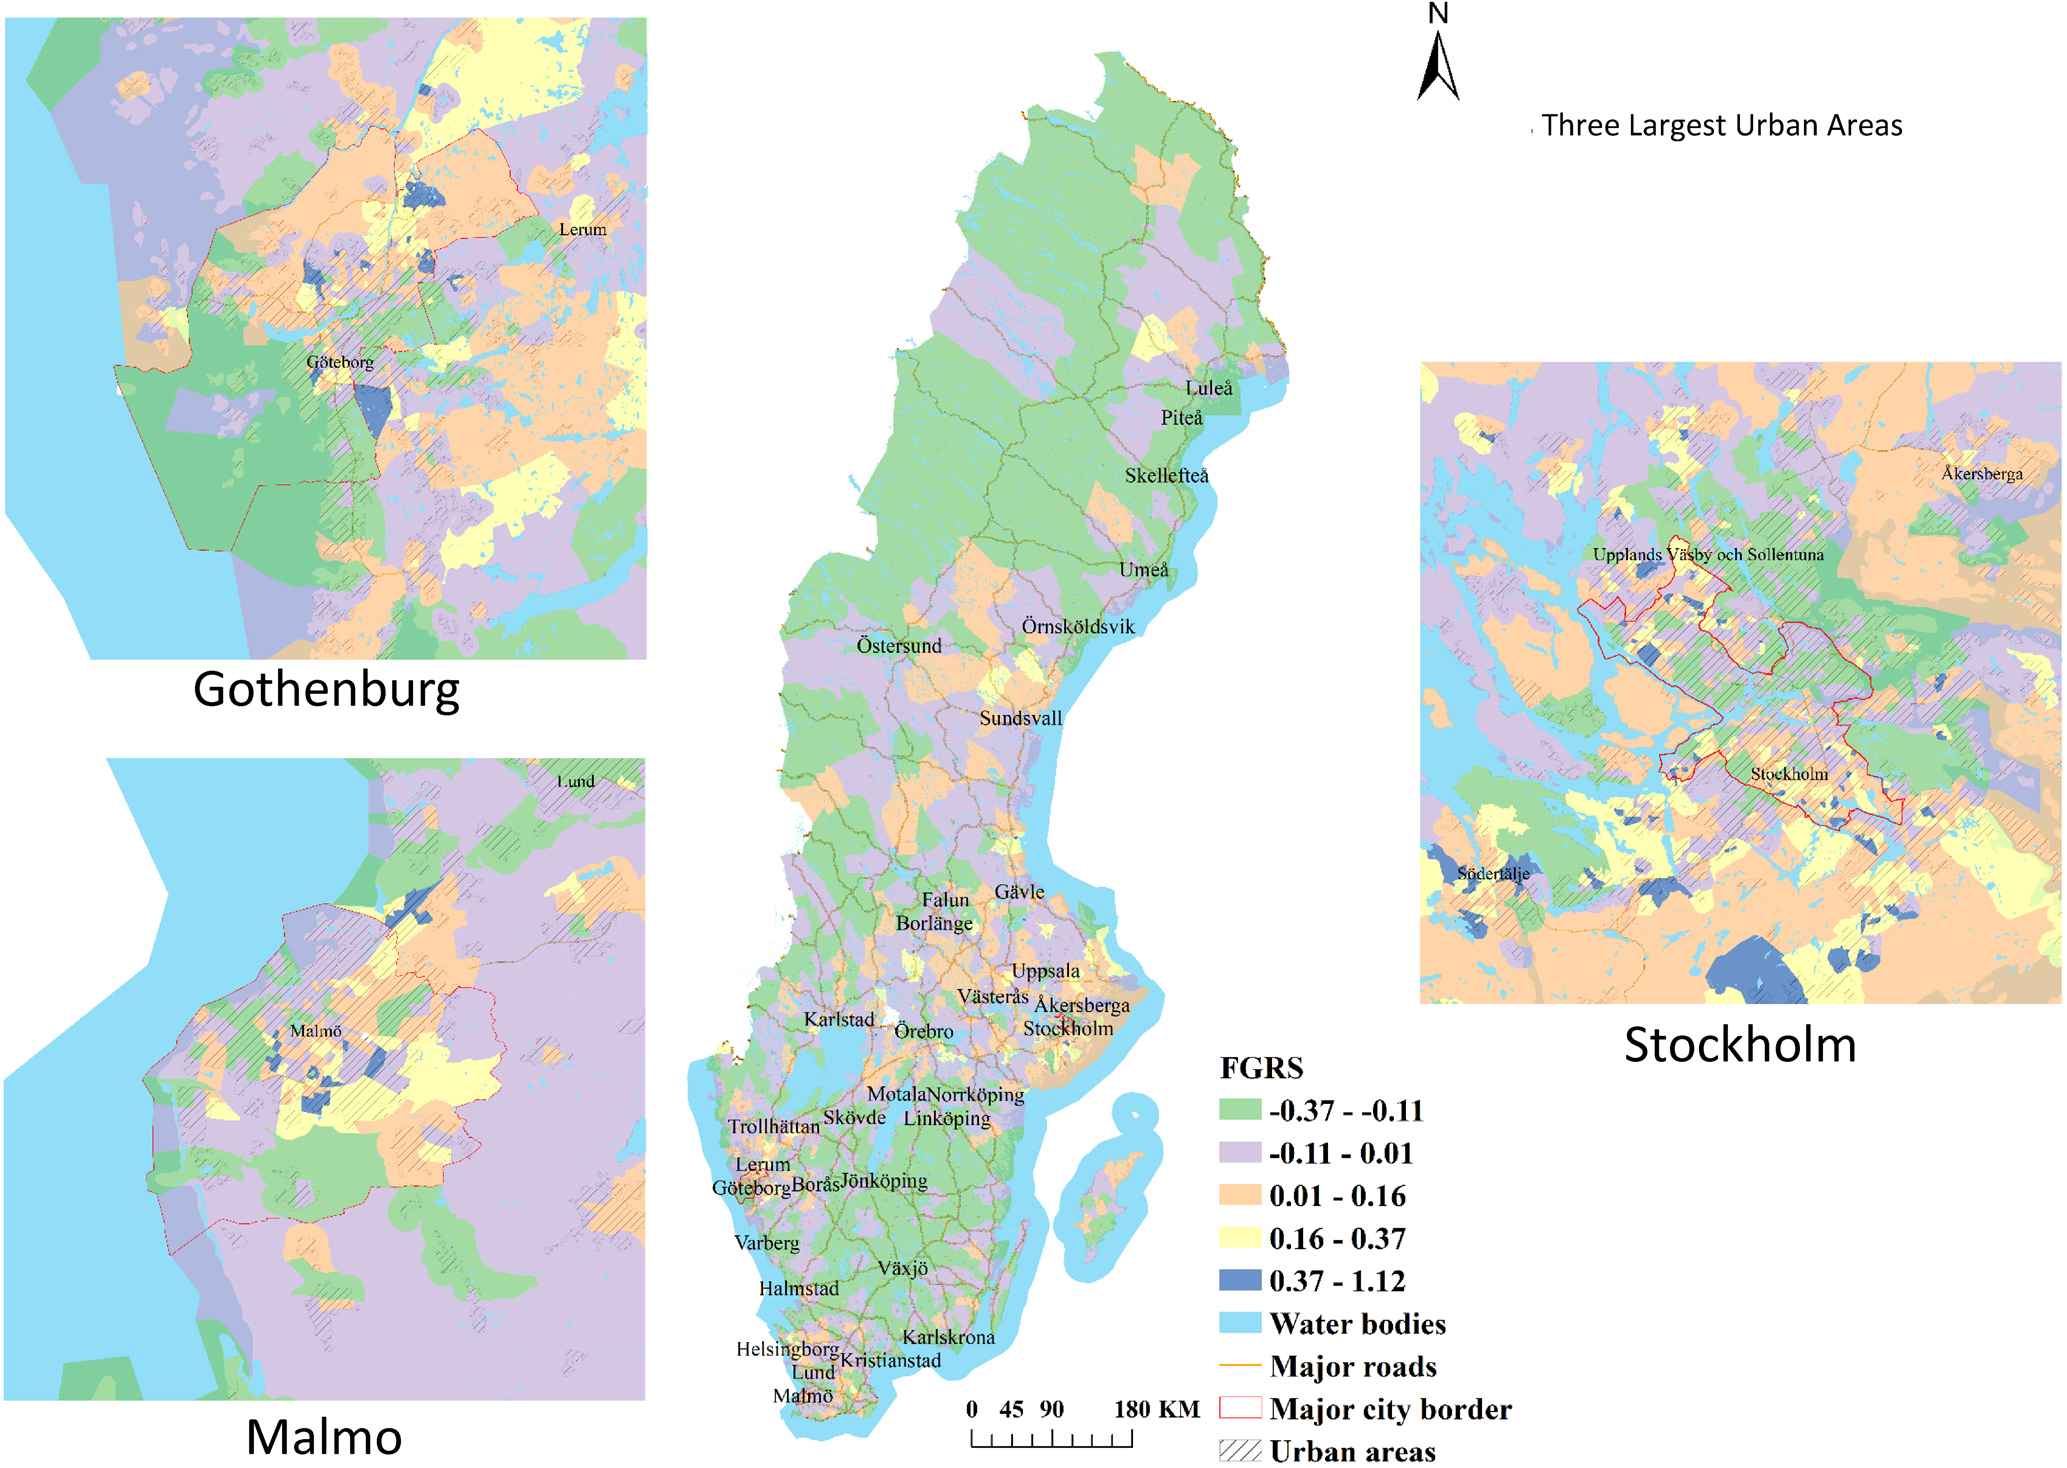
We formally test for spatial autocorrelation of the mean DESO FGRSDUD for 2018 in a hot-spot analysis presented in Fig. 2. Country wide, the largest hot spot is detected in the coastal region east and south of Stockholm while the largest cold spot is in the less densely populated forested areas of southern Sweden made up of the counties of Kronoberg, Jönköping, Östergötland, and Västra Götaland. Hotspots are detected in each of the three cities where 61 DeSOs in Malmö (31.9% of Malmö DeSOs), 89 DeSOs (29.1%) in Gothenberg and 113 DeSOs (20.8%) in Stockholm corresponded to hotspots. The hotspots in these metropolitan regions generally occurred in DeSOs peripheral to parts of the inner city.
Hot and Cold Spot Analysis of the Mean FGRSDUD By Deso in 2018 in the Country of Sweden and Its Three Largest Urban Areas – Stockholm, Gothenberg, and Malmö. We divide each DeSO into 7 possible categories by Hot spot analysis. White indicated no significant deviation in the mean FGRSDUD from population expectation. Light orange, dark orange and red indicate that the DeSO represents a hot spot with a higher than expected rate of FGRSDUD in the DeSO with, respectively, 90, 95 and 99% confidence. Grey, light blue and dark blue indicate that the DeSO represents a cold spot with a lower than expected rate of FGRSDUD in the DeSO with, respectively, 90, 95 and 99% confidence.
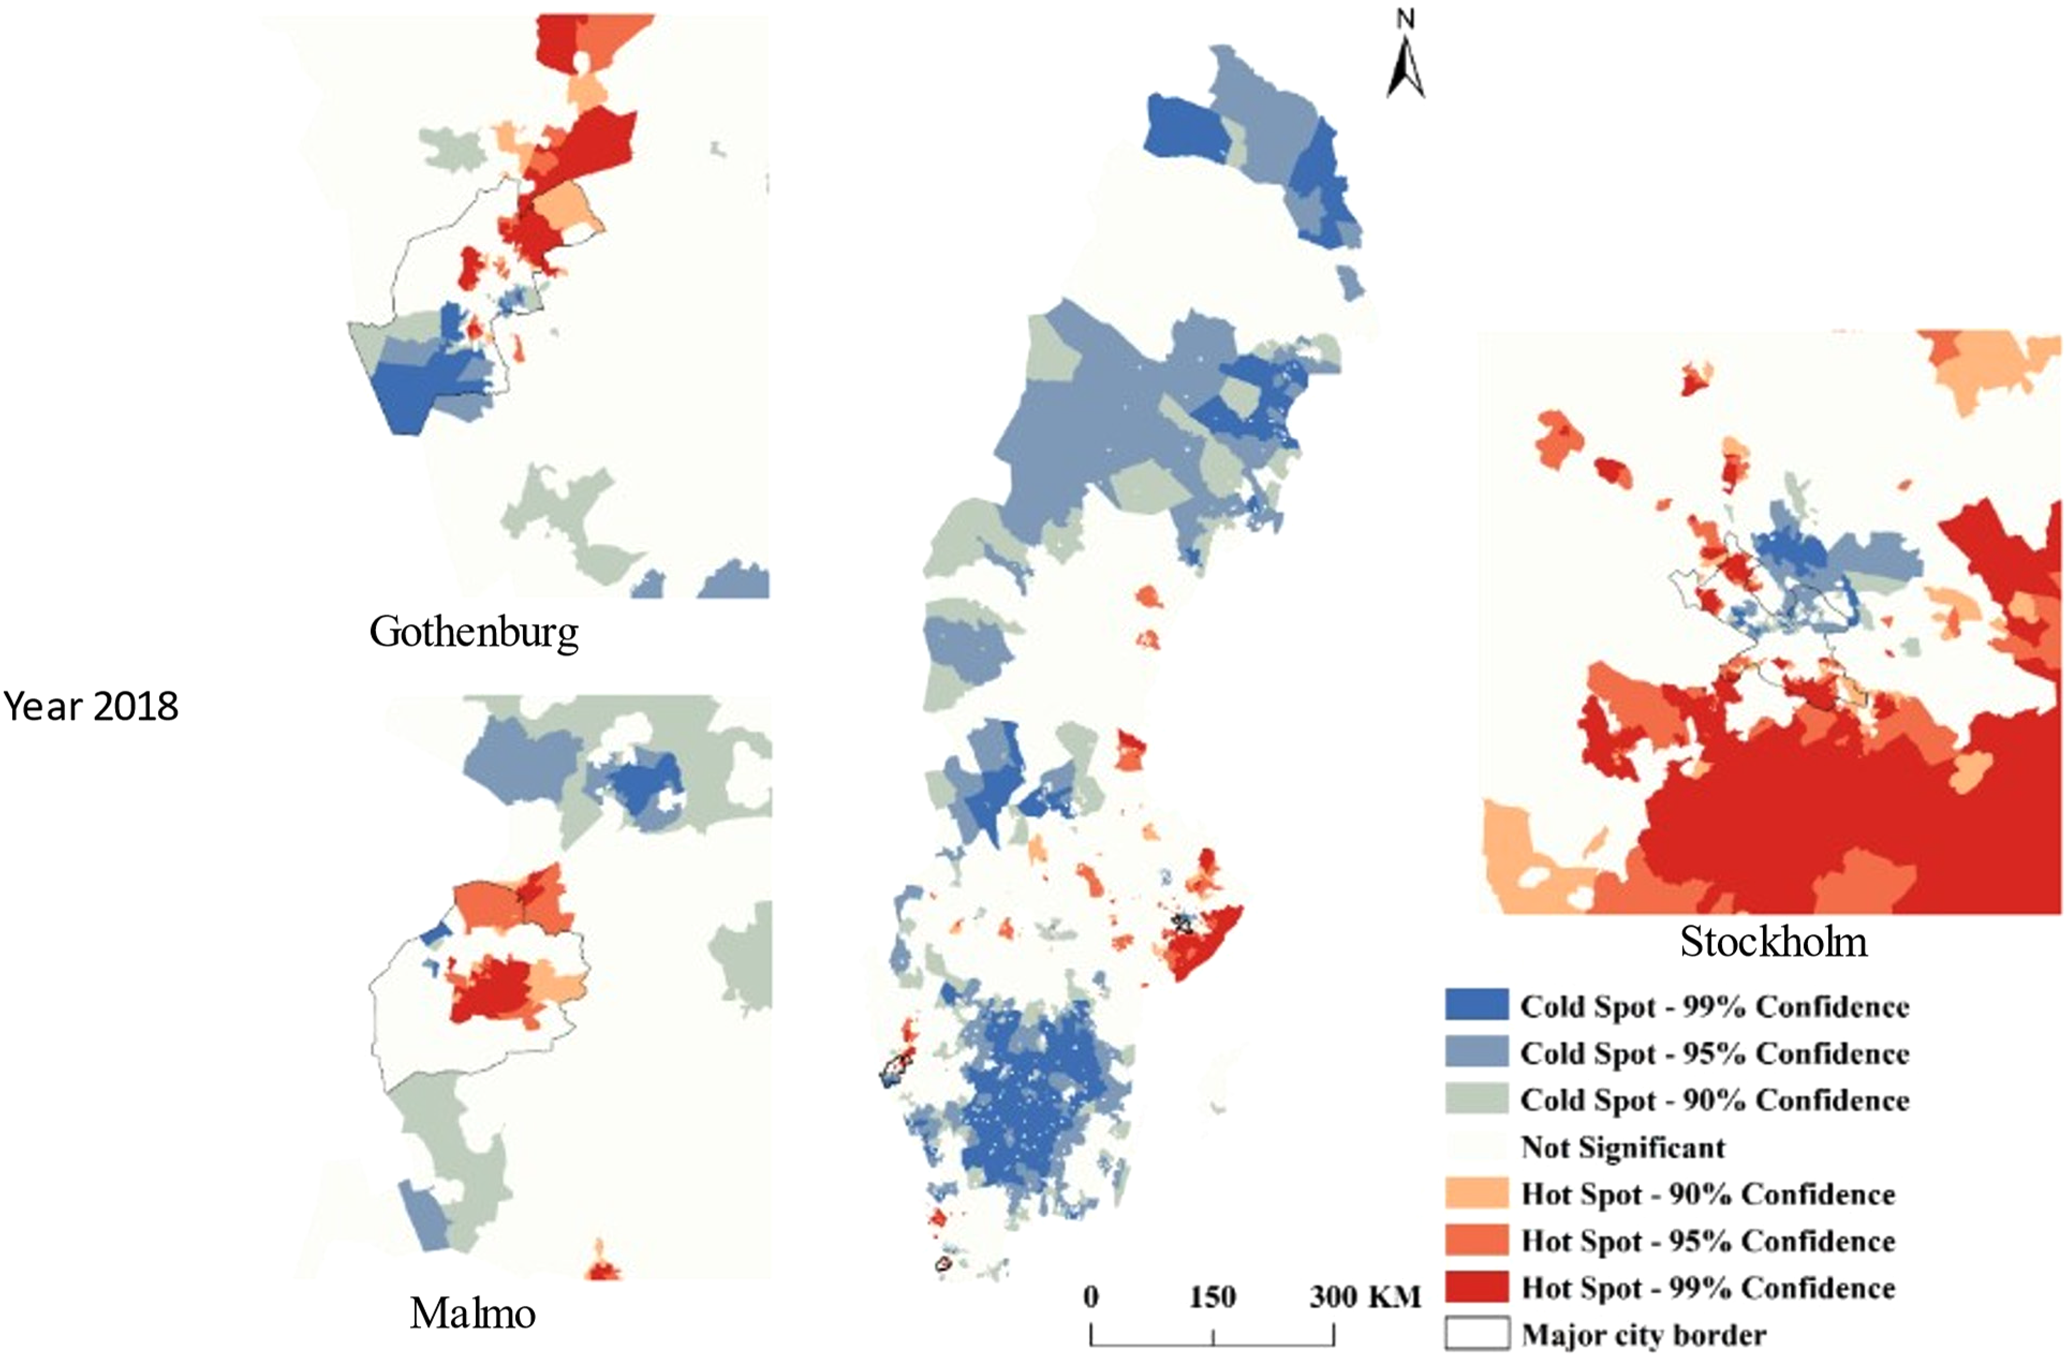
Figure 3 presents a scatter-plot for all DeSO regions for the mean FGRSDUD and the s.d. score in 2018. A considerable but far from perfect correlation is seen in these two measures as assessed at the DeSO level, consistent with the Pearson correlation value of +0.63, with more scattering at higher FGRSDUD and s.d. scores.
A Scatter-Plot from all DESOs in Sweden of the mean FGRSDUD on the X-Axis and the mean Social Deprivation Score on the Y-axis. The Pearson correlation between these two variables equals +0.63).
We examine the joint spatial distribution of the FGRSDUD and the s.d. scores nationwide as well as in the three major metropolitan areas in Fig. 4 where levels of FGRSDUD and the s.d. are divided into lower, intermediate, and higher levels using natural breaks classification. The largest proportion of DESOs in Sweden (light blue) correspond to intermediate levels of s.d. and low levels of FGRSDUD.
Mean FGRSDUD and Social Deprivation By DeSO in 2018 in the Country of Sweden and Its Three Largest Urban Areas. Each DeSO is assigned to one of 9 possible categories as a function of its Mean FGRSDUD and Social Deprivation score divided into 3 categories of low, medium, and high. The FGRS score is indexes by the shade of red and the level of Deprivation by the shade of blue. So as seen by the color array in the right lower section of the figure, areas of high FGRSDUD and Social Deprivation are marked by dark purple. DeSOs with high FGRSDUD and low Social Deprivation and low FGRSDUD and high Social Deprivation are colored dark red and dark blue respectively.

We also see, most clearly in three cities, that DESOs that represent higher levels of FGRSDUD are associated with low levels of s.d. (bright pink). Malmö contained 33.5% of DeSOs with higher levels of both s.d. and FGRSDUD (depicted in dark purple) with fewer similar areas in Gothenburg (23.5%) and Stockholm (14.9%). Nationwide, there is a prominent area around Stockholm in the east and stretching much but not all the way to the west where most of the DESOs display intermediate levels of s.d. and either intermediate or high levels of FGRSDUD.
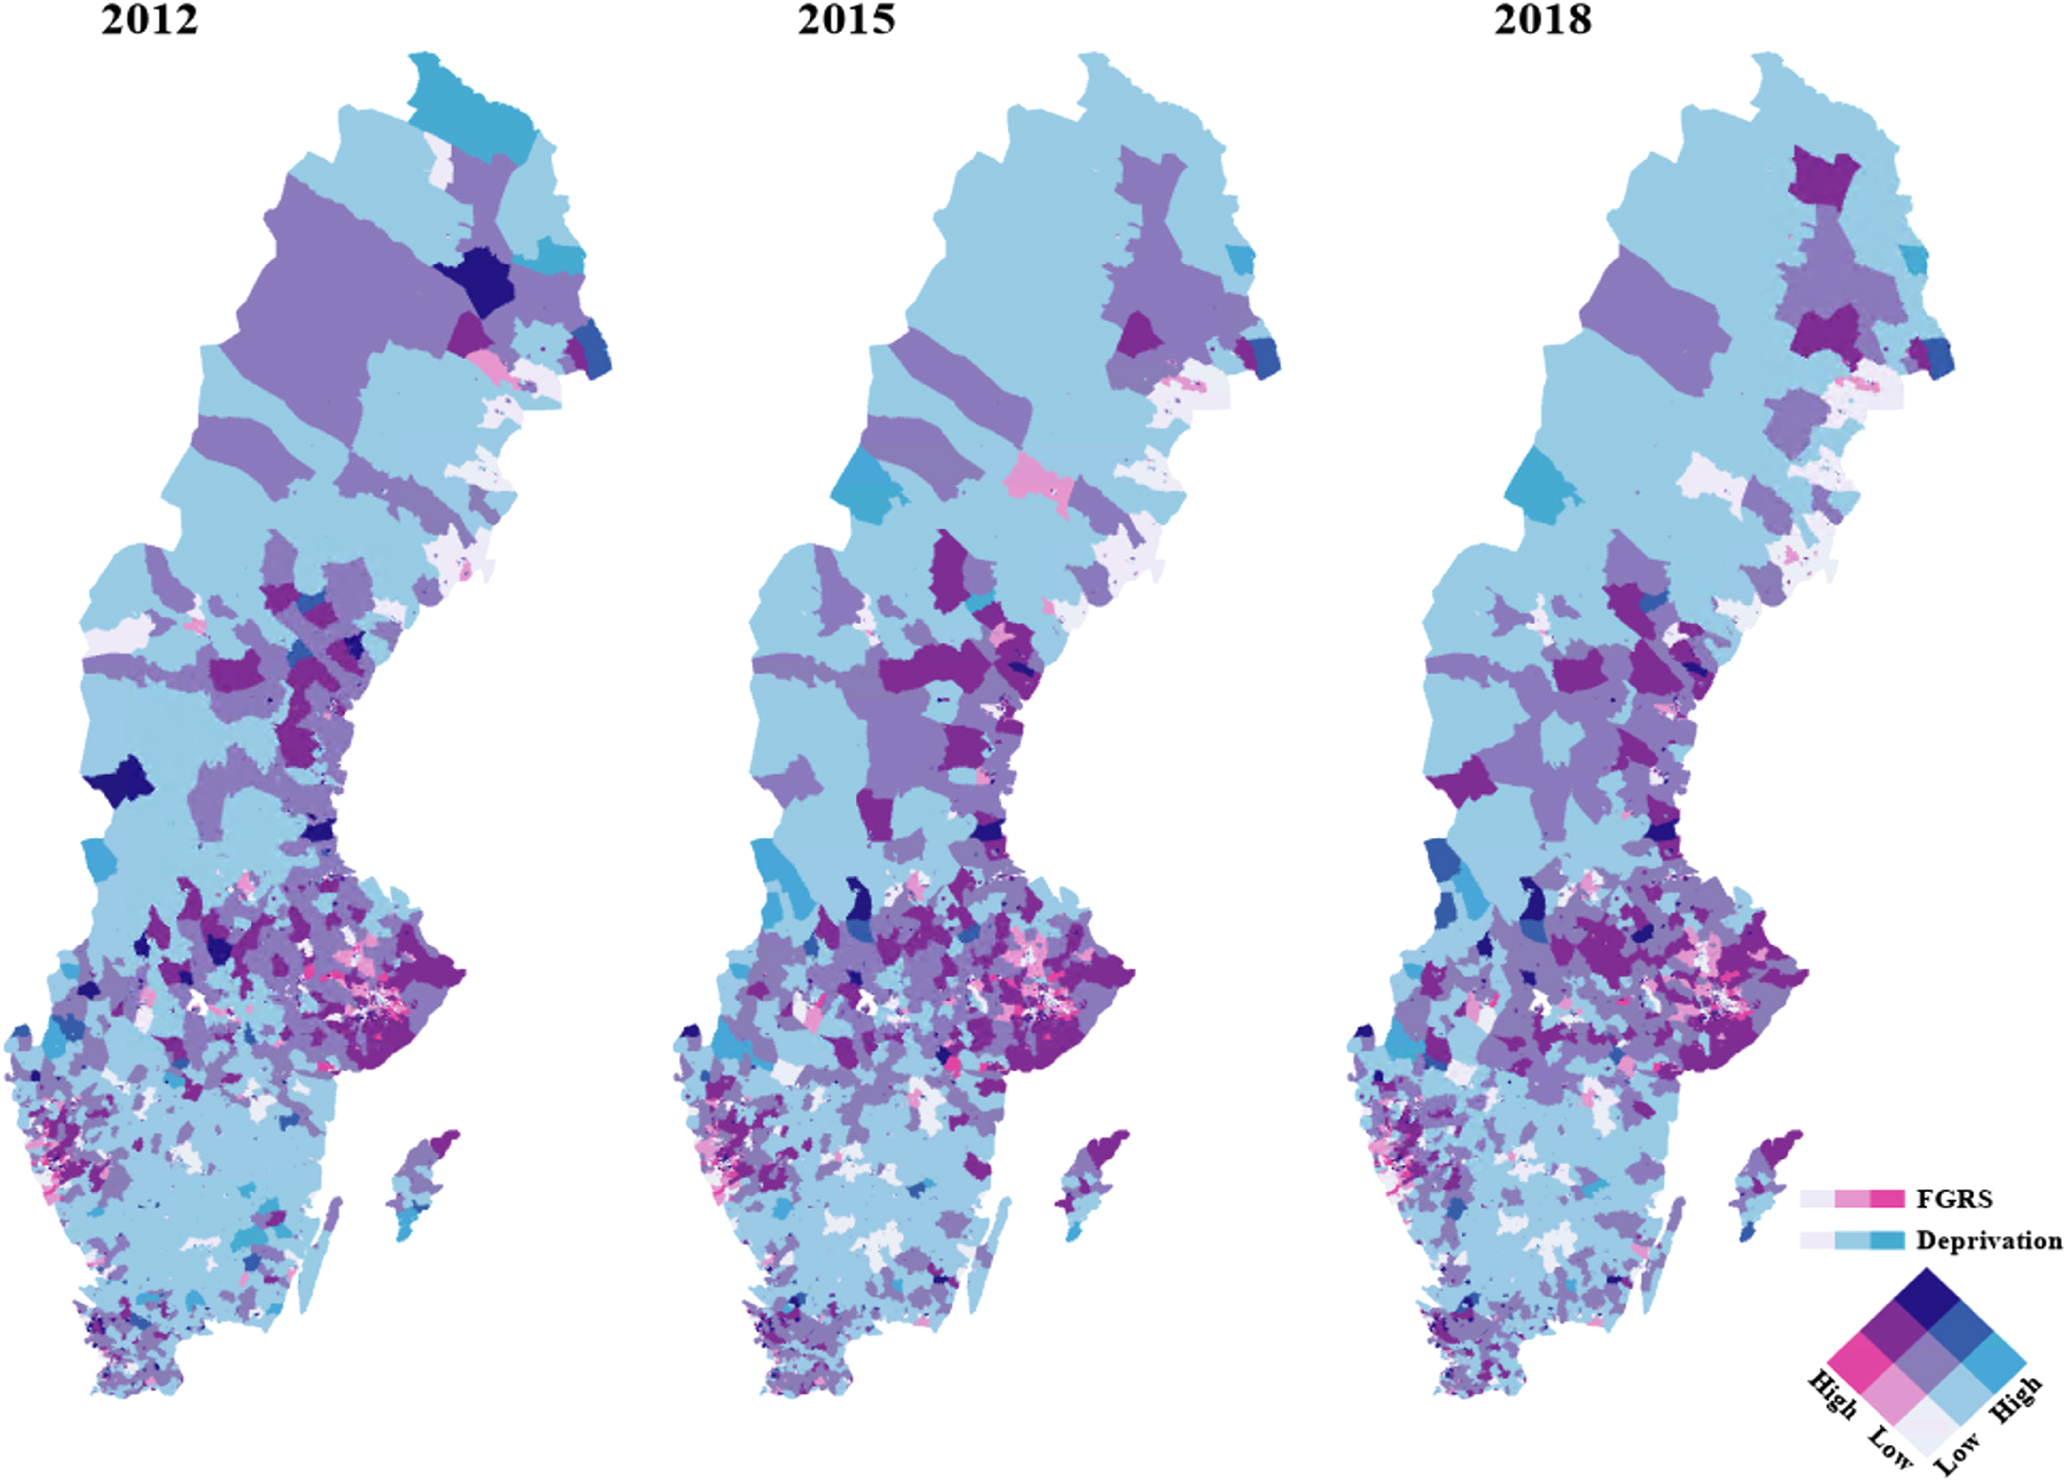
Finally, we examined the temporal stability of our FGRSDUD and s.d. over the years 2012, 2015 and 2018. Across all DESOs, the cross-time correlations for the FGRSDUD were quite high, equaling +0.90 for 2012 to 2015, +0.91 for 2015–2018 and 0.86 for 2012–2018. For s.d., the parallel figures were slightly higher: +0.97 across all comparisons. The correlation across all DESOs of the FGRSDUD and s.d. measures were also relatively stable equaling +0.62 in 2012, +0.62 in 2015 and, as noted above, +0.63 in 2018. In Fig. 5, the temporal stability of FGRSDUD and s.d. by DeSO is seen for 2012, 2015 and 2018. The maps for the FGRSDUD alone over those years are seen in Appendix Fig. 1. While the general pattern of findings is relatively constant across this 6 year period, modest shifts are seen in a number of specific regions. The correlations for the DESO similarities, as classified by both FGRSDUD and s.d. across time, were, however, very high: 2012–2015: +0.97, 2012–2018: +0.97 and 2015–2018: +0.99 strongly indicating that a high degree of temporal stability exists for both factors.
Mean FGRSDUD and Social Deprivation By DeSO in the Country of Sweden in 2012, 2015 and 2018. For the coding of level of FGRSDUD and Social Deprivation by DeSO in this figure, see the legend of Fig. 4.
Discussion
Before we discuss the three questions we examined in this paper, we provide a summary of the social geography of Sweden that is a helpful background for the interpretation of our findings for readers unfamiliar with this topic.
Sweden's current socio-spatial structure can be seen to be influenced by three main factors: (i) A metropolitan – non-metropolitan gradient (Malmberg & Clark, Reference Malmberg and Clark2021); (ii) Within metropolitan differentiation in the form of socioeconomic segregation (Haandrikman, Costa, Malmberg, Rogne, & Sleutjes, Reference Haandrikman, Costa, Malmberg, Rogne and Sleutjes2023; Malmberg, Andersson, Nielsen, & Haandrikman, Reference Malmberg, Andersson, Nielsen and Haandrikman2018) and (iii) Regional differentiation based on historical patterns of economic specialization (Jansson, Wastenson, Aspenberg, & Tanner, Reference Jansson, Wastenson, Aspenberg and Tanner2011; Wastenson & Alvstam, Reference Wastenson and Alvstam1995). The metropolitan non-metropolitan gradient can be found in most developed countries and, according to many observers, has been aggravated in recent decades. It is sometimes reflected in variation in educational attainment, income, ethnicity, political beliefs, and moral values (Kawalerowicz & Malmberg, Reference Kawalerowicz and Malmberg2021). The third factor reflects patterns of regional specialization that go back to the 19th century which include differences in natural resource endowments, agricultural conditions, and location relative to markets and possibilities for sea transport. These geographical factors have, in turn, shaped local economic development, class structure, patterns of inter-regional migration, and local cultural development (Mellander & Florida, Reference Mellander and Florida2007).
Based on these three factors, what are the most important geographical patterns in Sweden that can have influenced key risk factors for DUD?
The metropolitan/nonmetropolitan gradient
Sweden has three metropolitan areas: Stockholm (population 2.4 million), Gothenburg (population 1.1 million), and Malmö (population 0.8 million) (Sweden, Reference Sweden2023). Each consists of a metropolitan core and surrounding suburbs. Stockholm is at the center of Sweden's most densely populated area, Middle Sweden, with a number of larger cities (Uppsala, Västerås, Gävle, Örebro, Linköping, and others) that are inter-connected through fast railways and freeways. Gothenburg is the regional center of West Sweden, with a more restricted influence zone (Borås, Trollhättan, Skövde, Varberg). Malmö, connected by a bridge to Copenhagen, is integrated with the larger Copenhagen region, but also serves as a regional node for much of southern Sweden (Lund, Helsingborg, Kristianstad).
Nonmetropolitan Sweden consists of municipalities at different levels of the urban hierarchy: Large cities, some of which are important regional centers, especially in Northern Sweden (Sundsvall, Östersund, Umeå, Skellefteå, Luleå, and others), medium sized cities, smaller cities, and rural areas. Rural areas, far from regional centers or metropolitan areas, dominated by forests and with low population density, are mainly found in Northern Sweden's inland, and further south along the border to Norway (Jansson et al., Reference Jansson, Wastenson, Aspenberg and Tanner2011). There are also forested areas in Middle and Southern Sweden, but these areas have a higher population density (Wastenson, Öberg, & Springfeldt, Reference Wastenson, Öberg and Springfeldt1991).
Besides being the largest metropolis, Stockholm has the highest level of socioeconomic segregation. In contrast with metropolitan areas in the US, residential areas with high concentrations of immigrants and often with high levels of s.d. are not in the metropolitan core but rather in relatively distant suburbs which are interspersed with suburbs dominated by middle class residents. The most affluent areas are found in locations close to the Stockholm archipelago or to Lake Mälaren as well as in the inner city (Haandrikman et al., Reference Haandrikman, Costa, Malmberg, Rogne and Sleutjes2023).
A similar structure is found in Gothenburg: A gentrified inner city, rental apartment building suburbs with a high proportion of low-income migrants, single family housing middle class suburbs, and affluent areas with close access to coast. In comparison, the gentrified areas of Malmö are smaller. Malmö also has a large area with a high concentration of low-income migrants that is located close to the city center and is surrounded by a ring of middle class communities strewn across the fertile plains of Sweden's most important agricultural region.
Regional differentiations
Being elongated along a north to south axis, Sweden is characterized by large climactic differences which results in poor agricultural conditions in the extreme north compared to some south regions where the conditions are excellent. As a heritage from the latest glaciation, when almost the whole of Sweden was covered by ice, much of Sweden is covered by coarse moraine, which can hinder agriculture, except where processes of sedimentation have produced better soil types. As a result, Sweden has extensive forests that became a central resource during Sweden's industrialization. Another important resource is iron ore found in many places in central Sweden. A high dependence on natural resources was a factor that stimulated a spatially dispersed pattern of industrialization with many smaller and medium sized industrial towns being established outside the metropolitan regions (Wastenson & Alvstam, Reference Wastenson and Alvstam1995). During the last decades of the 20th century employment in these industries declined sharply producing a large number of towns that no longer have a strong manufacturing sector and that have experienced population decline (Lundmark, Reference Lundmark2010). More recently, many such towns have experienced a population turn-around as they have become destinations for Sweden's growing migrant population. These former manufacturing areas have fewer active church goers than the more conservative non-metropolitan areas (Jonsson, Svensson, & Sandberg, Reference Jonsson, Svensson and Sandberg2020).
The spatial distribution of genetic risk for SUD
To address the first of the three questions we posed, we explored the spatial distribution, within the country of Sweden, of the mean genetic risk for DUD per DeSO in 2018. The distribution is substantially heterogeneous both within the country as a whole, as well as in each of its urban centers. This impression is supported by hot-spot analyses that documents a substantial number of statistically significant hot and cold spots across the country and within urban centers.
Overall, as seen in Fig. 1, on the national scale, the FGRSDUD shows a spatial distribution with high levels of risk centered on the three metropolitan areas of Sweden and there hinterlands, with Stockholm having by far the largest hinterland, followed by Gothenburg, and Malmö, that has only a small hinterland with elevated risks. The Stockholm hinterland encompasses much of populated central Sweden with a number of relatively large cities as well as smaller cities and towns that, traditionally, have been Sweden's manufacturing belt. This also includes the coastal area of lower Northern Sweden, with a historical concentration of forest industries.
Within each of the major metropolitan areas, the highest risk levels are found in areas characterized by relatively high levels of concentrated poverty, typically located in suburbs with high concentrations of rental housing (Kawalerowicz & Malmberg, Reference Kawalerowicz and Malmberg2021). Much of the same pattern also shows up in the hotspots.
With respect to the cold-spots showing significantly lower levels of the FGRSDUD, on the national level, these show up in the more peripheral parts of Sweden, in the southeast, along the border with Norway, and in parts of Northern Sweden. The distribution of the coldspots is positively correlated with the map of the proportion of residents that voted for the Swedish Christian Democrats which, in turn, is a recognized indicator of high rates of membership in evangelical churches.
Co-localization of genetic risk for drug use disorder and social deprivation
Our county-wide correlational analysis (Fig. 3) showed a considerable but far from perfect association across all DeSOs in Sweden between the mean FGRSDUD and level of s.d. as characterized by a widely used and well validated measure (Winkleby et al., Reference Winkleby, Sundquist and Cubbin2007). We then explored these associations by jointly mapping both variables (Fig. 4). The DeSOs characterized by both high FGRSDUD and s.d. levels (dark blue in Fig. 4) were typically seen in metropolitan locations characterized by concentrated poverty discussed above. Areas that had high genetic risk in combination with low levels of s.d. (red and purple) where more typically seen in the metropolitan hinterlands. Thus, there is a more pronounced joint gradient in s.d. and genetic risk in metropolitan areas, possibly because of selective migration. It could also be that the s.d. index is better at capturing social vulnerability in metropolitan context than in less densely settled areas.
As demonstrated in a recent paper, substantial concentrations of vulnerable individuals can be found outside the metropolitan areas even though the level of deprivation on the DESO level is moderate (Andersson & Borg, Reference Andersson and Borg2023). One example given in that study is the high proportion of distressed singles in more peripheral areas. Another example is distressed couples in single family housing living outside the metropolitan core areas. In both cases, there is some overlap with pink areas, that is low s.d. in combination with elevated FGRSDUD.
Finally, those areas with low to moderate levels of deprivation in combination with low FGRSDUD risks (light blue) were mostly located in peripheral areas outside of the metropolitan hinterlands. Many of these areas are also characterized as being a part of the Swedish Bible-belt, as indicated, recently, by high levels of votes for the Swedish Christian Democrats.
Temporal stability of our findings
Third and finally, we examined the temporal stability of the patterns that we observed in 2018. All of them were high suggesting that the factors influencing the localization of genetic risk for DUD and its substantial but far from complete degree of colocalization with s.d. in Sweden were not highly transient. A possible tendency is that the higher risk area in the hinterland of Stockholm has expanded somewhat in a westerly direction from 2012 to 2018. There also seem to be some expansion of the high risk area of South Norrland.
Context of our findings
We know of no prior examination of the geographical distribution of genetic risk for DUD with which to compare our findings and broadly similar prior studies are rare. Among the most relevant are two studies by Abdellaoui et al., based on UK Biobank data from 2019 (Abdellaoui et al., Reference Abdellaoui, Hugh-Jones, Yengo, Kemper, Nivard, Veul and Wray2019) and 2022 (Abdellaoui, Dolan, Verweij, & Nivard, Reference Abdellaoui, Dolan, Verweij and Nivard2022). The first examined the geographical distribution of genetic risk for low educational attainment and SES (assessed by the Townsend index [Townsend, Phillimore, & Beattie, Reference Townsend, Phillimore and Beattie1988]) in the United Kingdom from polygenic scores obtained from the UK Biobank (Abdellaoui et al., Reference Abdellaoui, Hugh-Jones, Yengo, Kemper, Nivard, Veul and Wray2019). They concluded that the geographical clustering of these measures of what they termed ‘social stratification’ have likely arisen from internal migration driven by socio-economic forces. In the second paper, they expand on the role of internal migration focusing on active gene-environmental correlation (Knafo & Jaffee, Reference Knafo and Jaffee2013), in which genetic liabilities to a range of social and psychological traits influence the selection by individuals of places of residence and the associated social environments. One of these factors they consider is substance use (Abdellaoui et al., Reference Abdellaoui, Dolan, Verweij and Nivard2022). A third study of interest involves mapping of genetic and environmental risk for schizophrenia in Denmark, examining both their main effects and their interaction (Fan et al., Reference Fan, McGrath, Appadurai, Buil, Gandal, Schork and Geschwind2018).
This study is a descriptive one, moving beyond our prior effort to map the geography of rates of DUD in Sweden (Stewart et al., Reference Stewart, Kendler, Westholm, Ohlsson, Sundquist and Sundquist2023), focusing on the spatial distribution of two well recognized DUD risk factors. We would suggest the following major conclusions. First, as expected, the geographical distribution of the mean genetic liability to DUD in DeSOs in Sweden is substantially but far from completely correlated with the level of s.d. Second, levels of FGRSDUD tend to be higher in the peripheral parts of the metropolitan core. This could be a result of families with a high genetic risk for DUD being disadvantaged in the labor market and, thus, are less able to get housing where house prices are elevated. This hypothesis is supported by the evidence that genetic risk for DUD is correlated with low educational attainment (Kendler et al., Reference Kendler, Ohlsson, Sundquist and Sundquist2021a, Reference Kendler, Ohlsson, Sundquist and Sundquist2021b). Third, a trend is seen for the FGRSDUD to be elevated in former manufacturing areas that have experienced industrial decline. One explanation for this could be selective outmigration from these depressed areas of individuals with high educational aspirations, with education having a protective effect against DUD. This has some potential parallels to the geographical distribution of DUD and particularly opiate drug use disorder in the US (Cicero, Ellis, Surratt, & Kurtz, Reference Cicero, Ellis, Surratt and Kurtz2014). Finally, we see, in Sweden, areas with a high proportion of active Christians having lower genetic risk for DUD. A large literature supports the protective effect of religious involvement on rates of DUD (Gartner, Larson, & Allen, Reference Gartner, Larson and Allen1991; Kendler, Gardner, & Prescott, Reference Kendler, Gardner and Prescott1997; Koenig, McCullough, & Larson, Reference Koenig, McCullough and Larson2001; Vance, Maes, & Kendler, Reference Vance, Maes and Kendler2010) but these results at least suggest that some of that association may be mediated by genetic factors perhaps resulting from differential migration into or out of such regions. It is also likely that social effects at a community level – reduced tolerance for drug use or drug dealing – could also mediate this effect.
Limitations
These results should be interpreted in the context of five potential methodological limitations. First, the assessment of DUD by registry data cannot replicate assessment by personal interview. This approach has obvious advantages, as there are no refusals and the concerns about accurate reporting for behaviors that could be seen as social undesirable are not relevant. Furthermore, genetic epidemiological findings for substance use disorders in Sweden are similar to those found in other samples (Kendler et al., Reference Kendler, Sundquist, Ohlsson, Palmer, Maes, Winkleby and Sundquist2012; Kendler et al., Reference Kendler, Ji, Edwards, Ohlsson, Sundquist and Sundquist2015; Kendler et al., Reference Kendler, PirouziFard, Lonn, Edwards, Maes, Lichtenstein and Sundquist2016; Kendler, Maes, Sundquist, Ohlsson, & Sundquist, Reference Kendler, Maes, Sundquist, Ohlsson and Sundquist2013). However, we will miss individuals whose drug abuse does not lead to medical attention or are associated with criminal behaviors, suggesting that we are, on average, detecting a more clinically severely ill group than would be seen with epidemiological samples assessed by interview.
Second, the FGRS is an index of risk based on the phenotypes of members of the extended family and are not directly comparable to polygenic risks scores obtained from molecular genetic studies. The FGRS has performed well in a number of empirical applications with simulations and comparisons with other similar methods (Hujoel, Gazal, Loh, Patterson, & Price, Reference Hujoel, Gazal, Loh, Patterson and Price2020), suggesting that is provides a good measure of genetic risk (Kendler et al., Reference Kendler, Ohlsson, Sundquist and Sundquist2021a, Reference Kendler, Ohlsson, Sundquist and Sundquist2021b, Reference Kendler, O., Bacanu, Sundquist, Edwards and Sundquist2023a, Reference Kendler, O., Mościcki, Sundquist, Edwards and Sundquist2023b, Reference Kendler, O., Sundquist and Sundquist2023c, Reference Kendler, Ohlsson, Sundquist and Sundquist2023d, Reference Kendler, Rosmalen, Ohlsson, Sundquist and Sundquist2023e). Furthermore, recent empirical comparisons for polygenic risk scores and related simulation studies, suggest that both FGRS-like phenotypic measures and polygenic risk scores, with available samples, are best seen as modestly accurate measures of the same underlying genetic susceptibility (Krebs et al., Reference Krebs, Hellberg, Ohlsson, Steinbach, Pedersen, Werge and Kendler2023). Furthermore, our sample was restricted to those individuals that were born in Sweden with two Swedish-born parents because immigrants have too few relatives in the registries to develop meaningful FGRS. Thus, we cannot generalize our families to immigrant native groups in Sweden.
Third, could our results be confounded by a robust effect of s.d. on our ascertainment of DUD and hence our FRGSDUD? Given the wide accessibility of health care in Sweden, we considered this hypothesis implausible but we tested it empirically by comparing the s.d.-FRGSDUD association in DeSO areas where we divided our DUD cases into those ascertained by the medical v. criminal registries which would likely be subject to quite different potential SES biases. In 2018, the correlation between our DeSO measures of s.d. and FRGSDUD equaled +0.60 when we ascertained our cases of DUD using the medical registry and +0.61 when we did a parallel calculation using DUD ascertained via the criminal registries. We conclude that s.d. related biases in our DUD ascertainment is unlikely to substantially major influence our findings.
Fourth, the major focus of our study is across the temporal window from 2012 to 2018. To address qualitatively the question of the overall temporal stability of our findings, we present in Appendix Fig. 2, a map formatted exactly the same way for Fig. 4 from 2018 done in the Swedish population in 2000. While different in many specifics, the general pattern of findings is broadly stable time period.
Conclusions
The geographical distribution of the genetic risk to DUD is quite variable in Sweden with statistically defined hot and cold spots. Hot spots were commonly seen in urban areas and those with high levels of social deprivation. Cold spots were most commonly associated with rural areas and areas with high levels of religious affiliation. Examined country-wide, levels of s.d. and FRGSDUD were substantially correlated, but were disassociated in a number of regions. We hope this effort lays the groundwork for further studies of the sources of geographic variation in rates of DUD in Sweden including how such patterns arose historically and how genetic and environmental risk factors have contributed to these patterns.
Supplementary material
The supplementary material for this article can be found at https://doi.org/10.1017/S0033291724002745
Acknowledgments
None.
Funding statement
This project was supported by grants from the National Institutes of Health (DA030005) and Swedish Research Council (2020-01175).
Competing interests
None of the authors have any conflicts of interest to declare.


 Open access