


8.1 This Chapter’s Plan
How can scientists pass on what they have learned not only from, but about their data? This chapter proposes to answer this question by considering data as a form of writing and examining its social uses. I argue that scientific datasets do not merely represent information, but can be structured and presented to have a pragmatic function oriented to enable users’ understanding. I demonstrate this by describing how the Multiwavelength Galaxy Survey (MUWAGS; a pseudonym) collaboration, discussed in Chapters 6 and 7, designed its catalog – a table of the measured and estimated properties of galaxies –, to guide users to self-correct wrong uses and delimit being held accountable for misuses. Some astronomers argue that catalogs encode their makers’ collective knowledge of their data. I examine this claim based on what I witnessed ethnographically, suggest elements of a pragmatics of data reuse, and end with a reflection on socio-computational orders, that is, entanglements of the social and the computational in data-rich science.Footnote 1
As in Chapter 7, witnessing a collaboration’s “inner dialogues” allows us to explore otherwise unarticulated assumptions about how data makers and users think and act as practical methodologists. This is another example of taking a problem of data-rich science – here that of making a user-friendly data release while maintaining a balance of securing credit and demonstrating accountability –, considering its “staffing” with people, and following its management ethnographically.
8.2 Makers and Users, Writers and Readers
A frequent observation in studies of the reuse of scientific data is that aspiring reusers commonly miss what they consider necessary information about the data, putting its uses at stake. Conversely, data makers worry about the misuse of their data.Footnote 2 Finding existing data and making them usable can be challenging, since data reusers often need to know more than metadata (“data describing data”) provide. Making the diverse contextual information that reusers desire explicit can overwhelm data producers.Footnote 3 Paul Edwards and his coauthors (Reference Edwards, Mayernik, Batcheller, Bowker and Borgman2011) note that where proper infrastructures are not established, users often understand others’ data only through elaborate communications with data makers, a process they call “data friction.” They recognize the parallel of this process to everyday social interaction, in which “common ground” – shared understandings fundamental to mutual sensemaking – is typically provisional and contingent, being coproduced by the interactants themselves (Clark Reference Clark1996). In this view, data need someone to speak for them.
“If only data could speak for themselves,” one feels tempted to respond. Putting it this way echoes Socrates’ despair about writing, then (ca. 420 bce) relatively new as a communication medium in Athenian society. In a famous passage of the dialogue Phaedrus (Plato 2005), Socrates compares reading a piece of writing with looking at a painting. Much like paintings are unable to respond to questions viewers ask, Socrates finds written words to “point to just one thing, the same each time” (Plato 2005, 63, 275d5). Writing, like a painting, “trundles about everywhere in the same way” and “does not know how to address those it should address and not those it should not” (276e1). These, of course, are concerns of a philosopher whose favorite mode of instruction is spoken dialogue.
One can define scientific data inclusively as “any product of research activities (…) that is collected, stored, and disseminated in order to be used as evidence for knowledge claims” (Leonelli Reference Leonelli2016, 77; emphasis in original), but when conceived as digital photographs (“arrays of numbers”) or machine-generated “inscriptions” (Latour and Woolgar Reference Latour and Woolgar1986), digital data may appear to be text-like, as forms of writing.Footnote 4 This would make data users the readers of texts who may well experience Socrates’ despair. Media scholar John Durham Peters (Reference Peters1999) argued that the transmission of writing is fundamentally distinct from dialogical exchanges in copresence. Philosopher Sybille Krämer (Reference Krämer2015, 23) concurs when she writes that “[t]ransmission is precisely not dialogical: the goal of technical communication is emission or dissemination, not dialogue. We can thus clearly distinguish between the personal principle of understanding and the postal principle of transmission.” In written discourse there appears to be a “lack of recipient accountability” (Deppermann Reference Deppermann, Deppermann and Günthner2015, 61).
The contrast between transmission and dialogue is stark,Footnote 5 but various studies suggest a congruence. Mikhail Bakhtin (Reference Bakhtin1986, 165) muses that “the listener (reader, viewer)” is included “in the system (structure) of the [literary] work.” Umberto Eco (Reference Eco1979, 7) argues that, to “make his text communicative, the author has to assume that the ensemble of codes he relies upon is the same as that shared by his possible reader.” Wolfgang Iser (Reference Iser1980; Reference Iser1989) notices that the meaning of texts (and not only literary ones) is found not simply in the words, but in the interaction between text and reader. Ethnomethodological studies that regard readers as hermeneutical practitioners who use documentary methods of interpretation support this view (McHoul Reference McHoul1982; Livingston Reference Livingston1995). Historical studies of science supplement this picture, finding that scientists dominantly used letters well into the eighteenth century to communicate data and results (Daston Reference Daston1991). These letters were often “simulations of conversations” (Bohn Reference Bohn1999). Jumping to the twenty-first century and moving beyond science, social media users routinely bridge the chasm between text and talk-in-interaction that Krämer identifies. Thus, Patricia Bou-Franch and coauthors (Reference Bou-Franch, Lorenzo-Dus and Blitvich2012) identify interactional coherence, a notion of linguistic pragmatics, in commentaries on YouTube videos, whereas David Giles and coauthors (Reference Giles, Stommel, Paulus, Lester and Reid2015, Reference Giles, Stommel and Paulus2017) use conversation analysis to identify sequential structures in blog postings, chatrooms, and YouTube commentaries. William Housley and coauthors (Reference Housley, Webb., Edwards, Procter and Jirotka2017) adopts Erving Goffman’s (Reference Goffman1983) notion of the interaction order in interpreting sequences of messages on Twitter.
More relevant for a study of data reuse in science is Dorothy Smith’s (Reference Smith2001, 175–176) suggestion to conceive of the social, organizational, and institutional uses of texts, especially of printed materials, as
text–reader conversations in which, unlike real-life conversations, one side of the conversation is fixed and unresponsive to the other’s responses. (…) However the reader takes it up, the text remains as a constant point of reference against which any particular interpretation can be checked. It is the constancy of the text that provides for the standardization effect. (…) Text–reader conversations are embedded in and organize local settings of work. (…) In standardizing one “party” to every text–reader conversation, the terms of all conversations with the “same” text are standardized. Among participants, an open-ended chain is created: text–reader–reader–reader–.
Smith explores the consequences of the spread of “identical copies” to multiple sites. This resembles Bruno Latour’s (Reference Latour1986) account of “immutable mobiles.” But Smith goes beyond Latour by focusing also on the sequentiality of “text–reader conversations” and by examining organizational and institutional uses, which provide contexts of (social) accountability.Footnote 6 This, after all, is a key point in scientific data reuse: that readers are users. What they do with others’ data will itself be open for assessment.
As an elementary form of scientific data, measurements are generated procedurally and are, as such, resources for the achievement of intersubjectivity. Data makers and users – as members of a discipline – commonly agree, in principle, on how those measurements are to be made.Footnote 7 Remember how, in measuring the luminosities and redshifts of a sample of distant galaxies, specific contexts of accountability mattered to the fixation of Nadine’s dataset and how an invisible public of absent evaluators seemed to be curiously present in Nadine’s and Otfried’s conversations (Chapters 3 and 4). In turn, Nadine was guided to present her measurements in a “statistical language,” a “technology of intersubjectivity” (Hacking Reference Hacking and McMullin1992b, 152).
Scientists typically supplement public data releases by journal articles that describe the data production, processing, and analysis. These papers are meant to instruct users. But can such instructions ever be complete and will data users follow them? After all, studies of technology use have provided ample demonstrations that many users do not consult manuals when setting out to operate new devices or turn to them only at last resort.Footnote 8 Such attitudes have inspired designers to develop artifacts that aspire to be “self-explanatory,” that is, “their operation should be discoverable without extensive training, from information provided on or through the machine itself” (Suchman Reference Suchman2007, 43). Yet even when users try to follow such instructions they are bound to be challenged. Revisiting her influential study of how users of a photocopy machine interact with its support system, Lucy Suchman (Reference Suchman2007, 4–5) concludes that “human–machine communications take place at a very limited site of interchange,” whose asymmetries “profoundly limit possibilities for interactivity, at least in anything like the sense that it proceeds between persons in interaction.” Suchman builds on, and illustrates, Harold Garfinkel’s (Reference Garfinkel and Rawls2002) insight that all instructions are essentially incomplete and context-dependent. This finding extends to scientific practice (Lynch and Jordan Reference Lynch and Jordan1995) and it seems likely that it pertains to data reuses as well.
8.3 Fixating a Catalog, Encoding Collective Knowledge?
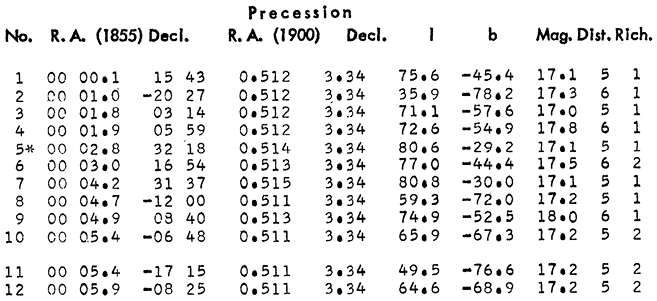
Conceived as a form of writing, data can be formatted in diverse ways, from single numbers to lists, tables, matrices in several dimensions, and various relational structures.Footnote 9 In astronomy, catalogs are a dominant form of data. At the time of writing this, in August 2025, the Centre des Données astronomiques de Strasbourg (France), a major astronomical data center, provided digital access to 26,503 astronomical catalogs.Footnote 10 Many catalogs are tables that list information for one object per row. Columns typically begin with object identifiers (such as the object number) and continue with the celestial coordinates Right Ascension (which resembles geographic longitude) and Declination (which resembles geographic latitude). These are typically followed by columns of specific measurements and their errors, such as the brightness (magnitude) in certain wavelength bands, the shape of objects, radial velocities, photometric redshifts, and so on. Figure 8.1 shows an excerpt of George Abell’s (Reference Abell1958) catalog of 2,712 galaxy clusters in the northern and equatorial sky. Abell spent many months visually inspecting the Palomar Observatory Sky Survey’s 879 pairs of photographic plates of the northern and equatorial sky.Footnote 11 His catalog was printed on forty-three pages in an issue of the Astrophysical Journal’s Supplement Series.
The first entries of George Abell’s (Reference Abell1958) catalog of 2,712 galaxy clusters in the northern and equatorial sky, based on his visual inspection of the photographic plates of the Palomar Observatory Sky Survey. For each object the columns list the catalog number (column 1), celestial coordinates and positional information (columns 2 to 7), the visually estimated magnitude of the tenth brightest cluster galaxy (columns 8), as well as coarse estimates of the cluster distance (column 9), and of the number of galaxies it contains (column 10).
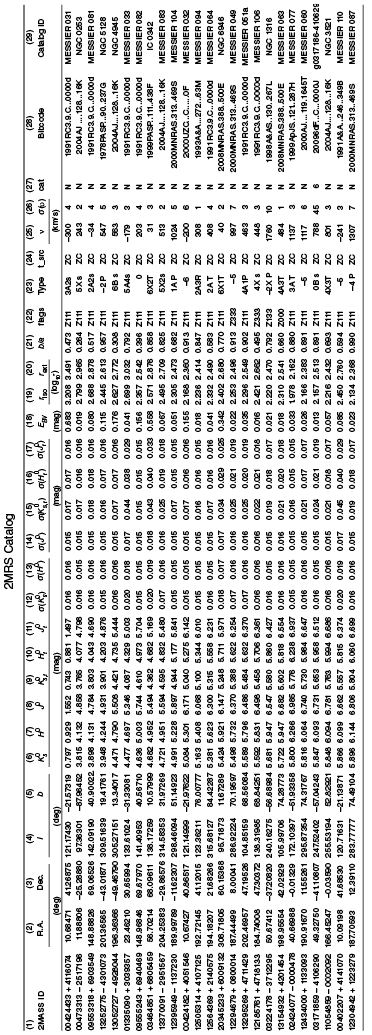
If Abell’s catalog is remarkable for having been made by a single astronomer, then the catalogs of the Sloan Digital Sky Survey (SDSS) are noteworthy for being the joint work of a large team. The SDSS Early Data Release (EDR), which records measurements of 14 million detected objects, was accompanied by a data release paper published by 192 authors (Stoughton et al. Reference Stoughton, Lupton and Bernardi2002). Thirty-two of these can be identified as lead authors, the core team of catalog makers.Footnote 12 (The SDSS catalogs cannot be shown as the Abell catalog, as they are accessed by database queries specific to user interests; Figure 8.2 illustrates instead the formatting of a recent, less complex catalog.) SDSS users can access the survey’s “raw” data, such as digital photographic exposures, and process these data “from scratch” according to the specific requirements of their research project. Indeed, doing so is what David W. Hogg, a member of the SDSS collaboration, recommends, in principle, to users who want to exploit the information content of the SDSS’s photographic exposures maximally. But for most users the SDSS catalogs have an inestimable benefit, as Hogg explains:Footnote 13
Structure of the 2MASS Redshift Survey (2MRS) catalog, which contains data on 44,599 nearby galaxies selected from the catalog of 2MASS, a near-infrared all-sky survey, and is supplemented with spectroscopic observations by John Huchra and his collaborators. For each object the columns list an identity number (column 1), celestial and galactic coordinates (columns 2 to 5), measured magnitudes in six infrared bands and their errors (columns 6 to 17), the galactic reddening (column 18), angular size and orientation (columns 19 and 21), flags (column 22), galaxy type (column 23), redshift and redshift uncertainty (columns 24 and 25), as well as additional information (columns 26 to 29). This is not a regular excerpt of the catalog but a portion shown “for guidance regarding its format and content” (Huchra et al. Reference Huchra, Macri and Masters2012, 6).
The most important thing about catalogs is … they encode the collective knowledge of the people who make the data. So the Sloan catalog is the only place ((where)) we really encoded what we think the noise model of Sloan is … what we think the point-spread function is … what we think the data artifacts are. Because the catalog has been made sensitive to those things. (…) We shouldn’t be passing forward these important metadata through the catalog. But the reality is … we are … this is how we propagate these metadata!Footnote 14
Hogg’s claim, that catalogs “encode the collective knowledge of the people who make the data,” may, in one sense, appear to be self-evident and uncontroversial. Of course, scientists ought to have made the best possible use of their knowledge in processing and analyzing their data. They are most familiar with the detectors and procedures they used. They collaborate in teams to make these data, and divide their labor, so would they not use their collective knowledge for everything they release? Furthermore, many astronomers agree that it is virtually impossible to describe all decisions that led to a final catalog. Peter made this point in Transcript I.2 (Introduction), and Otfried concurs when he explains:
You just cannot document all … individual steps … ehm … so that you could give someone the raw data … and she gets the same catalog in the end. That is … ehm … there are too many steps in between that remain undocumented. It’s just like that. And that … you cannot really avoid that because this work would grow unfathomably … so to say … I mean the work of documenting what you have done.
In this sense, the practical circumstances of catalog production challenge the distinction between data and metadata (“data describing data”) that is essential to many discussions of data reuse and “open science” (cf. Mayernik Reference Mayernik2019).
But Hogg’s remarks, although made informally, seem profound in yet another sense and worthy of further reflection: Would “collective knowledge” – an elusive and controversial topic of philosophical debate – here become conceivable, consequential, and meaningful through its materialization in a digital object? Much of the philosophical debate revolves around whether the notions of “knowledge” and “knowing” can be applied not only to individuals, but also to collectives. Another question is whether “knowledge” should be conceived as a proposition, as most philosophers of science maintain, or as a capability, as those following Ludwig Wittgenstein (2009 [Reference Wittgenstein1953]) and Gilbert Ryle (Reference Ryle1949) argue. To examine these questions empirically, let us first consider some key episodes in the fixation of the MUWAGS catalog.
8.4 Steps in the Collaborative Fixation of an Astronomical Catalog
We know from Chapters 6 and 7 that MUWAGS was an international team of astronomers that made a multiwavelength dataset of the galaxy supercluster A2713 to investigate its dark matter content and its environmental impact on galaxy evolution. Much of MUWAGS’s collaborative work was oriented to making a master catalog: a table of measured and estimated properties of around 88.000 objects detected in optical images of the A2713 field. In its production, three main constituent datasets were to be combined: the MAMBO team’s optical ground-based data, the Hubble Space Telescope (HST) Advanced Camera for Surveys (ACS) team’s measurements of galaxy shapes, and the infrared team’s Spitzer Multi-Band Imaging Photometer (MIPS) observations. The final MUWAGS data release included the master catalog and the processed images, as well as maps of weak gravitational lensing in the A2713 field. The catalog was presented as a FITS (Flexible Image Transport System; see Chapter 1) table and accompanied by a data release paper in a leading journal. The data were made available through the Space Telescope Science Institute’s archive, the Centre de données astronomiques de Strasbourg (France), and the collaboration’s website.Footnote 15
In the following, I give a chronological account of how the MUWAGS team agreed on the final version of its master catalog for public release. Prior to these episodes, the team had resolved dependencies between constituent data subsets, as described in Section 6.6.1. None of the following episodes resulted in a return to data calibrations and analyses. They rather specify some methods of “packaging” data (cf. Leonelli Reference Leonelli2016).
The following episodes are particularly rich in specific detail necessary to identify and describe these scientists’ methods and accounting practices. Readers may wish to jump to Section 8.5 and return for details thereafter.
8.4.1 Guiding Catalog Users by Introducing and Structuring Redundancies
One way to counteract potential misuses of a catalog is to introduce opportunities for instructing users beyond the prescriptive information provided in the data release publication. Introducing redundant catalog entries are one means to do so.
In the work of MUWAGS, a major step in moving toward the first catalog version merging the MAMBO (pseudo-acronym), HST ACS, and Spitzer MIPS data was the assemblage of the so-called J2007d catalog.Footnote 16 This table of around 88,000 rows (one for each detected object) contained the outputs of diverse algorithms – including optical positions, radiation fluxes, and redshifts – and their error estimates. It included duplicate information and various cross-checks, many comprehensible only to their makers. With 709 columns per object, this draft catalog was too big to be shared meaningfully with any user beyond the team. At a collaboration meeting the number of columns was to be reduced to about 200 and the catalog was to be made more user-friendly.
Peter, the main author of the MAMBO catalog, argued that users working with the flux measurements and their “galactic reddening” would benefit from a redundancy in the catalog. Astronomers agree that dust and gas in our Milky Way Galaxy scatter the light of distant objects and “redden” it. The amount of reddening depends on where distant objects are on the sky relative to the band of the Milky Way, the plane of our (spiral) galaxy. Objects behind the Milky Way band are reddened most strongly. This galactic foreground reddening can be estimated and subtracted from flux measurements.Footnote 17 In astronomical terms, de-reddening “delocalizes” the data, yielding the radiation fluxes one would measure when, hypothetically, observing extragalactic objects from outside our own galaxy. This makes it easier to compare the fluxes and colors of objects observed at different positions on the sky. Every practicing astronomer should be able to calculate de-reddened and re-reddened fluxes; this is taught in introductory laboratory courses for undergraduate students. Thus, team members could have simply listed the dust reddening correction that they had applied in the data release paper, which is what they did. But here, as elsewhere throughout the discussion, there is the lingering expectation that catalog users will not read the data release paper carefully, be prone to make mistakes, and “pester” the team with inquiries and requests. Consider this exchange between Peter and Mallory, the team’s principal investigator:
Transcript 8.3
1
Peter: So … um … I thought … it would be best … to make it … as easy and non-confusing as possible for the public … uhh … by giving them something that is de-reddened … and … uh … well … the calibrations are completely consistently corrected and so on … so it’s a dataset where you don’t need to understand … any of the intricacies … I thought that would be the best because that way we avoid a lot of discussion … but we were also saying
2
Mallory: You avoid people pestering you
3
(Group): hhhhh ((chuckling))
4
Peter: Sorry?
5
Mallory: You avoid people pestering you ((chuckling))
6
Peter: Exactly! yeah … no … seriously … I mean …
7
(Group): haha hhhh
8
Peter: whenever there’s a source of confusion it reduces … uh … the motivation of people to use the data … it it it it causes … a lot of … uh … questions … via email from people who are persistent in … in their attempt to use them and it just creates work for everyone … at a potentially perpetual level … and if we can just preempt all of that … that would be the best … and an and … I’d be happy to do this in in very little … time I believe … um … but I think we still need to give them … some … um … we’ll need to give them a prescription … prescription of how to … how to re-redden the data
Peter wants to list de-reddened fluxes to make uses of the catalog “as easy and non-confusing as possible” (line 1). Mallory suggests that by doing so he seeks to preempt being “pestered” by users (lines 2 and 5), which Peter confirms and formulates as the catalog makers’ and users’ shared concern (lines 6 and 8). Peter and Mallory worry about catalog users’ potential mistakes. Interactions with users seem possible, but, worried about their “potentially perpetual level,” Peter rejects them in the pursuit of achieving the project’s closure.
After agreeing as a team that the catalog would list de-reddened optical fluxes, Peter suggests also including a column with the uncorrected (“un-de-reddened” or “re-reddened”) fluxes in the R band, the deepest image of the optical dataset, even though this information was redundant:
Transcript 8.4
1
Peter: (…) and … so … we need one magnitude that is somehow in common or is translatable
2
Mallory: Mm hm
3
Peter: and … uh … the best thing would … be … to … well … look … oh no … it’s actually not a problem because I’ve just suggested we give them two sets of … no … I said … I … we … I suggested we give them one set of magnitudes de-reddened and a prescription how to … re-redden them … uhm … what if we give them this prescription … but one additional actual column
4
Mallory: Mm hm
5
Peter: which is … the re-reddened … R-band magnitude … as observed
6
Mallory: Yep
7
Peter: because that is the cut that we use in our … em … I mean the … variable that we … use to define cuts on our own and then people can use that same variable … they can do an R equals 24 ((magnitude)) cut or something … and if that means 23.786 in R for de-reddened … then … well … so be it … um … at least they would have a column to straightforwardly use … and … and they could see … for the example of this column as well … if their re-reddening procedures with the reddening law … although it’ll be a very simple one … has actually worked … they could confirm with this column … “Yes … I’m not doing something … I’m not doing multiplication instead of division or something stupid” … So that would be an extra column … Mm hm
8
Mallory: Uh … okay … so … I think that sounds reasonable … my … my strongest motivation is that … we … are internally consistent … I mean … are consistent with
9
Peter: Right
10
Mallory: what we already published
By including both the de-reddened and the uncorrected fluxes in the catalog, Peter aims to give catalog users the opportunity to assess their calculations with catalog entries. Peter makes this explicit when (in line 7), using reported direct speech, he takes an imagined user’s perspective. Mallory approves of including this extra column (lines 8 and 10), emphasizing her concern for the consistency of the catalog with the team’s published work. Including the extra column did not affect this.
This was one of several exchanges in which team members pondered introducing redundancies into the catalog. Eliciting a response generates a sequence of actions. Including the extra column enables, and arguably invites, catalog users to perform a three-part sequence: (1) being instructed to re-redden galaxy magnitudes; (2) using these to calculate specific re-reddened magnitudes; and (3) being afforded the opportunity to self-assess their results for one waveband (the R band). This sequence accommodates users’ projectable actions. It is reminiscent of a common feature of instructional sequences in classroom talk: a teacher asking a student a question, the student responding with an answer, followed by the teacher’s subsequent assessment of this response. This is the I-R-E (Initiation-Response-Evaluation) sequence, or Question with Known Answer (Mehan Reference Mehan1979).Footnote 18 Unlike classroom interaction, of course, catalog makers and users are typically not copresent, users’ “response” is in writing, and users would self-evaluate their computations.
As Peter did here, MUWAGS team members commonly adopted the perspective of imagined users in their discussions. Given that these astronomers themselves used other scientists’ data, this is hardly surprising. Peter told me:
Every now and then I use other people’s data and want to do science with them … want to write papers … and there are factors that interest me as a catalog user. I have caught myself thinking … “Gosh … now it’s getting too complicated with this catalog. What all do I have to know to use it properly and not come up with nonsensical interpretations … biased results?” Perhaps the catalog makers have provided lots of descriptive knowledge or whatever … but for me the situation may become uncertain as I don’t know how to use this knowledge and use the catalog to transform it into the product that I wanted to have. And then I sit there and wonder: “Isn’t what I am actually looking for there somewhere on the web?” And then I use it and that’s it. Or I let this paper go because the effort is getting too big.
Peter describes himself as being an impatient reader of other scientists’ catalog descriptions, arguably missing the guidance of the (numerical) catalog entries themselves. A written description alone, it seems, leaves open too many ways of going astray.
8.4.2 Numerical Order as a Resource for Making Nonsensical Data Uses Perspicuous
Let us now turn from anticipated sequential orders of action to uses of numerical order for structuring catalog users’ experience. A few months prior to MUWAGS’s public data release, when team members had made a comprehensive draft catalog, some of the catalog’s entries could not be filled. Some objects were too close to bright stars or the edge of an exposure, challenging precise photometric measurements, and others were affected by cosmic ray hits and other artifacts. But due to formatting requirements, table cells could not remain empty. Thus, blanking values – a sort of placeholder – had to be adopted for them. One MUWAGS sub-team had chosen −99 as a blanking value, a number that, they believed, would not be confused with astronomical measurements. Another sub-team had used NaN (“Not a Number”) as the blanking value.Footnote 19 Users could search for this text string, such as when aiming to delete questionable table entries from an application. Now striving for a consistent catalog that employed a unique blanking value, Peter, the maker of the ground-based optical catalog, sent an email to the team, requesting ideas for how best to pick a single, consistent blanking value for the entire catalog. His message elicited a lively exchange: over two days, nine team members sent twenty-three messages, from which I quote in what follows.
Ben and Mike, in charge of the optical HST catalog, were mostly concerned with their code’s operability and argued for a blanking value of −99 because IDL (Interactive Data Language), popular for data analysis, could not easily process NaNs. By contrast, Susheela and Mallory emphasized that catalog users ought to be able to recognize their mistakes, such as when accidentally calculating with a numerical blanking value like −99. Susheela writes:
I prefer “NaN” as it limits possibility of error from the user, with absolute mag ((magnitude)) cuts and a global replace by the user to his/her blanking value is clean and unambiguous. I agree with Mike that we should not mix blanking values.
Mallory writes:
Although I am used to the −99 values I would prefer NaN in this case. Users not realizing the convention can get easily caught out, e.g. with a magnitude selection such as R<24. NaN avoids this so seems better practice to me, and can be easily globally replaced if required.
Susheela and Mallory are both alert to the dangers of confusing blanking values with physically meaningful table entries (in this case astronomical magnitudes). Both argued that NaNs, because of not being numbers, would lead computer code to crash, thereby making wrong uses recognizable. This seemed clearly preferable to introducing unrecognized mistakes. However, Chuang notices that this is not always the case when using NaNs as a blanking value. He realized that some code converts NaNs into numbers that would be difficult to trace, making it challenging to recognize mistakes:
I have a slight preference for −99 because it won’t cause any *algorithmic* difficulties for unwary programmers now and in the future. If you program outside of IDL, MIDAS,Footnote 20 or what not, you won’t have to worry about it causing your program to crash. I do nearly all my programming in C, for example, and C will convert NaN into a float ((floating point number)) or int ((integer number)), depending on the conversion string you choose, but it will not otherwise complain that NaN is not a number. What then happens is that NaN becomes some number that gets operated on. It’ll likely produce a nonsensical result when that happens. But depending on C or other languages to produce a nonsensical result is quite dangerous, when the sense of the nonsense is not in our control (does this make sense?). So if we’re exporting the catalog to the outside world, we ought to keep this in mind.
My feeling is that mathematical operations on −99 would produce numerical nonsense that is in our control and would be easy to flag. Otherwise, choosing an even more unrealistic number, e.g. −1e99, should solve any chance of confusion.
Here −1e99 = −1099 is an immensely large negative number, far outside the range of astronomical quantities measured or calculated in this team’s work. Its mistaken use would be easily spotted in any calculation.
Writing independently of Chuang, Otfried came to a similar conclusion and proposed to pick a blanking value “outside the range of all possible data”, that is, an “unrealistic number”:
I understand that NaN is not perfect for some packages (especially those, that use ASCII as input) So a VERY negative number seems preferable. But I would strongly argue for a number which is not just outside the magnitude range, but well outside the range of all possible data (for instance distance vectors between two objects in arcsec could be about −1800.) So I suggest something more substantial: −99999 or so.
But even such a large blanking value could be problematic, as Mike points out in response to Chuang and Otfried. Mike argued that globally replacing a table entry would depend on which number formats users would choose. It would produce values that may not be recognized easily. Rounding errors could make it hard to recognize them as well:
When doing a global replace the maximum allowed data range is specified by the “smallest” data type, in our case integer. So using −99999 will produce −32768 e.g. for NR [the catalog object number]. We should keep that in mind in the choice of our value. Or we would have to consider introducing several values (−9999 for INT [integers], −999999999 for LONG, FLOAT, DOUBLE). Also, keep in mind that for large numbers round-off errors might occur (float(−1e22) = −1.00000e+22; double(−1e22) = -9.9999998e+21).
Mike, who had initially rejected using NaN as a blanking value, now changed his mind, noticing that the popular IDL data analysis code he preferred could, after all, process NaNs:
On second thought, for IDL users NaN is not that much of a nuisance. If encountering a −99 the plot range has to be adjusted anyway, so filtering has to be done and then one could also use finite() to remove NaNs. NaN also has the advantage that after removal plots can be made without interfering with the plot range at all (min and max has now a sensible value).
Mike’s suggestion moved critics like Chuang to accept NaN as the catalog blanking value. Mallory, the principal investigator, subsequently endorsed this with the team’s approval. The “README file,” a brief users’ manual released along with the data, was supplemented to give instructions for how to best find and replace the NaN entries in the MUWAGS catalog.
This discussion illustrates how MUWAGS members were mindful of how imagined users would work with the catalog: doing calculations, checking their results, and noticing what makes astronomical sense and what does not. The team considered, but ultimately rejected, dwelling on a numerical order that catalog makers and users share as professional astronomers: “the range of all possible data” as Otfried called it.Footnote 21 This is a “realist strategy” that distinguishes between what is deemed “real” and what is “artefactual” (Barnes et al. Reference Barnes, Bloor and Henry1996, 81). It provides users with a resource to self-correct their work. As in the previous episode, it is reminiscent of the classroom I-R-E sequence. But in this case the formal constraint of how numbers are represented in the catalog, set by the IEEE 754 standard, thwarted the team’s efforts to do so. Any specific numerical blanking value represents a choice for which the MUWAGS team could be blamed. Employing the nonnumerical NaN blanking values arguably shifts the responsibility of using catalog entries properly to users.
8.4.3 Guiding Catalog Users by Selectively Deleting Information and Defining Flags
Besides introducing redundancies to enable catalog users to cross-check their work, catalog makers may delete information that is prone to mistaken uses or mark catalog entries with flags – numerical or textual descriptors that alert users to possible issues with certain entries.
Late in the assembly of the MUWAGS catalog, the infrared-derived galaxy masses and star formation rates, previously listed separately, were merged with the optical MAMBO/HST catalog. Before doing so, Eddie, the head of the Spitzer MIPS infrared sub-team, decided to delete what he regarded as confusing information and applied flags to mark them as not being contained in the survey’s area. At a teleconference, his decision became the topic of an exchange between Mallory, Peter, and Eddie:
Transcript 8.6
1
Mallory: Oh … actually … we didn’t talk about the star formation rates (hhhh) for MUWAGS … Eddie … you want to say a bit about that … briefly?
2
Eddie: Ah::: … not really. Just to say that they’re … they’re almost the same as before … you know … so anyone using star formation rates will have to look at it … ahm … I’m assuming that … there’ll be some small amount of documentation … if … if not I can send an email … ahhhm … but basically what happened is that there are now total star formation rates for galaxies with infrared detections that are in the high signal-to-noise part of the image … and I’ve cleaned up all the low significance detections and all the … detections in … messy parts of the image by simply killing them … ahm … and saying … ahm … and just saying that there is no information in those parts of the images … so …
3
Peter: Can I just ask and confirm? … so when you have a … a low signal-to-noise part of the image or something … ahmm … do you give them flag zero “outside of the area” or do you give them flag two meaning “not detected”?
4
Eddie: I gave them flag zero meaning “outside of the area” and I set
5
Peter: Okay
6
Eddie: I set their … all their infrared-based data to zero
7
Peter: Yeah … okay
8
Eddie: Ahm … so I have gotten rid of it … which is not necessarily the … ahh … the best thing to do for those who are interested in all the data but … I thought that if I did … I mean … I had confused Susheela by doing the other thing … so I figured
9
Peter: Yes. ( ) (complete sample) now
10
Eddie: I choose something simple … ahhh … ahmmm … and should make everyone happy
Invited by Mallory to update the team on his work on the star formation rates, Eddie reports the changes he made to a previous version (line 2). The potentially contentious nature of his action – the “killing” of information derived from “messy” parts of the image – becomes noticeable through Peter’s request for explanation (in line 3), which Eddie answers and continues to address (in lines 8 and 10) despite Peter repeatedly acknowledging his understanding and acceptance (in lines 5, 7, and 9). Mallory remains silent throughout this exchange.
When Peter and Eddie talk about “flags” in this exchange, they refer to sample selection and quality flags.Footnote 22 Quality flags can be assigned manually to catalog entries or generated automatically by algorithms like the source detection code SExtractor (Bertin and Arnouts Reference Bertin and Arnouts1996) and the GALAPAGOS pipeline (Barden et al. Reference Barden, Häußler, Peng, McIntosh and Guo2012). The MUWAGS collaboration defined quality flags for each of the constituent “sub-catalogs.” These flags were refined while fixating the data release and writing the data release paper. At this stage in the discussion the MIPS catalog had three sample selection flags: 0 (“source not covered,” that is, not in the MIPS “footprint” on the sky), 1 (“source covered and detected”), and 2 (“source covered, but not detected” – that is, a flux density below the detection limit).
As the head of the infrared sub-team, Eddie was entitled to set all entries for “messy parts of the image” (line 2) to zero. What is a “messy” part of an infrared image was not for the members of other sub-teams to judge. However, what Eddie describes as “killing” has a moral connotation. Setting numerical values of the table to zero can be heard as disregarding the epistemic and economic value of these data, obtained as they were using the particularly precious observing time of a space telescope. Eddie acknowledges that deleting entries is not the best thing to do, but he emphasizes his orientation to avoid confusing catalog users, maintaining that even Susheela, a team member, had been confused (in line 8). For Eddie, this concern for cooperation and intelligibility, among team members and beyond, overrides the effort to maximize the catalog’s information content. Note that Susheela appears to have made visible to Eddie what he could not presume to be an unquestioned background.
Reflecting on the formulation of quality flags, a collaboration member told me:
You know … we insert a column for the dumb ones. This sounds arrogant … but what I mean is this … Let’s pretend the public is dumb. And what we do is to tell them “Look … this is a column for you … and if you find this number there then just ignore this thing and use the rest only … before it’s getting too complicated … where too much can go wrong … where you have to know too much as a user … or where we would have to communicate too much too precisely … and we are not willing to make that effort.” … We try to simplify the situation. In that way you cannot use one hundred percent of the power of the catalog … but they can … let me just make up a number … it can be used to eighty or ninety percent by the dumbest possible user. At least nothing will go wrong. That is the point. Better leave opportunities untouched than to let users produce nonsense.
Thus conceived, the resort to flags is a shortcut to account for operations that are difficult to describe and prone to mistaken uses. Eddie’s assignment of flags marks the closure of work on the infrared data. These were not processed further.
8.4.4 Turning Makers into Users: Testing the Catalog by Trying to Break It
The end of the team’s work on the master catalog was marked by several efforts to “break” it, that is, to check its entries’ coherence and logical consistency and impersonate catalog users beyond the team to identify remaining inconsistencies in need of correction. In Section 6.6.2, I reviewed this work through the lens of organizational practice. After several trials, the team arrived at a catalog that allowed diverse uses coherently, was logically consistent, and was accountable to the various evidential contexts (Pinch Reference Pinch1985) that members investigated. At this point it was “frozen in,” as Mallory declared, and became a singular digital object. Given the compromises that fixating the catalog entailed (cf. Episode 3), it was irreducible to any individual team member’s work.
8.4.5 Contemplating Additional Possibilities for Users’ Sequential Engagement
After the MUWAGS catalog was “frozen in,” team members kept pondering further opportunities to engage and instruct users, but the team’s discussion also turned to possibilities of holding users to account. At the last collaboration meeting before the data release, team members considered additional means for preempting wrong uses of the catalog. I use quotation marks to transcribe what I heard as quoted fictional text.
Transcript 8.8
1
Mallory: But I mean we did have discussions on how to … on defensive things … how to guard against lazy and stupid people and possibly making some quantities negative … thinking that that would be very obvious … but it’s not necessary. So all we could do is explicitly write down what these quantities are
2
Ken: Yeah
3
Mallory: and explain them very well … and point people to everything
4
Ken: That’s a good idea. We can test … you know … fill out a multiple-choice test. “If you want to create … if you want to create … stellar mass versus … something … for cluster members
5
Ben: Aha!
6
Ken: which column do you use?”
7
Ben: The MUWAGS catalog driver’s license!
8
(Group): HA-HA-HA-HA-HA-ha-ha-ha ((laughter and mumbling))
9
Mallory: But that’s in light … but it’s not necessarily a bad idea … again in the README a few obvious examples … to say … “If you want … what are the obvious things for … stellar masses for confirmed galaxies … or star formation rates for detected galaxies?” We could actually put that … in as little
10
Elias: and give references to where these things are explained in detail
11
Ken: and say why the other ones are wrong. We could say “Do not use that one because … under your assumptions … don’t use that”
12
Elias: Will there be references where this is explained?
13
Mallory: Well … it’s all going to be explained in the data release paper. That is going to have everything in there. It’s going to be like twenty pages.
14
Elias: Yeah … yeah. It’s good as a reference paper. So again … just balance between being comprehensive and then people not reading it because it’s too much stuff.
15
Christina: Twenty pages!
16
Mallory: Uh huh. It’s not done yet.
In line 1, Mallory alludes to the discussion on blanking values summarized in Episode 2. While she argued for explaining questionable catalog entries in the data release paper, Ken jokingly suggests letting potential users take an online quiz before granting them access to the data (lines 4 and 6). Mallory instead opts for written instructions in the README file, a document that can be downloaded along with the catalog (line 9; cf. Ochsenbein et al. Reference Ochsenbein, Bauer and Marcout2000). Much like the “MUWAGS catalog driver’s license” (line 7) it would instruct users. In lines 10 and 11, Ken and Elias continue a sentence that Mallory began in line 9, transforming it into a collaborative formulation. Elias expresses the concern, previously made, that users would not read the data release paper with sufficient care (line 14).
This discussion continues the team’s playful and exploratory mood of the conversation excerpted in Transcript 7.2 (Chapter 7). There, team members pondered users’ signing and acknowledging the “terms and conditions” of the data release as well as requiring them to deposit their credit card numbers for financial compensation in cases of misuse. Somewhat like the introduction of redundant columns in Episode 1, the multiple-choice test that Ken suggests in line 4 is meant to elicit users’ responses. It projects users’ actions, unavailable for correction in copresence, and seeks to prompt them to self-correct their understanding. References to users passing a driver’s license test and committing to a contractual agreement, although made jokingly, can be heard as pointing to team members’ desire to hold users legally accountable for their actions.
8.5 Discussion
I began this chapter by wondering whether data can be made to “speak for themselves.” I examined data as forms of writing that can be “more-than-evidential” when they are structured and presented to have a pragmatic function oriented to users’ sensemaking and understanding, with the caveat that writing and written instructions can never substitute for talk-in-interaction. They cannot determine users’ actions. Five episodes of the MUWAGS team’s “inner dialogues” illustrate how its members aimed to produce an astronomical catalog that was acceptable to all of them, that was coherent with their diverse projects, and that would preempt at least some mistaken uses. In the following, I draw on these episodes to discuss how a data object can instruct potentially unruly users, what they tell us about the claim that a catalog encodes a team’s collective knowledge, and how socio-computational orders become a worthwhile topic of ethnographic inquiry.
8.5.1 Making an Instructing Data Object for Potentially Unruly Users
Although it would have been possible for MUWAGS team members to consult with potential users and design their data release accordingly, they did not do so. But real and imagined users (and imagined uses) featured prominently in team discussions, in which members commonly represented users’ actual and presumed actions and intentions with reported direct speech (such as in Transcripts 8.4 and 8.5) or referenced them otherwise (such as in the online discussion on blanking values in Episode 2). Imagined users were described as potentially “pestering” catalog makers (Transcript 8.3), as not reading instructions carefully (Transcript 8.8), and as being prone to make mistakes for which they could hold the team accountable (Transcript 8.6). In sum: viewed through their (imagined) actions, users were deemed potentially unruly – and so were (potential) uses of the released data. A closer look reveals that these characterizations draw on team members’ self-reflection of their own conduct as professional astronomers. They assume a “reciprocity of perspectives” (cf. Schütz Reference Schütz and Natanson1962; Reference Schütz and Brodersen1964).
The designers that Steve Woolgar (Reference Woolgar and Law1991) studied considered users as generic subjects that were to be configured, Madeline Akrich (Reference Akrich, Bijker and Law1992) observed how users were “scripted” into a design, Wes Sharrock and Robert Anderson (Reference Sharrock and Anderson1994) witnessed users being typified as “scenic features in design,” whereas David Martin and coauthors (Reference Martin, Rooksby and Rouncefield2007) witnessed potential users as the “context” for design. But for these astronomers, data makers and anticipated data users were agents who act in recognizably structured ways as members of the same epistemic community. MUWAGS team members were themselves users of other scientists’ data (cf. Transcript 8.5) and they drew on this experience as they assembled their catalog. In a certain sense, team members became (auto-)ethnographers of their own culture, a stance now familiar from Chapters 2, 3, and 7.
Since team members could not draw on resources available for repair in face-to-face interaction, their challenge was to structure the data release to make it an object that guides its users beyond the instructions provided by the data release paper. The episodes described in this chapter reveal some methods for doing so: introducing and structuring redundancies (Episode 1), choosing specific blanking values (Episode 2), selectively deleting table entries and defining flags (Episode 3). Yet other methods could certainly be identified. To speak of methods here may seem exaggerated. After all, little of this was particularly noteworthy for these scientists themselves. Yet it is just their apparent “common sense” that makes these ways of acting a part of extragalactic astronomy’s form of life.
Redundancies may, at first, seem odd as a means for communication in science. In a manual for science writers, Silvia M. Rogers (Reference Rogers2014, 59) states that “[r]edundancies are common troublemakers in scientific communication.” But the diverse uses of redundancies in coding, data storage, cryptography, and communications challenge this view.Footnote 23 An instructive case is the use of notation in mathematical writing, such as when formulating exercises. Donald Knuth and coauthors (Reference Knuth, Larrabee and Roberts1987, 19) explain:
Exercises are some of the most difficult parts of a book to write. Since an exercise has very little context, ambiguity can be especially deadly; a bit of carefully chosen redundancy can be especially important.
Much as students who try to solve textbook problems, data users often lack the experience of using data makers’ detectors, algorithms, and analysis procedures. Redundancies are not merely duplicating information but afford users a variety of sequential engagements to assess their understanding. That repetitions of utterances in talk-in-interaction are not meaningless is a central lesson of pragmatic understandings of language. In Episode 1, I noticed team members’ aspiration to design redundancies meant to instigate users to go through a three-part sequence for self-correcting mistaken uses. I found this to be reminiscent of student–teacher interaction in classrooms.Footnote 24 This triadic structure builds on what Harvey Sacks, Emanuel Schegloff, and Gail Jefferson (Reference Sacks, Schegloff and Jefferson1974, 728–729) refer to as a “proof procedure” for the analysis of turns in conversation, whereby speakers’ responses to a previous utterance display their understanding of the utterance to coparticipants of a conversation.Footnote 25
I wondered at the beginning of this chapter if we could formulate elements of a pragmatics of data reuse. Here I understand “pragmatics” inclusively as the study of “meaning in context” (Chapman Reference Chapman2011, 1), and of “how speakers and hearers achieve understanding in and through language” (Koschmann Reference Koschmann2011, 435), transposing it to scientists’ uses of (numerical) measurements. Sequential engagements with catalog entries, as elicited by means of redundancies, could be one of its topics. Intersubjective uses of measurements, uses of statistical language, statistical descriptors, and the formatting of data could be others.
After all, lists and tables afford specific uses and help reducing ambiguity.Footnote 26 Their structure, order, and notational characteristics afford diverse uses which are “foundational for coordinating activity distributed in time and space” (Bowker and Star Reference Bowker and Star1999, 138). But, when engaged through accounting practices, other formats afford pragmatic uses as well, including digital pixel images.Footnote 27
8.5.2 Does a Catalog Encode a Team’s “Collective Knowledge” of its Data?
Inspired by astronomer David W. Hogg’s claim that astronomical catalogs “encode the collective knowledge of the people who make the data” (Transcript 8.1), I wondered if “collective knowledge,” a topic of philosophical debate, becomes conceivable, consequential, and meaningful (only) through its materialization in a digital object. I now attempt to formulate an anthropological response to this question.
Let me begin by making two distinctions. One is whether “knowing” should be conceived as propositional – that it “consists in possessing the right sort of belief in the right sort of propositions” (Chang Reference Chang2017, 103) –, which is what most philosophers of science seem to assume, or as a capability, as Wittgenstein (2009 [Reference Wittgenstein1953]) and Ryle (Reference Ryle1949) argued.Footnote 28 The other is to distinguish summative views of collective knowledge from those that insist on its irreducibly collective nature. Let me begin with the latter pair, which presumes that knowledge is propositional. The summative view asserts that “a collective knows p iff [if and only if] each member knows p” (de Ridder Reference de Ridder2014, 38). Thus conceived, collective knowledge is reducible to the knowledge of individuals and so there is nothing distinctively collective about it. Views that consider collective knowledge as irreducible to that of individuals are of greater interest. For example, a committee could arrive at a certain position without each, or any, individual member subscribing to it (Wray Reference Wray, Boyer-Kassem, Mayo-Wilson and Weisberg2017). If one adopts the commonly held philosophical notion of knowledge as “justified true belief” – as all these accounts do or at least set out from – one is led to regard human collectives as “epistemic subjects” that can hold beliefs collectively. This is what Margaret Gilbert (Reference Gilbert2000) argues for in her “plural subject theory.”
Brad Wray (Reference Wray2007; Reference Wray, Boyer-Kassem, Mayo-Wilson and Weisberg2017) objects to Gilbert’s view by arguing that ascribing shared acceptance to a collective is more plausible than positing a shared belief. He reformulates knowledge as “justified true acceptance.” In either case, the collectivity of knowers is delineated by those who believe or accept a claim. Whereas Gilbert extends collective beliefs to disciplines and adherents of Kuhnian paradigms, Wray (Reference Wray2007) confines collective acceptance to research teams and committees, arguing that only these have specifiable decision procedures. Probing another part of the definition of knowledge as “justified true belief,” Jeroen de Ridder (Reference de Ridder2014) suggests attending to the unavoidably collective justification of knowledge in science. It is, for example, beyond any individual scientist’s capacity to justify or evaluate findings of elaborate experiments. Questions of collective knowledge then turn into questions of justification and ultimately into questions of trust (Hardwig Reference Hardwig1991; cf. also Wagenknecht Reference Wagenknecht2016, ch. 8).
These considerations can inform an interpretation of the MUWAGS catalog’s fixation. One may accept both Wray’s (Reference Wray2007; Reference Wray, Boyer-Kassem, Mayo-Wilson and Weisberg2017) replacement of “belief” by “acceptance” and de Ridder’s (Reference de Ridder2014) unavoidably collective justification of its contents. The data release paper’s collective authorship signals the collective acceptance of the dataset that it describes. My five episodes illustrate how the justification of catalog entries and quality flags relied on members of distinct sub-teams. That the final catalog became irreducible to individuals’ knowledge is suggested by the diverse evidential contexts engaged by team members as well as the compromises made in its completion.
However, for the naturalistic position that I adopt, the propositional view of knowledge as a form of belief is disappointing. After all, scientists’ “[s]hared beliefs are much less common than shared practices” (Netz Reference Netz1999, 2).Footnote 29 It is more interesting to follow Gilbert Ryle (Reference Ryle1949, 133–134) and consider “know” as a “capacity verb (…) that is used for signifying that the person described can bring things off, or get things right.” By contrast, for Ryle, “believe” is a “tendency verb and one which does not connote that anything is brought off or got right.” Ascribing knowledge to someone therefore presumes the witnessability of this person’s actions, or of these actions’ products. Harold Garfinkel turned Ryle’s and Wittgenstein’s (2009 [Reference Wittgenstein1953]) problems of mutual understanding into topics for empirical study. Responding to fellow sociologist Aaron Cicourel in a discussion on researching children’s acquisition of language skills, Garfinkel (in Hill and Crittenden Reference Hill and Crittenden1968, 47) put it pithily:
“know” here has to do not with what one might have in mind in some secret place. It is not a case of your having to calm a respondent or seduce him in order for him really to tell you. Then you would be illuminated on what he had been hiding all along. Instead, “know” consists really in a structure of activity. That is what the “know” consists of.
Note that, in holding this view, Garfinkel explicitly counters arguments that locate knowledge in the mind or in the brain – arguably the root cause of the philosophical controversy on collective knowledge. Garfinkel (Reference Garfinkel1967, 30–31) insists that the “appropriate image of a common understanding is therefore an operation rather than a common intersection of overlapping sets.” He is concerned with “a procedural sense of common or shared, a set of practices by which actions and stances could be predicated on and displayed as oriented to ‘knowledge held in common’ – knowledge that might thereby be reconfirmed, modified, and expanded” (Schegloff Reference Schick1991, 152; emphasis in original).
In the MUWAGS team’s catalog making, only their shared data analysis skills and practices of agreement may be collective in this sense, since otherwise its members’ skills (capacities) were clearly differentiated and irreducible, as the five episodes above and the two episodes in Chapter 6 have shown. It is then the catalog’s singularity, its unity, and “thingness” in its published, materialized, fixated form, that is most interesting for a discussion of “collective knowledge.”Footnote 30 In this “frozen” form, the catalog is a “means of forgetting” (de Certeau Reference de Certeau1984, 97), leaving no trace of the discussions and agreements involved in its closure, a product of its makers’ analyses and the team’s negotiations. It may properly instruct only users familiar with the evidential contexts, to address which the catalog was designed for, and may be contingent, as well, on shared accounting practices. In its users’ data analyses, the catalog makes the team’s knowledge of its data actionable, but it does so without developing users’ capacity to “bring things off, or get things right” (Ryle Reference Ryle1949, 133) beyond specific applications.Footnote 31
8.5.3 Socio-Computational Orders
Learning from data is the point of making and using them. But how to pass on what has been learned not only from data, but about them? A “frozen” catalog has “frozen” the knowledge of its makers about their data without specifying it.Footnote 32 This, after all, is how its fixation is a “means of forgetting.” One way to learn is to change one’s beliefs, but “belief” need not be something hidden in a private mind (cf. Ryle Reference Ryle1949). Computational scientists rather use it as in Bayesian inference, where it stands for the prior distribution as an estimate of the probability of a hypothesis. According to Bayes’ theorem, a prior is updated by multiplying it with the likelihood – the “measure of the evidential support provided by data for particular parameter values” (Spiegelhalter Reference Spiegelhalter2019, 392) –, resulting in the posterior probability distribution. “In a sense,” argues Sivia (Reference Sivia2006, 6), “Bayes’ theorem encapsulates the process of learning.” It is a principle foundational not only to the spectral template-fitting technique that Nadine used (Chapter 3), but also to machine learning and generative artificial intelligence.
Updating beliefs with Bayes’ theorem can appear to be a purely mechanical operation, but it is also deeply social. Not only are Bayesian priors unavoidably subjective, but every inquiry must begin somewhere and where to begin is a human choice. Social agreements, shared assumptions, and normative considerations are the ground on which data are usable and meaningful. Measuring, and agreeing on the adequacy of measurements, is about sharing “common ground.”Footnote 33 Thomas Kuhn (Reference Kuhn1970) argued that scientific disciplines are “language communities” bound by “concerted agreements on theories, measuring techniques, and characteristic modes of demonstration” (Lynch Reference Lynch and Button1991b, 105fn 1). As we have seen in Chapter 3, learning to make proper measurements is a key element of achieving membership in such a community. Their social and epistemic orders are aligned, and so is the numerical order of the measurements central to their work (cf. Section 8.4.2). Measurements are presented in a “statistical language” that serves as a “technology of intersubjectivity” (Hacking Reference Hacking and McMullin1992b, 152).
The collaborative production of a catalog (and other forms of processed data) may encode a team’s knowledge about noise models and artifacts, but it also serves future users as a shared reference. It brings them “on a page” and allows them to compare their analyses and assess these analyses’ robustness.Footnote 34 In each of the SDSS’s five-year phases, subsequent annual data releases were meant improve earlier ones, but all data releases are still available online. As Alexander Szalay, a long-term SDSS collaboration member, put it: “A data release is like a book. You cannot take it down. People use old editions.”Footnote 35 This adds another view to the uses of writing in research with large datasets that this chapter has explored.

 Open access