





1. Introduction
Electron density models—models of the distribution of free electrons in the Galaxy—are routinely used to convert a dispersion measure (DM) along a given line of sight to an estimated distance, and vice versa. More broadly, they are used extensively in studies of Galactic composition, to describe scintillation and interstellar scattering, and to differentiate between extragalactic fast radio bursts (FRBs) and giant pulse emission from Galactic pulsars.
The DM is related to the integral free electron number density $n_e$
between Earth and a source at distance d. A frequency-dependent time delay,
$n_e$
between Earth and a source at distance d. A frequency-dependent time delay, $\Delta t$
, is imparted to electromagnetic radiation travelling through the ionised plasma along this sight line. For two observing frequencies,
$\Delta t$
, is imparted to electromagnetic radiation travelling through the ionised plasma along this sight line. For two observing frequencies, $\nu_1$
and
$\nu_1$
and $\nu_2$
, the time delay is related to DM by:
$\nu_2$
, the time delay is related to DM by:
 \begin{equation} {\textrm{DM}} \triangleq \int_{0}^{d} n_e\,dl = K \left(\frac{1}{\nu_{1}^{2}}-\frac{1}{\nu^{2}_2}\right)^{-1}\Delta t,\end{equation}
where in SI units, K is given by:
 \begin{equation}K=\frac{2\pi m_e c}{e^2} = 241.0331786(66)\, \textrm{GHz}^{-2}\,\textrm{cm}^{-3}\,\textrm{pc}\,\textrm{s}^{-1}.\end{equation}
Here, e is electron charge, $m_e$
is electron mass, and c is the speed of light,Footnote
a
$m_e$
is electron mass, and c is the speed of light,Footnote
a
The impulsive, broad-band nature of radio pulsar emission means that observations of pulsars can provide measurements of DM—and thus the number of electrons along their sight line. If the electron density along the sight line is known, one can determine the distance to the pulsar, but this requires a Galactic electron density model (GEDM).
Over the years, GEDMs have been derived from independent distance measurements to pulsars (see Section 2). The prevailing GEDMs are NE2001 (Cordes & Lazio Reference Cordes and Lazio2002, Reference Cordes and Lazio2003) and the Yao–Manchester–Wang model (YMW16, Yao, Manchester, & Wang Reference Yao, Manchester and Wang2017). While YMW16 benefits from more recent data and was shown in Yao et al. (Reference Yao, Manchester and Wang2017) to give improved pulsar distance estimates, the NE2001 model is still in widespread use.
Further comparison of the two models was conducted in Deller et al. (Reference Deller2019) on a sample of 57 pulsars with very long baseline interferometry (VLBI) parallax measurements, which indicated (1) the the YWM16 model performs ‘somewhat better’ on high-latitude pulsars in the sample, (2) both models show large errors for some objects, and (3) both models tend to underestimate distances for the sample pulsars.
There is growing evidence from low-DM FRBs that the models may overestimate the Galactic DM contribution—despite neither model including a DM contribution arising from the Galactic halo. The CHIME/FRB Collaboration et al. (2019) report the repeating FRB180916.J0158 + 65 to have a DM of 349.2(3) $\textrm{pc} \, \textrm{cm}^{-3}$
, very close to the 330
$\textrm{pc} \, \textrm{cm}^{-3}$
, very close to the 330 $\textrm{pc} \, \textrm{cm}^{-3}$
Galactic contribution as reported by YMW16. As FRB180916.J0158 + 65 has now been localised to a nearby spiral galaxy (Marcote et al. Reference Marcote2020), it is clear that YMW16 overestimates DM along this line of sight. Similarly, FRB 180430 is placed within the Galaxy by YMW16, but not NE2001 (Qiu et al. Reference Qiu, Bannister, Shannon, Murphy, Bhandari, Agarwal, Lorimer and Bunton2019).
$\textrm{pc} \, \textrm{cm}^{-3}$
Galactic contribution as reported by YMW16. As FRB180916.J0158 + 65 has now been localised to a nearby spiral galaxy (Marcote et al. Reference Marcote2020), it is clear that YMW16 overestimates DM along this line of sight. Similarly, FRB 180430 is placed within the Galaxy by YMW16, but not NE2001 (Qiu et al. Reference Qiu, Bannister, Shannon, Murphy, Bhandari, Agarwal, Lorimer and Bunton2019).
Clearly, there is room for improvement. Simple improvements to the models can be made by refitting parameters after including new independent pulsar distance measurements along individual sightlines, such as the large sample in Deller et al. (Reference Deller2019). Complementary to this approach—and the subject of this paper—qualitative analysis of how and where the models differ can help identify limitations within the models and how these may be improved.
Improved estimates of Galactic DM contribution are of particular concern for FRB studies, as inaccurate estimates may limit the use of FRBs for cosmology. Kumar & Linder (Reference Kumar and Linder2019) argues that for FRBs to be useful as a distance measure, bias in the noncosmological contributions to DM must be kept to under 0.6% of the total DM value: a challenging requirement.
Following Yamasaki & Totani (Reference Yamasaki and Totani2020), the total DM for an extragalactic source can be expressed as a sum of four components:
 \begin{equation} \textrm{DM}_{\textrm{obs}} = \textrm{DM}_{\textrm{ISM}} + \textrm{DM}_{\textrm{halo}} + \textrm{DM}_{\textrm{IGM}} + \textrm{DM}_{\textrm{host}},\end{equation}
where $\textrm{DM}_{\textrm{ISM}}$
is the contribution from the interstellar medium (ISM) in the Milky Way (MW) disc,
$\textrm{DM}_{\textrm{ISM}}$
is the contribution from the interstellar medium (ISM) in the Milky Way (MW) disc, $\textrm{DM}_{\textrm{halo}}$
is the contribution from the extended Galactic halo,
$\textrm{DM}_{\textrm{halo}}$
is the contribution from the extended Galactic halo, $\textrm{DM}_{\textrm{IGM}}$
is that from the intergalactic medium (IGM), and
$\textrm{DM}_{\textrm{IGM}}$
is that from the intergalactic medium (IGM), and $\textrm{DM}_{\textrm{host}}$
is that from the host galaxy (including the source’s local environment). Note that on some sight lines, DM contributions from intervening galaxy halos may also need to be considered (e.g. Prochaska et al. Reference Prochaska2019; Connor et al. Reference Connor2020). Only the
$\textrm{DM}_{\textrm{host}}$
is that from the host galaxy (including the source’s local environment). Note that on some sight lines, DM contributions from intervening galaxy halos may also need to be considered (e.g. Prochaska et al. Reference Prochaska2019; Connor et al. Reference Connor2020). Only the $\textrm{DM}_{\textrm{IGM}}$
component—recently measured by Macquart et al. (Reference Macquart2020)—is of interest for inferring cosmological distance; systematically overestimating or underestimating
$\textrm{DM}_{\textrm{IGM}}$
component—recently measured by Macquart et al. (Reference Macquart2020)—is of interest for inferring cosmological distance; systematically overestimating or underestimating $\textrm{DM}_{\textrm{ISM}}$
by using an inaccurate GEDM may thus bias or confound cosmological efforts.
$\textrm{DM}_{\textrm{ISM}}$
by using an inaccurate GEDM may thus bias or confound cosmological efforts.
In this paper, we present comparisons of the two models, made using a new Python package called PyGEDM that provides a unified interface to the YMW16 and NE2001 codes. Previous comparisons (e.g. Yao et al. Reference Yao, Manchester and Wang2017; Deller et al. Reference Deller2019) have focused on how well the models predict the DM of pulsars with independent distance measurements; here, we compare their estimates on large angular scales.
This paper is organised as follows. In Section 2, we provide a brief overview of NE2001 and YMW16 and introduce the empirical relation between DM, $N_H$
, and
$N_H$
, and $A_{\textrm{V}}$
. In Section 3, we introduce the PyGEDM package. In Section 4, comparisons of YMW16 and NE2001 are made, and model performance is compared against recent pulsar and FRB measurements. The paper concludes with a discussion of model limitations and recommendations for future measurements and improvements.
$A_{\textrm{V}}$
. In Section 3, we introduce the PyGEDM package. In Section 4, comparisons of YMW16 and NE2001 are made, and model performance is compared against recent pulsar and FRB measurements. The paper concludes with a discussion of model limitations and recommendations for future measurements and improvements.
2. Galactic electron density models
Forming a GEDM requires a set of distance measurements to pulsars paired with DM measurements; see Verbiest et al. (Reference Verbiest, Weisberg, Chael, Lee and Lorimer2012) for an overview. The signature of annual parallax is the most common model-independent distance measurement and can be obtained using very long baseline interferometry imaging, or by fitting for variations in the arrival time of radio pulses in precision pulsar timing solutions. For pulsars within the Galactic disc, kinematic distance measurements can be made by use of 21-cm absorption spectra to convert radial velocities of HI clouds along the sight line to distances (however, this requires a Galactic rotation model). A third method is to use an association with nebulae, a globular cluster, or an optical counterpart.
Two of the earliest models of Galactic electron density were the LMT85 model (Manchester & Taylor Reference Manchester and Taylor1981; Lyne, Manchester, & Taylor Reference Lyne, Manchester and Taylor1985) and a model by Vivekanand & Narayan (Reference Vivekanand and Narayan1982), henceforth VK82. The LMT85 model was based on kinematic distance measurements from HI absorption for 36 pulsars and consisted only of three components: a thin disc, a term dependent on height above the Galactic plane, and a model for the Gum Nebula. The VK82 model was similarly simple but was derived independently using data from the Second Molonglo pulsar survey (Manchester et al. Reference Manchester, Lyne, Taylor, Durdin, Large and Little1978).
These models were superseded by the TC93 model (Cordes et al. Reference Cordes, Weisberg, Frail, Spangler and Ryan1991; Taylor & Cordes Reference Taylor and Cordes1993), formed using 74 independent pulsar distance measurements. Measurements of interstellar scattering were also included the model. As our understanding of Galactic structure advanced, and the number of independent distance measurements to pulsars increased, it became clear that an updated model was required to fix shortcomings in TC93.
2.1. NE2001
NE2001, as detailed in Cordes & Lazio (Reference Cordes and Lazio2002, Reference Cordes and Lazio2003) and plotted in the left-hand panels of Figure 1, addressed many of the TC93 model’s shortcomings. NE2001 was formed from 112 pulsar distance measurements (i.e. independent of the GEDM) and 269 scattering measurements. Broadly, NE2001 assumes smoothly varying, large-scale components, then adds in perturbations by small-scale underdense or overdense regions. The model places the Galactic centre at a distance of 8.5 kpc from the Sun, and uses a right-handed Galactocentric coordinate system (x, y, z) with the x-axis parallel to l = 90 $^\circ$
, and y-axis aligned towards l = 180
$^\circ$
, and y-axis aligned towards l = 180 $^\circ$
. The Sun is located in the disc, at (x = 0, y = 8 500 pc, z = 0). The Galactic structure consists of a thin Gaussian annulus and thick axisymmetric disc, and spiral arms. Local components—the hot ‘Local Bubble’ surrounding the Sun, Gum Nebula, Vela Supernova Remnant (SNR), Loop 1, and a few other features—are also included in the model, along with a Galactic centre component. NE2001 also invokes so-called ‘clumps’ and ‘voids’, to account for sightlines where measurements suggest over and underdense regions, respectively.
$^\circ$
. The Sun is located in the disc, at (x = 0, y = 8 500 pc, z = 0). The Galactic structure consists of a thin Gaussian annulus and thick axisymmetric disc, and spiral arms. Local components—the hot ‘Local Bubble’ surrounding the Sun, Gum Nebula, Vela Supernova Remnant (SNR), Loop 1, and a few other features—are also included in the model, along with a Galactic centre component. NE2001 also invokes so-called ‘clumps’ and ‘voids’, to account for sightlines where measurements suggest over and underdense regions, respectively.
Electron density of NE2001 (left) and YMW16 (right) models, in the Galactic plane ( $z=0$
). The NE2001 model extends to
$z=0$
). The NE2001 model extends to $\pm$
17 kpc, whereas YMW16 extends to a radius
$\pm$
17 kpc, whereas YMW16 extends to a radius $\pm$
30 kpc. The Sun (red cross) is placed at
$\pm$
30 kpc. The Sun (red cross) is placed at $x=0$
,
$x=0$
, $y=8\,500$
pc,
$y=8\,500$
pc, $z=0$
in NE2001, and at
$z=0$
in NE2001, and at $x=0$
,
$x=0$
, $y=8\,300$
pc,
$y=8\,300$
pc, $z=6$
pc in YMW16. The top panels show large-scale Galactic structure; differences in the spiral arm structure are visible. The bottom panels show the local ISM in a
$z=6$
pc in YMW16. The top panels show large-scale Galactic structure; differences in the spiral arm structure are visible. The bottom panels show the local ISM in a $\pm$
1 kpc region centred about the Sun. The large ellipses in NE2001 (bottom left) correspond to a ‘local superbubble’ and ‘low-density region’, which are not included in the YMW16 model. The local ‘clumps’ of NE2001, also not used in YMW16, are also visible as small circular regions. The local ISM in the YMW16 model (bottom right) has visibly fewer components; identifiable are the Gum Nebula, Local Bubble, Loop I, and Carina-Saggitarius spiral arm.
$\pm$
1 kpc region centred about the Sun. The large ellipses in NE2001 (bottom left) correspond to a ‘local superbubble’ and ‘low-density region’, which are not included in the YMW16 model. The local ‘clumps’ of NE2001, also not used in YMW16, are also visible as small circular regions. The local ISM in the YMW16 model (bottom right) has visibly fewer components; identifiable are the Gum Nebula, Local Bubble, Loop I, and Carina-Saggitarius spiral arm.
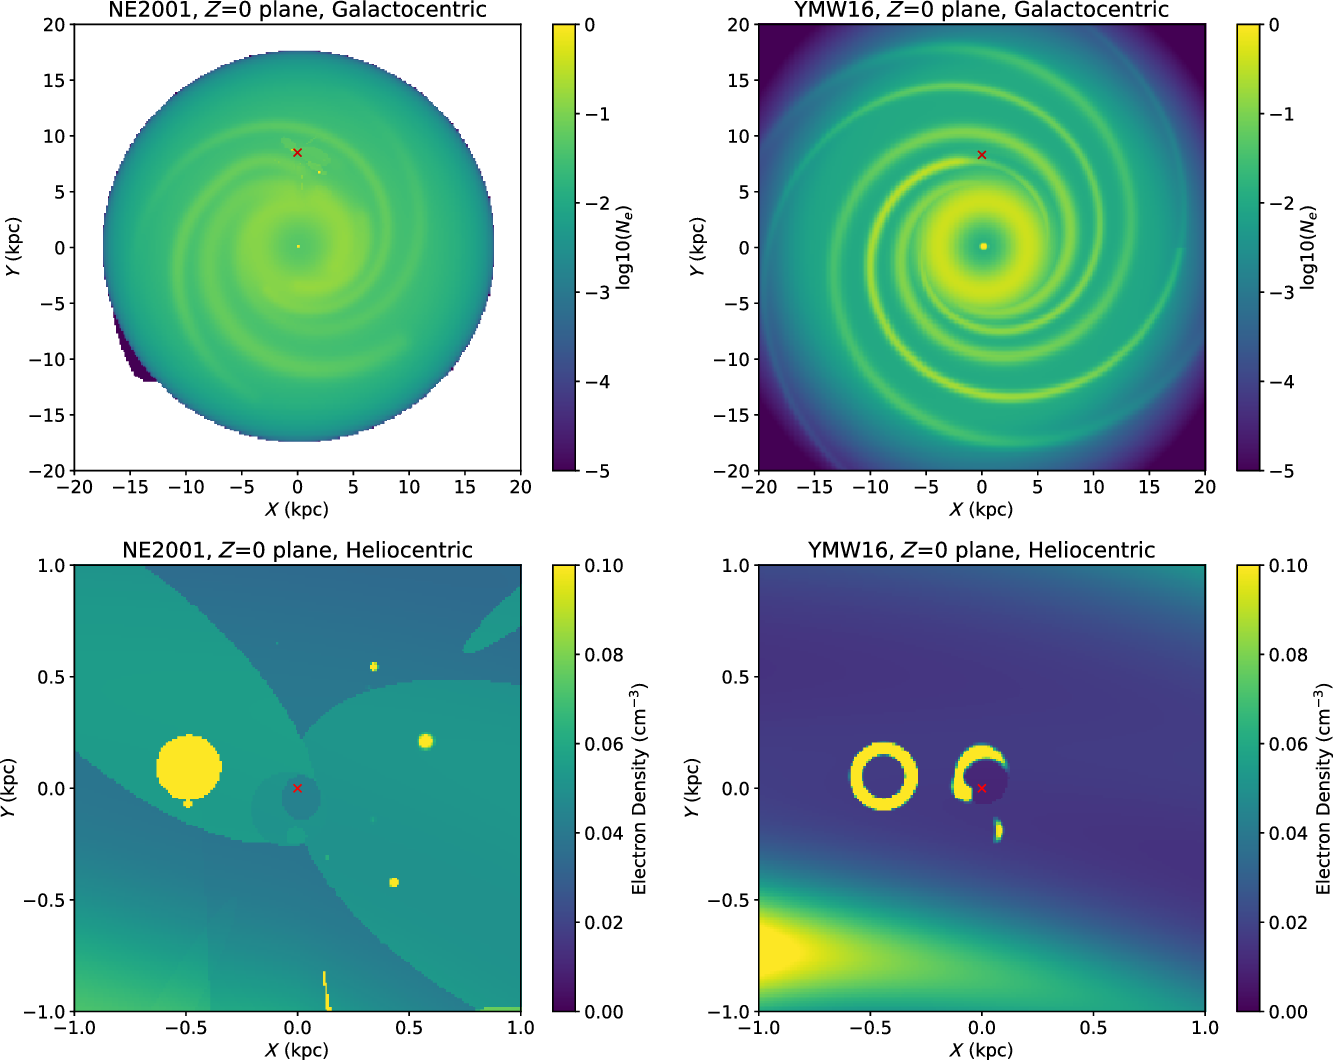
NE2001 uses an an iterative approach to parameter fitting (see Section 5 of Cordes & Lazio Reference Cordes and Lazio2003). Preliminary values from the TC93 were used, then parameters for large-scale components were fit by use of a likelihood function, followed by parameters from the local ISM; this process was then iterated.
2.2. YMW16
YMW16, as detailed in Yao et al. (Reference Yao, Manchester and Wang2017), and plotted in the right-hand panels of Figure 1, has the significant advantage of 15 yr of additional data to use when fitting their model. Over the intervening years, systematic issues with NE2001 were identified, which also informed the YMW16 model. Firstly, NE2001 systematically underestimates the z-distance for pulsars at high Galactic latitude (Lorimer et al. Reference Lorimer2006), due partly to the scale height for the thick disc being too small, which is evidenced by new observational measurements (Gaensler et al. Reference Gaensler, Madsen, Chatterjee and Mao2008; Savage & Wakker Reference Savage and Wakker2009). The NE2001 model was also found to overpredict distances for some local pulsars (Chatterjee et al. Reference Chatterjee2009).
YMW16 uses 189 independent pulsar distance measurements, but unlike NE2001 does not make use of interstellar scattering measurements, arguing that scattering is generally dominated by a few regions along the path to a pulsar, so scattering measurements do not inform about large-scale structure.
In YMW16, the Sun is placed at (x = 0, y = 8 300 pc z = 6 pc), which includes an offset from the Galactic plane as reported in Joshi et al. (Reference Joshi, Dambis, Pandey and Joshi2016). Like NE2001, YMW16 uses three major Galactic components. The first, an axisymmetric thick disc, is modelled in a similar fashion to NE2001. However, its thin disc component is modelled both radially and vertically with $sech^2$
functions, and it uses a four-spiral-arm model Hou & Han (Reference Hou and Han2014) in contrast to the modified spiral pattern used in NE2001. Seven local features—the Local Bubble, regions of enhanced density nearby the Local Bubble, the Gum Nebula, Loop I (Berkhuijsen, Haslam, & Salter Reference Berkhuijsen, Haslam and Salter1971), a enhanced region in the Carina arm, and a low-density pocket in the Sagittarius tangential region—are included in the YMW16 model, similar to NE2001. YMW16 also provides a models for the Magellanic clouds and IGM. Beyond these features, YMW16 rejects the use of voids and clumps for pulsar-specific optimisation, arguing this is poor practice as it leads to overfitting. Further comparison of the features in the two models can be found in Section 5.2 of Yao et al. (Reference Yao, Manchester and Wang2017).
$sech^2$
functions, and it uses a four-spiral-arm model Hou & Han (Reference Hou and Han2014) in contrast to the modified spiral pattern used in NE2001. Seven local features—the Local Bubble, regions of enhanced density nearby the Local Bubble, the Gum Nebula, Loop I (Berkhuijsen, Haslam, & Salter Reference Berkhuijsen, Haslam and Salter1971), a enhanced region in the Carina arm, and a low-density pocket in the Sagittarius tangential region—are included in the YMW16 model, similar to NE2001. YMW16 also provides a models for the Magellanic clouds and IGM. Beyond these features, YMW16 rejects the use of voids and clumps for pulsar-specific optimisation, arguing this is poor practice as it leads to overfitting. Further comparison of the features in the two models can be found in Section 5.2 of Yao et al. (Reference Yao, Manchester and Wang2017).
Overall, the YMW16 model has 117 parameters; 35 parameters are fitted by using an optimisation routine, with the other parameters fixed to values from the literature. Parameter fitting was performed using the PSwarm ‘particle swarm’ algorithm (see Section 4 of Yao et al. Reference Yao, Manchester and Wang2017).
2.3. Galactic halo models
YMW16 and NE2001 do not model the DM contribution from the Galactic halo, $\textrm{DM}_{\textrm{halo}}$
. While modelling the halo is not necessary for pulsars within the Milky Way, a model of the halo is necessary for determining
$\textrm{DM}_{\textrm{halo}}$
. While modelling the halo is not necessary for pulsars within the Milky Way, a model of the halo is necessary for determining $\textrm{DM}_{\textrm{host}}$
and
$\textrm{DM}_{\textrm{host}}$
and $\textrm{DM}_{\textrm{IGM}}$
extragalactic sources such as FRBs. Here, we provide a brief overview of estimates for
$\textrm{DM}_{\textrm{IGM}}$
extragalactic sources such as FRBs. Here, we provide a brief overview of estimates for $\textrm{DM}_{\textrm{halo}}$
, starting with a toy model where we assume baryons in the halo are distributed spherically and with uniform density out to the virial radius.
$\textrm{DM}_{\textrm{halo}}$
, starting with a toy model where we assume baryons in the halo are distributed spherically and with uniform density out to the virial radius.
It is well established that the baryons residing in galaxies in the form of stars and cold or warm gas account for only a fraction of the baryons measured in the the $\Lambda$
CDM model. These baryons are predominantly thought to reside in the IGM, but some are expected to reside within the virial radii of galaxies. The baryonic mass of the Milky Way that has been accounted for directly is
$\Lambda$
CDM model. These baryons are predominantly thought to reside in the IGM, but some are expected to reside within the virial radii of galaxies. The baryonic mass of the Milky Way that has been accounted for directly is $\approx{\!\kern1pt7} \,\times\, 10^{10}$ ${\rm M}_\odot$
(Flynn et al. Reference Flynn, Holmberg, Portinari, Fuchs and Jahreiß2006), while its dark matter halo has a mass order
${\rm M}_\odot$
(Flynn et al. Reference Flynn, Holmberg, Portinari, Fuchs and Jahreiß2006), while its dark matter halo has a mass order $1.2 \,\times\, 10^{12}$ ${\rm M}_\odot$
and a virial radius of order 200 kpc (Wang et al. Reference Wang, Han, Cooper, Cole,
and Lowing2015). Assuming the Milky Way has captured the cosmic fraction of baryons to dark matter (
${\rm M}_\odot$
and a virial radius of order 200 kpc (Wang et al. Reference Wang, Han, Cooper, Cole,
and Lowing2015). Assuming the Milky Way has captured the cosmic fraction of baryons to dark matter ( $\approx{\!\kern1.1pt0.15}$
), we estimate
$\approx{\!\kern1.1pt0.15}$
), we estimate $\approx{\!1.3} \,\times\, 10^{11}$
hot baryons in the halo. The DM is then given by
$\approx{\!1.3} \,\times\, 10^{11}$
hot baryons in the halo. The DM is then given by $R_{\mathrm{vir}} n_e$
, where
$R_{\mathrm{vir}} n_e$
, where $n_e$
is the electron number density. Taking
$n_e$
is the electron number density. Taking $M_{\rm B}$
is the mass in baryons in the halo,
$M_{\rm B}$
is the mass in baryons in the halo, $m_p$
as the proton mass, and
$m_p$
as the proton mass, and $R_{\textrm{vir}}$
is the virial radius, the electron density
$R_{\textrm{vir}}$
is the virial radius, the electron density $n_e$
is given by
$n_e$
is given by $(M_{\rm B}/m_p)/V$
where V is
$(M_{\rm B}/m_p)/V$
where V is $\frac{4}{3}\pi R_{\rm vir}^3$
. Inserting typical values yields DM
$\frac{4}{3}\pi R_{\rm vir}^3$
. Inserting typical values yields DM $= 30$ $\textrm{pc} \, \textrm{cm}^{-3}$
for the Milky Way.
$\textrm{pc} \, \textrm{cm}^{-3}$
for the Milky Way.
This toy model is broadly consistent with what is found in hydrodynamical simulations of galaxy formation in a cosmological context. For example, Dolag et al. (Reference Dolag, Gaensler, Beck and Beck2015) analyse a Milky Way-like galaxy from such simulations, find a range of DM in the (lumpy) halo of 40 to 70 $\textrm{pc} \, \textrm{cm}^{-3}$
somewhat more than the simple estimate of 30
$\textrm{pc} \, \textrm{cm}^{-3}$
somewhat more than the simple estimate of 30 $\textrm{pc} \, \textrm{cm}^{-3}$
above.
$\textrm{pc} \, \textrm{cm}^{-3}$
above.
2.3.1. Halo DM estimates via diffuse gas
Prochaska & Zheng (Reference Prochaska and Zheng2019) (henceforth PZ19) estimate $\textrm{DM}_{\textrm{halo}}$
by fitting two components:
$\textrm{DM}_{\textrm{halo}}$
by fitting two components: $T\sim{\!10}^4$
K gas (which they refer to as ‘cool’) and
$T\sim{\!10}^4$
K gas (which they refer to as ‘cool’) and $T\sim{\!10}^6$
K gas (referred to as ‘hot’):
$T\sim{\!10}^6$
K gas (referred to as ‘hot’):
 \begin{equation} \textrm{DM}_{\textrm{halo}} = \textrm{DM}_{\textrm{halo,cool}} + \textrm{DM}_{\textrm{halo,hot}}.\end{equation}
For their cool component, they isolate high-velocity clouds (HVCs) with velocities $>100$
kms-1 from HI4PI data (HI4PI Collaboration et al. 2016), to produce a
$>100$
kms-1 from HI4PI data (HI4PI Collaboration et al. 2016), to produce a $N_{H,\textrm{HVC}}$
map for HVCs only. These data are combined with column density measurements of
$N_{H,\textrm{HVC}}$
map for HVCs only. These data are combined with column density measurements of $\mathrm{Si}_{\textrm{II}}$
and
$\mathrm{Si}_{\textrm{II}}$
and $\mathrm{Si}_{\textrm{III}}$
from the Richter et al. (Reference Richter2017) HVC survey, which are dominant ions of silicon at
$\mathrm{Si}_{\textrm{III}}$
from the Richter et al. (Reference Richter2017) HVC survey, which are dominant ions of silicon at $T\sim{\!10}^4$
K. PZ19 finds an average value of
$T\sim{\!10}^4$
K. PZ19 finds an average value of $\textrm{DM}_{\textrm{halo,cool}}\approx{\!\kern1pt20}$ $\textrm{pc} \, \textrm{cm}^{-3}$
. For the hot component, PZ19 analyse measurements of
$\textrm{pc} \, \textrm{cm}^{-3}$
. For the hot component, PZ19 analyse measurements of $\mathrm{O}_{\textrm{VI}}$
and
$\mathrm{O}_{\textrm{VI}}$
and $\mathrm{O}_{\textrm{VII}}$
X-ray absorption spectra (Fang et al. Reference Fang, Buote, Bullock and Ma2015) and estimate that the ionised plasma revealed by these tracers adds a contribution
$\mathrm{O}_{\textrm{VII}}$
X-ray absorption spectra (Fang et al. Reference Fang, Buote, Bullock and Ma2015) and estimate that the ionised plasma revealed by these tracers adds a contribution $\textrm{DM}_{\textrm{halo, hot}}$
= 50 – 80
$\textrm{DM}_{\textrm{halo, hot}}$
= 50 – 80 $\textrm{pc} \, \textrm{cm}^{-3}$
.
$\textrm{pc} \, \textrm{cm}^{-3}$
.
Das et al. (Reference Das, Mathur, Gupta, Nicastro and Krongold2021) (henceforth D20) use a similar approach to PZ19 but do not directly differentiate between the disc and halo. Instead, they model the overall Galactic DM contribution, $\textrm{DM}_{\textrm{MW}}$
, as a combination of four phases:
$\textrm{DM}_{\textrm{MW}}$
, as a combination of four phases:
 \begin{equation} \textrm{DM}_{\textrm{MW}} = \textrm{DM}_{\textrm{cold}} + \textrm{DM}_{\textrm{cool}} + \textrm{DM}_{\textrm{warm}} + \textrm{DM}_{\textrm{hot}},\end{equation}
where the four components refer to gas at ${\sim}$
10
${\sim}$
10 $^4$
,
$^4$
, $10^4$
–
$10^4$
– $10^5$
,
$10^5$
, $10^5$
–
$10^5$
– $10^{5.5}$
, and
$10^{5.5}$
, and $>\!\!\kern1pt{10}^6$
K, respectively. Note that these designations differ from the temperature ranges typically used to refer to gas phases in the ISM. Their ‘cold’ and ‘hot’ phases are found to be the primary contributors to
$>\!\!\kern1pt{10}^6$
K, respectively. Note that these designations differ from the temperature ranges typically used to refer to gas phases in the ISM. Their ‘cold’ and ‘hot’ phases are found to be the primary contributors to $\textrm{DM}_{\textrm{MW}}$
, by at least an order of magnitude.
$\textrm{DM}_{\textrm{MW}}$
, by at least an order of magnitude.
Combined, D20 find a median $\textrm{DM}_{\textrm{MW}}=64^{+20}_{-23}$ $\textrm{pc} \, \textrm{cm}^{-3}$
, covering with a large scatter—two orders of magnitude, 33 – 172
$\textrm{pc} \, \textrm{cm}^{-3}$
, covering with a large scatter—two orders of magnitude, 33 – 172 $\textrm{pc} \, \textrm{cm}^{-3}$
(68% confidence interval). This scatter is not predicted by smooth disc + halo models and is supportive of the hot halo component being inhomogeneous and anisotropic.
$\textrm{pc} \, \textrm{cm}^{-3}$
(68% confidence interval). This scatter is not predicted by smooth disc + halo models and is supportive of the hot halo component being inhomogeneous and anisotropic.
Keating & Pen (Reference Keating and Pen2020) use gas profile models of the Galactic halo and incorporate constraints from X-ray observations to compute predicted values of $\textrm{DM}_{\textrm{halo}}$
. Values of
$\textrm{DM}_{\textrm{halo}}$
. Values of $\textrm{DM}_{\textrm{halo}}$
below 55
$\textrm{DM}_{\textrm{halo}}$
below 55 $\textrm{pc} \, \textrm{cm}^{-3}$
are favoured; however predictions for models allowed by X-ray constraints span more than an order of magnitude, reaching as low as 6
$\textrm{pc} \, \textrm{cm}^{-3}$
are favoured; however predictions for models allowed by X-ray constraints span more than an order of magnitude, reaching as low as 6 $\textrm{pc} \, \textrm{cm}^{-3}$
.
$\textrm{pc} \, \textrm{cm}^{-3}$
.
2.3.2. Halo DM estimates via pulsars and FRBs
Another way to estimate the halo DM is to use pulsars at high Galactic latitudes and in the Magellanic clouds. The clouds are sufficiently distant ( $\sim{\!50}$
kpc) that most of the DM in an NFW-like distribution of hot baryons is within their Galactocentric radii (Navarro, Frenk, & White Reference Navarro, Frenk and White1997). Pulsars have a range of DMs in the Large Magellanic Cloud (LMC) from 65 to 200
$\sim{\!50}$
kpc) that most of the DM in an NFW-like distribution of hot baryons is within their Galactocentric radii (Navarro, Frenk, & White Reference Navarro, Frenk and White1997). Pulsars have a range of DMs in the Large Magellanic Cloud (LMC) from 65 to 200 $\textrm{pc} \, \textrm{cm}^{-3}$
(using data available in PSRCATFootnote
b
; Manchester et al. Reference Manchester, Hobbs, Teoh and Hobbs2005). Assuming that the lower DM value of 65
$\textrm{pc} \, \textrm{cm}^{-3}$
(using data available in PSRCATFootnote
b
; Manchester et al. Reference Manchester, Hobbs, Teoh and Hobbs2005). Assuming that the lower DM value of 65 $\textrm{pc} \, \textrm{cm}^{-3}$
represents pulsars least affected by the LMC’s own ISM, and that 50
$\textrm{pc} \, \textrm{cm}^{-3}$
represents pulsars least affected by the LMC’s own ISM, and that 50 $\textrm{pc} \, \textrm{cm}^{-3}$
of this is due to the disc ISM in the direction of the LMC (as estimated by both the NE2001 and YMW16 models), this yields a lower limit on the halo DM (in this direction) of approximately 15
$\textrm{pc} \, \textrm{cm}^{-3}$
of this is due to the disc ISM in the direction of the LMC (as estimated by both the NE2001 and YMW16 models), this yields a lower limit on the halo DM (in this direction) of approximately 15 $\textrm{pc} \, \textrm{cm}^{-3}$
.
$\textrm{pc} \, \textrm{cm}^{-3}$
.
Platts, Prochaska, & Law (Reference Platts, Prochaska and Law2020) have made a similar analysis using the DMs of Galactic pulsars combined with the DMs of published FRBs, introducing a kernel density estimation technique to find lower and upper bounds for $\textrm{DM}_{\textrm{halo}}$
. They place a constraint of
$\textrm{DM}_{\textrm{halo}}$
. They place a constraint of $-2<\textrm{DM}_{\textrm{halo}}< 123$ $\textrm{pc} \, \textrm{cm}^{-3}$
(95% confidence interval), assuming a spherical distribution of the baryons. Tighter constraints may be derived using the Platts et al. (Reference Platts, Prochaska and Law2020) framework as the sample of FRBs grows, and in particular as more low-DM (i.e. nearby) FRBs are found.
$\textrm{pc} \, \textrm{cm}^{-3}$
(95% confidence interval), assuming a spherical distribution of the baryons. Tighter constraints may be derived using the Platts et al. (Reference Platts, Prochaska and Law2020) framework as the sample of FRBs grows, and in particular as more low-DM (i.e. nearby) FRBs are found.
A summary table of estimates for different model approaches is given in Table 1.
Summary of halo DM contribution from model estimates. Note Das et al. (Reference Das, Mathur, Gupta, Nicastro and Krongold2021) estimate is for the full Galactic DM contribution, $\textrm{DM}_{\textrm{MW}}$

2.3.3. YT20
Observational support that a simple symmetric spherical halo model is inadequate comes from X-ray observations of diffuse halo (e.g. Nakashima et al. Reference Nakashima, Inoue, Yamasaki, Sofue, Kataoka and Sakai2018). They favour a two-component model: a spherical component extending up to 200 kpc, and a compact disc-like component that is geometrically distinct from the thick disc in ISM models.
Yamasaki & Totani (Reference Yamasaki and Totani2020) (henceforth YT20) provide a two-component model fit to the observations of diffuse X-ray emission. YT20 predicts $\textrm{DM}_{\textrm{halo}}$
to be 30 – 245
$\textrm{DM}_{\textrm{halo}}$
to be 30 – 245 $\textrm{pc} \, \textrm{cm}^{-3}$
over the whole sky, with a mean of 43
$\textrm{pc} \, \textrm{cm}^{-3}$
over the whole sky, with a mean of 43 $\textrm{pc} \, \textrm{cm}^{-3}$
.
$\textrm{pc} \, \textrm{cm}^{-3}$
.
Estimates of $\textrm{DM}_{\textrm{halo}}$
from the YT20 model (Yamasaki & Totani Reference Yamasaki and Totani2020).
$\textrm{DM}_{\textrm{halo}}$
from the YT20 model (Yamasaki & Totani Reference Yamasaki and Totani2020).
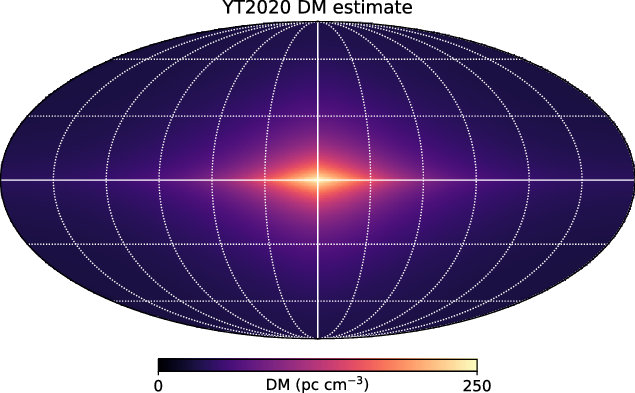
The YT20 model consists of a spherical halo that extends to the virial radius (200 kpc), and a compact disc-like component. This disc-like component differs in physical properties (i.e. temperature and geometrical shape) from the ISM’s thick disc, as included in NE2001 and YMW16. An all-sky map of the YT20 model is shown in Figure 2.
While the gas distribution of the halo disc-like component overlaps with the ISM thick disc component, the YT20 authors argue it is reasonable to add the DM prediction from YMW16/NE2001 to estimate the total Galactic DM budget:
 \begin{equation} \textrm{DM}_{\textrm{MW}} = \textrm{DM}_{\textrm{YT20}} + \textrm{DM}_{\textrm{YMW16}}.\end{equation}
However, as the gas distribution of the ISM thick disc and YT20 disc-like component overlap, GEDM models may overestimate the density of the thick disc; adding YT20 and YW16 estimates of DM may result in an overestimate for $\textrm{DM}_{\textrm{MW}}$
.
$\textrm{DM}_{\textrm{MW}}$
.
Currently, YT20 is the only halo model with multiple components, giving rise to direction-dependent DM estimates. We provide an interface to YT20 as part of PyGEDM.
3. PyGEDM
We have developed a Python package, PyGEDM, which provides access to the NE2001 and YMW16 models of the ISM, and YT20 model of Galactic halo. Unit and coordinate conversions are handled using the Astropy package (Astropy Collaboration et al. 2013), and Healpy (Zonca et al. Reference Zonca, Singer, Lenz, Reinecke, Rosset, Hivon and Gorski2019) is used to generate all-sky maps. The PyGEDM code is open source and freely available online.Footnote c
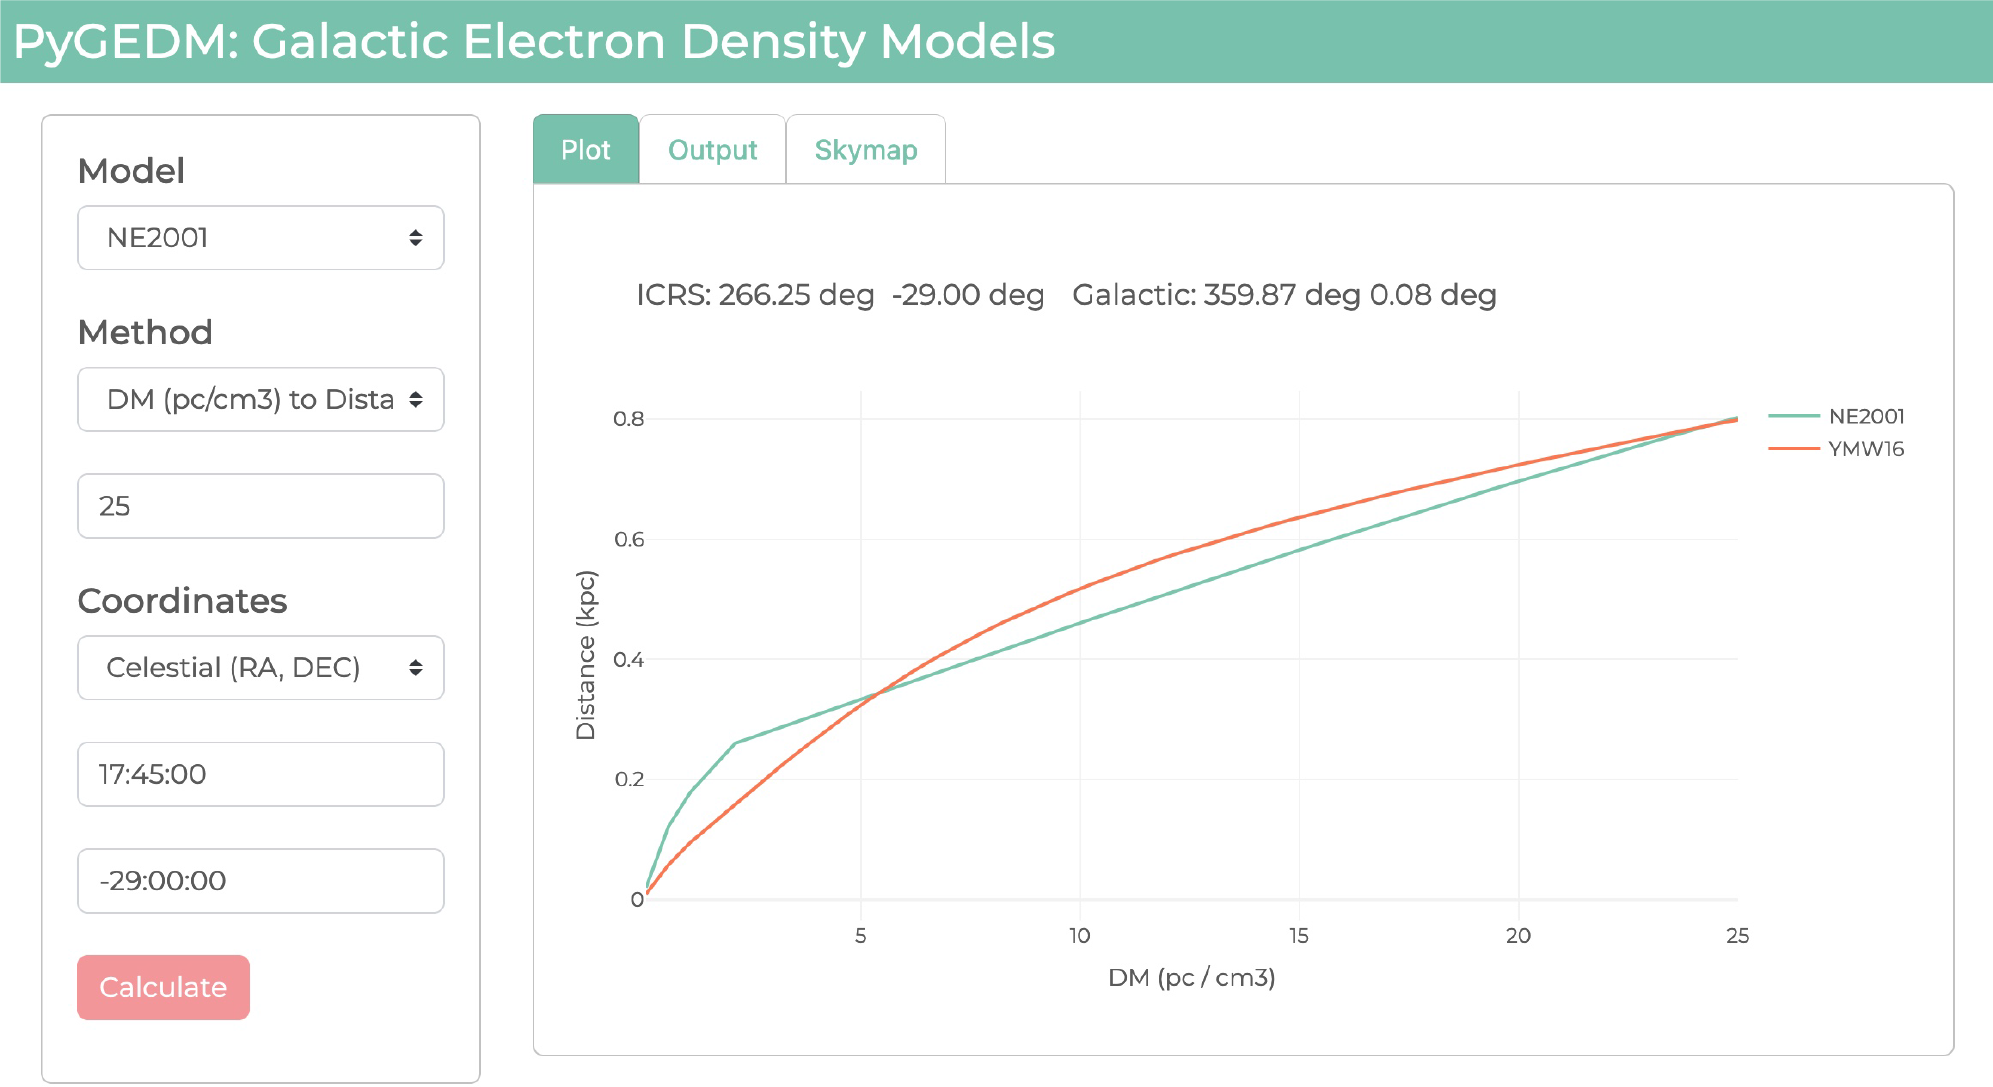
PyGEDM can be installed via the Python package manager with a single command (pip install pygedm), and build files are provided for the DockerFootnote d containerisation platform. A test suite is included to ensure code output is consistent with the YMW16 and NE2001 online interfaces. Searchable online documentation of the PyGEDM API is provided at https://pygedm.readthedocs.io. Additionally, an online interface to convert between distance and dispersion measure for the NE2001 and YMW16 models is available as a web app at http://apps.datacentral.org.au/pygedm/ (Fig. 3).
PyGEDM provides a unified application programming interface (API) in Python, with the intention that it can be used as an upstream dependency for other projects. By doing so, changes to PyGEDM—for example, the addition of new GEDMs—can be immediately leveraged by downstream projects and data analysis codes. An example use case is for population synthesis codes such as Frbpoppy Footnote e (Gardenier et al. Reference Gardenier, van Leeuwen, Connor and Petroff2019) and PsrPopPy Footnote f (Bates et al. Reference Bates, Lorimer, Rane and Swiggum2014), for FRB and pulsars, respectively. These codes currently wrap a precompiled version of the NE2001 model. PyGEDM is used by Fruitbat Footnote g (Batten Reference Batten2019), which computes the redshift of FRBs for given cosmological models.
Screenshot of PyGEDM web app, with example output.
Both the YMW16 and NE2001 codes are written in performant, statically compiled languages (C and Fortran, respectively). Python provides methods to interface with both C and Fortran code; in PyGEDM, we use pybind11 Footnote h to interact with compiled library versions of the code. pybind11 is a library that exposes Python types in C++, and vice versa.
3.1. An interface to NE2001 using f2c and pybind11
Compiling the NE2001 code requires a Fortran compiler such as gfortran. To provide an interface to NE2001 via pybind11, and to avoid the need for a Fortran compiler, we used the f2c Fortran to C conversion program to convert the NE2001 codebase to C. While NE2001 is mostly compliant with the Fortran 77 standard, some reordering of statements was required to satisfy the f2c utility. The converted C code is available within the PyGEDM repository.
Before deciding on using f2c and pybind11, we used the f2py utility—part of the Numpy package (van der Walt, Colbert, & Varoquaux Reference van der Walt, Colbert and Varoquaux2011)—to generate compiled extension modules that can be used in Python. This required adding special comment lines defined by f2py to the NE2001 Fortran code, which the Fortran compiler ignores but inform f2py whether arguments are meant as inputs, outputs, or both. When the PyGEDM Python package is installed, a Fortran compiler is called to compile NE2001 code, then f2py is run to compile Python-compatible shared objects. However, we found that this approach was not portable across different architectures and systems. As of writing, there is no native Fortran compiler for the Apple Silicon M1 architecture, and several users reported that installing PyGEDM via pip install pygedm did not work. We also found issues setting up continuous integration testing with Fortran, and hence ultimately abandoned this approach.
Using f2c-converted C code alleviates issues with Fortran compilers but adds a requirement that the user has the f2c.h header and corresponding library installed. We find pybind11 to be more robust and easier to debug during installation of the Python package. The pybind11 approach also allows a more Pythonic API: the C++ std::map container is presented as a dict to Python. We use this to return a dictionary of key–value pairs when the C++ function is called.
Other open-source codes to allow Python access to NE2001 are available. pyne2001 Footnote i calls the NE2001 executable and parses the resulting text output; this approach requires no changes to the Fortran code but is slower than access via pybind11. The FRBs/ne2001 Footnote j code is a pure Python re-implementation of the NE2001 code, not guaranteed to give identical results to the Fortran NE2001 code, and is considerably slower. The Frbpoppy and PsrPoppy codes compile NE2001 as a shared library and then access it via Python ctypes.
We tested the speed of these approaches by installing all software within a Docker container, and then calling the relevant Python API to calculate the DM for a point 10 kpc away in the direction of the Galatic centre (b = 0, l = 0). The Docker container was run on a Macbook Pro laptop (2020) with the Apple Silicon M1 chip, and the %timeit magic function was used in an iPython shell to find the average runtime. We found the raw ctypes method to be the fastest at ${\sim}$
110
${\sim}$
110
 $$\textbf {\mu}$$
s per call, with our pybind11 approach taking
$$\textbf {\mu}$$
s per call, with our pybind11 approach taking ${\sim}$
790
${\sim}$
790
 $$\textbf{\mu}$$
s. We attribute the overhead to the construction of the std::map, and conversion to Astropy quantities. pyne2001 is roughly 70 times slower than the ctypes approach, at
$$\textbf{\mu}$$
s. We attribute the overhead to the construction of the std::map, and conversion to Astropy quantities. pyne2001 is roughly 70 times slower than the ctypes approach, at $\sim{\!7.96}$
ms. Finally, the pure Python ne2001 implementation takes
$\sim{\!7.96}$
ms. Finally, the pure Python ne2001 implementation takes ${\sim}$
2.6 s: several orders of magnitude slower.
${\sim}$
2.6 s: several orders of magnitude slower.
Although speed is important in some use cases, code maintainability, adaptability, and usability are also important considerations. While our approach is slower than using raw ctypes, overhead within Python, such as attribute lookup for variables within for loops, is likely to be the main bottleneck for most programs using PyGEDM. An approach to speed up loops over multiple lines of sight would be to move the loop into C++, which could be achieved via the built-in support for Numpy arrays in pybind11.
3.2. An interface to YMW16 and YT20
As YMW16 is written in C, only minor changes to the underlying code were required in order to create Python bindings using pybind11. We added a main.cpp file, in which the pybind11 module is defined. As with the NE2001 interface, we modified the YMW16 API to return std::map containers, which are presented in Python as dictionaries of key–value pairs.
The YT20 code in PyGEDM is adapted from DM_halo_yt2020_numerical.py, provided by S. Yamasaki. As there were no extra dependencies, integration with PyGEDM was straightforward; some minor changes to coding style were made for uniformity.
3.3. The PyGEDM API
The PyGEDM code provides the following methods:
-
dm_to_dist—Convert a DM to a distance for a given line of sight in Galactic (l, b) coordinates (NE2001 and YMW16).
-
dist_to_dm—Convert a distance to a DM for a given line of sight (NE2001 and YMW16).
-
calculate_electron_density_xyz—Evaluate the electron density at a given Galactocentric (x, y, z) coordinate (NE2001 and YMW16).
-
calculate_electron_density_lbr—Evaluate electron density at a given distance along line of sight in Galactic coordinates (l, b), to a distance r (NE2001 and YMW16).
-
generate_healpix_dm_map—Generate an all-sky healpix map for a given distance r (NE2001, YMW16, and YT20).
-
calculate_halo_dm—Compute $\textrm{DM}_{\textrm{halo}}$
for a given (l, b) pointing (YT20).
$\textrm{DM}_{\textrm{halo}}$
for a given (l, b) pointing (YT20). -
convert_lbr_to_xyz—Convert Galactic (l, b, r) coordinates to Galactocentric (x, y, z) coordinates (NE2001 or YMW16—the two models place the Galactic centre at different distances).

Selection between YMW16, NE2001, and YT20 models is done by use of a method argument. We envisage adding support for future models as they become available.
3.4. Containerisation
Docker is an open-source containerisation platform, which is used to package up code and its dependencies into a standardised executable that can be built and deployed in a reproducable way. As part of the PyGEDM repository, we provide a Dockerfile, from which a Docker container for PyGEDM can be generated.
3.5. Integration testing
Neither NE2001 or YMW16 are supplied with a testing framework, so we tested the output of PyGEDM against the online interfaces at https://www.nrl.navy.mil/rsd/RORF/ne2001/ (NE2001, now defunct), and https://www.atnf.csiro.au/research/pulsar/ymw16/ (YMW16). To ensure future development does not alter code output, we wrote unit tests using pytest that check code output against known correct values. We have set up CI testing using Github actions to automatically run the unit tests whenever code is pushed to the PyGEDM repository.
Code coverage—a report of what parts of code are executed by the tests—is analysed using Codecov.ioFootnote k for all Python code in PyGEDM; all Python code is covered by unit tests (i.e. 100% code coverage). Full coverage ensures that all functions are tested for correctness. We have not attempted to write unit tests for the underlying NE2001 or YMW16 code but suggest that future GEDMs should do so as a matter of course.
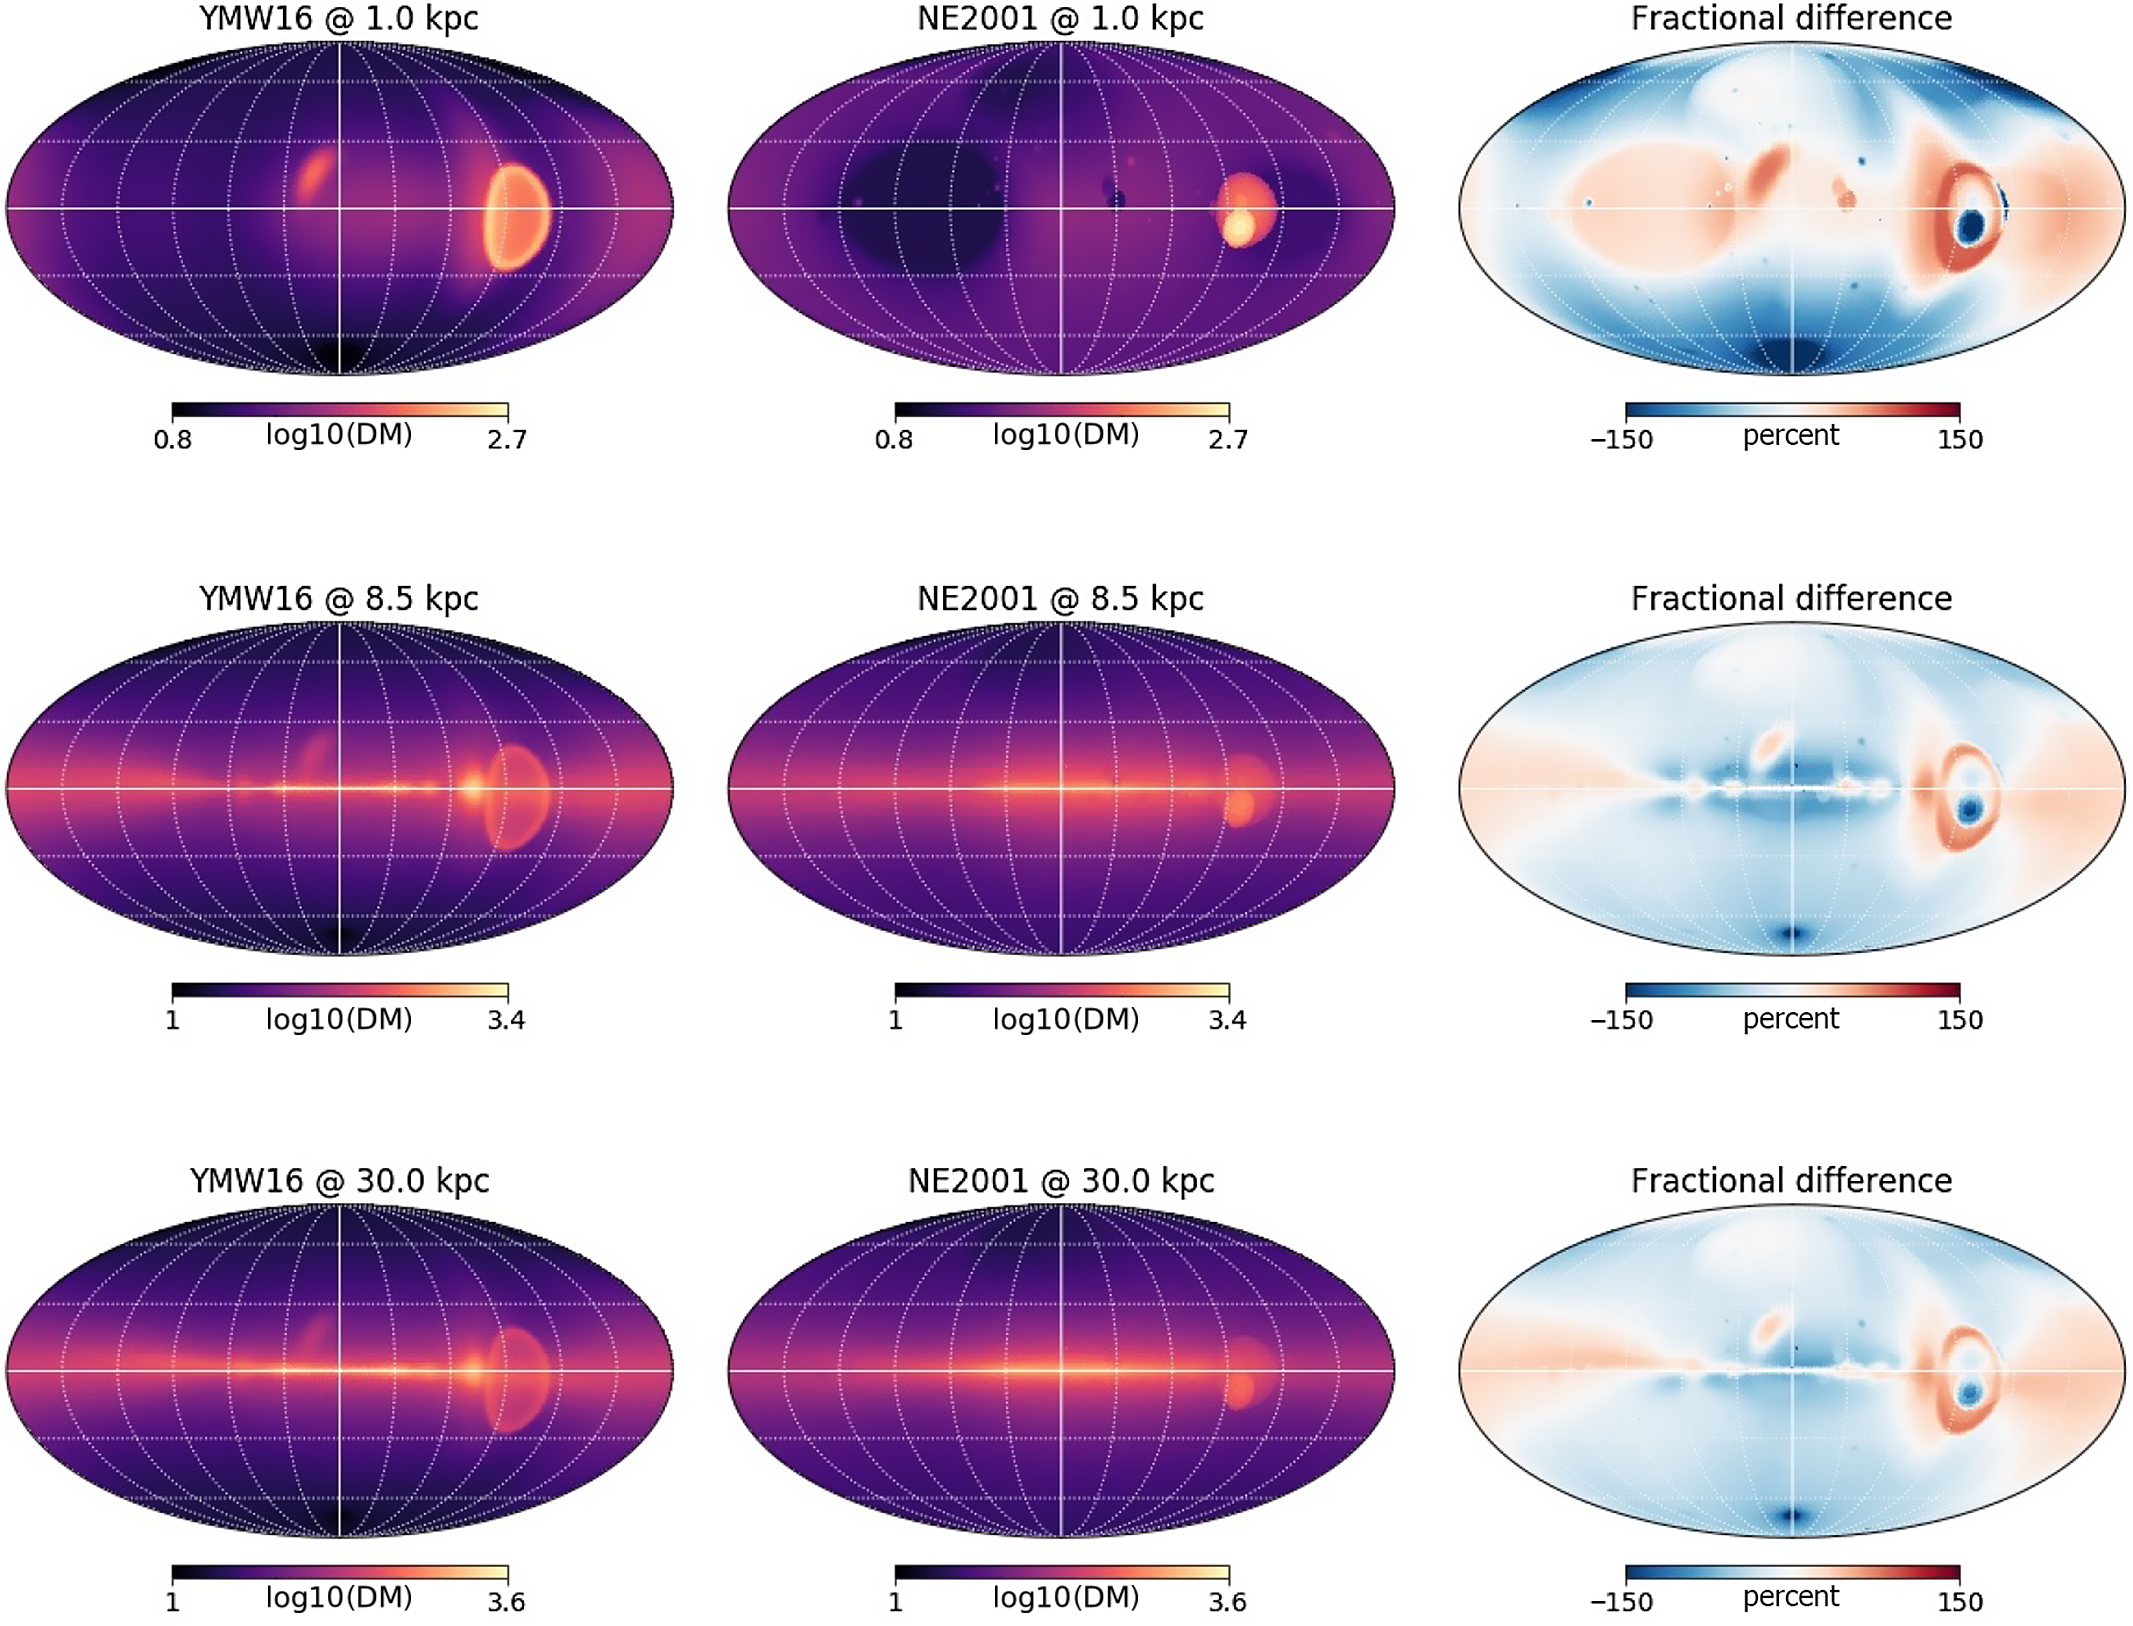
All-sky maps (Mollweide projection) in Galactic coordinates, showing DM along line of sight to 1 kpc (top), 8.5 kpc (middle), and 30 kpc (bottom), for the YMW16 (left) and NE2001 (centre) models. Fractional difference between the two maps is shown on the right.
3.6. PyGEDM web application
We provide a standalone web application for PyGEDM in the /app directory of the code repository. This application can be used for estimation of DM along a line of sight to a given distance, and vice versa. The contribution of both NE2001 and YMW16 models as a function of DM (or distance) is shown graphically along the line of sight (Fig. 3).
The application uses plotly Footnote l and dash-labs Footnote m to create the website interface, which is served using the gunicorn web server. A Dockerfile is provided to build and run the web application.
4. Comparison of YMW16 and NE2001 models
Figure 4 shows all-sky images made from YMW16 and NE2001, made using PyGEDM and plotted using the Healpy package. Averaged across all pixels, the NE2001 model returns a mean DM of 107.9 $\textrm{pc} \, \textrm{cm}^{-3}$
and median 55.3
$\textrm{pc} \, \textrm{cm}^{-3}$
and median 55.3 $\textrm{pc} \, \textrm{cm}^{-3}$
when evaluated out to its 17 kpc extent. The YMW16 model returns 110.6 and 48.7
$\textrm{pc} \, \textrm{cm}^{-3}$
when evaluated out to its 17 kpc extent. The YMW16 model returns 110.6 and 48.7 $\textrm{pc} \, \textrm{cm}^{-3}$
, respectively, when evaluated out to 30 kpc. That is, NE2001 reports a median
$\textrm{pc} \, \textrm{cm}^{-3}$
, respectively, when evaluated out to 30 kpc. That is, NE2001 reports a median $\textrm{DM}_{\textrm{ISM}}$
contribution 1.14
$\textrm{DM}_{\textrm{ISM}}$
contribution 1.14 $\,\times\,$
higher than YMW16. There is, however, a strong dependence on Galactic latitude. At low latitudes (
$\,\times\,$
higher than YMW16. There is, however, a strong dependence on Galactic latitude. At low latitudes ( $|b|<2^{\circ}$
), YMW16 predicts larger distances than NE2001, whereas at high latitudes, YMW16 predicts smaller distances (Figure 5).
$|b|<2^{\circ}$
), YMW16 predicts larger distances than NE2001, whereas at high latitudes, YMW16 predicts smaller distances (Figure 5).
As apparent in Figure 4, at 1 kpc large fractional differencesFootnote n between the two models are returned at the location of NE2001 clumps, with YMW16 in excess along most lines of sight at low Galactic latitudes, corresponding to features such as the Gum Nebula, Local Bubble, Loop I, and NE2001’s low-density region.
At 8.5 kpc (i.e. the distance to the Galactic centre), it becomes apparent that YMW16 predicts higher DM values away from Galactic centre ( $|l|<90^{\circ}$
). YMW16 predicts higher DMs at low latitudes, but NE2001 predicts higher DMs in most other directions. These general trends remain out to 30 kpc (lower panels).
$|l|<90^{\circ}$
). YMW16 predicts higher DMs at low latitudes, but NE2001 predicts higher DMs in most other directions. These general trends remain out to 30 kpc (lower panels).
We may also compare model predictions for pulsar distance to GEDM-independent distance measurement. The PSR $\pi$
survey obtained parallax-based distance measurements for 57 pulsars (Deller et al. Reference Deller2019), which complements the 189 measurements used in YMW16. To estimate errors
$\pi$
survey obtained parallax-based distance measurements for 57 pulsars (Deller et al. Reference Deller2019), which complements the 189 measurements used in YMW16. To estimate errors $\varepsilon_i$
, we apply a log-transform to normalise the data:
$\varepsilon_i$
, we apply a log-transform to normalise the data:
 \begin{equation} \mathrm{log}_e(D_{{\rm measured},i}) = \mathrm{log}_e(D_{{\rm model},i}) + \varepsilon_i.\end{equation}
Figure 6 shows a histogram of $\mathrm{log}_e(D_{\textrm{measured}}$
/
$\mathrm{log}_e(D_{\textrm{measured}}$
/ $D_{\textrm{model}})$
, the ratio of measured distance to model prediction, for the 189 + 57 measurements (left panels), and for the PSR
$D_{\textrm{model}})$
, the ratio of measured distance to model prediction, for the 189 + 57 measurements (left panels), and for the PSR $\pi$
sample (right panels). Corresponding Gaussian fits are also plotted, showing that the log-transform has normalised the data. From Equation (7), treating the error term as
$\pi$
sample (right panels). Corresponding Gaussian fits are also plotted, showing that the log-transform has normalised the data. From Equation (7), treating the error term as $\varepsilon_i = \mu \pm N\sigma$
, where
$\varepsilon_i = \mu \pm N\sigma$
, where $\sigma$
and
$\sigma$
and $\mu$
are the standard deviation and expected value of the Gaussian fit, and N is the number of standard deviations used in confidence interval, we find
$\mu$
are the standard deviation and expected value of the Gaussian fit, and N is the number of standard deviations used in confidence interval, we find
 \begin{equation} D_{{\rm model},i} \, e^{\mu - N\sigma} \leq D_{{\rm measured},i} \leq D_{{\rm model},i} \, e^{\mu + N\sigma}\end{equation}
As the distribution of $\varepsilon_i$
is not perfectly Gaussian, 3
$\varepsilon_i$
is not perfectly Gaussian, 3 $\sigma$
does not correspond to a 99% confidence interval; as such we report confidence interval percentages. For pulsars within the 189 + 57 sample, using 3
$\sigma$
does not correspond to a 99% confidence interval; as such we report confidence interval percentages. For pulsars within the 189 + 57 sample, using 3 $\sigma$
we find that 86% of YMW16 distance estimates lie between 0.35 – 2.76
$\sigma$
we find that 86% of YMW16 distance estimates lie between 0.35 – 2.76 $\,\times\, D_{\textrm{measured}}$
; for NE2001, 87% of distance estimates lie between 0.28 – 3.48
$\,\times\, D_{\textrm{measured}}$
; for NE2001, 87% of distance estimates lie between 0.28 – 3.48 $\,\times\, D_{\textrm{measured}}$
. That is, YMW16 performs better on average.
$\,\times\, D_{\textrm{measured}}$
. That is, YMW16 performs better on average.
Histograms of $D_{\textrm{YMW16}}$
/
$D_{\textrm{YMW16}}$
/ $D_{\textrm{NE2001}}$
, the ratio of model distance prediction for the YMW16 and NE2001 models. On average, at low Galactic latitude (
$D_{\textrm{NE2001}}$
, the ratio of model distance prediction for the YMW16 and NE2001 models. On average, at low Galactic latitude ( $|b| < 2^{\circ}$
, green), YMW16 predicts larger distances than NE2001; at high latitudes (
$|b| < 2^{\circ}$
, green), YMW16 predicts larger distances than NE2001; at high latitudes ( $|b| > 2^{\circ}$
, purple), YMW16 predicts smaller distances.
$|b| > 2^{\circ}$
, purple), YMW16 predicts smaller distances.

Histograms of $\mathrm{log}_e$
(
$\mathrm{log}_e$
( $D_{\textrm{measured}}$
/
$D_{\textrm{measured}}$
/ $D_{\textrm{model}}$
), the ratio of model-independent measured distance to the model estimate for the 189 + 57 pulsar sample (top panels) and 57 PSR
$D_{\textrm{model}}$
), the ratio of model-independent measured distance to the model estimate for the 189 + 57 pulsar sample (top panels) and 57 PSR $\pi$
sample (bottom panels). Gaussian fits to the histograms are shown in red.
$\pi$
sample (bottom panels). Gaussian fits to the histograms are shown in red.
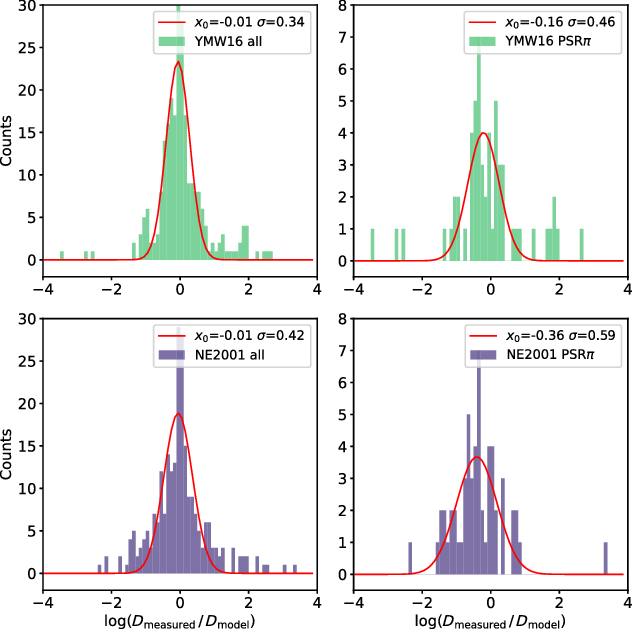
Nonetheless, this analysis of all 189 + 57 pulsars is biased toward YMW16 as it includes the pulsars used in the creation of YMW16. As discussed in Deller et al. (Reference Deller2019), the PSR $\pi$
pulsars can be used as an independent test, as they were not used in the creation of either model. When considering only the PSR
$\pi$
pulsars can be used as an independent test, as they were not used in the creation of either model. When considering only the PSR $\pi$
sample (Figure 6, right panels), 86% of NE2001 distance estimates lie within 0.12 – 4.10
$\pi$
sample (Figure 6, right panels), 86% of NE2001 distance estimates lie within 0.12 – 4.10 $\,\times\, D_{\textrm{measured}}$
, with a mean offset of
$\,\times\, D_{\textrm{measured}}$
, with a mean offset of $0.70$
; that is, NE2001 systematically underestimates distances. YMW16, in comparison, has a mean offset of
$0.70$
; that is, NE2001 systematically underestimates distances. YMW16, in comparison, has a mean offset of $0.85 $
; however, the Gaussian fit has several significant outliers. The 3
$0.85 $
; however, the Gaussian fit has several significant outliers. The 3 $\sigma$
range for YMW16 is 0.22 – 3.33
$\sigma$
range for YMW16 is 0.22 – 3.33 $\,\times\, D_{\textrm{measured}}$
, with 82% of estimates within this range.
$\,\times\, D_{\textrm{measured}}$
, with 82% of estimates within this range.
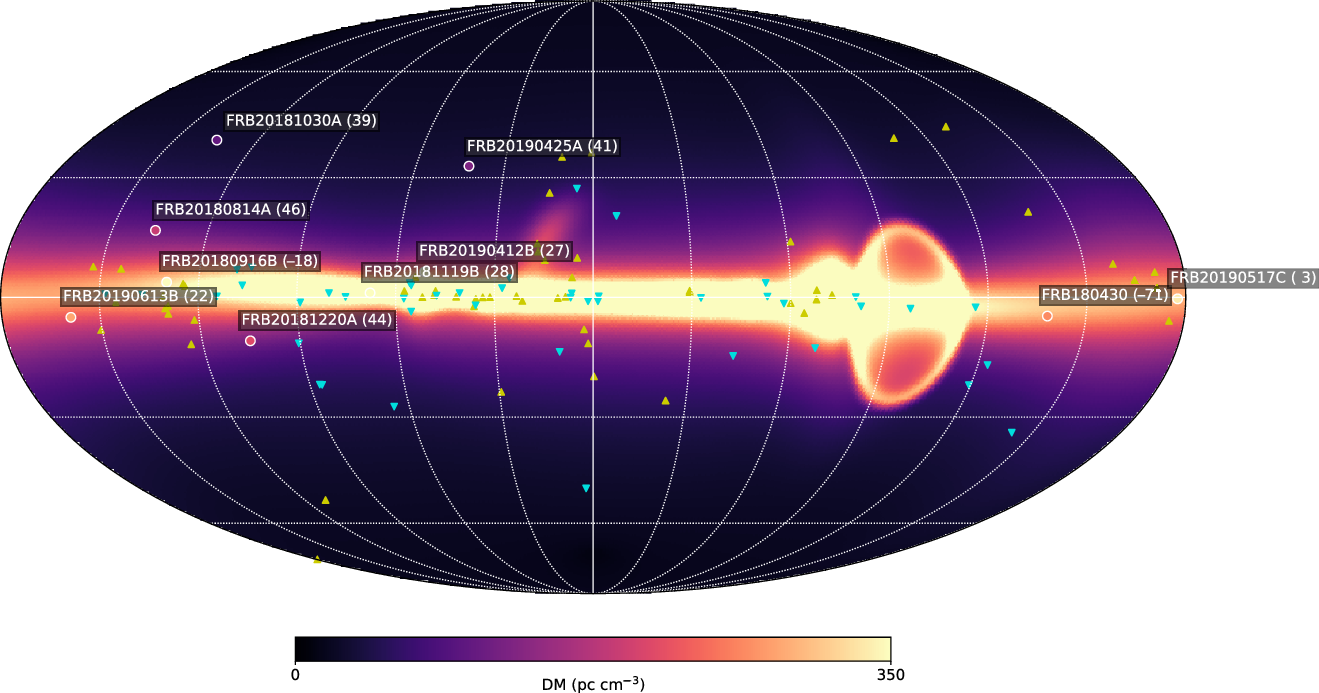
Location of FRBs with low-DM excess ( $<$
50
$<$
50 $\textrm{pc} \, \textrm{cm}^{-3}$
), plotted on top of total Galactic DM contribution (YMW16 + YT20). Also overlaid are pulsars where YMW16 distance is overestimated (gold
$\textrm{pc} \, \textrm{cm}^{-3}$
), plotted on top of total Galactic DM contribution (YMW16 + YT20). Also overlaid are pulsars where YMW16 distance is overestimated (gold $\blacktriangle$
) or underestimated (cyan
$\blacktriangle$
) or underestimated (cyan $\blacktriangledown$
) by more than 1.5
$\blacktriangledown$
) by more than 1.5 $\,\times\,$
. The DM excess, in
$\,\times\,$
. The DM excess, in $\textrm{pc} \, \textrm{cm}^{-3}$
, for each FRB is shown in parentheses.
$\textrm{pc} \, \textrm{cm}^{-3}$
, for each FRB is shown in parentheses.
The most discrepant pulsars (where the model DM estimate differs by more than an order of magnitude) for the two GEDMs are summarised in Table 2. Of these:
-
J0248 + 6021 is located in/behind a nebula toward the Galactic anticentre; both models greatly overestimate its distance.
-
J0942 – 5552 and J1017 – 7156 are located towards the Gum Nebula (
$l{\sim\!}264^{\circ}$
). NE2001 places J0942 – 5552 significantly further away, and both models overestimate distance to J1017 – 7156. -
J1735 – 0724 and J1741 – 0840 are located towards Loop I.
-
J1623 – 0908 lies behind a the HII Region Sh 2-27 (Ocker, Cordes, & Chatterjee Reference Ocker, Cordes and Chatterjee2020).
-
J1745 – 3040 is located towards the Galactic centre.

Table of most significant outliers, where $D_{\textrm{model}}$
/
$D_{\textrm{model}}$
/ $D_{\textrm{measured}}$
, the ratio of model prediction to measured distance, is below 0.1 or greater than 10. Bolded values indicate where one model notably better predicts the distance. Pulsars from the PSR
$D_{\textrm{measured}}$
, the ratio of model prediction to measured distance, is below 0.1 or greater than 10. Bolded values indicate where one model notably better predicts the distance. Pulsars from the PSR $\pi$
sample are marked with an asterisk
$\pi$
sample are marked with an asterisk
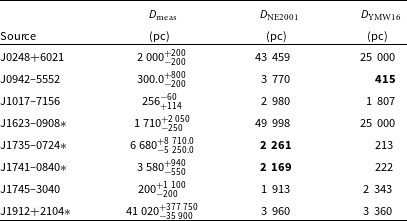
The two pulsars J1735 – 0724 and J1741 – 0840 are particularly poorly estimated by YMW16. The discrepancy appears to be due to excess electron density below 200 pc due to the contribution of Loop I. The discrepancy suggests that either the electron density of Loop I is overestimated and/or that Loop I is further away than modelled. We highlight this as of particular interest, given that the distance to Loop I is contentious (e.g. Bland-Hawthorn & Cohen Reference Bland-Hawthorn and Cohen2003; Shchekinov Reference Shchekinov2018; Dickinson Reference Dickinson2018).
We find some spatial clustering of pulsars for which the GEDMs poorly predicts pulsar distance (Figure 7). In Figure 7, pulsars where distances are over- or underestimated by more than 1.5 $\,\times\,$
are plotted on top of a map of
$\,\times\,$
are plotted on top of a map of $\textrm{DM}_{\textrm{MW}}$
(YMW16 with YT20 halo added). Pulsars towards the anticentre are more likely to have their distances overestimated, as are those in the direction of Loop I (for YMW16 only) and the Gum Nebula.
$\textrm{DM}_{\textrm{MW}}$
(YMW16 with YT20 halo added). Pulsars towards the anticentre are more likely to have their distances overestimated, as are those in the direction of Loop I (for YMW16 only) and the Gum Nebula.
To look for trends, we took the subset of pulsars with distance estimates discrepant by more than 1.5 $\times$
(Figure 7) and binned them by latitude, longitude, and distance. We find
$\times$
(Figure 7) and binned them by latitude, longitude, and distance. We find
-
Pulsars between
$60^{\circ}<l<90^{\circ}$
are more likely to have their distances underestimated for both models. -
Pulsars between
$120^{\circ}<l<180^{\circ}$
are more likely to have distances overestimated for YMW16. NE2001 is likely to overestimate between
$120^{\circ}<l<150^{\circ}$
. -
Low Galactic latitudes (
$b < -15^{\circ}$
) are likely to be underestimated by YMW16 but overestimated by NE2001. -
Pulsars with distances below 1 kpc are more likely to be underestimated by both models, whereas pulsars with distances between 1 and3 kpc are likely to be overestimated.


We also plot FRBs with low-DM excess ( $<$
50
$<$
50 $\textrm{pc} \, \textrm{cm}^{-3}$
) in Figure 7, taken from FRBCATFootnote
o
on 2021 June 10 (Petroff et al. Reference Petroff2016), and the CHIME FRB Catalog 1 (The CHIME/FRB Collaboration et al. 2021). The combined
$\textrm{pc} \, \textrm{cm}^{-3}$
) in Figure 7, taken from FRBCATFootnote
o
on 2021 June 10 (Petroff et al. Reference Petroff2016), and the CHIME FRB Catalog 1 (The CHIME/FRB Collaboration et al. 2021). The combined $\textrm{DM}_{\textrm{DMMW}}$
map places two FRBs within the galaxy: FRB20180916B (previously named FRB180916.J0158 + 65) (CHIME/FRB Collaboration et al. 2019) and FRB180430 (Qiu et al. Reference Qiu, Bannister, Shannon, Murphy, Bhandari, Agarwal, Lorimer and Bunton2019). Both of these FRBs are at low latitudes on sight lines away from the Galactic centre. FRB20180916B has been shown to be extragalactic (Marcote et al. Reference Marcote2020); taken together with pulsar distance overestimates, one can conclude that YMW16 systematically overestimates on sight lines towards the Galactic anticentre. In contrast, NE2001 does not place any FRB within the Galaxy.
$\textrm{DM}_{\textrm{DMMW}}$
map places two FRBs within the galaxy: FRB20180916B (previously named FRB180916.J0158 + 65) (CHIME/FRB Collaboration et al. 2019) and FRB180430 (Qiu et al. Reference Qiu, Bannister, Shannon, Murphy, Bhandari, Agarwal, Lorimer and Bunton2019). Both of these FRBs are at low latitudes on sight lines away from the Galactic centre. FRB20180916B has been shown to be extragalactic (Marcote et al. Reference Marcote2020); taken together with pulsar distance overestimates, one can conclude that YMW16 systematically overestimates on sight lines towards the Galactic anticentre. In contrast, NE2001 does not place any FRB within the Galaxy.
5. Discussion
Both NE2001 and YMW16 have proven to be invaluable tools for conversion between DM values and distance estimates. In this article, we introduce PyGEDM, a Python package that provides a unified interface to NE2001, YMW16, and the YT20 GEDMs.
We used PyGEDM to quantitatively compare and contrast the NE2001 and YMW16 models, highlighting where their predictions differ. We also compare GEDM predictions to pulsar measurements, finding that YMW16 performs better on average than NE2001, but that both models show significant outliers. We highlight that distances to J1735 – 0724 and J1741 – 0840 are poorly estimated by YMW16, suggesting that Loop I may be further away than modelled. There is still debate as to whether Loop I is a local feature–as YMW16 assumes—or associated with the Fermi bubble above Galactic centre, or both (Dickinson Reference Dickinson2018; Shchekinov Reference Shchekinov2018). Additionally, pulsars between $120^{\circ}<l<180^{\circ}$
are more likely to have distances overestimated for YMW16. Taken together with FRB measurements, it is clear that YMW16 overestimates the overall Galactic DM contribution towards the Galactic anticentre.
$120^{\circ}<l<180^{\circ}$
are more likely to have distances overestimated for YMW16. Taken together with FRB measurements, it is clear that YMW16 overestimates the overall Galactic DM contribution towards the Galactic anticentre.
Both NE2001 and YMW16 underestimate distance for pulsars in the PSR $\pi$
sample. As discussed in Deller et al. (Reference Deller2019), pulsars at high Galactic latitudes are over-represented in
$\pi$
sample. As discussed in Deller et al. (Reference Deller2019), pulsars at high Galactic latitudes are over-represented in
 $${\rm{PSR}}{\rm \pi} $$
, so it is not an unbiased sample. The median distance for pulsars in the sample is 2.5 kpc, whereas the median distance for pulsars with parallax measurement used in YMW16 is 1.1 kpc. Incorporating the PSR
$${\rm{PSR}}{\rm \pi} $$
, so it is not an unbiased sample. The median distance for pulsars in the sample is 2.5 kpc, whereas the median distance for pulsars with parallax measurement used in YMW16 is 1.1 kpc. Incorporating the PSR $\pi$
sample will improve the next-generation GEDMs, particularly at high latitude.
$\pi$
sample will improve the next-generation GEDMs, particularly at high latitude.
More generally, new GEDM-independent pulsar distance measurements will provide tests of GEDMs and further data to use in modelling. We suggest that pulsar targets are chosen strategically, focusing on areas where the GEDMs give poor distance estimates; namely, towards the Galactic anticentre, Loop I, the Gum Nebula, and at low Galactic latitudes.
Improving models of $\mathrm{DM}_{\textrm{halo}}$
will be important for FRB-based cosmology experiments. Kumar & Linder (Reference Kumar and Linder2019) argue that biases in any non-cosmological contributions to DM must be kept to under 0.6%: a budget of only 15.6
$\mathrm{DM}_{\textrm{halo}}$
will be important for FRB-based cosmology experiments. Kumar & Linder (Reference Kumar and Linder2019) argue that biases in any non-cosmological contributions to DM must be kept to under 0.6%: a budget of only 15.6 $\textrm{pc} \, \textrm{cm}^{-3}$
for even the highest recorded DM of
$\textrm{pc} \, \textrm{cm}^{-3}$
for even the highest recorded DM of $2596.1\pm0.3$ $\textrm{pc} \, \textrm{cm}^{-3}$
(FRB160102, Bhandari et al. Reference Bhandari2018). As such, future GEDMs should also ensure that their estimate of
$\textrm{pc} \, \textrm{cm}^{-3}$
(FRB160102, Bhandari et al. Reference Bhandari2018). As such, future GEDMs should also ensure that their estimate of $\mathrm{DM}_{\textrm{ISM}}$
does not contain contributions from the Galactic halo; or, a combined ISM and halo parameter could be fit to data. Currently, simply adding the YT20 to YMW16/NE2001 DM estimate likely overestimates the Galactic contribution for a given FRB.
$\mathrm{DM}_{\textrm{ISM}}$
does not contain contributions from the Galactic halo; or, a combined ISM and halo parameter could be fit to data. Currently, simply adding the YT20 to YMW16/NE2001 DM estimate likely overestimates the Galactic contribution for a given FRB.
Current GEDMs do not provide the user the tools to rerun parameter fitting with additional data or to add/modify features. We suggest that future GEDMs should provide such tools, so new measurements can be rapidly incorporated to improve the model.
Follow-up campaigns towards repeating FRBs will result in long observations, upon which pulsar searches could be conducted. Searches for pulsars along or near FRB sight lines would allow more accurate determination of $\textrm{DM}_{\textrm{ISM}}$
towards the FRB. We suggest that such searches should be done as a matter of course, to improve our understanding of the ISM and help facilitate the emerging field of FRB cosmology.
$\textrm{DM}_{\textrm{ISM}}$
towards the FRB. We suggest that such searches should be done as a matter of course, to improve our understanding of the ISM and help facilitate the emerging field of FRB cosmology.
Acknowledgements
We thank the authors of NE2001 (J.Cordes and J. Lazio), YMW16 (J. M. Yao, R. N. Manchester, N. Wang), YT20 (S. Yamasaki and T. Totani) and PZ19 (J. X. Prochaska and Y. Zheng) for email correspondence and providing these valuable models. A.T.D. is the recipient of an Australian Research Council Future Fellowship (FT150100415).




 Open access

