


Introduction
This study examines heirs’ property, a form of tenancy in common in which multiple individuals (heirs) inherit undivided partial interest in land and other real property through state intestacy laws (Deaton, Reference Deaton2007; Deaton et al., Reference Deaton, Baxter and Bratt2009). Heirs’ property is often constituted by a cloudy or tangled title (as opposed to a clear title), where there is no transparent paper trail documenting the succession of ownership across generations. Dobbs and Johnson Gaither (Reference Dobbs and Johnson Gaither2023) refer to the cloudy title, in the most extreme form, as “undocumented possession.” In some situations, the deceased owner’s name remains on a property’s title, even though the property’s ownership has passed to multiple subsequent generations of the deceased’s heirs. As a result, a single property may have a relatively large number of legal claimants, each of whom has a legally binding fractional interest in the property.
Over the last decade, policymakers and stakeholders have sought to understand and address heirs’ property issues. The Uniform Partition of Heirs Property Act has been adopted in 21 states (and the District of Columbia) as of 2024, and the 2018 Farm Bill authorized the USDA to create the Heirs Property Relending Program. Yet, despite these reforms, heirs’ property has received little attention within the economics literature. As such, the overarching goal of the current paper is to (i) empirically demonstrate that heirs’ property is a persisting issue, and (ii) provide an economic framework to assess the issues associated with heirs’ property.
To the best of our knowledge, Dobbs and Johnson Gaither (Reference Dobbs and Johnson Gaither2023) offered the only prior study that has assessed the prevalence of heirs’ property nationally. While there is obvious benefit to understanding the scope of heirs’ property, it is equally important to understand trends in the amount of heirs’ property over time, specifically the rate at which land is entering and exiting heirs’ property status. Our study is the first to compare rates of heirs’ property across multiple time periods and draws attention to the relative frequency at which new heirs’ property is created. Our research can be used not only to inform policymakers about regional trends (allowing for the strategic targeting of assistance programs), but also could be used by future researchers to evaluate the effectiveness of a given policy intervention. Furthermore, the economic synthesis is designed to help future researchers understand this topic.
We find that the total amount of heirs’ property in 2021 was slightly lower than in 2015 – total heirs’ property parcels declined by about one percent and heirs’ property identified on agricultural land declined by about two percent. Despite the declines, we find evidence of new parcels (and acres) entering heirs’ property status and largely offsetting the dissolution of parcels that were formerly identified as heirs’ property. Thus, our findings imply that issues of heirs’ property will likely continue to persist in the future.
The current paper is outlined as follows. After providing background material in Section 2, Section 3 synthesizes the existing multi-disciplinary literature on heirs’ property into an economically tractable framework using existing models. In Section 4, we use parcel-level tax record data from 2015 and 2021 to create of panel of heirs’ properties which we use to track not only changes in the amount of heirs’ property over time, but its rate of formation (net of land leaving heirs’ property) for the lower 48 states.
Background
Intestacy is the legal term for the state of dying without a will, and a person who dies without a will is said to have “died intestate.” The default intestacy rules or laws for most states are that each of the decedents that inherit the asset (the “heirs”) are granted equal right to possess and use an entire inherited parcel of land, regardless of the size of one’s fractional interest (Cole, 2021). Under these rules, heirs’ property is a precarious form of landownership because many uses of the land and property require unanimous consent among all heirs (i.e., the persons who inherited the assets). As a result, the ownership arrangement of heirs’ property can lead to coordination problems, under-investment, and under-utilization.Footnote 1
While heirs’ property can pose challenges to owners of all types of property, it is particularly challenging for those who want to use their land for agricultural purposes. There are several potential challenges to agricultural production on heirs’ property. Firstly, all land use changes require the unanimous consent of all co-tenants. Additionally, all returns must be shared proportionally regardless of contribution. Moreover, the lack of a clear title often prevents owners from obtaining credit for on-farm investments and participating in U.S. Department of Agriculture’s (USDA) programs including commodity and conservation payment programs, loans, crop insurance, and disaster relief, among others.
Heirs’ properties are disproportionately owned by historically underserved populations, including African Americans, Latinos, Native Americans, and poor Whites of Appalachia. Arguably, one-third of all Black-owned land in the South is heirs’ property (Presser, July 15, 2019). More poignantly, heirs’ property tends to occur among impoverished populations (Deaton, Reference Deaton2007; Dyer et al., Reference Dyer, Bailey and Van Tran2009). Such groups often lack the resources to execute a will or estate plan, which can lead to the eventual formation of heirs’ property.
Thus, the transfer of property through state intestacy law has created problems for historically underserved populations in the U.S. Many within these groups fail to sign a binding legal will due to a lack of access to affordable legal services, illiteracy, and distrust of the legal system (Zabawa, Reference Zabawa1991). An estimated 77 percent of African Americans die without a will or estate plan (Chang-Cook, 10 August 2022; Graves, Sr., 3 November 2015). According to the Emergency Land Fund (1980), about forty-one percent of black-owned land in the Southeastern states was owned under the default rules governing tenancies in common and has been transferred through state intestacy laws. As a result, heirs’ property is argued to be a leading cause of involuntary land loss (Presser, July 15, 2019).
In response to the problems caused by heirs’ property, the Uniform Law Commission (2024) developed draft legislation titled the Uniform Partition of Heirs Property Act (UPHPA), which proposes to reform intestacy laws. As displayed in Figure 1, as of December 2024, the UPHPA has been enacted in twenty-one states and the District of Columbia, and an additional six states have introduced the proposal as state legislation. (Hawaii and the U.S. Virgin Islands have also enacted legislation as well, but these islands are beyond the scope of the current study).
Uniform Partition of Heirs Property Act legislative status as of 2024. Notes: This figure illustrates a map of the contiguous United States (or the lower 48 states). The map is color coded to indicate the status of a state’s enactment of the Uniform Partition of Heirs Property Act. As of 2024, twenty-one states and the District of Columbia have enacted legislation, and six additional states have introduced legislation. The figure excludes other states or territories that have enacted legislation including Alaska, Hawaii, and the U.S. Virgin Islands, which fall outside of the scope of the current study. Source: Figure was created by the authors in ArcGIS Pro 3.1.4 using data from the Uniform Law Commission (2024).

The draft legislation offers numerous proposed remedies over existing intestacy laws (Mitchell, Reference Mitchell2016). It allows cotenants the right to purchase the property from the other tenants in a fair and judicious manner. The reformed act gives preference to distributing the property by “partition in kind” over “partition by sale” methods. Partition in kind is a method whereby the property is physically divided among each owner with a proportionate share; whereas a partition by sale is a method in which the entire property is sold, and the financial proceeds of the sale are proportionately shared.
Issues associated with heirs’ property were recognized by U.S. Congress, and consequently the Heirs’ Property Relending Program was authorized under the 2018 Farm Bill (U.S. Department of Agriculture, 2023b). This program provides funding to eligible lenders to provide heir’s property owners with low-interest loans to help resolve ownership and succession issues on farmland, including allowing one heir to purchase the interest of the remaining heirs and receive a clean title for the property.
A handful of past studies have used secondary data sources of residential property records and geographic information systems (GIS) to spatially locate heirs’ property across a broad geographic region. Pippin et al. (Reference Pippin, Jones and Johnson Gaither2017) used mass appraisal files to assess the prevalence of heirs’ property across ten counties in Georgia, in which they found 11 to 25 percent of all county parcels were “potential heirs’ properties.” Winter-Michaud et al. (Reference Winters-Michaud, Burnett, Callahan, Keller, Williams and Harakat2023) and Thomson and Bailey (Reference Thomson and Bailey2023) conducted analyses using extensive residential property records to identify “candidate” heirs’ properties in the southeastern U.S. In a similar vein, Dobbs and Johnson Gaither (Reference Dobbs and Johnson Gaither2023) used secondary parcel data and search terms within real property tax records to identify the number of “potential” heirs’ property parcels across the entire U.S. The PEW Charitable Trusts (2021) arguably conducted the most definitive identification of heirs’ property by matching property tax and deed data with Social Security Administration death files, though this study was restricted to the city of Philadelphia.
While there is an obvious benefit to understanding the magnitude of heirs’ property, it is equally important to understand trends in the amount of heirs’ property over time, specifically the rate at which land is entering and exiting heirs’ property status. To date there is no published research on whether the amount of heirs’ property is growing over time, nor the rate of formation of heirs’ property. As such, this is the first paper to provide such estimates.
Synthesis of the economic literature: property rights regimes
To better understand the challenges associated with identifying heirs’ property and the consequent welfare implications, we synthesize the multi-disciplinary literature into a tractable economic framework by examining various types of land ownership rights and the implications of property regimes as investment assets.Footnote
2
To begin, we define notation for a fixed asset – that is, a plot of land. We assume that the fixed asset is used with a variable input, x, which are used to produce a market output, Y. The market output can be crops, timber, or livestock, among several other examples. Thus, the production function can be defined as $Y = f(x)$
, where any notation for the fixed asset (land) is suppressed since it is fixed. Moreover, we assume that the input is available at a market wage (or opportunity cost) w, and the producer (landowner or renter) is motivated to maximize their returns,
$Y = f(x)$
, where any notation for the fixed asset (land) is suppressed since it is fixed. Moreover, we assume that the input is available at a market wage (or opportunity cost) w, and the producer (landowner or renter) is motivated to maximize their returns, ${\pi(x)}$
:
${\pi(x)}$
:
 $$\max_{x} \, \pi(x) = f(x) - w \cdot x.$$
Assuming the production function is continuous, and the output function is concave, the first-order necessary condition for maximizing returns is $f'(x) = w$
, which provides an interior solution for the first-best use of the input defined as
$f'(x) = w$
, which provides an interior solution for the first-best use of the input defined as $x^* (w)$
.
$x^* (w)$
.
The maximization of equation (1) is a static (one period) solution. To see how the landowner maximizes the value of the land over time, we extend the model to more than one period. Based on this framework, the first-best value of the land, $V^{*} \,$
can be defined as
$V^{*} \,$
can be defined as
 $$V^{*} = \int_{0}^{\infty} \pi^{*}(x^{*},t) \cdot e^{-rt}dt,$$
where r is the discount rate and t is a unit of time. The first-best solution yields the present, discounted value of the future stream of (first-best use) production on the land. The value function in equation (2), assumes that the landowner maximizes the lands value over time by maximizing their rents in each period as illustrated in equation (1).
Based on this model, we start with an outline of well-defined property rights and then move to a discussion of incomplete property rights and heirs’ property. For the interested reader, we offer a more thorough theoretical outline of property right regimes and anticommon resources in the Appendix.
Property rights
If the plot of land is open access, then there is a complete lack of property rights. We now assume there are n individuals using the land for productive purposes (e.g., timber harvesting). The concave production function defined above now becomes $Y = f\left( x \right)$
, where
$Y = f\left( x \right)$
, where $X = \;\mathop \sum \nolimits_{i=1}^n {x_i}$
, and
$X = \;\mathop \sum \nolimits_{i=1}^n {x_i}$
, and ${x_i}$
is the effort put forward by each individual i operating on the land. As before, the opportunity cost of effort is defined by the market wage,
${x_i}$
is the effort put forward by each individual i operating on the land. As before, the opportunity cost of effort is defined by the market wage, ${w_i}$
. Each individual’s objective is to maximize their own rent (income) subject to the constraint of open access, which implies that each person’s production yields output in proportion to their share of effort.
${w_i}$
. Each individual’s objective is to maximize their own rent (income) subject to the constraint of open access, which implies that each person’s production yields output in proportion to their share of effort.
Assuming that all users are homogeneous (i.e., $w_{i} = w_{j}$
, for all
$w_{i} = w_{j}$
, for all $i \ne j$
), and a user does not engage in strategic behavior based on another user’s effort choices, then the Nash equilibrium for the open access model satisfies the first-order necessary condition (Sandler & Sternbenz, 1990; Lueck & Miceli, Reference Lueck, Miceli, Polinsky and Shavell2007):
$i \ne j$
), and a user does not engage in strategic behavior based on another user’s effort choices, then the Nash equilibrium for the open access model satisfies the first-order necessary condition (Sandler & Sternbenz, 1990; Lueck & Miceli, Reference Lueck, Miceli, Polinsky and Shavell2007):
 $$\left( {{n - 1}\over{n}} \right) \times {{f(X)}\over{X}} + \left( {{1}\over{n}} \right) \times f^\prime\left( X \right) = {w_i},\;\;\;i = 1, \ldots, n.$$
The first term on the left-hand side of the equality is the average product (weighted by the term $((n - 1)/n)$
, and the second term on the left-hand side is the marginal product (weighted by the term
$((n - 1)/n)$
, and the second term on the left-hand side is the marginal product (weighted by the term $(1/n)$
). The term on the right-hand side of the equality is the average cost or marginal cost. As the number of users on the land increases in size (i.e.,
$(1/n)$
). The term on the right-hand side of the equality is the average cost or marginal cost. As the number of users on the land increases in size (i.e., $n \rightarrow \infty$
), the Nash equilibrium reduces to:
$n \rightarrow \infty$
), the Nash equilibrium reduces to:
 $${{f(X)}\over{X}} = w.$$
The open access equilibrium level of effort occurs where the average product equals the wage (where the subscript i on the wage term has been suppressed due to the homogeneity assumption). Equation (4) implies that all rents (income) will be completely dissipated, and if this condition persists then the present value of the open-access land asset ( $V^{oa}$
) will collapse to zero:
$V^{oa}$
) will collapse to zero:
 $$V^{oa} = \int_{0}^{\infty} {\pi(x,t) \cdot e^{-rt}dt = 0}.$$
Land privatization is the solution to the open-access problem. According to the Coase (Reference Coase1960) Theorem, the private property owner will face the full value and opportunity cost of the asset, and so they will choose a first-best level of input that is less than the open access level. Thus, the landed asset will generate a positive value that exceeds the present value of open access land. Moreover, private ownership creates incentives for optimal resource use including maintenance and investment (Lueck & Miceli, Reference Lueck, Miceli, Polinsky and Shavell2007). That is, owners will seek to maximize the present value of the future stream of the returns from the landed asset.
Private property rights are a necessary but not sufficient condition of the efficient use of a landed asset. That is, private property rights are defined such that the owner is free to make all decisions as to the productive use of the land. Yet, a landed asset can be private property, but it is co-owned by more than one individual, and each has a fractionated interest in the property (i.e., tenancy in common). In such cases, the co-owners must coordinate, and unanimous consent is required for any productive uses of the asset. Presumably, each co-owner has the right to exclude the others’ use of the asset. In the academic literature, this type of property ownership can be construed as an anticommon resource.
Heirs’ property: open access investment problem
Anticommon resources are identified as a type of property ownership in which many uncoordinated individuals have the right to exclude other users, thus creating a type of ownership in which assets are under-used and under-developed (Heller, Reference Heller1998, Reference Heller2008).Footnote 3
Anticommons are not necessarily a distinct property regime, but rather a form of incomplete property rights (Lueck & Miceli, Reference Lueck, Miceli, Polinsky and Shavell2007). Put differently, the legal system fails to endow an individual owner with the necessary “bundle” of rights that represent full ownership (Heller, Reference Heller1998). Lueck & Miceli (Reference Lueck, Miceli, Polinsky and Shavell2007) frame this as an “open access investment problem.” That is, too many people have the right to access, and due to the coordination problems, it is difficult for the cotenants to agree on the best investment of the property.
To see this, consider a model for future output that is specified as $Y_{t+1} = f(x_{t})$
, where
$Y_{t+1} = f(x_{t})$
, where $x_{t}$
is the current investment in the land’s use. As before, we define
$x_{t}$
is the current investment in the land’s use. As before, we define $w_{t}$
as the market wage at time t and r denotes a constant, market interest rate. In this set up, the first-best use of the input
$w_{t}$
as the market wage at time t and r denotes a constant, market interest rate. In this set up, the first-best use of the input $(x_t^*)$
is derived by maximizing the following function
$(x_t^*)$
is derived by maximizing the following function
 $$\max_{x_{t}} \, \pi(x_t) = \frac{f(x_{t})}{(1+r)} - w_{t} \cdot x_{t}.$$
The first-order necessary condition is given by $f'(x_{t})/(1 + r) = w_{t}$
.
$f'(x_{t})/(1 + r) = w_{t}$
.
Further, we define $\rho$
as the probability of expropriation (due to imperfect property rights or coordination problems among cotenants) of future output. Thus,
$\rho$
as the probability of expropriation (due to imperfect property rights or coordination problems among cotenants) of future output. Thus, $(1 - \rho)$
is the probability that the landowner’s investment in output will remain intact. The solution to the intertemporal investment problem (defined in the notation as
$(1 - \rho)$
is the probability that the landowner’s investment in output will remain intact. The solution to the intertemporal investment problem (defined in the notation as $x_t^\rho $
) is derived by maximizing the following function
$x_t^\rho $
) is derived by maximizing the following function
 $$\max_{x_{t}} \, \pi(x_t) = f(x_t) \cdot {(1-\rho)\over(1+r)} - w_t \cdot x_t,$$
which must satisfy the first-order condition
 $${f^\prime(x_t) \cdot {(1-\rho)\over(1+r)} = w_t}.$$
Since $\rho$
is positive, the solution to the intertemporal maximization problem with uncertainty is less than the solution to the intertemporal problem with certainty; that is, where
$\rho$
is positive, the solution to the intertemporal maximization problem with uncertainty is less than the solution to the intertemporal problem with certainty; that is, where $x_T^\rho \lt x_t^*$
and
$x_T^\rho \lt x_t^*$
and $x_{T}$
denotes the terminal use of the asset. Therefore, the land is utilized less due to uncertainty of future investment security.
$x_{T}$
denotes the terminal use of the asset. Therefore, the land is utilized less due to uncertainty of future investment security.
In the case of heirs’ property, the probability of expropriation, $\rho$
, can take two potential forms: (i) forced sales (or partition actions) or (ii) a change in the land’s use is vetoed by another cotenant.Footnote
4
Consider, for example, a cotenant who wants to use the land held in common for livestock grazing. Such an enterprise would require an upfront capital investment, and if the individual’s investment is threatened by a cotenant forcing the sale of the property or the veto power of another cotenant, then it will negatively affect the investor’s expected future returns (equation (7)). Hence, the investing cotenant would likely choose to curtail or altogether forego the investment.Footnote
5
$\rho$
, can take two potential forms: (i) forced sales (or partition actions) or (ii) a change in the land’s use is vetoed by another cotenant.Footnote
4
Consider, for example, a cotenant who wants to use the land held in common for livestock grazing. Such an enterprise would require an upfront capital investment, and if the individual’s investment is threatened by a cotenant forcing the sale of the property or the veto power of another cotenant, then it will negatively affect the investor’s expected future returns (equation (7)). Hence, the investing cotenant would likely choose to curtail or altogether forego the investment.Footnote
5
Empirical analyses: recent trends in heirs’ property
A few recent studies have used different methods for estimating the amount of heirs’ property in specific location using data for a specific year (Winters-Michaud et al. Reference Winters-Michaud, Burnett, Callahan, Keller, Williams and Harakat2023; Thomson and Bailey, Reference Thomson and Bailey2023; Dobbs and Johnson Gaither, Reference Dobbs and Johnson Gaither2023).
To date, it is unknown whether the amount of heirs’ property is growing over time, nor the rate at which new heirs’ property is being formed. To that end, we use parcel-level real estate records from 2015 and 2021 to create a panel of heirs’ properties. This allows us to determine the relative change and rate of formation/dissolution of heirs’ property.
Data
The data used for this study are based on property transaction, tax and deed records obtained from CoreLogic, which is a corporation that provides financial, property, consumer information, analytics, and business intelligence. The records are derived from CoreLogic’s real estate data solutions, which aggregates residential property records from each state of the U.S.
CoreLogic has a proprietary ownership rights indicator as the only determining factor of heirs’ property. Arguably, this variable is insufficient to qualify or quantify the full extent of heirs’ property for two reasons. First, CoreLogic’s proprietary ownership rights indicator contains property owner specifications that are not mutually exclusive – for example, ‘heirs’, ‘tenants in common,’ or ‘undivided interest.’ By definition, heirs’ property is a form of tenancy in common. Moreover, heirs’ property or non-heirs’ tenancy in common could be classified as undivided interest.Footnote 6 , Footnote 7 , Footnote 8 Second, past studies aimed at identifying the magnitude of heirs’ property has generally found potential heirs’ property that were not identified using CoreLogic’s proprietary indicator (Thomson and Bailey, Reference Thomson and Bailey2023; Winter-Michaud et al., Winters-Michaud et al. Reference Winters-Michaud, Burnett, Callahan, Keller, Williams and Harakat2023; Dobbs and Johnson Gaither, Reference Dobbs and Johnson Gaither2023). For example, the owner’s name or one of the legal description variables might explicitly say that it is heirs’ property, even though it is not classified as such by CoreLogic.
Despite past attempts to quantify the magnitude of candidate properties, it can be challenging to assess the full scope because of the inconsistency across counties and states in reporting heirs’ property. For example, Dyer et al. (2019) found inconsistent reporting of heirs’ property between tax assessor offices or districts. We, therefore, do not consider the absolute number of parcels or acreage identified as heirs’ property by CoreLogic, nor the geographic concentration of such properties.
Instead, we focus on discrete changes, analyzing the relative rate at which the reported amount has increased or decreased, as well as the percent of properties moving in and out of heirs’ property status. Our analytical strategy relies on the assumption that if a property record was identified by CoreLogic as heirs’ property at two subsequent points of time, then we safely assume the record is, in fact, heirs’ property. This assumption is weak, although the indicator might possibly be biased in later year records if a tax assessor’s office becomes better at identify a heirs’ property through time.
Methods
To construct our panel, we extract all records from the lower 48 states where CoreLogic’s proprietary “ownership rights code” variable identifies a record as “heirs property.” This is performed independently using CoreLogic tax records data from 2015 and then again for the 2021 records.Footnote 9 We merged these two datasets based on each parcel’s assessor parcel number (a unique identifier at the county level) and the five-digit (county-level) FIPS code, with the FIPS code included to prevent false matches across different counties. This results in a dataset that contains all properties identified by CoreLogic as heirs’ property in either 2015 or 2021. This allows us to identify (i) the percent of properties that were classified as heirs’ property in both 2015 and 2021, (ii) the percent of properties that were classified as heirs’ property in 2015 but were no longer classified as such in 2021, and (iii) the percent of properties identified as heirs’ property in 2021 that had not been classified as such in 2015. Thus, in addition to calculating relative changes in the amount of heirs’ property, we are also able to calculate the rate at which properties transition in and out of heirs’ status.
As discussed above, while heirs’ property can pose challenges to owners of all types of property, it is particularly challenging for heirs inheriting agricultural heirs’ property. As such, we created panel (a subset of total heirs’ property) containing only agricultural parcels. This is done using the same method as outlined above, only in this case, for each year of record we only keep properties classified as agricultural according to CoreLogic’s proprietary property indicator code. Further, we limited the size of the identified agricultural properties to greater than or equal to five acres. This modest lower bound on the acreage is imposed as to not include any small parcels that may be inaccurately classified as agricultural.
Results
Our results are presented as follows. We begin by presenting our analysis for all heirs’ property at the national level before moving on to briefly discuss geographic trends. This is then repeated for agricultural heirs’ property with additional focus on regional trends. For our discussion of all heirs’ property, we focus on changes to the number of parcels, while for agricultural heirs’ property we focus on changes to the total acreage. The latter comparison provides a better sense of the changes to the total amount of agricultural land effected by heirs’ property issues.
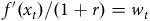
Examining all parcels identified as heirs’ property for the lower 48 states, we find that between 2015 and 2021 the number of heirs’ properties decreased by 1.1 percent, while the total acreage decreased by 5.5 percent. However, these small decreases mask large amounts of land transferring in and out of heirs’ property status. As can be seen in Figure 2, roughly 36 percent of the parcels (or 27.8 percent of the acreage, not shown) identified as heirs’ property in 2015 were no longer classified as such in 2021, while 34.9 percent of the parcels (or 22.7 percent by acreage) identified as heirs’ property in 2021 had not been classified as such in 2015. These results suggest that despite recent legal reforms, rates of heirs’ property have only decreased slightly, while relatively large amounts of heirs’ property continue to be created.
Rate at which parcels moved in and out of heirs’ property status (2015 and 2021). Notes: This figure shows that the number of heirs’ property parcels in 2021 was 1.1 percent lower than in 2015. Of the heirs’ property parcels in 2021, 36 percent were no longer heirs’ property in 2021. Of the heirs’ property parcels in 2021, about 34.9 percent had not been heirs’ property in the 2015. Source: Figure created by the authors using CoreLogic residential property tax records in 2015 and 2021.

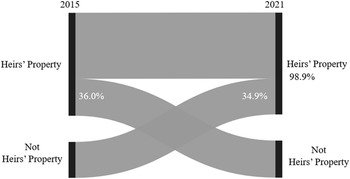
The next part of the analysis, offered in Table 1, consists of an exploration of regional and state-level percent changes of parcels and acres of heirs’ property. Our regional analysis is based on U.S. Department of Agriculture Farm Production regions (Bigelow and Borchers, Reference Bigelow and Borchers2017; Winters-Michaud et al., 2024) with the contiguous U.S. divided into ten separate regions: Appalachia, Corn Belt, Delta, Lake States, Mountain States, Northeast, Northern Plains, Pacific, Southeast, and Southern Plains. Also provided is the status of the UPHPA draft legislation within each state. If a state enacted heirs’ property reform, then the year of enactment is indicated with an “E;” on the other hand, if a state introduced legislation, then the year of introduction is indicated with an “I.”
Percent change to total state-level parcels and acreage of heirs’ property (between 2015 and 2021)

Notes: This table displays state-level records of the number of heirs’ property in 2015 and 2021. The record numbers are calculated as the ratio of heirs’ property relative to the state population (in millions) in each year. UPHPA denotes the Uniform Partition Heirs’ Property Act. The letter “E” in the UPHPA column indicates that the legislation was “enacted” in the indicated year; the letter “I” indicates that the legislation was “introduced” in the indicated year. The column defined as “Percent Change (Ag Acres)” reports the relative percentage change in acres on properties where the land use is identified as agricultural. The column defined as “Percent Change (Acres” reports the relative percentage in total acreage on all properties identified as heirs’ property. The column defined as “Percent Change (Parcels)” reports the relative percentage change to the total number of parcels identified as heirs’ property. The average, national percentage changes are: -1 percent for all heirs’ property parcels, -6 percent for acreage (on total heirs’ property land), and -2 percent for agricultural, heirs’ property acreage.
Source: Table created by the authors using tax record data from CoreLogic, population data from the U.S. Census Bureau (2022), and the legislative status of the UPHPA from the Uniform Law Commission (2024).
According to the analysis, Idaho experienced the largest percent increase in heirs’ property parcels, followed by Montana and Georgia.Footnote 10 On the other hand, Maryland, Maine, Ohio, New Hampshire, South Carolina, and Connecticut experienced the largest percent decreases in the number of parcels. Michigan experienced the largest percentage increase in total heir’s property acreage followed by Idaho and California. Further, the largest percentage decreases in heirs’ property acreage on agricultural lands were experienced in Massachusetts, New Hampshire, and Vermont. The Mountain region saw by far the largest increase in both parcels and acreage, while the Northeast saw the largest decrease in both parcels and acreage.
Agricultural Heirs’ property
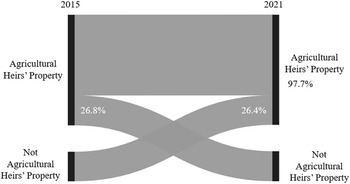
Exclusively examining parcels identified as agricultural heirs’ property for the lower 48 states, we find that between 2015 and 2021 the total acreage of agricultural heirs’ property decreased by 2.3 percent.Footnote 11 At the same time, however, the total number of parcels classified as agricultural heirs’ property increased by 0.7 percent. These contrasting changes imply that while the number of agricultural heirs’ properties that were created is larger than the number exiting agricultural heirs’ property status, the average size of the parcels exiting is larger than the average size of parcels entering. We speculate that co-owners of larger parcels (and thus more valuable parcels, ceteris paribus) have more of an incentive to resolve their heirs’ property status than smaller parcels. As was the case with heirs’ property more generally, however, these small changes mask relatively large amounts of land transferring in and out of agricultural heirs’ property status.
Figure 3 illustrates that 26.8 percent of the acreage identified as agricultural heirs’ property in 2015 was no longer classified as such in 2021 (or 27.4 percent by number of parcels). Similarly, 26.4 percent of the acreage identified as agricultural heirs’ property in 2021 was not classified as such in 2015 (or 28.1 percent by number of parcels). Here we see that while the amount of agricultural heirs’ property in the lower 48 states was relatively stable between 2015 and 2021, relatively large amounts of agricultural heirs’ property continued to be created.
Rate at which acres moved in and out of agricultural heirs’ property status (2015 and 2021). Note: This figure illustrates that the number of agricultural heirs’ property acres decreased by about 2.3 percent between 2015 and 2021. Of the agricultural heirs’ property acreage in 2015, 26.8 percent were no longer identified as agricultural heirs’ property in 2021. Of the agricultural heirs’ property in 2021, 26.4 percent had not been identified as agricultural heirs’ property in 2015. Source: Figured created by the authors using CoreLogic residential property tax records in 2015 and 2021.

To examine regional trends in changes to the amount of agricultural heirs’ property, we developed a choropleth map in Figure 4. As with the Table 1, we divided the lower 48 states into USDA Farm Production regions. The percentages changes in the figure illustrate that agricultural heirs’ property acreage increased slightly for the Northern Plains and the Southeast. At the same time, the percentage change remained flat in Appalachia, and otherwise decreased in other seven regions. The Lake States experienced the largest percentage decline in agricultural heirs’ property with an approximate 46 percent decline in acres. The exact calculated percentage changes, for each region, are offered in Table 1.
Percent in acreage of heirs’ property identified as agricultural land (2015 and 2021). Notes: This figure illustrates the percent change of parcels (a) and the change in acres (b) of heirs’ property at the county level across the contiguous U.S. states. The hues of red in the scale indicate a positive change in the number of parcels (acres), whereas the hues of blue in the scale indicate a negative change in the number of parcels (acres). The grey shaded counties indicate no records. Source: The figure was created by the authors using CoreLogic (2023) tax records for the years 2015 and 2021.

Conclusions
In this paper, we sought to facilitate the development of future heirs’ property research within the field of economics by synthesizing the past literature and discussing the potential welfare losses associated with heirs’ property as a form of tenancy in common. Theory suggests that welfare losses occur due to under-utilization and under-investment leading to a reduction in value of the underlying asset. We also outlined the 2010 draft legislation called the Uniform Partition of Heirs’ Property Act, and how it is aimed at reforming the laws governing heirs’ property in the U.S.
To address issues of heirs’ property, it is arguably necessary to determine where it is occurring and whether it is expanding or contracting. As such, this paper offered an original contribution to a small but growing literature on the prevalence of heirs’ property. We examined the relative changes and rate of formation of heirs’ property at the national, regional, and state level by examining property tax records from 2015 and 2021. When looking at all heirs’ property, we estimate that the number of parcels has declined by about one percent and the amount of acreage has declined by approximately six percent. When looking exclusively at agricultural heirs’ property, we find that the number of acres has decreased by roughly two percent between 2015 and 2021. At the same time, however, we found that between 26-36 percent of 2021 heirs’ property had not been heirs’ property in 2015.
By demonstrating the large rates at which heirs’ property continues to be created, we draw attention to existing heirs’ property, as well as the issues that perpetuate the formation of new heirs’ property. For example, Rothstein and Rothstein (Reference Rothstein and Rothstein2023) observe that only 24 percent of African Americans establish a legal will whereas over half of white Americans have a will or estate plan. Rothstein and Rothstein (Reference Rothstein and Rothstein2023) posit then that estate planning should be included in financial literacy education and funding should be made available (at the state, county, or municipal level) for estate planning and administrative costs. Zinn (Reference Zinn2023) argues that local communities should fund free probate legal assistance to eligible owners to clear titles and help heirs’ property owners to take advantage of property rights.
This study was subject to limitations. As stated above, the principal issue that affects most heirs’ property studies is that we do not know with any high degree of certainty if CoreLogic’s proprietary identification of heirs’ property is accurate. Likely, CoreLogic’s identification of heirs’ property (based on tax assessor reports) is a lower bound on the actual number of such properties. For that reason, this paper focuses on relative rather than absolute changes in the amount of heirs’ property.
Recent studies, outlined in this paper, have attempted to circumvent this problem by searching through the legal terms in property tax records to better identify potential or candidate heirs’ properties. Promising areas of future research include the PEW Charitable Trusts (2021) identification of heirs’ property using Social Security Administration’s death records and matching that data with the property records.
More applied research, particularly within economics, would help to identify and quantify the effects of the heirs’ property. In addition to identification, future research to estimate the effect of heirs’ property ownership on working lands including agriculture and forestry could be helpful. These future research outputs could assist policymakers and stakeholders to continue addressing issues of heirs’ property, especially among historically under-represented groups.
Competing interests
The authors declare none.
Disclaimer Statement
The findings and conclusions in this publication are those of the authors and should not be construed to represent any official USDA or U.S. Government determination or policy. This research was supported by the U.S. Department of Agriculture, Economic Research Service.
Appendix
This appendix section offers a more thorough theoretical discussion of different types of property right regimes. It is meant to be a more complete discussion than what is current offered in Section 3 of the study.
Section A.1 Open access property rights
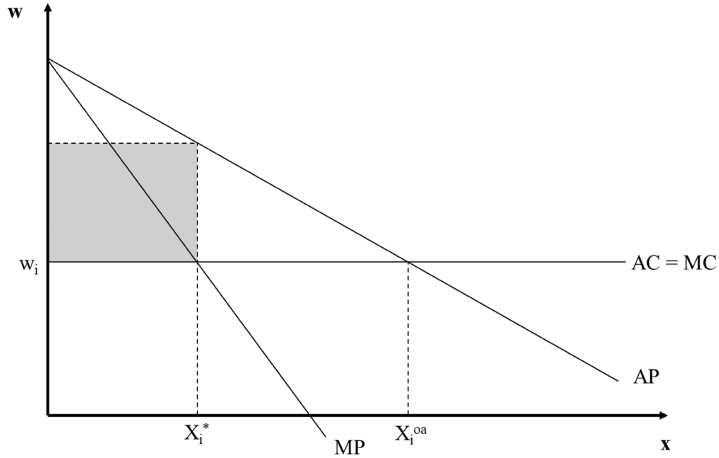
Based on the work of Gordon (Reference Gordon1954), Figure A1 illustrates an open access, Nash equilibrium solution to equation (4) offered in the main body of the manuscript. If only one person is operating the land and the property rights regime is defined as open access, then the first-best solution is $x_i^*$
, which generates positive rents (illustrated by the gray-shaded box). Though, as the number of users grows
$x_i^*$
, which generates positive rents (illustrated by the gray-shaded box). Though, as the number of users grows $(n \rightarrow \infty)$
, the open-access level of effort,
$(n \rightarrow \infty)$
, the open-access level of effort, $x_i^{oa}$
, becomes the optimal solution for each user (i.e., where the average product is equal to the marginal costs). As a result, the land asset is overused, and the asset loses all its value.Footnote
12
$x_i^{oa}$
, becomes the optimal solution for each user (i.e., where the average product is equal to the marginal costs). As a result, the land asset is overused, and the asset loses all its value.Footnote
12
Open access resource demand model.
Notes: This figure illustrates the demand for open access land. The term x denotes the effort in using the land for productive purposes to create a market output; w denotes the opportunity cost of leisure or the market wage. The terms AP and MP define the average and marginal product faced by a user. The terms AC and MC define the average and marginal costs faced by a user. The grey-shaded box depicts the positive rents accruing to a user who chooses the level of effort denoted by $x_i^*$
. The open access level of effort is denoted by
$x_i^*$
. The open access level of effort is denoted by $x_i^{oa}$
.
$x_i^{oa}$
.
Source: Figure created by the authors.

A.2 Private property rights
Land privatization is the solution to the open-access problem outlined in section three of the report and as represented by Figure A1 above. According to the Coase (Reference Coase1960) Theorem, the private property owner will face the full value and opportunity cost of the asset, and so she will choose a first-best level of input that is less than the open access level (i.e., $x^* \lt x^{oa}$
). Thus, the landed asset will generate a positive value that exceeds the present value of open access land (i.e.,
$x^* \lt x^{oa}$
). Thus, the landed asset will generate a positive value that exceeds the present value of open access land (i.e., $V^* \gt V^{oa}$
). Moreover, private ownership creates incentives for optimal resource use including maintenance and investment (Lueck & Miceli, Reference Lueck, Miceli, Polinsky and Shavell2007). That is, owners will seek to maximize the present value,
$V^* \gt V^{oa}$
). Moreover, private ownership creates incentives for optimal resource use including maintenance and investment (Lueck & Miceli, Reference Lueck, Miceli, Polinsky and Shavell2007). That is, owners will seek to maximize the present value, $V^*$
, of the future stream of the returns from the landed asset.
$V^*$
, of the future stream of the returns from the landed asset.
Private property rights are a necessary but not sufficient condition of the efficient use of a landed asset. That is, private property rights are defined such that the owner is free to make all decisions as to the productive use of the land. Yet, a landed asset can be private property, but it is co-owned by more than one individual, and each has a fractionated interest in the property (i.e., tenancy in common). In such cases, the co-owners must coordinate, and unanimous consent is required for any productive uses of the asset. Presumably, each co-owner has the right to exclude the others’ use of the asset. In the academic literature, this type of property ownership can be construed as an anticommon resource.
A.3 Anticommon resources
Anticommon resources identifies a type of property ownership in which many uncoordinated individuals have the right to exclude other users, thus creating a type of ownership in which assets are under-used and under-developed (Heller, Reference Heller1998, Reference Heller2008).Footnote 13 Problems associated with anticommons are sometimes referred to as “the tragedy of the anticommons” – as opposed to the “tragedy of the commons” literature (Hardin, Reference Hardin1968; Ostrom, Reference Ostrom1990). Deaton (Reference Deaton2007) and Deaton et al. (Reference Deaton, Baxter and Bratt2009) used the economic theory of anticommons to examine the consequences of heirs’ property. Consistent with Buchanan & Yoon (Reference Buchanan and Yoon2000), they argue that heirs’ property can lead to Pareto inefficient outcomes whereby land is under-utilized.


 Open access