

1. INTRODUCTION
As a dry-snow avalanche descends a mountain slope, a powder snow cloud develops and covers a dense flowing core when avalanche speed is >~10 m s−1 (Hopfinger, Reference Hopfinger1983). The powder cloud is considered to be initiated by turbulent eddies of the air that capture fine snow particles at the air-snow boundary and suspend them in the air. Well-developed dry-snow avalanches generally show layered structures: a dense-flow layer, a fluidized (saltation) layer and a powder (suspension) layer from bottom to top (Issler, Reference Issler, Hutter and Kirchner2003; Gauer and others, Reference Gauer, Issler, Lied, Kristensen and Sandersen2008). They are often referred to as mixed-motion avalanches or mixed powder snow avalanches.
The powder snow cloud can grow as long as the snow particles are lifted and entrained into the powder cloud. Physical modeling of the powder snow avalanche was first based on analogies with a gravity current driven by the difference in density between a fluid containing suspended particles and the ambient air (Beghin and others, Reference Beghin, Hopfinger and Britter1981; Beghin and Olagne, Reference Beghin and Olagne1991). The results showed no significant acceleration of the flow, since the particle entrainment process was not taken into account in the model. The lack of an entrainment condition induces rapid dilution of the flow mixed by the ambient fluid and a significant loss of driving force. Fukushima and Parker (Reference Fukushima and Parker1990) introduced the particle entrainment/settlement process and indicated that the powder cloud rapidly developed and flowed down the slope as a gravity current as long as turbulent energy was high enough to entrain particles from the snow surface and maintain them suspended in the air (self-ignition). The entrainment process was considered to occur over the entire length of the avalanche body in the model however recent avalanche observations suggest that the process entraining particles into suspension is more dynamic and local.
Bartelt and others (Reference Bartelt, Bühler, Buser, Ginzler, Naaim-Bouvet, Durand and Lambert2013) measured the movement of a full-scale avalanche powder cloud (e.g. changes in volume, height and speed) using photogrammetric techniques (Vallet and others, Reference Vallet, Turnbull, Joly and Dufour2004) and found that the powder cloud mainly formed at the leading edge of the avalanche. The snow particles were lifted up by eruption movements (blow-out) at the avalanche front and stayed in suspension behind the front with a low propagation speed (wake). The thermodynamic concept of configurational energy now provides a conceptual understanding of this process and can explain the blow-out of air from the avalanche core (Bartelt and others, Reference Bartelt, Buser, Vera Valero and Bühler2016). Particle eruption at the front would appear to be affected by entrainment processes. Measurements of the entrainment rate in the avalanche flow by FMCW radar (Gubler and Hiller, Reference Gubler and Hiller1984) indicate that the avalanche front rapidly erodes the snowpack by “plowing” (Gauer and Issler, Reference Gauer and Issler2004) when the snow cover is characterized by dry, low-density and cohesionless snow (Sovilla and others, Reference Sovilla, Burlando and Bartelt2006). The plowed snow cover can be pushed ahead and possibly comminuted and blown out. Another erosion process, fluidization of the snow cover by pore pressure gradient (Gauer and Issler, Reference Gauer and Issler2004), is also considered to be the cause of eruption movements (Louge and others, Reference Louge, Carroll and Turnbull2011; Carroll and others, Reference Carroll, Louge and Turnbull2013). Sovilla and others (Reference Sovilla, McElwaine and Louge2015) summarized and illustrated the formation of a fully-developed powder snow avalanche based on the results of air pressure, snow entrainment, velocity and other invasive measurements.
Although particle entrainment processes have been well investigated, we still lack information on the internal structure of powder snow avalanche. Particle size is a key parameter affecting the growth of the powder cloud, because the turbulent diffusivity and settling velocity of snow particles are described as a function of particle radius (Pomeroy and Male, Reference Pomeroy and Male1992). However, only one attempt has so far been made to directly measure particle size in situ within the powder cloud (Rastello and others, Reference Rastello2011). In their experiment, the size distribution of the snow particles suspended in the powder part of the avalanche was measured by means of a particle capturing technique. The particle distribution ranged from 0.03 to 0.8 mm with a geometric mean of 0.16 mm. This result showed good agreement with the previously estimated theoretical typical size that was <0.2 mm (Clément-Rastello, Reference Clément-Rastello2001). Another attempt has been made to obtain particle size and velocity from records of the impact pressure induced by single-particle impacts (Schaer and Issler, Reference Schaer and Issler2001) however the calculation was only carried out in the saltation layer since the impact pressures recorded in the powder cloud were surprisingly lower than expected.
A number of velocity measurements have been carried out in the powder cloud. Kern and others (Reference Kern, Bartelt, Sovilla and Buser2009) showed that the velocity of dilute flow over the height of the powder cloud could be successfully obtained by optical velocity sensors. The velocities fluctuated greatly, possibly due to the turbulent movements and inconsistent particle cluster size. Airflow speeds have been obtained using an ultrasonic anemometer (Nishimura and others, Reference Nishimura, Maeno, Kawada and Izumi1993, Reference Nishimura, Sandersen, Kristensen and Lied1995) and calculated from the air pressure distribution inside the avalanche (Nishimura and Ito, Reference Nishimura and Ito1997). To discuss the turbulent diffusion of particles, it is generally assumed that snow particles follow the movement of the air (Bintanja, Reference Bintanja2000). This means the ratio between the diffusion coefficients of air and snow particles, the Schmidt number, is assumed to be unity. However, in snow drift studies, analyses of mass concentration in the suspension layer of the blowing snow sometimes suggests a lower Schmidt number, <1 (Naaim-Bouvet and others, Reference Naaim-Bouvet, Bellot, Naaim, Nishimura, Naaim-Bouvet, Durand and Lambert2013). Therefore to estimate the turbulent diffusion of snow particles, the speed of each particle is as important as the particle size.
Recently some of the authors of the present paper succeeded in obtaining reasonable measurement results for particle sizes and speeds in a suspension layer of blowing snow using a snow particle counter (SPC) on the basis of particle sizes and durations of passages of individual particles through the sampling area (Nishimura and others, Reference Nishimura2014). For the present study, we observed snow avalanches covered by the powder cloud using the SPC, applying the method described above to measure particle size and speed. We also used an ultrasonic anemometer to measure air flow speed. Both sensors were recently installed at Lautaret avalanche test-site in the French Alps (Thibert and others, Reference Thibert2015) and the measured particle size and speed distributions were then compared with airflow movement in the powder cloud.
2. METHOD
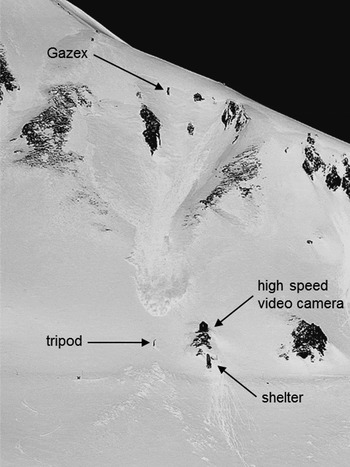
Avalanche experiments were carried out at Lautaret Pass, France (Ravanat and Ousset, Reference Ravanat and Ousset2010; Thibert and others, Reference Thibert2015). Among two avalanche paths (No.1 and No.2) located on the southeast slope of Mount Chaillol, the longest path (No. 2) was used in the experiments (Fig. 1). In this path, avalanches were triggered artificially and remotely by a GAZEX exploder from the starting zone ~2400 m a.s.l. Measurement instruments were set up on a 3.5 m high steel tripod located in the lower part of the avalanche path at 2238 m a.s.l.
View of the avalanche test site and the 2013 avalanche 2 s before its head impacted the tripod.

On the tripod, ten load cells and 20 velocity sensors were installed to provide measurements vertically within the depth of the dense-flow layer. The load cells (FGP, FN3000) were set up every 0.25 m from 0.75 to 3.0 m in height and were covered with a 0.11 m diameter pressure plate. The velocity sensors were set up every 0.125 m from 0.75 to 3.15 m in height. Each velocity sensor consists of a pair of units each made up of a photodiode and photo transistor set up 7.62 mm apart in the flow direction. The photodiode emits light and the photo transistor detects backscattered light by the avalanche with a small difference in time between the upslope and downslope units, giving the travel time. The velocity of the avalanche can be calculated from the distance and travel time between the upslope and downslope units (Dent and others, Reference Dent1998, Thibert and others, Reference Thibert2015). From the nearby shelter housing the acquisition system and the operators, a high speed video camera (200 fps, in 2013) or a standard digital camcorder (25 fps, in 2014) captured images of the tripod to observe how the SPC and the ultrasonic anemometer are flooded by the powder cloud.
An ultrasonic anemometer (Kaijo, TR-61B and DA-600) and an SPC (Niigata Electric, SPC-S7) were set up on top of the tripod to characterize the powder cloud (Fig. 2). The center of the sensing area was located 3.9 m high and offset 0.4 m laterally. The ultrasonic anemometer consists of three of pairs of ultrasonic transmitter/receiver probes facing each other across a specified span (20 cm). The three-dimensional wind speed (airflow speed in the avalanche) and direction data were obtained by measuring the change in apparent speed of sound between the probes induced by the wind (Hanafusa and others, Reference Hanafusa, Fujitani, Kobori and Mitsuta1982). Sound propagation in the avalanche can be blocked by an abundance of snow between the probes, however, in a previous study, signals without error were observed for a powder snow cloud at a speed ~10 m s−1, decelerated after separating from the dense core (Nishimura and others, Reference Nishimura, Sandersen, Kristensen and Lied1995). The existence of snow particles suspended in the air can also affect the sound propagation speed due to the increase of apparent air density, however, rough estimation showed the error induced by the change in air density is limited to ~3% in the preliminary results (Thibert and others, Reference Thibert2015). The SPC is an optical device consisting a laser diode and photodiode (Sato and others, Reference Sato, Kimura, Ishimaru and Maruyama1993). When a snow particle passes through the sensing volume (2 mm × 25 mm × 0.5 mm), a pulse signal proportional to its diameter is generated. The absorption cross-section of snow particles is converted into an equivalent spherical particle diameter. The signals are sent to a transducer and divided into 32 size classes based on particle diameters (ranging from ~40–500 µm) to observe the snow particle size distribution and mass flux at 1 s intervals. Note that if the diameter of a snow particle is >500 µm, the snow particle is assigned to the maximum diameter class. Additionally, if the signal is continuously saturated due to the presence of too high a concentration of particles in the sensing volume, the associated signals are eliminated since the SPC is also designed to block the DC component of continuous signals, as is done to cancel ambient light disturbances. In this study, the direct output signal from the transducer was also acquired at a high frequency to obtain the original pulse signal produced by each snow particle. In this way, the speed of each particle v can be calculated using the peak of the pulse, which corresponds to particle diameter d and the duration t over which the particle passes through the sampling area, as follows:
 $$ v \,\,{\rm = (}L\,{\rm +}\,d{\rm ) /}t{\rm,} $$
where L is the length of the sampling area in the downslope direction (0.5 mm). This method was first used to measure blowing snow and is described in detail in Nishimura and others (Reference Nishimura2014). It must be noted that the calculation assumes only slope-parallel movement of particles; vertical or lateral movements under turbulent conditions cannot be detected.
Experimental setup on the measurement tripod. (a) Ultrasonic anemometer; (b) SPC; (c) load cell for impact pressure measurement; (d) velocity sensor for dense-flow speed measurement. The center of the sensing area of the ultrasonic anemometer and SPC is ~40 cm above the tripod and offset 40 cm laterally.

The data were sampled at 60.1 kHz (in 2013) or 120 kHz (in 2014) from the ultrasonic anemometer and SPC. The velocity sensors and the impact pressure signals measured by the load cells in the dense flow were recorded at 60.1 and 3 kHz, respectively.
3. RESULTS AND DISCUSSION
3.1. Avalanche experiment in 2013
The first avalanche experiment was conducted on 10 April 2013. Before the experiment, the lower part of the tripod was covered by the snowpack and only 1.1 m of the upper part of the tripod stood out of the snow cover, with the ultrasonic anemometer and SPC located ~1.5 m above the snow surface. The conditions prior to the avalanche release can be summarized as follows: after a period of dry weather, snowfall started in the early morning of 8 April at 02:30 and ended on 9 April at 17:30. Our weather station measured an air temperature of −4.9°C during the snow fall. The precipitation amounts were estimated from a snowpit in which a stratigraphic profile was measured. A total of 36 mm w.e. of solid precipitation accumulated and formed a ~25 cm thick deposit of new snow. The mean density was 145 kg m−3 with a lighter layer of 120 kg m−3 density at bottom, between 10 and 25 cm below the surface. At the time of the release of the avalanche (11:42), the air temperature had risen to −0.1°C. An ~25 cm thick layer of fragmented and decomposing particles was released in the avalanche path. In the released layer, the particle size was <0.5 mm and the hardness was 1. The snow temperature of the released layer was 0°C near the surface and the snow remained dry in the deeper part. The wetness code was 3 for this temperate snow layer. Under the failed slab, we observed a layer of small rounded particles. Figure 1 shows the avalanche flow 2 s before it reached the tripod. Figure 3 shows frames captured from the high-speed video and Figure 4 shows data recordings of the air flow speed obtained by the ultrasonic anemometer, SPC direct output acquired by high-frequency sampling, impact pressures and flow velocities in the dense-flow layer. The time origin is arbitrary and without reference to avalanche initiation.
Lateral view of the 2013 avalanche experiment obtained with a high-speed video camera at (a) 15.5 s, (b) 15.9 s, (c) 16.9 s. In panel (a), the tripod with the ultrasonic anemometer can be seen on the left.

Data obtained during the 2013 experiment. (a) Airflow speed obtained by the ultrasonic anemometer (black line: downslope direction, gray line: vertical (upward positive), light gray line: lateral component); (b) direct output of the SPC; (c) impact pressure measured with the topmost load cell (~62.5 cm above the snow surface); (d) dense-flow speed obtained by the velocity sensor at 0.25 s intervals (black circle: ~75 cm, open circle: ~62.5 cm, triangle: ~50 cm above the snow surface).

The video frames indicate that the avalanche front arrived at the measuring point at ~15.5 s (Fig. 3a). The maximum leading edge velocity was ~20 m s−1 (Fig. 4d). Then the height of the powder cloud gradually increased and the impact pressure showed a continuous signal after 15.9 s (Figs 3b and 4c). This means a dense-flow layer reached the tripod with greater thickness than the position of the topmost load cell (0.9 m below the ultrasonic anemometer and SPC). Note that the powder cloud was not sufficiently high to cover the ultrasonic anemometer and SPC at this point. However, it was close enough to allow detection of large vertical airflow movements and a significant number of particles (Figs 4a and b). After 16.9 s, the airflow speed rapidly increased to almost the same magnitude as measured in the dense part (Figs 4a and d) and the SPC output signals ended abruptly. This result suggests that the thickness of the dense flow increased up to the level of the ultrasonic anemometer and SPC output was eliminated probably because a significant number of particles were concentrated in the sensing volume. During the experiment, significant erosion of the snowpack was not observed. Hereafter, we mainly focus on the avalanche front, i.e. on data recorded before 16.9 s.
3.2. Avalanche experiment in 2014
The second set of avalanche data was obtained on 5 March 2014. The tripod stood out ~1.5 m above the snow cover, with the ultrasonic anemometer and SPC located ~1.9 m above the snow surface. Figure 5 shows a snapshot taken when the avalanche head impacted the tripod and Figure 6 shows data recorded during this avalanche including airflow velocity, SPC counts and impact pressure and flow speed of the dense part of the flow. The signals from the ultrasonic anemometer contained periodic 1 Hz noise; hence Figure 6 shows data after noise reduction by means of a 0.5–1.5 Hz band elimination filter. The avalanche was released artificially at 13:35. On 3 March, a snowfall occurred between 02:00 and 17:30 providing 21.6 mm w.e. of solid precipitations. Our weather station measured a mean air temperature of −7.2°C during this period. The precipitation amounts were estimated from a snowpit. This solid precipitation formed a ~18 cm thick layer of fragmented and decomposing particles. The mean density of the layer was 120 kg m−3. The weather remained cold and cloudy until 5 March. At the time of the release of the avalanche, the air temperature had risen to −2.4°C. The average temperature of the fresh snow layer was −2.9°C and its hardness was 1. In the morning of 5 March, some slight melting began at the surface, where the snow was humidified (wetness code 2). The 18 mm thick layer of fresh snow was released in the avalanche path as a mixture of upper temperate snow and deeper dry and cold particles.
Lateral view of the 2014 avalanche just as it reached the tripod.

Data obtained during the 2014 experiment. (a) Airflow speed obtained by the ultrasonic anemometer (black line: downslope direction, gray line: vertical (upward positive), light gray line: lateral component); (b) direct output of the SPC; (c) impact pressure measured with the topmost load cell (~50 and 100 cm above the snow surface); (d) dense-flow speed obtained by the velocity sensor at 0.25 s intervals (black circle: ~100 cm, open circle: ~75 cm, triangle: ~50 cm above the snow surface).

The avalanche flow was mainly composed of snow balls probably due to cohesion in relation to the slightly wet snow conditions at the surface (Steinkogler and others, Reference Steinkogler, Gaume, Löwe, Sovilla and Lehning2015). No significant erosion of the snowpack was observed. The maximum leading edge velocity was <15 m s−1 (Fig. 6d). No apparent powder cloud was observed, however, the SPC detected particles at 38.5–39.0 s. During this period, a vertical air flow with a relatively high velocity (Fig. 6a) and the impact of the dense flow (Fig. 6c) were observed. Hereafter, we mainly focus on the avalanche front data at ~38.5–39.0 s.
3.3. Particle size distribution
Figure 7 shows particle size distributions obtained from the SPC outputs for the 2013 and 2014 avalanches. For the 2013 avalanche, 2647 particles were extracted from the SPC signals, while only 43 particles were extracted from the 2014 avalanche due to the very thin powder cloud. For both avalanches, the maximum diameter class (~500 µm) contains a higher number of particles than the adjacent classes, since all particles larger than the measuring limit (500 µm) were assigned to this class. In Figures 4b and 6b, the saturated signals corresponding to the detection of large particles were mainly recorded near the avalanche front. This is also confirmed by the change in the particle size distribution with time in the 2013 experiment. Figure 8 shows the particle size distribution in 0.5 s intervals covering the avalanche passage from head to tail. The particle sizes clearly decreased with time, as shown by the shifting of the distribution to lower diameters and the reduction in scatter. In particular, particles larger than 400 µm were mainly found during the passage of the avalanche front. A first conclusion is that the particle size distribution cannot be considered as constant at a given point on the track throughout the duration of the avalanche flow.
Particle size distribution obtained from SPC outputs (Top, at 15.4–16.9 s in the 2013 experiment; bottom, at 38.5–38.9 s in the 2014 experiment). Gray lines show probability density functions estimated by the gamma function.

Changes in particle size distribution with time for the 2013 avalanche. From left to right, 15.4–15.9 s, 15.9–16.4 s, 16.4–16.9 s. Gray lines show probability density functions estimated by the gamma function.

Budd (Reference Budd and Rubin1966) and Schmidt (Reference Schmidt1982) found that the particle size distribution of blowing snow particles suspended in the air could be accurately estimated by the two-parameter gamma probability density function, according to:
 $$f\,(d) = d^{\alpha - {\rm 1}} \displaystyle{1 \over {\beta ^\alpha {\it \Gamma} (\alpha)}} {\exp\left({- \displaystyle{d \over {\it \beta}}}\right)},$$
where d is the particle diameter, Γ(α) is the gamma function and α and β are shape parameters that describe the skewness and width/scale of the distribution, respectively. The values of α and β are determined from the mean and variance of the distribution, which correspond to αβ and αβ 2, respectively. Similarly we may apply the gamma distribution to the particle size distribution in the powder cloud, since the particles are suspended in the turbulent air like in the blowing snow. In Figure 7, the particle size distribution was fitted by the gamma distribution and well approximated in the 2013 experiment (α = 4.6; β = 46.9), while the approximation failed for 2014 due to an insufficient number of particles. Note that the number of large particles over 500 µm was eliminated in the fitting. The goodness of the fit was examined using the chi-square test by calculating differences between the observed and approximated number of particles. The result yielded a P-value of 0.13 in the 2013 avalanche, which suggests that the fitting of the particle size distribution by the gamma distribution can be considered statistically significant. However, for the 2014 avalanche, the chi-square test was infeasible since the number of particles in each diameter class was statistically too small.
Regarding blowing snow studies, it is known that the α-value of the gamma distribution changes with height, i.e. in the vertical (normal to slope) direction under our conditions. For blowing snow measurements in Antarctica (Nishimura and Nemoto, Reference Nishimura and Nemoto2005), the vertical profile of the α-value was lowest near the snow surface, ~5 up to 0.1 m in height, then gradually increased up to 10 at 10 m in height. For the gamma distribution fitted to the snow avalanche data (Figs 7 and 8), the α-values are almost constant around the value of 5 (4.4–5.2), corresponding to particle sizes located at <0.1 m in height in blowing snow observations. We also compared the mean particle size observed in the blowing snow and snow avalanche experiments. Pomeroy and Male (Reference Pomeroy and Male1992) indicated that the vertical profile of blowing snow mean diameter (P d) is expressed as P d = 9.2 × 10⁻⁵ h −0.258, where h is the height above the snow surface. If we substitute the mean diameter (Fig. 7, 214 µm) found in the 2013 experiment, h is calculated to be 0.04 m high. Since the suspension layer in blowing snow is generally present above a height of 0.1 m, the above α and h values obtained in the powder cloud seem quite different than those of the suspension layer of the blowing snow.
3.4. Suspension conditions
To understand how large particles were suspended in the powder snow cloud, we calculated particle suspension conditions. If the suspended particles are assumed to be spheres, the particle settling velocity w f can be obtained theoretically from the balance of drag and gravity forces acting on a particle, as follows:
 $$\displaystyle{{\rm 1} \over {\rm 8}}\pi C_{\rm D} \rho _a d^{\rm 2} w_{\rm f} ^{\rm 2} = \displaystyle{{\rm 1} \over {\rm 8}}\pi {\rm (}\rho _{\rm p} - \rho _a {\rm )} d^{\rm 3} g,$$
where C D is the particle drag coefficient, ρ a and ρ p are the density of air and the particle, respectively, d is the particle diameter and g is the gravitational acceleration (note that we cannot measure vertical (normal to slope) movements of particles using SPC). The left-hand side of Eqn (3) represents the drag force acting on the particle, while the right-hand side expresses the force balance between upward buoyancy and gravity. The drag coefficient was correlated as a function of particle Reynolds number, Rep = w f d/v, where v is the kinematic viscosity of air. Here we adopted the Schiller-Naumann drag expression, which is appropriate in the range of intermediate particle Reynolds numbers (0.1 < Rep < 800; Tran-Cong and others, Reference Tran-Cong, Gay and Michaelides2004) and which reads:
 $$C_{\rm D} = \displaystyle{{{\rm 24}} \over {{\rm Re}_{\rm p}}} {\rm (1 + 0}{\rm. 15 Re}_{\rm p} ^{{\rm 0}{\rm. 687}} {\rm )}{\rm.} $$
It seems reasonable to admit that particles can remain suspended if turbulent velocity fluctuations exceed the particle settling velocity (Bagnold, Reference Bagnold1966). The vertical velocity fluctuation can be calculated by decomposing the vertical air flow speed data W into its mean ( $\bar W$
) and fluctuations around the mean (w’):
$\bar W$
) and fluctuations around the mean (w’):
 $$W = \bar W + w^{\prime}.$$
A suspension condition can be estimated as the ratio of the velocity fluctuation to the settling velocity, w’/w f, particle suspension occurring at values higher than unity.
Figure 9 shows the particle settling velocities predicted by Eqn (3) and (4) and the vertical velocity fluctuations (as a root mean square, 〈w′2〉0.5) calculated for 1 s before and after (in 2013) and 1 s after (in 2014) the avalanche front (nearly the time it took for the dense flow to arrive), as a function of particle diameter. The vertical velocity fluctuations were almost the same in all cases however, the ratios between the particle settling velocity (w’/w f) were not consistent due to the different mean particle diameters. During the passage of the front of the 2013 avalanche (15.4–15.85 s), particles with diameters <~200 µm can be kept in suspension (w’/w f > 1), although the observed mean diameter was ~270 µm. The disagreement in sizes suggests that the large particles seemed not to be carried by turbulent diffusion.
Particle settling velocities and vertical velocity fluctuations as a function of particle diameter (solid line: particle settling velocities predicted by Eqns (3) and (4); open circle: vertical velocity fluctuation and mean particle diameter before 15.9 s in 2013; closed circle: vertical velocity fluctuation and mean particle diameter after 15.9 s in 2013; closed square: vertical velocity fluctuation and mean particle diameter after 38.3 s in 2014; bar: standard deviation on either side of the mean).

We may consider several possible explanations for larger particles becoming airborne at the front: e.g. a particle eruption process near the leading edge (Bartelt and others, Reference Bartelt, Buser, Vera Valero and Bühler2016), upward movement induced by the impact with the tripod or interaction between the avalanche flow and the snowpack (erosion process). The high-speed video recordings of the 2013 avalanche (Fig. 3a) and vertical airflow speed (Fig. 4a) showed no significant vertical motion near the front (~15.5 s). However, we found that the particles were splashed upward by the collisions between the avalanche flow and the rough snow surface (snowballs deposited in front of the tripod; Fig. 10a). The fragments produced by the collision process could be the source of the large particles. On the other hand, after the passage of the front of the 2013 (15.9–16.35 s) and 2014 (38.3–39.25 s) avalanches, most of the particles satisfy the suspension condition. This is caused by the decrease of large particles produced by the collisions, since the avalanche flow quickly breaks up the rough obstacles, thereby smoothing the snow surface. The large particles, in the non-suspendable regime (w’/w f < 1), may settle soon after.
Leading edge of the 2013 avalanche obtained with a high-speed video camera. (a) The avalanche flow approaching the tripod and the rough snow surface; (b) collisions between the avalanche flow and the rough snow surface produced splashing particles.

Note that the previously estimated suspended particle sizes (<0.2 mm by Clément-Rastello, Reference Clément-Rastello2001) satisfy the suspension condition by turbulent diffusion under the 2013 and 2014 avalanche conditions for vertical velocity fluctuations. However, the representative particle size may vary in time and position in the avalanche, reflecting particle entrainment processes (direct ejection or turbulent diffusion). The avalanches used in our analysis were relatively small to medium in size, hence larger particle sizes may be observed in powder clouds of larger avalanches such as those at Vallée de la Sionne (Bartelt and others, Reference Bartelt, Bühler, Buser, Ginzler, Naaim-Bouvet, Durand and Lambert2013; Sovilla and others, Reference Sovilla, McElwaine and Louge2015) than in those at Lautaret.
3.5. Particle speeds
Snow particle speeds were calculated from the high-frequency SPC sampling data. In the analysis procedure, the following pulses were eliminated: (i) overlapped pulses due to the presence of multiple particles in the sensing volume, (ii) low-amplitude pulses corresponding to particles <36 µm in diameter, (iii) very narrow pulses, i.e. faster than the maximum dense-flow speed in Figures 4d and 6d. Figure 11 shows the changes in particle speeds with particle diameter. The mean particle speeds decreased from 11 to 2 m s−1 as particle diameter increased in 2013, while no apparent relationship was observed in 2014 due to a highly dispersed particle size distribution (Fig. 7).
Particle speeds as a function of particle diameter (a) for the 2013 experiment 2013; (b) for the 2014 experiment. Dots are mean values and the bars extend one standard deviation on both sides of the mean.

Figures 12 and 13 show the fluctuations in particle speed and size and airflow speed in 2013 and 2014, respectively. Note that the particle speeds for the 2013 avalanche were obtained from the mean particle size and the particle speed-size relationship in Figure 11, since many pulses with large amplitudes (corresponding to large particle sizes) were eliminated by the non-overlap condition. On the other hand, the particle speeds for the 2014 avalanche were obtained from the mean values since overlapped pulses were rarely observed.
Particle speed and size distribution as a function of time for the 2013 avalanche. (a) Particle speeds (calculated using mean particle sizes and the curve in Fig. 11a) and airflow speed (resultant wind vector); (b) mean particle sizes.

Particle speed and size distribution as a function of time for 2014. (a) Mean particle speeds plotted with the airflow speed (resultant wind vector); (b) mean particle sizes. Dots are mean values and the bars extend one standard deviation on each side of the mean.

For the 2013 avalanche, the mean particle speeds were mainly ~5 m s−1 while the airflow speed was somewhat higher, ~6–10 m s−1. It must be noted that the downslope airflow speed includes background wind at an almost constant speed (5 m s−1) before the arrival of the avalanche front. However, the particles ejected from the dense flow can also be driven by the background wind. Therefore, it seems reasonable to say that the airflow speed indicates the speed of the powder cloud itself. For the 2014 avalanche, the differences between the particle and airflow speeds were smaller than for 2013. This is probably due to the smaller particle sizes than in 2013 (Fig. 7). The particle speed dependence on particle diameter (Fig. 11) indicates that small particles can move as quickly as the air.
It would seem reasonable to suppose that the snow particles were captured in the powder cloud with an initial speed equivalent to the dense flow (10–20 m s−1, Figs 4d and 6d). However, the maximum particle speed measured by the SPC was ~11 ms−1 (Fig. 11). One possible explanation lies in the limitations of the SPC measuring technique: only the slope-parallel velocity component is measured, although the particle may have large vertical or lateral velocity components. Another possibility is that the velocity of particles entrained from the dense flow rapidly decreases probably due to air drag. Note that a difference in speed between particles and airflow was also reported for blowing sand/snow events, where the turbulent particle movements would be smaller than in the avalanche (Zhang and others, Reference Zhang, Wang and Lee2008; Nishimura and others, Reference Nishimura2014).
4. CONCLUSION
Snow avalanche experiments have been conducted using an ultrasonic anemometer and a SPC to investigate particle size and velocity in the powder cloud of artificially released avalanches. Results indicate that particle size is not constant at a given point in the track throughout the avalanche flow, decreasing slightly from the passage of the head of the avalanche to the passage of the main core of the flow. The calculation of the suspension condition reveals that for large particles observed during the passage of the avalanche front, typically larger than 200 µm, this condition does not hold and particles seem to be lifted up by a process involving collisions between the avalanche flow and the rough snow surface. On the other hand, the particle size distribution during the passage of the avalanche body agrees well with the suspension condition. The particle size distribution can be well described by a gamma distribution as established previously for blowing snow particles. In addition, the mean particle size shows good agreement with previous theoretical estimates. The particle speeds showed relatively lower values than the airflow speed in the 2013 avalanche. This result may suggest a rather low diffusivity of large snow particles in the turbulent air. To improve our understanding of the entrainment/settlement process in the powder cloud, more experimental results under various conditions are required, particularly changing the height of the sensors above the dense-flow layer and measuring particle velocities in the vertical and lateral directions.
ACKNOWLEDGEMENTS
We thank F. Ousset for helpful support in installing the devices and in conducting the experiments. We are grateful to the reviewers, B. Sovilla and B. Turnbull, for their insightful comments. This work was supported by funding from the MAP3 ALCOTRA INTERREG programme and partly by Grants-in-Aid No. 22253001 from the Ministry of Education, Culture, Sports, Science and Technology of Japan. Irstea Grenoble is a part of labex Osug@2020.


 Open access