


In a democracy, it ought to be the case that citizens’ preferences and attitudes inform the way political representatives design policy. Research reveals that citizens’ policy preferences are, themselves, informed by their political predispositions, such as partisanship and political ideology, but they are also shaped by individuals’ attitudes toward particular target groups. To be more specific, people’s orientation toward how a target group should be treated in the policy realm is influenced by whether and the extent to which they view that group as deserving. Indeed, research reveals that evaluations of deservingness, in some ways, overrides partisan and ideological predispositions because humans, generally speaking, are inclined and willing to extend help to those viewed as deserving, and are, in contrast, are dismissive or even willing to tolerate punitive policy for those who are not perceived as deserving (Petersen Reference Petersen2012; Schneider and Ingram Reference Schneider and Ingram1993).
Despite the universal effect of what scholars refer to as the deservingness heuristic (Hansen Reference Hansen2019; Petersen Reference Petersen2012), orientations toward deservingness do appear to differ across global context (Aarøe and Petersen Reference Aarøe and Petersen2014). These differences are manifested not only in dominant ideological narratives but also in policy outcomes. For instance, societies like the United States (US) and the UK are more likely to blame poor people for their condition than those in Scandinavian countries, which tend to rely on more sympathetic depictions of the less fortunate and have greater emphasis on values of equality and egalitarianism (Gilens Reference Gilens1999; Larsen and Dejgaard Reference Larsen and Dejgaard2013). Relatedly, the US’ dominant narratives include that of rugged individualism and personal responsibility, an ideology that is relied upon to rationalise a robust welfare state that seeks to discipline the poor (Soss et al. Reference Soss, Fording and Schram2011). Needless to say, the US’s social safety net policies leave much to be desired, particularly in comparison to its wealthy counterparts.
These kinds of global comparisons bear two key insights and points of motivation for this article, which analyses the variation and effect of subnational evaluations of deservingness. First, it appears that orientations toward deservingness of target populations fluctuate across political contexts (despite the universal effect of the deservingness heuristic) due to media depictions, policy path dependency, and demographic dynamics (Rothstein Reference Rothstein1998; Soss et al. Reference Soss, Fording and Schram2008; Aarøe and Petersen Reference Aarøe and Petersen2014; Schneider and Ingram Reference Schneider and Ingram2019, Reference Schneider and Ingram1993).
Second, comparative analyses across countries also highlight the notion that it is collective attitudes around deservingness that we should be concerned about if we want to gain an understanding of the link between deservingness evaluations, policy design, and policy outcomes. Indeed, social scientists remind us that “although concrete political action is invariably the behaviour of individual human actors, the politically significant units of actions are groups, associations, organisations, communities, states, and other collectivities” (Eulau et al. Reference Eulau, Fallers, Kruskal, Lindzey, Rees, Reiss, Shils and Sills1968, 209). Our focus in this article, then, concerns the link between state-level evaluations of target populations and policy design respective to various groups in order to accurately depict the patchwork of inequality that characterises the American political landscape.
Though sometimes overlooked (Merriman Reference Merriman2019, but see Bonneau and Kanthak Reference Bonneau and Kanthak2019), scholars of state politics have made it quite clear that acknowledgement of state political dynamics helps scholars to better understand the shape of inequality in American society. There is wide variation in the way that US states structure laws and policies around issues that influence the day-to-day lives of American residents. For instance, each state dictates and implements policy that determines the scope and limits of social safety nets, policing, and voting, as a few examples. Indeed, the states have all powers that are not specifically delegated to the federal government, as mandated by a very concise US Constitution. Lowi (Reference Lowi1998) explains, “All of the fundamental policies that regulate conduct of American citizens and corporate persons have been and still are made by the state legislatures. State government in the US is a regulatory state, and as a regulatory state it specialises in setting rules of conduct and backing those rules by sanctions.” Given the broad scope of state policies and laws, experts have asserted: “Geography is destiny: the services available to people from eligible populations…are determined not by what their problems are or the kinds of services they may need, but rather by where they happen to live” (Sandefur and Smyth Reference Sandefur and Smyth2011, v).
We pair a core theory of policy design and feedback alongside a helpful methodological strategy in order to assess subnational evaluations of deservingness and to develop a nuanced approach to predicting interstate variation in policy outputs. Our theoretical and methodological decisions are motivated to produce several key insights. First, we discern whether evaluations of deservingness vary across states; in doing so, we are able to produce state-level scores of deservingness for a wide range of target populations. Second, we elucidate the link between micro- and macro-level orientations in deservingness as well as the link between collective orientation towards pertinent political matters and state policy outcomes. Third, the following analyses serve to expand the literature concerning deservingness beyond questions of social welfare policy. Scholars have made an impact by focusing on welfare (Oorschot Reference Oorschot2000; Petersen Reference Petersen2012; Aarøe and Petersen Reference Aarøe and Petersen2014; Hansen Reference Hansen2019; Ellis and Faricy Reference Ellis and Faricy2020; Meuleman et al. Reference Meuleman, Roosma and Abts2020) and others have analysed the link between deservingness and affirmative action (Reyna et al. Reference Reyna, Henry, Korfmacher and Tucker2006). Our analyses include a wide array of policy targets and related policy outcomes for criminal justice, immigration, gun owners and interest groups alongside the matter of social welfare policy. Taken together, the core contribution of this article resides in the revelation that as we move across the US, state-level electorates diverge in their assessments of who is deserving of beneficial policy; when we take into account the unique histories and context of the states, we become more cognizant as to why, above and beyond partisan climates and ideological make-up, citizens’ tolerance for inequality varies as we move from state to state.
We begin this article with a discussion of the insights provided by the scholarship on deservingness, and then, we outline our rationale for centreing evaluations of deservingness at the subnational level. Then, we summarise our expectations for variation in state-level deservingness scores. Afterward, we turn to a series of tests that examine both the subnational variation in evaluations of target groups as well as the link between these evaluations and state-level policy outputs. This series of tests reveal a wide range of deservingness evaluations across the subnational level, and further, they identify a link between these evaluations and state policy patterns.
Assessments of deservingness
A central set of questions in political science and public policy concern who gets what, when, and how. Scholars, especially those concerned with the distribution of social welfare resources, have largely emphasised the role of two key predictors: citizens’ values, principles, and predispositions, on one hand, and the deservingness heuristic, on the other (Hansen Reference Hansen2019; Ellis and Faricy Reference Ellis and Faricy2020). To be sure, the scholarship on values and political predispositions like partisanship or one’s ideological bend, certainly does reveal that conservatives and Republicans, in contrast to liberals and Democrats, are less likely to support a broad welfare state and are more inclined to believe that those who need welfare are lazy, and thus undeserving in the US context (Skitka and Tetlock Reference Skitka and Tetlock1993; Gilens Reference Gilens1999). However, research also reveals that “the deservingness heuristic operates independently of citizens’ values,” and thus, is a universal psychological mechanism that shapes individuals’ decisions about who ought to get what (Hansen Reference Hansen2019, 413).
Evaluations of deservingness are multidimensional. Wim van Oorschot (Reference Oorschot2000) explains that when the public considers their response to “who should get what,” there are five criteria on the table. First, there is a question of whether the group’s problem is in their control; people are viewed as deserving if they are lacking in control of their condition. The second point of assessment focuses on the recipients’ attitude toward support, whereby those who are perceived to be docile, grateful, or more compliant, are viewed as deserving. Third, target population’s need is incorporated into evaluations of deservingness; perceived need and deservingness evaluations are positively correlated. Fourth, the identity of the group matters, such that the proximity of the target group to one’s own is associated with deservingness. Finally, van Oorschot (Reference Oorschot2000) notes that the degree of reciprocation by the target group influences assessments of deservingness; specifically, the public notes whether a group is doing their part to help themselves, or to give back to society within their constraints.
This complexity is subsumed in and deployed through the deservingness heuristic. Again, relying on the social welfare literature, scholars reveal that when citizens are provided with cues or information which suggest that potential welfare recipients suffer due to unlucky circumstances out of their control, citizens tend to categorise those individuals as deserving. Meanwhile, individuals tend to categorise their fellow citizens as underserving when they are provided cues suggesting potential recipients are lazy or are not doing their part to improve their status. Despite the underlying ideological differences between conservatives and liberals, or across partisan identities, research shows that people across these spectra are swayed to similarly categorise individuals as deserving or not due to the deservingness heuristic (Petersen Reference Petersen2012).
Despite the universality of the deservingness heuristic, on the ground, the conditions that present the triggering cues are context-specific. For instance, given the US’ propensity toward rugged individualism and personal responsibility, the poor are more likely to cast as lazy (Gilens Reference Gilens1999). In contrast, elites and media of social democratic welfare regimes, such as those in Scandinavian countries, are more likely to rely on depictions of the poor that would cue citizens to categorise the poor as deserving of help; in fact, the configuration of the regime itself reduces the necessity of drawing clear lines between the needy and the non-needy (Rothstein Reference Rothstein1998; Larsen and Dejgaard Reference Larsen and Dejgaard2013).
Still more, many policy matters and target groups are racialised in the US. Indeed, the interplay of race and racism, deservingness, and public preferences have produced opposition to social welfare policies by white Americans (Gilens Reference Gilens1999). Even though social welfare benefits would help a wide range of Americans, whites are of the belief that Black folks both lack a committed work ethic and implicitly link poverty with Blackness—both due in part to dominant media images as well as elite’s implicit or explicit racial rhetoric (Gilens Reference Gilens1999; López Reference López2015; Christiani Reference Christiani2021). This pattern has extended to other policies areas that have been historically race neutral in an era marked by what Michael Tesler (Reference Tesler2012, Reference Tesler2016) refers to as a racial spillover effect. Taken together, research reveals that support for a range of anti-poverty programs is less popular than it ought to be because Americans receive cues that “both activate racial prejudices explicitly and because they prime conceptions of deservingness that are also conditioned on racial prejudices” (Ellis and Faricy Reference Ellis and Faricy2020, 824). Here, the deservingness heuristic is triggered by cues that suggest that potential recipients of beneficial policies are lacking in each of the five aforementioned criteria outlined by van Oorschot (Reference Oorschot2000).
Deservingness and policy feedback
Policymakers are motivated to make good policy (Fenno Reference Fenno1978), but they are also, in no small part, motivated by self-interest, particularly as it relates to getting re-elected (Mayhew Reference Mayhew1974). One way policymakers work toward the latter goal is by attempting to assess their constituents’ beliefs and values about target populations (Schneider and Ingram Reference Schneider and Ingram2019). Social construction theory illuminates the idea that policymakers’ anticipation of public feedback tends to lead them to provide benefits to groups that are not only seen as politically powerful but also deserving; meanwhile, representatives are likely to assume that they will be politically rewarded for developing punitive policies for those who are both powerless and underserving (Schneider and Ingram Reference Schneider and Ingram1993). This kind of systematic provision of benefits to some groups and disadvantages to others has the potential to entrench inequality.
Policymakers can take advantage of the public’s tendency to not only rely on group categorisations but also its reliance on group stereotypes, particularly as these stereotypes relate to the various components of deservingness. Indeed, Schneider and Ingram (Reference Schneider and Ingram1993, 335) conceptualise social constructions as, “stereotypes about particular groups of people that have been created by politics, culture, socialisation, history, the media, literature, religion, and the like.” Those with positive social constructions are viewed as intelligent, honest, public-spirited, hardworking, beautiful, worthy, smart, good, loyal, disciplined, respectful, creative, and the like; as a consequence, these groups tend to viewed, on the whole, as deserving of positive, beneficial public policies. On the other end of the spectrum, there are groups that are deemed to be disrespectful, immoral, disgusting, lazy, dishonest, stupid, and selfish; or to summarise: undeserving.
Beyond highlighting the connection between public perceptions of deservingness and the kinds of policies the public is willing to support or tolerate respective to various groups, a key insight of the social constructions theory is that it pinpoints how policy becomes politics. Specifically, it reveals how policy telegraphs messages to the public. The framework highlights the notion that the policies that are developed and policymakers’ justifications for them to influence how the public views target populations. In an iterative process, the public comes to buy into the idea that those who receive benefits deserve them and deserve more of them in the future. The same can be said for target groups who receive retaliatory policy outputs. Ellis and Faricy (Reference Ellis and Faricy2020) elucidate this endogenous process eloquently, “[W]hile perceptions of beneficiaries of social programs can condition a range of policy tools available to assist them, the causal arrow also can go in the other direction; that the means through which policy benefits are delivered can help condition perceptions about beneficiaries.” Taken together, policies shape society’s ideas about who is deserving or undeserving as well as its ideas about what kinds of future policies should be created, tolerated, or eliminated as they relate to specific target populations.
State politics and variation in deservingness
It is important, however, to note that an underlying assumption of social constructions theory is that consensus is likely to arise around the degree to which the public believes that various target groups are deserving (Schneider and Ingram Reference Schneider and Ingram1993, Reference Schneider and Ingram2019), but recent research has challenged this assumption. Specifically, Kreitzer and Smith (Reference Kreitzer and Smith2018) find that there is a significant number of politically relevant target populations—those groups which are salient due to historical legacies of inequality or due to contemporary political and media attention—who do not enjoy a consensus around their social construction.
When we take into consideration the variation in state policy, such a conclusion may read as intuitive. That is to say, some of the lack of consensus at the national level may arise because social constructions of target populations may differ across the US states. Here, we take the opportunity to theorise why these interstate differences may arise, determine whether empirical data supports our intuition, and analyse the political and policy ramifications for these interstate differences. There are three primary reasons why we expect to find subnational variation in evaluations of deservingness.
First, it is well understood that states are policy laboratories. States vary significantly in the shape and components of their policies, and these decisions can have long-lasting effects, including the effects they have on shaping public perceptions of groups and even “commonsense.” Campbell (Reference Campbell2011), reiterating Ellis and Faricy’s (Reference Ellis and Faricy2020) point, notes, “the design of public policies influence preferences and alter patterns of political mobilisation, effects that feed back into the political system, shaping the political environment, and the possibilities for future policy making.” For instance, scholars reveal that historically, the death penalty tended to be introduced as a substitute for lynching, and since 1972, 80% of all the US’s death penalty sentences come from about 10% of the country’s counties. These scholars explain this outcome by revealing “the self-reinforcing or amplifying aspects of the process have generated a system where the better predictor of whether a given county will sentence an individual to death in a given year is not the number of homicides in that county in the previous year, but rather the number of death sentences that county has previously imposed” (Baumgartner et al. Reference Baumgartner, Caron and Sherman2020, 7).
The deep roots of particular attitudes—here, anti-Black racism—influenced the implementation of a policy, but over time, the public’s opinion has, over time, evolved to support and reinforce the policy. Or in other words, “once a jurisdiction goes down the path of death, it tends to accelerate” (Baumgartner et al. Reference Baumgartner, Caron and Sherman2020, 27). Other scholars have noted the iterative, endogenous, and self-reinforcing patterns of local and national policies in a wide array of policies, ranging from social welfare allocation (Soss Reference Soss, Schneider and Ingram2005; Campbell Reference Campbell2011; Ellis and Faricy Reference Ellis and Faricy2020) to anti-smoking policy (Pacheco Reference Pacheco2013).
Second, elite rhetoric and media depictions around various groups are also context-specific and tend to differ across geographic space. As mentioned, at the national level, welfare recipients and the poor tend to be cast as lazy and personally responsible for their condition more so in the US and in the UK than in Scandinavian countries (Iyengar Reference Iyengar1996; Gilens Reference Gilens1999; Larsen and Dejgaard Reference Larsen and Dejgaard2013). This variation also occurs at the subnational level. Again, legislators’ decision-making calculus incorporates and anticipates how the public will respond to their policy designs, but they also have a part to play in rationalising these decisions and shaping the political narrative, all of which have “heroes, villain, problems, solutions, tension, and resolutions” (Schneider and Ingram Reference Schneider and Ingram2019, 211). These roles differ across the states because the political, demographic, and policy dynamics differ across the states.
Furthermore, given the fact that evaluation of target groups’ deservingness differs between Republicans and Democrats (Kreitzer and Smith n.d.), the majority party in various state legislatures has an upper hand in shaping the dominant narrative (Schneider and Ingram Reference Schneider and Ingram2019). Policy design and the feedback effects they have on target groups as well as public perceptions differ substantially across space, and partisanship adds another layer of complexity onto these matters. Some examples, include expansion of Medicaid (Barrilleaux and Rainey Reference Barrilleaux and Rainey2014; Michener Reference Michener2018; Fording and Patton Reference Fording and Patton2019), state partnerships with federal immigration enforcement organisations (Lewis et al. Reference Lewis, Provine, Varsanyi and Decker2012; Carter Reference Carter, Smith and Greer2018), and orientations toward labour unions (Hogler et al. Reference Hogler, Shulman and Weiler2004), gun regulations (Smith and Spiegler Reference Smith and Spiegler2020), and voting rights (Hajnal et al. Reference Hajnal, Lajevardi and Nielson2017).
The third reason to expect subnational differences in deservingness evaluations is loosely related to “state culture.” Though some previous frameworks of state political culture have fallen out of repute (Elazar Reference Elazar1984), it cannot be denied that the average citizen across each of the US states has a distinctive orientation on a range of policy issues, and collectively state citizens have different political and ideological leanings (Berry et al. Reference Berry, Ringquist, Fording and Hanson1998). Indeed, scholars have evidenced correlations between agreeableness, conscientiousness, and neuroticism with state-level social capital measures as well as between personality traits and state-level measures of social engagement (Rentfrow et al. Reference Rentfrow, Jost, Gosling and Potter2009; Rentfrow Reference Rentfrow2010). What’s more, Mondak and Canache (Reference Mondak and Canache2014) find that in an analysis of the Big Five personality traits aggregated up to the state level, “variation in [state-level] personality across the American states corresponds quite strongly with states’ core political characteristics.” Finally, it is worth nothing that states range in their levels of one of the most predictive attitudes in American politics: racial animus (Acharya et al. Reference Acharya, Blackwell and Sen2016; Smith et al. Reference Smith, Kreitzer and Suo2019).
Empirical expectations
Given that the US states are democracies (though some more than others, see Reynolds (Reference Reynolds2016)), we can reasonably expect that public opinion of various target groups ought to influence policy design. Indeed, scholars have found that state public perception matters toward policy design, particularly on salient political issues (Lax and Phillips Reference Lax and Phillips2009a). Many scholars often rely on state ideology more broadly to predict state-level policy. While predictive, general ideology scores are blunt instruments given the complexities of policy, state culture, and state political context. Further, research on the deservingness heuristic suggests that deservingness evaluations may provide additional predictive value as scholars seek to understand subnational variation in policy design. Thus, although we are not the first to suggest this (see e.g. Pacheco Reference Pacheco2011), we find the need to move beyond state ideology scores or general public opinion measures. Instead, we leverage and extend the theories of deservingness and social constructions to better understand variation across states; we develop two hypotheses.
First, given extant literature highlighting that deservingness cues and triggers differ across political contexts, we expect that deservingness evaluations of several politically relevant groups will differ across the 50 American states. Further and in contrast to an underlying assumption of social constructions theory, which predicts consensus around the evaluations of policy targets, we expect to uncover a national patchwork of sentiments towards groups in consideration of the systematic way that state policies have distributed benefits and disadvantages across groups over time. Put simply,
H 1 : Subnational deservingness evaluations of target groups will vary across states.
Second, we should like to note that social constructions are an antecedent to anticipatory feedback (Schneider and Ingram Reference Schneider and Ingram2019). Policymakers take into consideration what (they perceive) their constituents think, feel, and believe about various groups in their development of policy design. As such, we hypothesise the following:
H 2 : Subnational evaluations of deservingness will predict state-level policy outcomes.
To be more precise, we expect to find that as subnational evaluations of deservingness increase, related target groups are more likely to see beneficial (or more lenient) policy outputs. When state-level deservingness scores decrease, we expect to find a stingier or more punitive policy. To be sure, the policy feedback framework pinpoints the idea that “policy is politics;” underlying this claim and the framework, generally speaking, is the very notion of endogeneity. Stereotypes about groups in society shape public policy, which in turns shapes future stereotypes about those groups. In this article, we model policy as a function of stereotypes, though an argument could be made to model this relationship differently. We follow the work of other scholars of political behaviour that the causal relationship is likely more direct and stronger flowing from social construction to policy than the reverse (Lax and Phillips Reference Lax and Phillips2009a).
Assessing subnational deservingness evaluations
Measuring deservingness
Schneider and Ingram (Reference Schneider and Ingram1993, 335) note that social constructions are rooted in “objective reality” that can be uncovered through “texts, such as legislative histories, statutes, guidelines, speeches, media coverage…interviews or surveys of policymakers, media representatives, members of the general public, and persons within the target group itself.” Relying on these methods produces helpful but sometimes inconsistent means of categorisation. However, Kreitzer and Smith (Reference Kreitzer and Smith2018, 769) explain the study of social constructions “requires something akin to crowdsourcing because the theory hinges on what elected officials think their constituents’ perceptions of politically relevant groups are. Crowdsourcing the categorisation of politically relevant groups provides scholars with empirically verifiable, systematic, and replicable results.” Consequently, we use crowdsourcing—or, the employment of hundreds or thousands of people to complete a series of small tasks—to measure deservingness dozens of politically relevant target populations. Crowdsourcing has been shown to be reproducible, flexible, transparent, and yields comparable results to expert surveys (Benoit et al. Reference Benoit, Conway, Lauderdale, Laver and Mikhaylov2016). Given the emerging consensus around the usefulness of crowdsourcing, we closely follow the research design of Kreitzer and Smith (Reference Kreitzer and Smith2018). Then we enhance that model by employing MRP to estimate subnational deservingness scores, which we discuss more in the next section.
Our data are derived from Amazon’s MTurk, a widely used platform for crowdsourcing information that has been embraced by scholars across a range of disciplines. MTurk workers produce reliable work, especially when researchers require that workers have a Human Intelligence Task acceptance rate of at least 95% (Peer et al. Reference Peer, Vosgerau and Acquisti2014). Our survey of 3,381 MTurk workers was fielded in July and August 2018. We restricted workers to those that are US-based (given the culture-specific nature of social constructions) and to those workers that had previously completed at least 100 tasks with an acceptance rate of at least 97%. Workers were paid $1.25 for an estimated 15-minute survey. The average survey was completed in about 16 minutes. Our survey asked MTurk workers to assess the social constructions of the 20 politically relevant target groupsFootnote 1 we analyze here.Footnote 2
In order to evaluate various groups’ deservingness, we relied heavily on the language and previous research of the foundational scholars of social constructions theory (Schneider and Ingram Reference Schneider and Ingram1993; Ingram et al. Reference Ingram, Schneider and DeLeon2007) as well as Kreitzer and Smith (Reference Kreitzer and Smith2018). This question wording also captures key components of deservingness criteria outlined by van Oorschot (Reference Oorschot2000). In this context, deservingness evaluations concern the degree to which those groups should be provided beneficial or burdensome policy. Respondents were queried:
Some groups, on average, are viewed as people who contribute to the general welfare of society and worthy, and thus are deserving of sympathy, pity, or help. Typically, we describe members of this group as good, smart, hardworking, loyal, disciplined, generous, caring of others, respectful, and creative.
Meanwhile, there are many other groups that are viewed as a burden to the general welfare of society, and are believed to be underserving of sympathy, pity, or help. Typically, we describe members of this group as greedy, disrespectful, disloyal, immoral, disgusting, dangerous, lazy, and expect others to care for them.
Based on what you know about these groups, how deserving or underserving would you say each of these groups are, generally speaking. Here, 0 means most people in that group are completely undeserving. 100 means most people in that group are very deserving.
Additionally, we relied on responses to ascertain the demographic profile of the respondents. This includes age (calculated from a question that captures year of birth) and education (seven categories ranging from no education/completion of grade 8 to postgraduate training). The survey asked respondents to identify their race (e.g. White, Black, Asian, Native America, Latino, or some other race), their gender (male, female, other), and their current state of residence.
Overall these data correspond to individual assessments of deservingness, but in order to gain an understanding of interstate differences in policy outcomes, we have to “scale up” from the individual to the state. As such, we rely on multilevel regression and poststratification (MRP, or sometimes more affectionately, “Mr. P”) to develop state-level measures of social constructions.
Multilevel regression and poststratification
MRP is a statistical approach to creating subnational estimates of public opinion. The method has been vigorously tested and validated across a range of data. Not only is it an improvement over disaggregation (Raudenbush and Bryk Reference Raudenbush and Bryk2002; Steenbergen and Jones Reference Steenbergen and Jones2002; Park et al. Reference Park, Gelman and Bafumi2004; Lax and Phillips Reference Lax and Phillips2009b, Reference Lax and Phillips2013; Snijders Reference Snijders2011), which requires a very large sample, MRP can be used to create state-level estimates of public opinion with a single national survey of at least 1,400 or so respondents (Park et al. Reference Park, Gelman and Bafumi2004; Lax and Phillips Reference Lax and Phillips2009b; Pacheco Reference Pacheco2011) and congressional districts with just a few thousand respondents (Warshaw and Rodden Reference Warshaw and Rodden2012).
Because one can make state-level estimates of policy-specific public opinion with as little as a single survey, the method has been employed by dozens of scholars studying a wide range of issues, including same-sex marriage (Lax and Phillips Reference Lax and Phillips2009a; Lewis and Jacobsmeier Reference Lewis and Jacobsmeier2017), ideology and partisanship (Enns and Koch Reference Enns and Koch2015, Reference Enns and Koch2013; Pacheco Reference Pacheco2011), immigration (Butz and Kehrberg Reference Butz and Kehrberg2016), gender mood (Koch and Thomsen Reference Koch and Thomsen2017), Supreme Court nominees and decisions (Caldarone et al. Reference Caldarone, Canes-Wrone and Clark2009; Kastellec et al. Reference Kastellec, Lax and Phillips2010; Franko Reference Franko2017), income inequality (Franko Reference Franko2017), roll call voting (Kastellec et al. Reference Kastellec, Lax and Phillips2010; Kastellec et al. Reference Kastellec, Lax, Malecki and Phillips2015; Krimmel et al. Reference Krimmel, Lax and Phillips2016), the Affordable Healthcare Act (Pacheco and Maltby Reference Pacheco and Maltby2017), smoking bans (Pacheco Reference Pacheco2012), abortion (Pacheco Reference Pacheco2014), death penalty (Pacheco Reference Pacheco2014), and welfare spending (Pacheco Reference Pacheco2014), to name a few. In fact, MRP is “emerging as a widely used gold standard for estimating preferences from national surveys” (Selb and Munzert Reference Selb and Munzert2011, 456).
The method has two steps. First, one models public attitudes as a function of demographic “types” and state-level variables. Then, one weighs the frequencies of each demographic type according to their frequency in the census to develop state-level scores of the measure of concern (Park et al. Reference Park, Gelman and Bafumi2004; Lax and Phillips Reference Lax and Phillips2009b, Reference Lax and Phillips2013; Pacheco Reference Pacheco2011; Gelman et al. Reference Gelman, Lax, Phillips, Gabry and Trangucci2018).
In order to implement MRP with our MTurk data, we built a model that predicts social constructions based on demographic characteristics. It is important to note here that the individual characteristics used in our models must be ones that can be matched with cross-tabs from the U.S. Census. Thus, our regression equation is limited to the types of information available in the census cross-tabs. We follow the precedent of previous MRP literature in using ordinal measures for age (18–29, 30–44, 45–64, or 65+), education (less than high school graduate, high school graduate, some college, or college graduate), and fixed effects for region and state of residence (each of the 50 states). Similarly, we follow scholars of intersectionality in modelling race-gender dynamics as a series of indicator variables (non-Hispanic white man, non-Hispanic white woman, non-Hispanic black man, non-Hispanic black woman, men of “other” race, women of “other” race) (Hancock Reference Hancock2007; Reingold and Smith Reference Reingold and Smith2012; Masuoka and Junn Reference Masuoka and Junn2013).Footnote 3
In general, we find that the race-gender variables are consistently substantively and statistically significant across the various models. We find that age is likewise consistently significant and education less so. The region and state-fixed effects are omitted from the table for parsimony but are also consistently significant. We do not discuss these findings in greater detail given that the directionality of the variables varies across the different dependent variables. In brief, however, the findings are largely intuitive. The results of those regression tables can be found in Supplementary Material.
After modelling the deservingness of 20 target groups as a function of these demographic characteristics and state-fixed effects, we hypothesised the level of deservingness for each target group for each “type” of individual based on combinations of the demographic variables and the state-fixed effect. By “type,” we mean the 4,800 permutations that we are able to assess with data (3 race categories × 2 gender categories × 4 age categories × 4 education categories × 50 states). For example, predict the level of deservingness for each target group for the average non-Hispanic white, male, between 18 and 29, with less than a college degree in Alabama as well as for the average a non-Hispanic black, woman, older than 65, with a college degree, in Wyoming. Then, by weighting the frequencies of each “type” of person according to the frequency in the census data, we can construct a measure of the state-level deservingness for these target groups. The estimates of state deservingness are reported in Supplementary Material.Footnote 4
It is common in this line of scholarship to assess the validity of MRP-generated estimates by comparing them to estimates of state attitudes from the extant literature. We are unable to easily do so here, as we are asking about the deservingness of members of a policy target rather than support for a given policy (which is far more common). However, we do compare the correlations of various estimates to each other. These are also available in Supplementary Material. Despite being generated from the same data and using the same control variables and weighting procedure, the correlations across groups are not always as high as one might expect. The correlations between Supplemental Nutritional Assistance Program (SNAP) and Temporary Assistance for Needy Families (TANF) recipients (R2=.89) and between DREAMers and unauthorised immigrants (R2=.79) are among the highest. The correlation between the National Rifle Association (NRA) and gun owners is unsurprisingly high (.69), but the high correlation between seemingly unrelated NRA and ICE (.59) is interesting and perhaps illuminating of an underlying belief structure. Other groups, like farmers, are most highly correlated with small businesses, but even this correlation is not particularly high (.54). In general, the correlations are largely intuitive, providing confidence in our data and methodological strategy.
Results: interstate differences in social construction
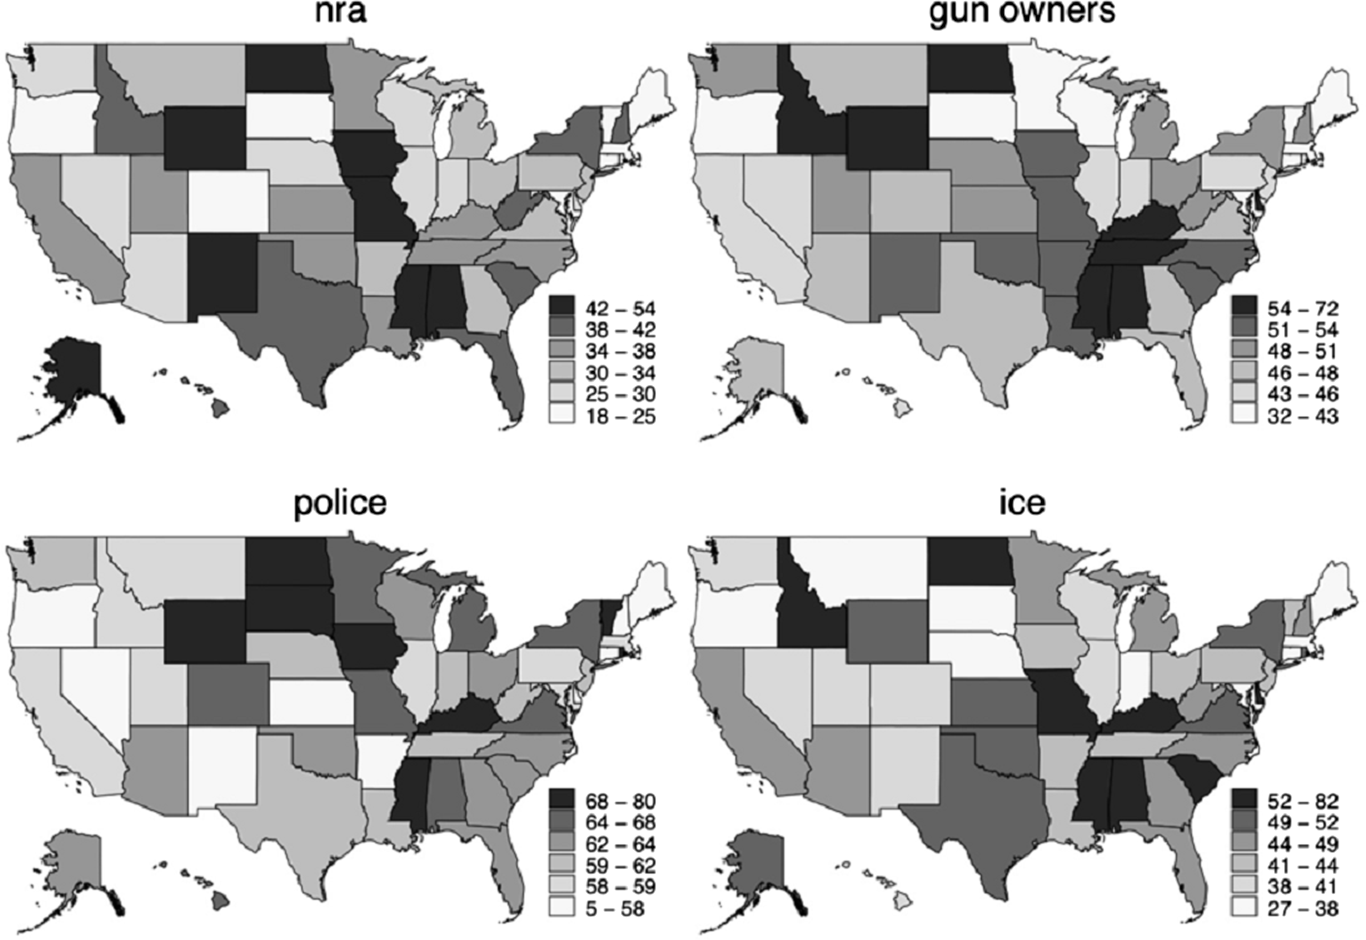
As mentioned, policymakers are likely to take into consideration how the population views various target groups when making decisions for policy design or for justifying their policy choices during election season. Given the ideas that (a) states vary widely in their policies around various target groups, and (b) past policy design influences present day public perception about various groups, we expected to find social constructions to vary across states (H1). We find support for this hypothesis. By relying on crowdsourced data of deservingness scores of over 3,000 Americans alongside MRP, we are able to determine that each state has its own score of deservingness of the groups under study in this article. The raw scores of deservingness are difficult to digest, so we present the results visually in a series of thematically clustered maps (Figures 1-5). Each map illustrates sextiles of deservingness for each group. Darker shades are associated with higher scores of deservingness, but it should be well noted that the scale varies for each individual group map.
State deservingness of criminals and drug users.
Note: Deservingness scores range from a low of 0 to a high of 100.

Deservingness of guns and law enforcement.
Note: Deservingness scores range from a low of 0 to a high of 100.
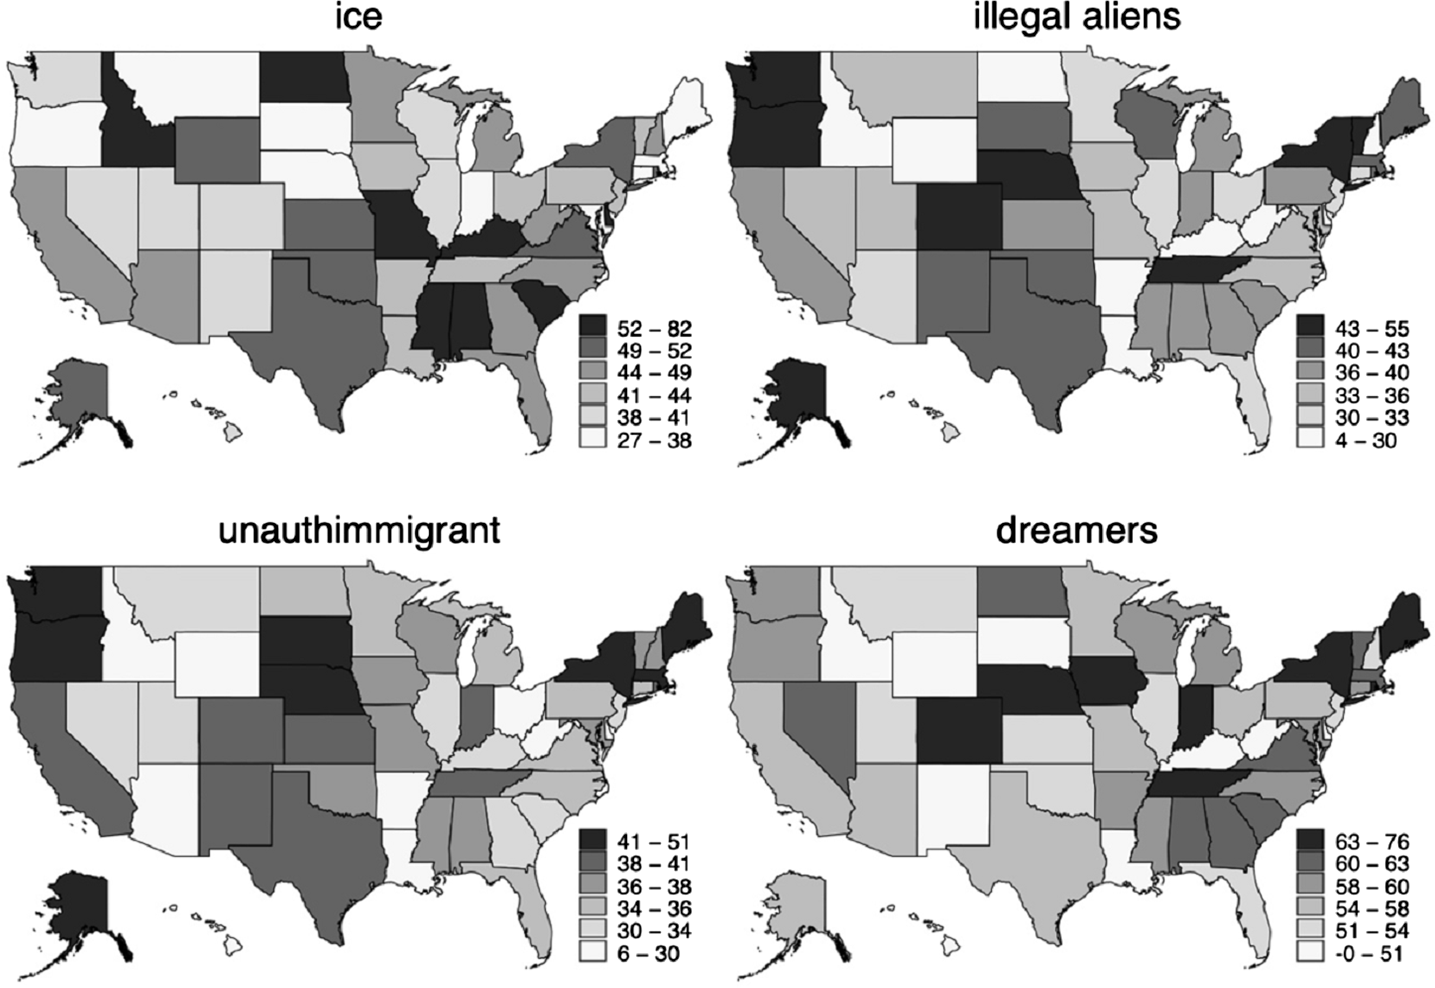
Deservingness of immigrants.
Note: Deservingness scores range from a low of 0 to a high of 100.
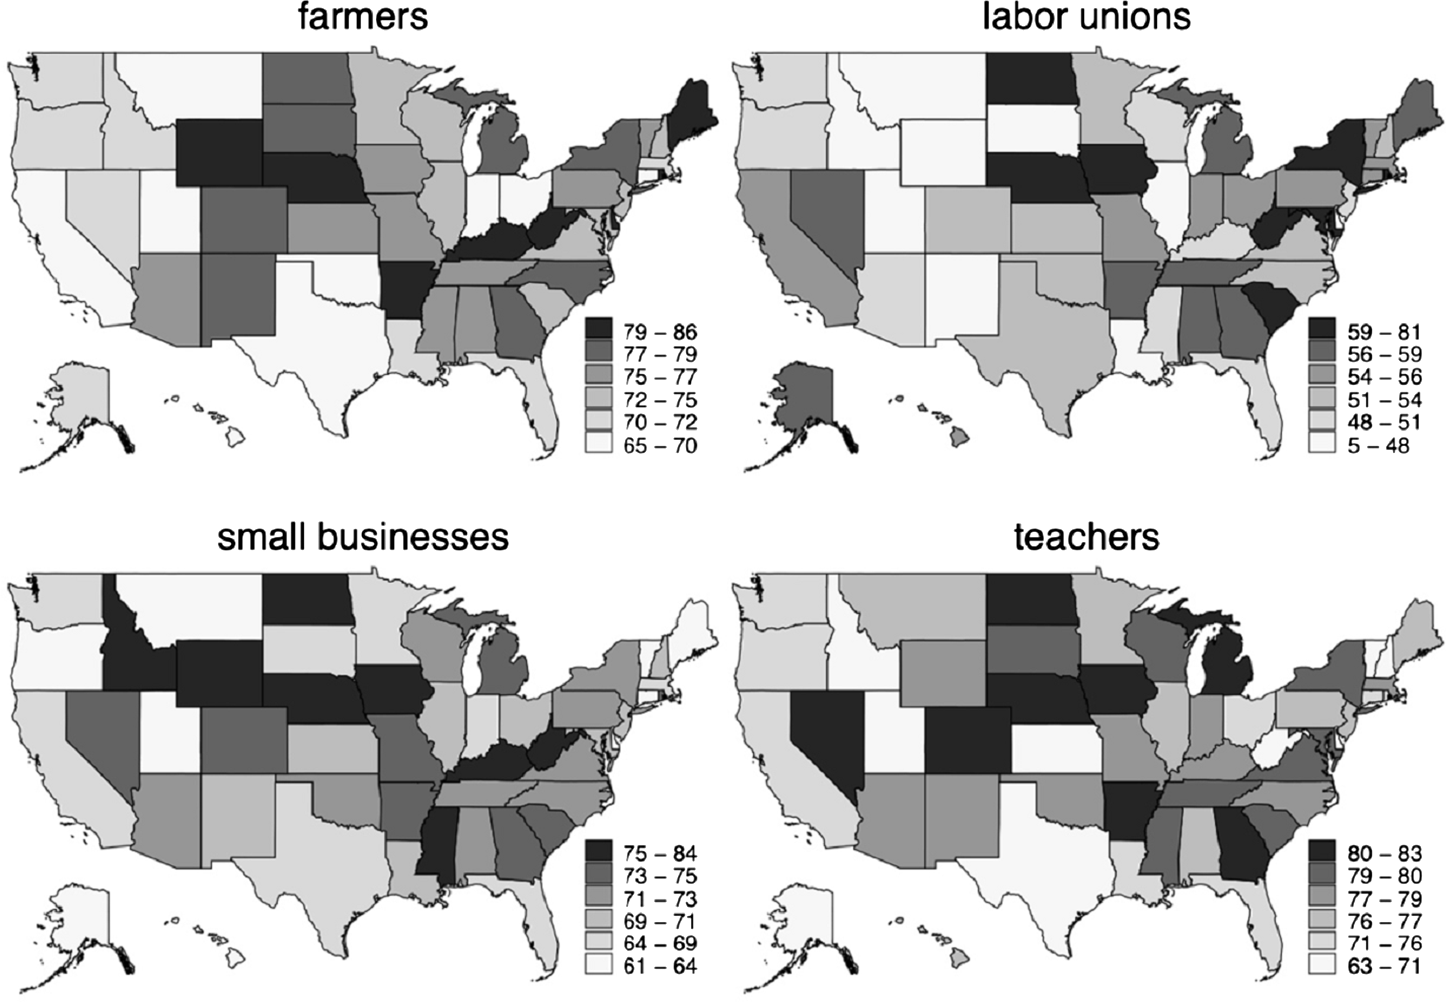
Deservingness of select occupations.
Note: Deservingness scores range from a low of 0 to a high of 100.
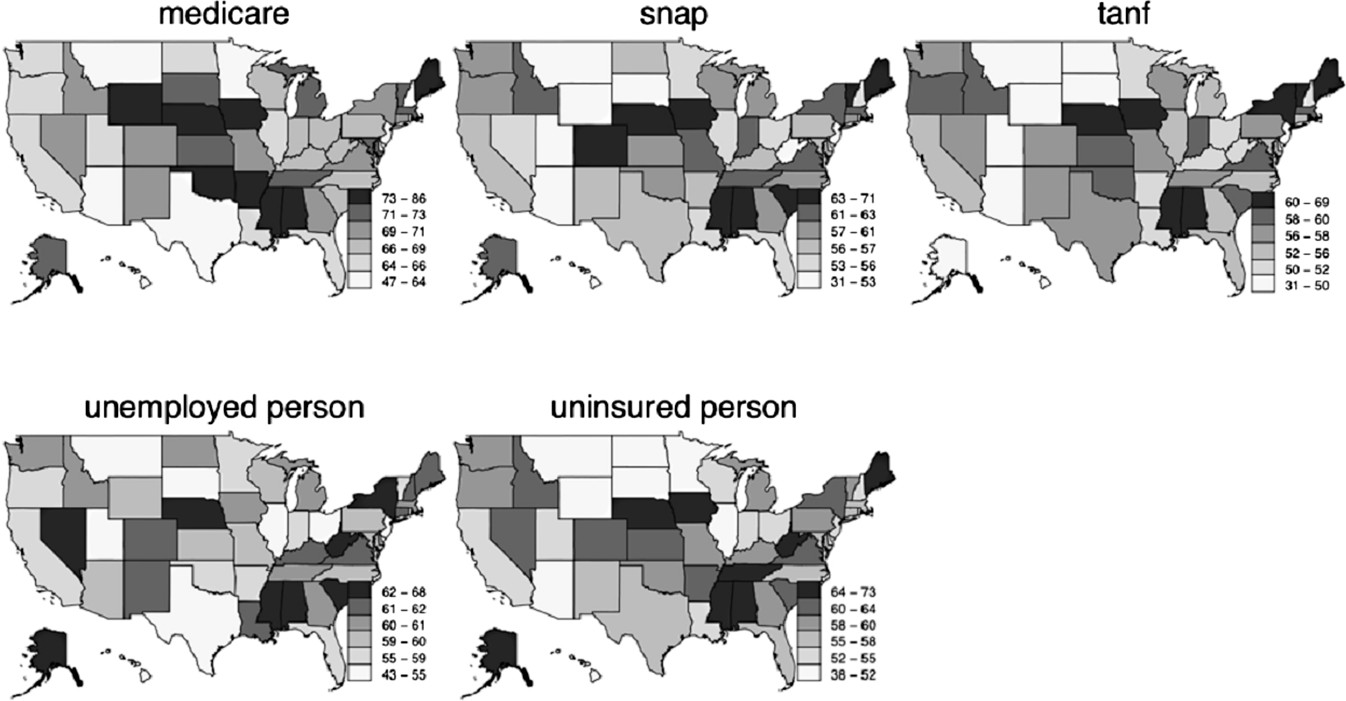
Deservingness of welfare recipients and financially vulnerable people.
Note: Deservingness scores range from a low of 0 to a high of 100.
Across these maps, some notable patterns emerge. First, we see that there is a broader range of deservingness for some groups relative to others. For example, Figure 3 illustrates state-level scores of deservingness for various kinds of immigrants. The range of scores for “Illegal Aliens” and “Unauthorized Immigrants” is nearly 50, and the low scores are quite low in comparison to most other groups we analysed. What’s more, one might note that the high deservingness scores for “DREAMers” are much larger for “Illegal Aliens” and “Unauthorized Immigrants.” This reveals that even within a group—in this case, “immigrants”—various subgroups are viewed differently from one another. These differences allow policymakers to develop what scholars call degenerative policy-making schemes. Here, political entrepreneurs develop two-tier policy designs that cream off the part of the group that is deemed deserving by the public to create beneficial policy while resigning the “bad” parts of the group to the deviant category (Schneider and Ingram Reference Schneider and Ingram1993; Soss Reference Soss, Schneider and Ingram2005). In effect, these entrepreneurs are able to capitalise twice—once for helping those viewed positively and again for punishing those deemed undeserving.
In stark contrast, the range of deservingness for target groups like Farmers, Teachers, and Small Businesses (Figure 4) is only 20. These groups are the “bread and butter” groups of American society, and the public views them that way. This smaller range suggests that there is greater (across state) consensus on some groups than others. We should note, however, that while labour unions have similar high-end score as the other three groups, this group is also viewed quite poorly among a significant portion of the country—denoted by the lower end of the range in evaluations.
Additionally, the maps, at times, reveal regional clustering. For instance, Figure 5 illustrates state-level deservingness scores for vulnerable target groups, many of whom receive state benefits: Medicare, SNAP, and TANF. The states that see these groups as most deserving are in the Midwest, Southeast, and Northeast. It should be noted that these are also the states which are most likely to see unemployed people and uninsured people as the most deserving.
Finally, states that see similarities in the deservingness of groups are related. For example, states that see marijuana smokers as more deserving also tend to see opioid users as deserving. We also see remarkable similarity between the deservingness of the NRA and ICE (and to a lesser extent Police). While the NRA and ICE are not related to each other in terms of the types of policies through which these groups are targeted, these groups may be related to an underlying belief structure, such as authoritarianism. This kind of finding is worthy of future empirical study. Next, we turn to assessing the link between these subnational evaluations of deservingness and policy.
Subnational deservingness and policy outcomes
We turn to test our second hypothesis which asserts that subnational evaluations of deservingness will be systematically related state-level policy outcomes. Concerning direction, we expect to find that as subnational evaluations of deservingness increase for various groups, beneficial (or more lenient) policy outputs are also likely to increase; meanwhile, when state-level deservingness scores decrease, we expect to find stingier and more disciplinary policy.
In the previous section, we examined the subnational deservingness scores of 20 groups. Here, we are more constrained in our approach and group selection. As we move to assess the link between deservingness and policy outcomes, we pinpoint a subset of the aforementioned groups that meet one clear criterion: we must be able to access state-level data about policy design and/or policy outcomes directly related to the target group. We do this for methodological reasons as well as practical reasons (e.g. time and space constraints). Nonetheless, such a constraint still allows us to speak to an overarching goal: determining whether evidence of a link between state-level deservingness evaluations and policy outcomes converges. We would feel confident in our conclusion if we find similar outcomes across a wide set of politically relevant groups and related policy matters despite the quirks and differences that arise across policy domains. We rely on a surfeit of data, detailed momentarily, in order to develop multiple tests and, thus, increase the confidence in our conclusions. Below, we consider the link between subnational deservingness scores of several politically relevant target groups and related policy designs and outcomes across four domains as case studies—criminal justice, immigration, gun regulation/policy, and social welfare.
Criminal justice
First, we consider the relationship between how citizens across the American states view “criminals” and policy design and outcomes in prisons and corrections—with a focus on prisoner rates and the proportion of a state’s budget spent on corrections. We employ data from the Bureau of Justice Statistics (2018) in order to measure state prisoner rates, or the total number of prisoners per 1,000 individuals in a state in 2018. Although the criminal justice system in theory is race-neutral, Black Americans are arrested and imprisoned at significantly higher rates than other groups despite committing similar levels of crime (Bonczar Reference Bonczar2003; Lopez et al. Reference Lopez Bunyasi and Smith2019). Due to the tendency of police to target Black people (Baumgartner et al. Reference Baumgartner, Epp and Shoub2018) and the implicit association between Blackness and crime (Young Reference Young, Peterson, Krivo and Hagan2006), the evaluations of deservingness of “criminals” may play an especially important role in the imprisonment rate of Black Americans. As such, we also analyse the Black prisoner rate, or total number of Blacks in prison per 1,000 Black residents in each state in 2018.
While state-level deservingness scores are the main independent variable, we control for a range of political, ideological, and demographic characteristics of the states.Footnote 5 We control for the median household income, which serves as a proxy for overall state financial capacity. The models include measure of state citizen ideology (Berry et al. Reference Berry, Ringquist, Fording and Hanson1998). State citizen ideology is Berry et al.’s (Reference Berry, Ringquist, Fording and Hanson1998) revised citizen ideology scores for 2016 (the latest version of the data) and higher values indicate a more liberal citizenry. We also control the partisanship of the state governor. We expect states with more conservative residents and elites to be more punitive. What’s more, we include measures of the proportion of Black, Latino, and non-White residents, as scholars have shown that increased racial diversity in a state is often associated with more disciplinary penal (and welfare) policy (Soss et al. Reference Soss, Fording and Schram2011).
Here, higher prisoner rates and larger budgets directed toward prisons are characterised as more punitive. Indeed, scholarship reveals that states that aim to be less punitive have recently begun to take critical steps to reduce the size of their prison population; these states have also aimed to decrease their investments in the prison-industrial complex, and instead shift funds to diversion programs, such as drug courts and increased rates of parole (Mai and Subramanian Reference Mai and Subramanian2017).
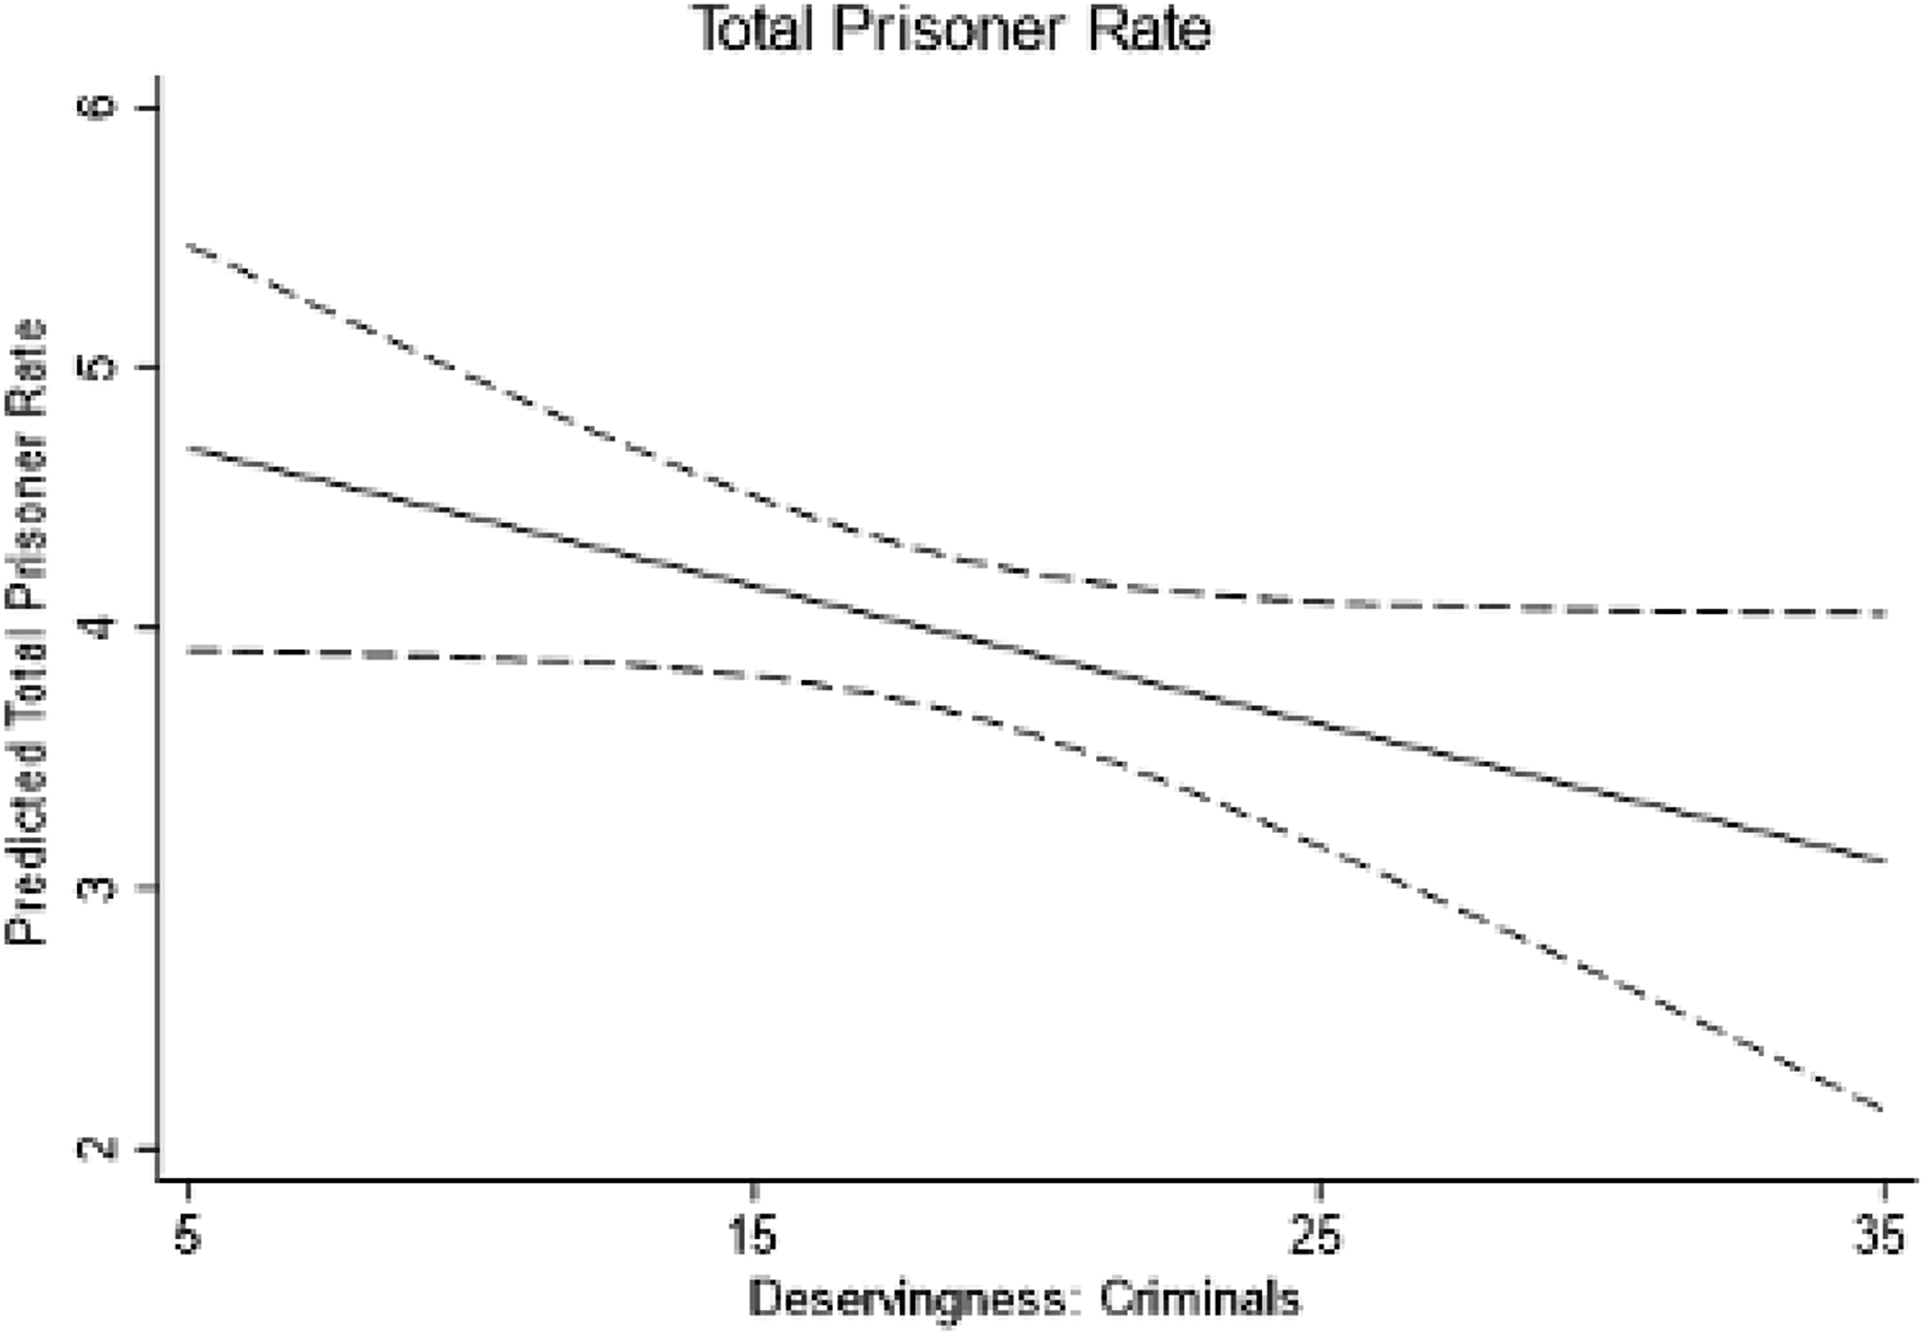
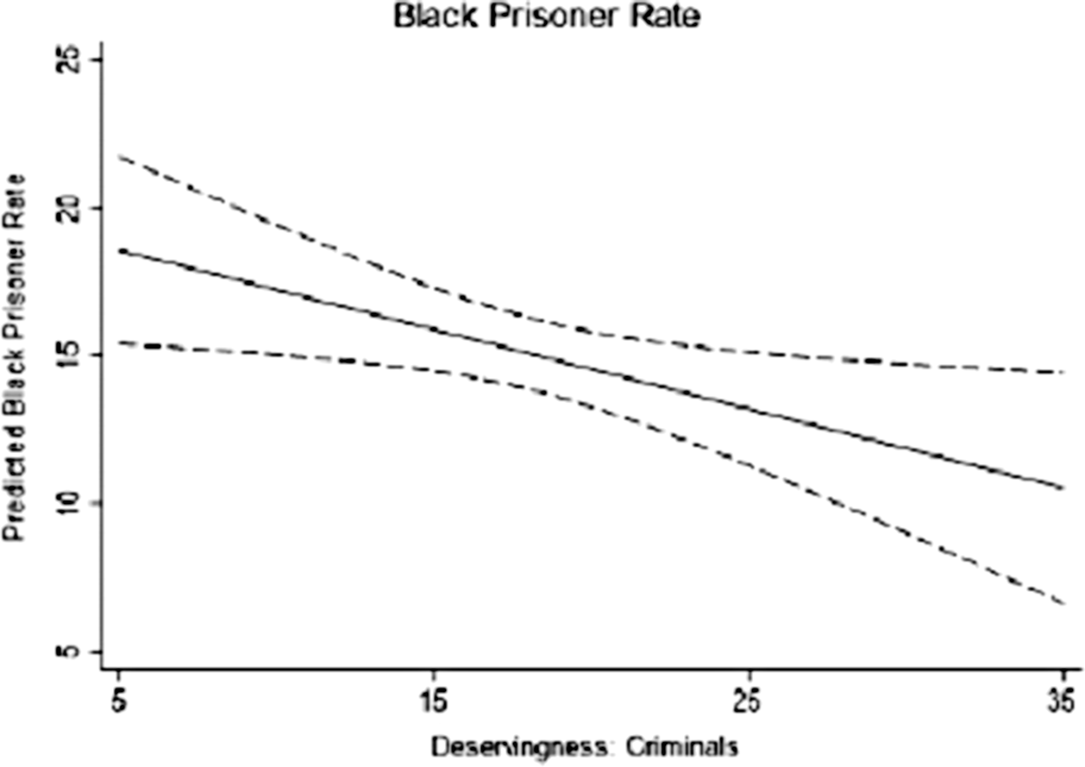
Table 1 details our findings and provides initial support for our hypothesis. Figures 6 and 7 provide an illustration of these results. As a state’s deservingness evaluations of “criminals” increases, the prisoner rate decreases; the same can be said for the Black prisoner rate. Moving from states that view criminals as the most undeserving (deservingness = 5) to the most deserving (deservingness = 35), the prisoner rate drops by 1.5 and the Black prisoner rate drops by 8.
Deservingness evaluations of criminals on state policies
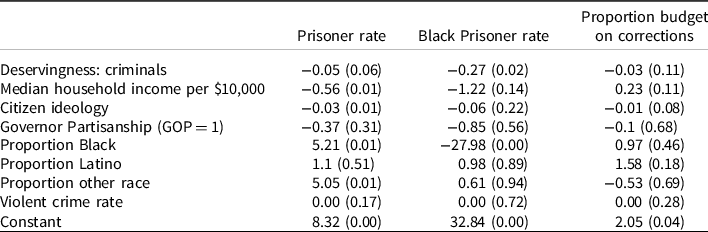
Notes: OLS coefficients reported, p-values in parentheses.
Predicted total prisoner rate..
Note: The figure shows the predicted state prisoner rate across a range of deservingness scores of “ciminals.” Dashed lines represent 95% confidence intervals.
Predicted Black Prisoner rate.
Note: The figure shows the predicted state black prisoner rate across a range of deservingness scores of “criminals.” Dashed lines represent 95% confidence intervals.
Our results also corroborate others scholars’ research. For instance, the results in the first column reveal that as the proportion of Black folks in a state’s population increases, the overall prisoner rate increases, dovetailing Soss et al.’s racial classification model (Soss et al. Reference Soss, Fording and Schram2011). Although we find an opposite effect in the second column, concerning the Black prisoner rate, it is worth noting that the greatest disparities in the Black-White prisoner ratio and higher rates of Black imprisonment occur in states where Black folks are not a major contingent of the population (Nellis Reference Nellis2016). Thus, we find it unsurprising that states with larger black populations will see reduced Black prisoner rates. Finally, our results reveal that as the state citizen ideology becomes more liberal, the prisoner rate and proportion of a state’s budget that goes towards prison decreases.
Immigration
We also test our hypothesis on policy matters related to immigration. Here, we look at whether subnational evaluations of deservingness for “illegal aliens” and “DREAMers” are related to immigration enforcement rates and states’ orientation towards sanctuary policy. As previously shown (Figure 3), there is a fairly wide range in how citizens across the states view and evaluate members of these two groups, though “illegal aliens” are viewed as much less deserving as their counterparts who have garnered the sympathy of Americans across the ideological spectrum (Matos Reference Matos2020).Footnote 6
We turn to two dependent variables. First, we calculate immigration enforcement using data from Syracuse University’s Transactional Records Clearinghouse (2018) on the number of arrests by Immigration and Custom’s Enforcement (ICE) and information on the number of unauthorised immigrants in a state from Pew Research (Pew Research Center 2019). Although ICE is a federal agency, states and localities have different relationships with this agency, ranging from mutual understanding and cooperation to resistance and defiance (Lewis et al. Reference Lewis, Provine, Varsanyi and Decker2012; Carter Reference Carter, Smith and Greer2018). We use these data to create an ICE arrest rate: the number of ICE arrests in a state in 2018 per 1,000 unauthorised immigrants in a state.Footnote 7 We also examine whether a state has declared itself a sanctuary for unauthorised immigrants, meaning the state has declared they will not actively cooperate with ICE by detaining unauthorised immigrants. At the time of our study, 11 states have adopted some form of sanctuary policy (Vaughn and Griffith Reference Vaughn and Griffith2021). We created a binary measure with 1 indicating sanctuary states and 0 otherwise. To produce a better specified model, we include a curated set of controls that may influence these policy outcomes; many overlap with the previous analysis—median income, citizen ideology, partisanship of the governor, and the racial demographics of the state—and we use them for the same reasons. In the case of the ICE arrest models, we also include whether a state has a sanctuary policy or not, given that such a policy should ostensibly curb or, at least, frustrate ICE arrest rates.
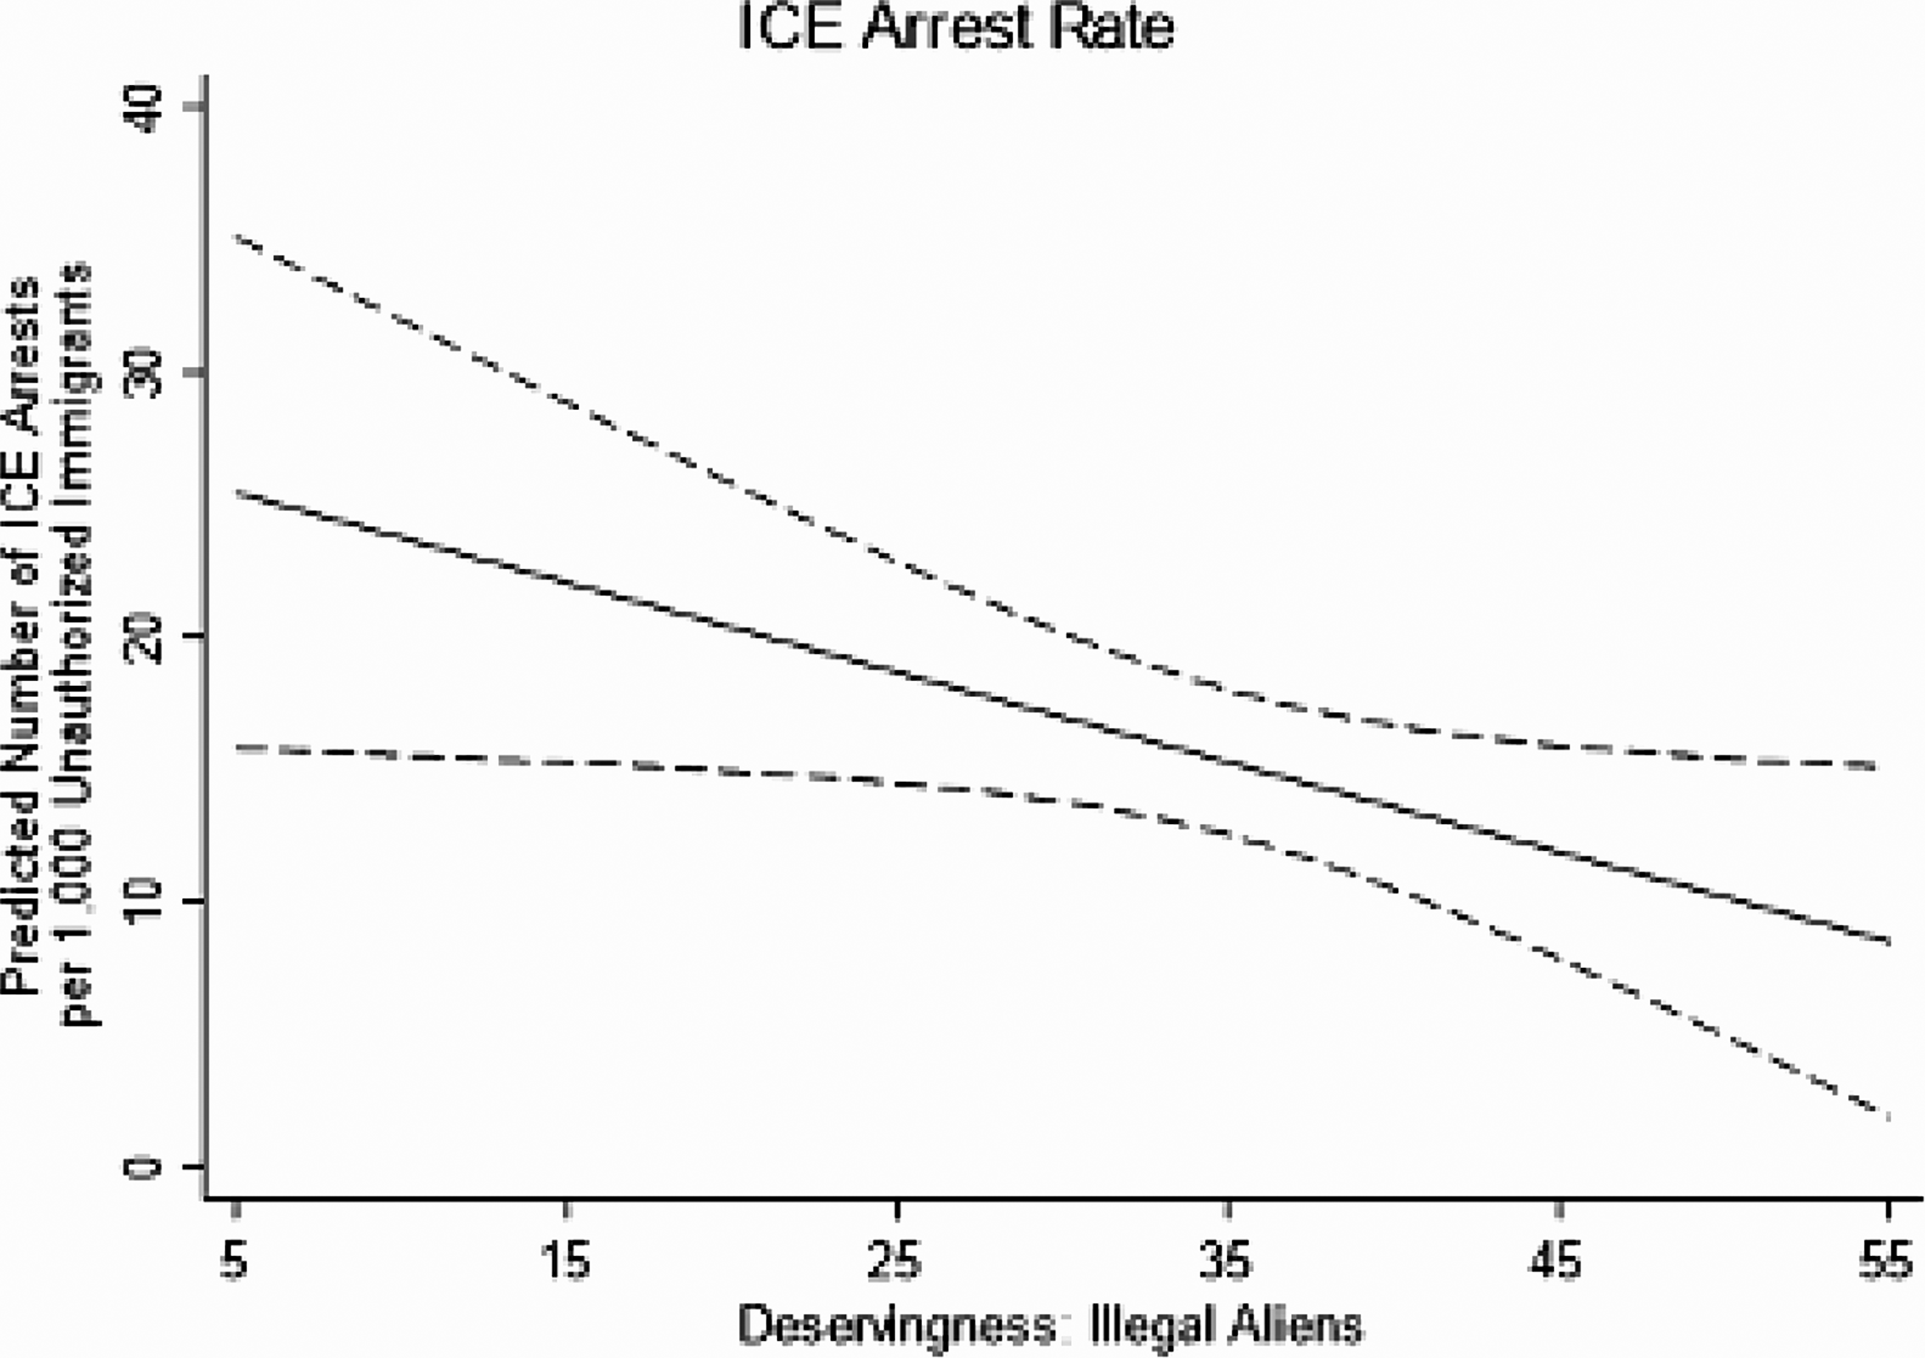
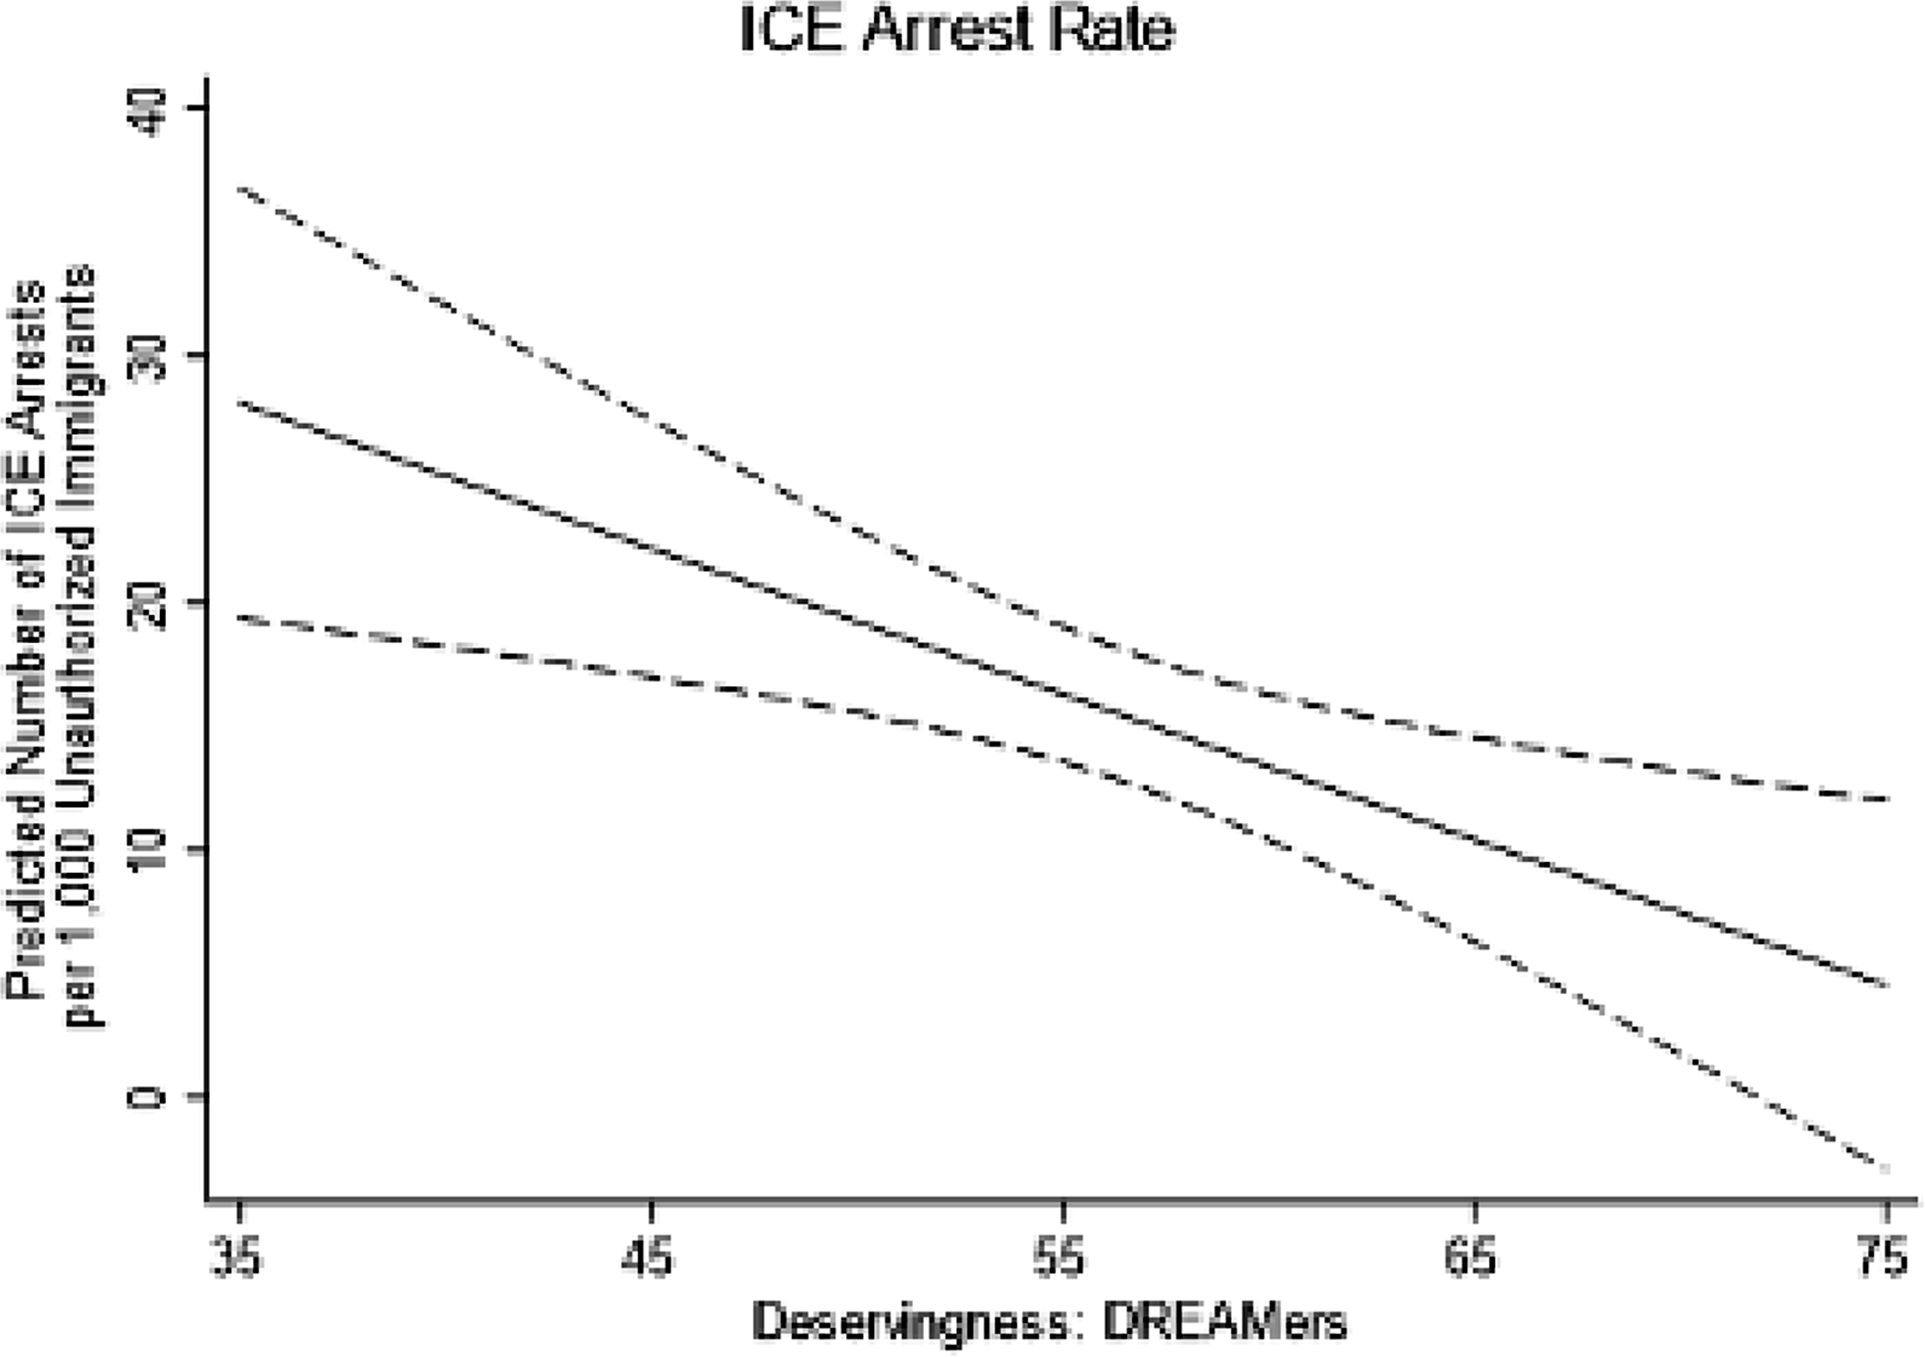
Table 2 outlines these tests, and the results provide additional support for our prediction that there is a systematic relationship between subnational levels of deservingness and policy design and outcomes.Footnote 8 Figures 8 and 9 illustrate the main findings. Here, we find that when the citizens of a state collectively view “illegal aliens” and DREAMers as more deserving, punitive policy outcomes (ICE arrest rates) decrease; however, we do not find a corollary finding related to beneficial policies (e.g. sanctuary policy). Our results indicate that perceptions of immigrants’ deservingness have a significant impact on the rate of ICE arrests. Moving from states that view “illegal aliens” as least deserving (deservingness = 5) to most (deservingness = 51), we see roughly 17 fewer arrests per 1,000 unauthorised immigrants in a state. The effect of DREAMers deservingness is even more pronounced, leading to roughly 23 fewer arrests per 1,000 unauthorised immigrants when DREAMers move from least (deservingness = 5) to most (deservingness = 75) deserving.
Deservingness evaluations of immigrants on state policy and outcomes
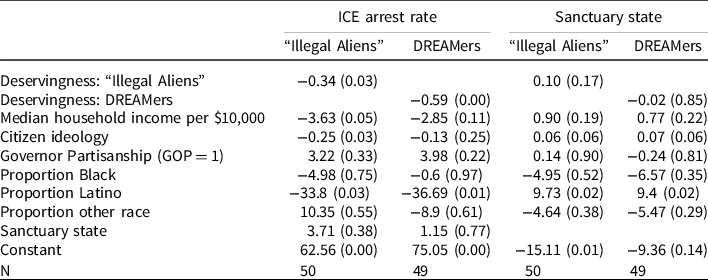
Notes: ICE arrest OLS coefficients reported, p-values in parentheses.
Sanctuary State Logistic Regression Coefficients reported, p-values in parentheses.
Predicted ICE arrest rate.
Note: The figure shows the predicted ICE arrest rate in a state across a range of deservingness scores for “Illegal Aliens.” Dashed lines represent 95% confidence intervals.
Predicted ICE arrest rate.
Note: The figure shows the predicted ICE arrest rate in a state across a range of deservingness scores for DREAMers. Dashed lines represent 95% confidence intervals.
Our control variables provide additional information. We find that the proportion of Latinos in a state as well as citizen ideology are related to enforcement rates as well as sanctuary policy, but the partisan identity of the governor does not necessarily have a predictive role in the shape of these policies; to be sure, a great deal of enforcement is influenced by low levels of governance, such as by mayors and the relationship between local executives and related police officials (Lewis et al. Reference Lewis, Provine, Varsanyi and Decker2012). Still, it is worth noting that even when we control for key attributes that are often at the forefront of immigration scholarship, deservingness evaluations do provide additional information about this policy domain.
Gun regulations and interest groups
Next, we turn to the matter of gun regulations. Again, Figure 2 reveals that there is a wide range of how the NRA is viewed across the states (though largely on the undeserving end of the spectrum, ranging from a low of 18 to a high of 54); gun owners, in contrast, are rated as more deserving (ranging between 32 and 72). We seek to determine whether subnational evaluations of gun owners and the NRA predicts policy outcomes across the states, and thus, employ Everytown for Gun Safety’s (2014) assessment of gun safety, regulation, and violence. Each state receives a score based on the number of gun regulations adopted out of 67 potential gun laws. The types of legislation include background checks, age limits, how the gun permit process works, and access to guns for various groups including those with mental illness, individuals with prior criminal records, and individuals with a history of domestic violence. While all states have some form of gun regulation, states with a lower score have adopted fewer of these laws and thus have more lax gun regulations. In 2018, the time of our study, Mississippi had the fewest gun regulations with a score of 5 whereas Hawaii and Illinois tied for the most restrictive gun policies with scores of 59. Here, we li0mit our controls to the ideological leaning of each state’s citizenry and governorship as well as the demographic make-up of the population.
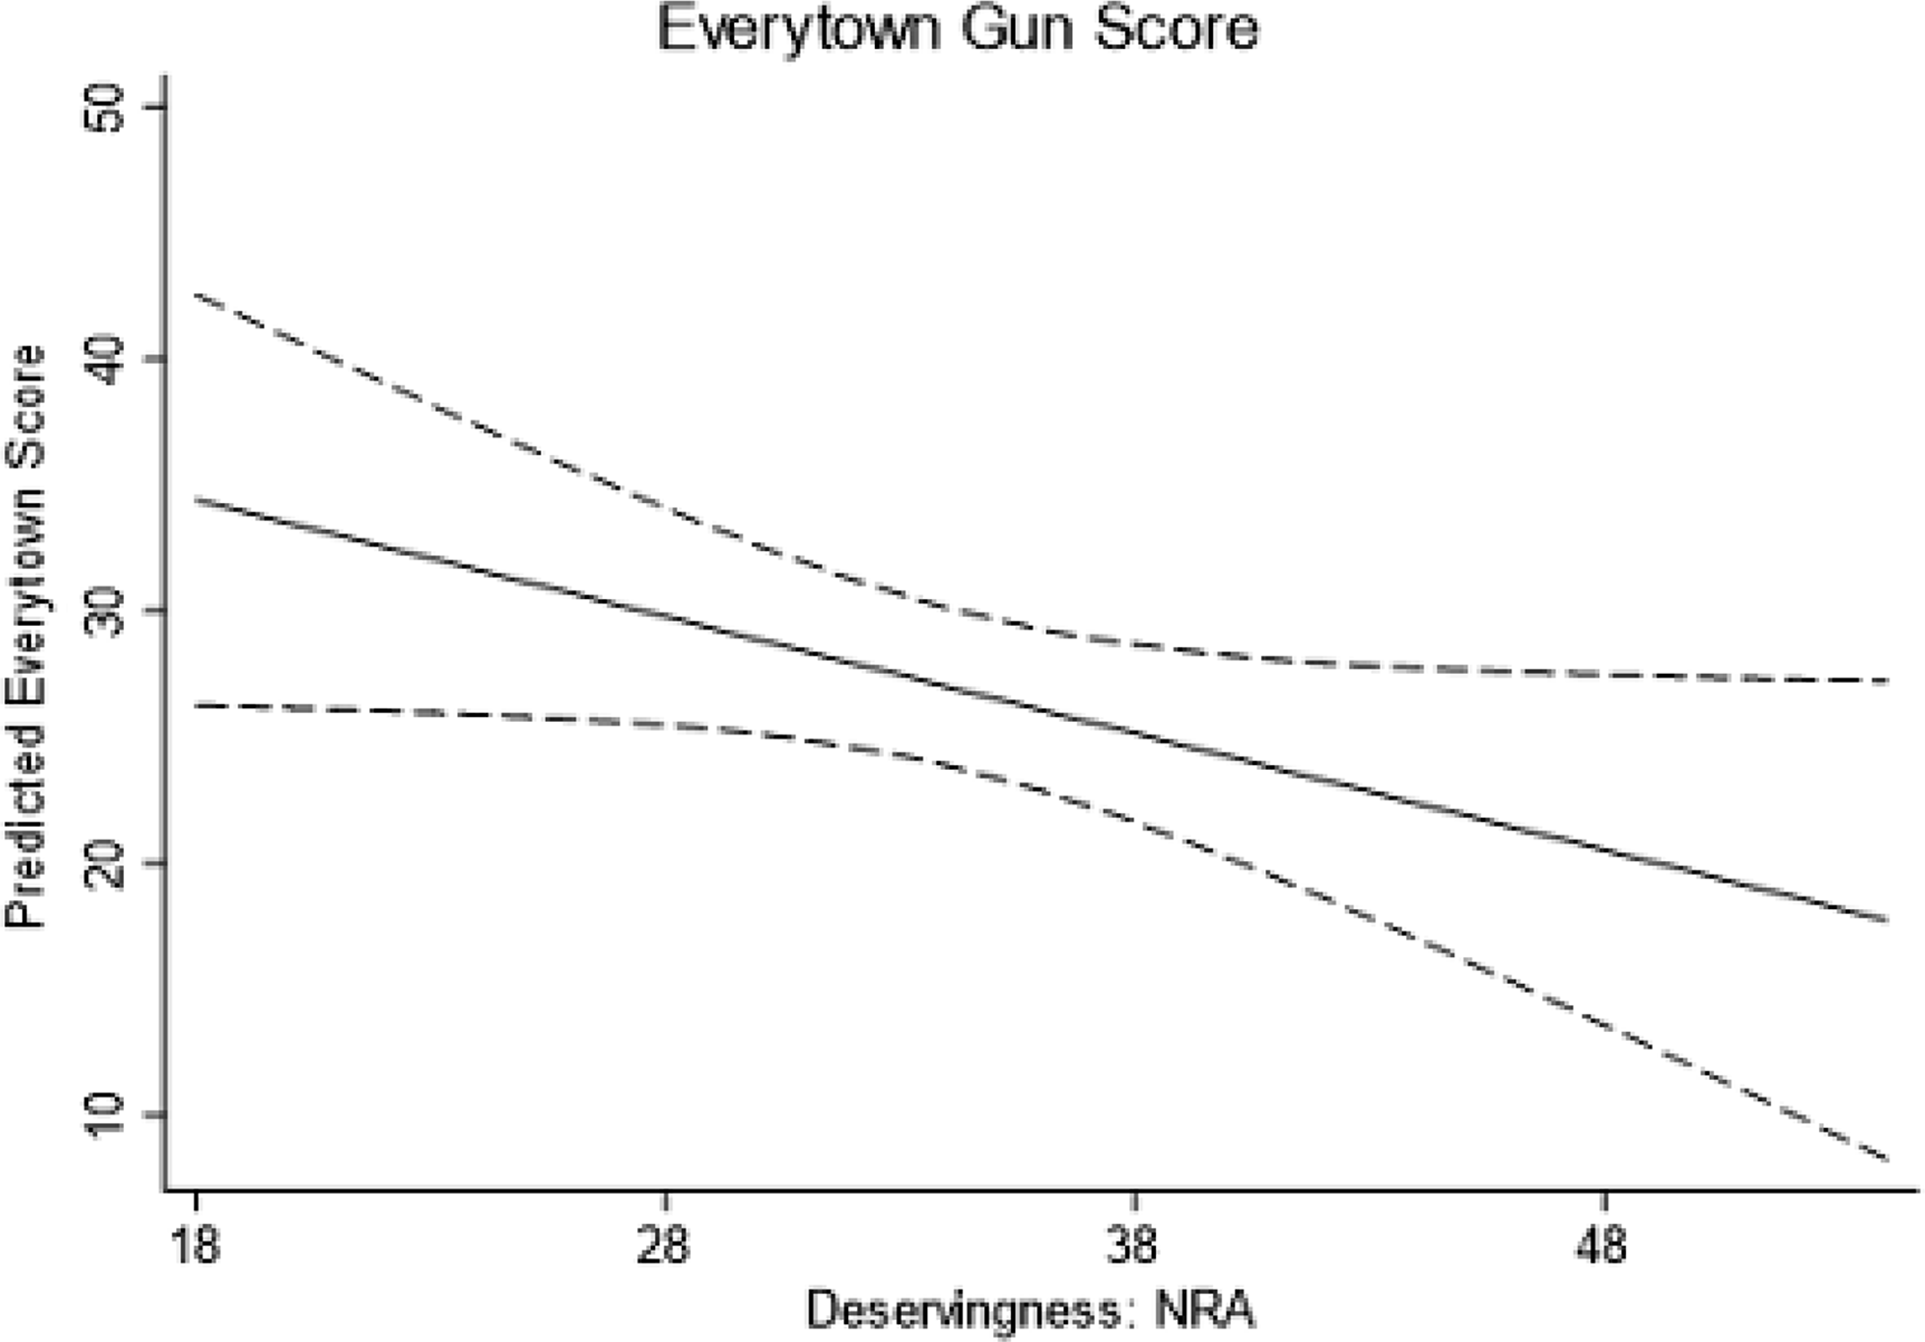
Table 3 and Figure 10 report and illustrate our findings. While we do not find evidence that subnational deservingness evaluations of gun owners predicts policy matters, the way a state’s citizens view the NRA is associated with these outcomes. We find that as states view the NRA as more deserving, gun regulations become laxer, as measured by Everytown for Gun Safety’s rating. As Figure 10 shows, states that view the NRA as extremely undeserving (deservingness = 18) are predicted to have 34 gun regulation policies whereas states that view the NRA more positively (deservingness = 37) are likely to have only 17 such laws. Meanwhile, our results show that citizen ideology (but not the partisanship of the state’s executive) predicts gun policy; states with more conservative citizens tend to have looser gun regulations. We also find that the demographics of the states are related to gun policy; states with higher proportion of Black, Latino, and other non-White Americans tend to have more stringent gun regulations.
Deservingness evaluations of gun owners and interest groups on state policy and outcomes
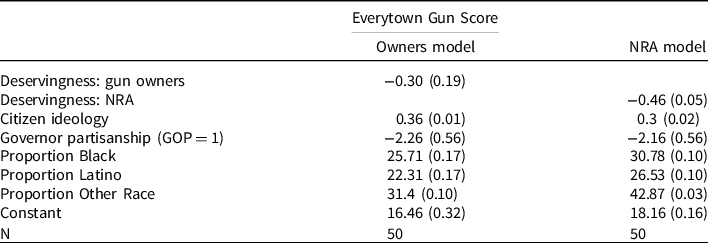
Notes: OLS coefficients reported, p-values in parentheses.
Predicted Everytown Gun score.
Note: The figure shows the predicted Everytown Gun Score in a state across a range of deservingness scores of the NRA. Dashed lines represent 95% confidence intervals.
Public assistance
Finally, we turn to our last case: public assistance. The three groups whose deservingness scores serve as independent variables are TANF recipients; recipients of the SNAP; and unemployed persons. The range of deservingness scores, depicted in Figure 5, for TANF (31–69) and SNAP (31–71) are similar, and the states that tend to be warm toward one group also tend to be warm toward the other. The low end of the range of the “unemployed” is higher than for either of these groups (43), but the upper end is similar (68). Still, within a more constrained range, the states vary in their evaluations of deservingness for each of these three groups.
We examine how state deservingness evaluations of these three vulnerable groups are related to a general measure of state interest in the poor: the percentage of state expenditures spent on public assistance in 2018 (National Association of State Budget Officers 2019). We include controls for median household income at the state level, citizen and elite ideological leanings, and the proportion of Black, Latino, and other non-White Americans in each state.
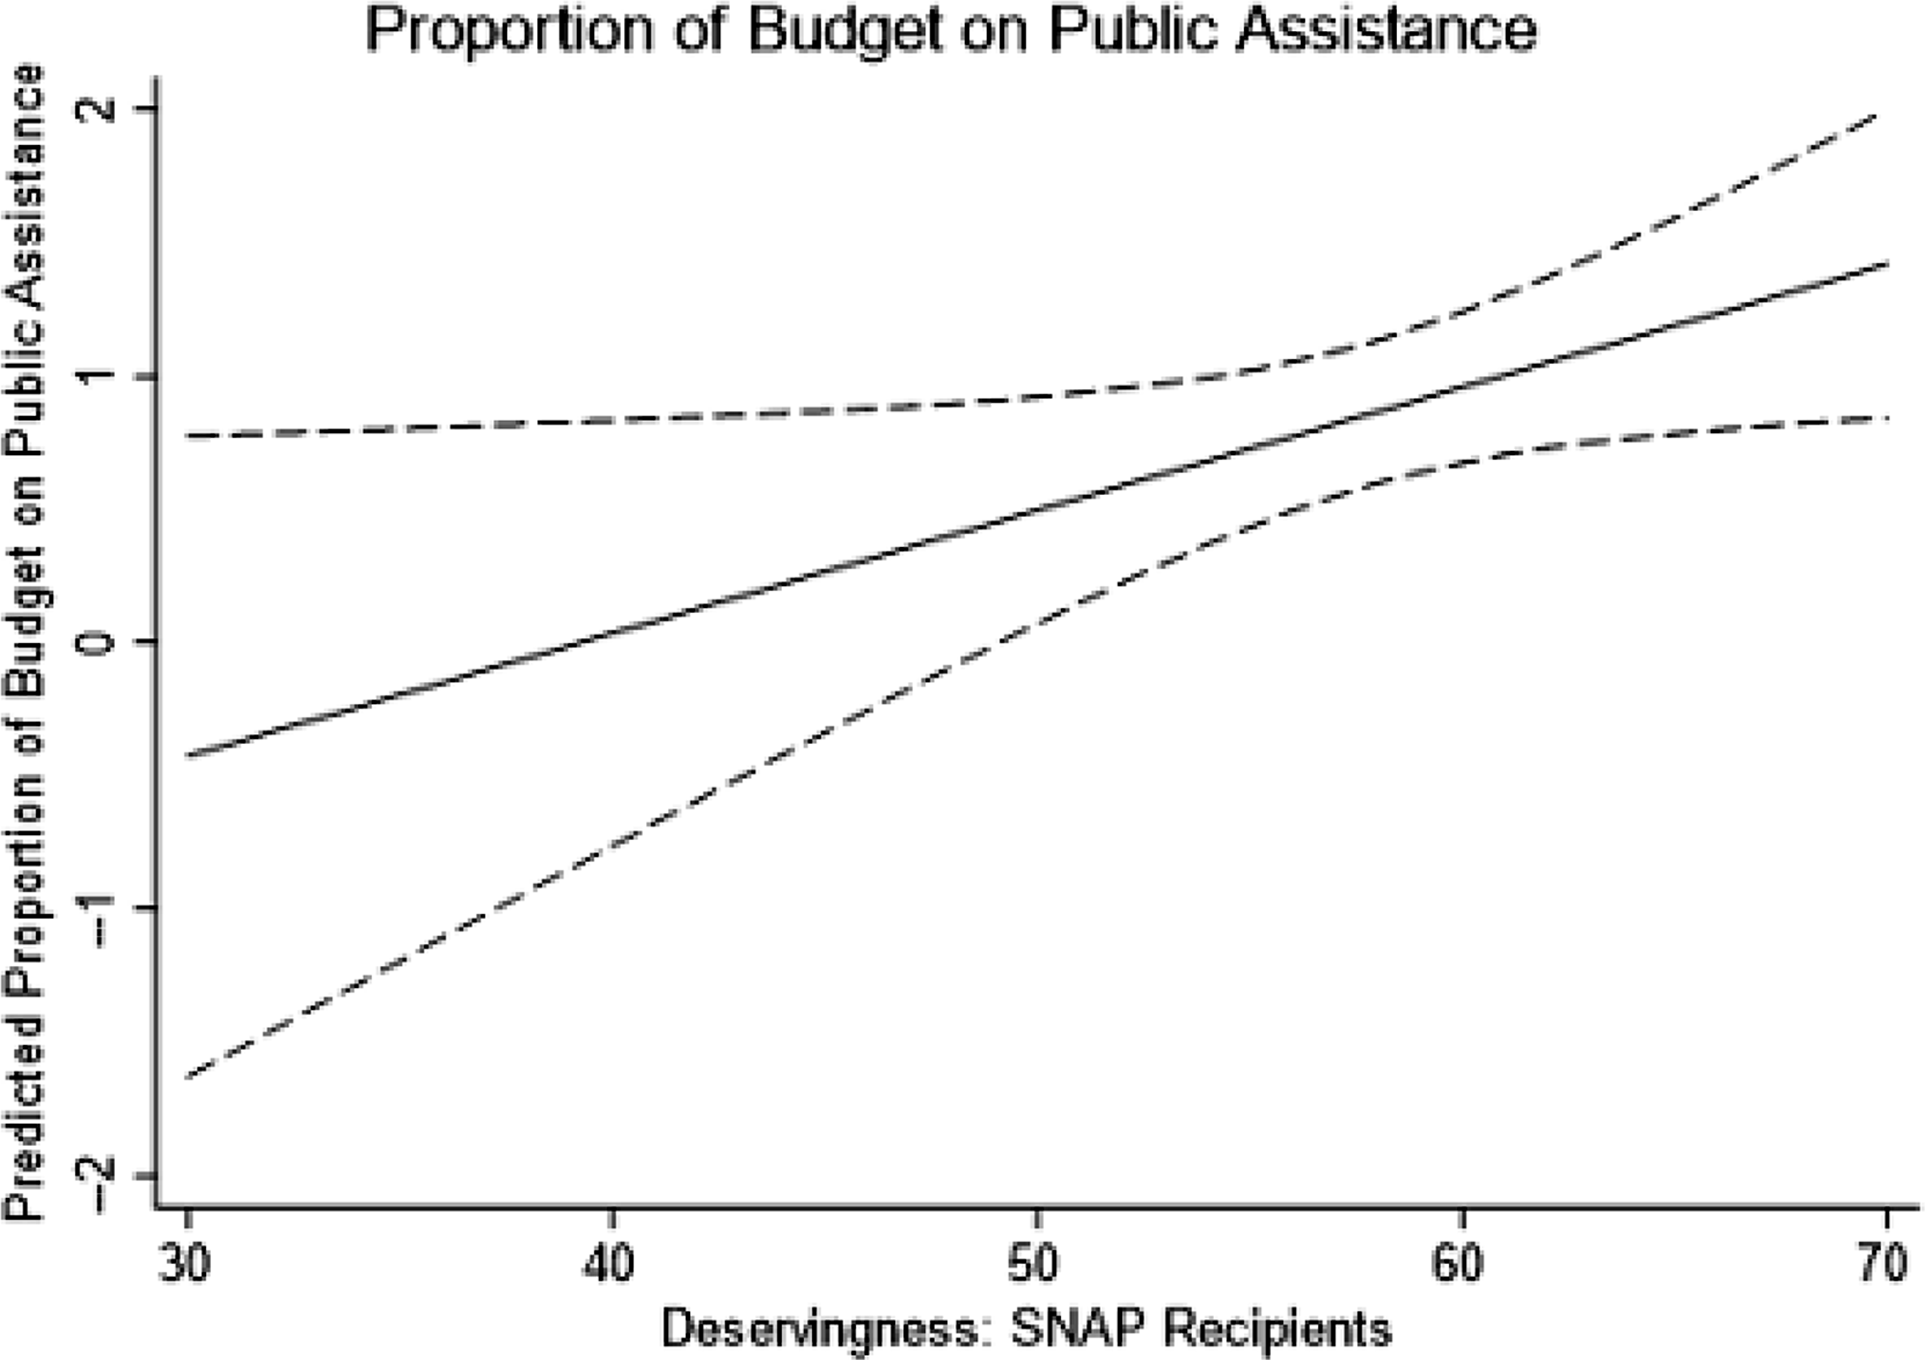
Table 4 and Figure 11 present key findings. Across the three groups, we find that the way that residents’ collective assessment of deservingness of SNAP recipients provides additional information about how a state allocates funds toward public assistance. The same cannot be said for deservingness scores of TANF, which is largely a federal program, or the unemployed. Overall, it is worth noting that variables that one would typically expect to influence a state’s orientation toward public assistance, such as citizen ideology or the partisan leanings of the state’s executive, do not provide predictive value, but evaluations of deservingness do though in a limited way. As Figure 11 shows, moving from states that view SNAP recipients as least deserving (deservingness = 30) to most (deservingness = 70) raises the percent of the budget spent on public assistance by roughly 1%.
Deservingness evaluations of financially vulnerable people on state policy
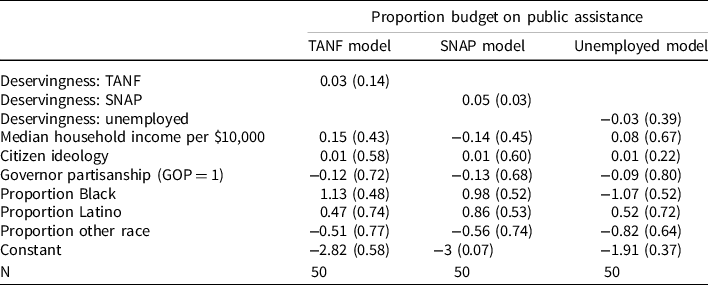
Notes: OLS coefficients reported, p-values in parentheses.
Predicted Proportion of Budget on public assistance.
Note: The figure shows the predicted proportion of state budget spending on public assistance across a range of deservingness scores for SNAP recipients. Dashed lines represent 95% confidence intervals.
Discussion and conclusion
We sought to provide both methodological and theoretical contributions to several bodies of literature, especially that which is focused on deservingness and policy feedback. First, scholars have revealed that individuals’ ideological and partisan orientation influences the way they think about policies and groups, but they also note that deservingness evaluations serve as key indicators for people’s attitudes about how welfare should be distributed. However, there are important insights that have oriented this article’s analytical perch and direction. One is that “all politics is local,” and the second is that political and policy outcomes are produced by collectives of citizens and denizens. Here, we sought to move away from focusing strictly on micro-level assessments of deservingness because politics and policy happen at the collective level, and in doing so, this article makes several contributions. First, we have developed state-level measures of social constructions for target populations, as the state-level is where a great deal of policy is shaped and implemented.
Second, while we take seriously the fact that the deservingness heuristic is universal (Petersen Reference Petersen2012), we also realise that the cues that trigger the heuristic are contextual and conditional. In this case, we centre the fact that state context matters a great deal in the type and frequency of cues that are provided to the public. As such, while we can expect that as deservingness evaluations increase, people are more likely to be sympathetic or support policies that are helpful to an unlucky person or group, we can also expect that these evaluations will range across space. Not only do elites in various states provide differing messages about politically relevant groups, but historical policies in a state also serve as messages and cues to the public. With this key nuance in mind, we sought to and were able to determine that deservingness evaluations of various target populations are heterogenous across space.
Third, we show the usefulness and predictive value of these subnational measures of deservingness, and we revealed the link between state-level deservingness and policy outcomes. Additionally, we find that in some cases, deservingness predicts state policy above and beyond traditional measures that tap into state-level political environments; these findings may speak to advocacy groups who seek to alter narratives around various target groups.
What’s more, by extending our analysis outside of social welfare policies, we were able to cull together evidence that deservingness evaluations influence policy matters outside of matters of “small scale help” (Petersen Reference Petersen2012). Here, we assess the link between subnational deservingness evaluations of socially and financially vulnerable groups as well as immigrants, gun owners and interest groups, and criminals. While we did not find a link in every instance, overall our results converge to provide evidence that states’ deservingness evaluations influence policy design and outcomes.
Our results also speak to key policy theories, including the social construction of target populations theory as well as policy feedback. As mentioned, policy makers are “single-minded seekers of re-election” (Mayhew Reference Mayhew1974). In an effort to capture the electorate’s favour, policymakers have to appease its voters and be able to justify policy design choices. Policymakers are incentivised and rewarded to systematically provide (often unnecessary) advantages to some groups and disadvantages to others, claiming that groups receive the amount of policy benefits they “deserve.” As the public’s shared notions about which target groups are “good” and which are “bad” become cemented, policymakers continue giving benefits to powerful, well-liked groups while punishing weaker, negatively viewed groups. Over time policies can exacerbate inequality, justify differential treatment across categories, and further embed group stereotypes—making them “commonsense.” In this way, inequalities in policy become legitimised. The social construction theory of target populations illuminates this dialectic process between anticipatory feedback, policy design, and policy feedback. This article provides evidence for it.
Our results also serve to challenge and extend these theories. For we show, there is not always consensus about the degree to which groups are entitled to goodwill and public sympathy, despite the underlying supposition of the original theory of social constructions. Instead, we find that there is state-level variation in the shape of social constructions around the 20 groups we focus on here. Nonetheless, this refinement of the theory does not shake its foundation. Instead, our findings bolster it; indeed, we find support for the central components of the theory. A core takeaway of the social construction theory is that policymakers like to do good things for good people and bad things for bad people, and furthermore, that the public’s sense of who is good and who is bad influences policy design. We find a great deal of evidence for this. When various target populations are viewed kindly, they are more likely to receive benefits or more lenient policy. This is true even for groups categorised as deviants. When low-power, low-deserving groups are viewed more positively, those groups suffer less (or fewer people in those groups suffer).
Before we close, it is important to note the caveats of this study. There are three. One is the matter of endogeneity. Considering the policy feedback theory guides our analysis, we acknowledge that the processes that we are evaluating are all endogenous. We rely on a correlational analysis, and while it is impossible to know the directionality of causality, this truth does not undercut the overall contribution. Additionally, we find that there is a mixed pattern in our results. Deservingness does not consistently provide additional predictive power to all of the policy outcomes that we use as case studies here, but we do find that state-level deservingness scores predict outcomes in a range of policy domains, and thus a range of policy targets. Finally, we employ data from MTurk, which is a non-random sample of Americans. The method we use, MRP, accounts for discrepancies in the nonrepresentative nature of the data via the poststratification process using US Census data. This process weights our data to mimic a nationally representative sample.
Overall, this article speaks matters of policy theory, and we also deliver a useful tool for scholars of policy design: state scores of deservingness for 20 highly salient target populations. Scholars have largely relied heavily on state culture or state ideology to predict policy outcomes, but we have developed a more nuanced tool for scholars studying specific categories of policy: immigration, criminal justice, gun rights/regulation, and social welfare. Overall, it is our hope that the tool we provided here will be used by scholars to help us all gain a better understanding of how to use democracy to enhance, rather than diminish, equity.
Supplementary material
For supplementary material accompanying this paper visit https://doi.org/10.1017/S0143814X21000222
Acknowledgements
The authors would like thank the editors of JPP, especially Eric Juenke, and the anonymous reviewers for their feedback in shaping this manuscript. The author order is alphabetical, as each contributed equally to this project.
Data availability statement
Replication materials are available in the Journal of Public Policy Dataverse at https://doi.org/10.7910/DVN/OLZXFF


 Open access