


1. Introduction
The coast of Dronning Maud Land (DML, 20°W to 45°E) and Enderby Land (45°E to 60°E), East Antarctica (Fig 1), does not have large embayments that could provide lateral support to large ice shelves, such as the Filchner Ronne or Ross Ice Shelves. Instead, a majority of the DML coast has many small ice shelves that extend ~50–200 km (mean ~110 km) from the grounding zone with widths of ~50–400 km (mean ~170 km). The coast of Enderby Land is mostly ice-shelf free with some small ice shelves at the terminus of large outlet glaciers. Ice shelves in these regions are punctuated by grounded features known as ice rises and ice rumples. Ice rises are grounded features with their own local flow regime, surrounded fully or partially by ice shelves (Matsuoka and others, Reference Matsuoka2015). This local flow regime typically consists of ice flowing from an elevated ice divide toward the ice shelf. Ice rumples on the other hand are smaller grounded features where an ice shelf flows into and out of a grounded area. Both ice rises and rumples abut and thus stabilize upstream ice shelves (MacAyeal and others, Reference MacAyeal, Bindschadler, Shabtaie, Stephenson and Bentley1987). But downstream of ice rises and rumples, the ice shelves tend to thin and thus are subject to break up due to tensile forces (Borstad and others, Reference Borstad, Rignot, Mouginot and Schodlok2013; Favier and Pattyn, Reference Favier and Pattyn2015). The variable settings of ice rises and rumples in this region indicate that their influence and roles can vary considerably along the coast.
Ice rises in DML coast. Panel (a) shows ice-flow speeds (Rignot and others, Reference Rignot, Mouginot and Scheuchl2011) over map of the DML region with ice rises identified in a recent inventory (Moholdt and Matsuoka, Reference Moholdt and Matsuoka2015). Names in gray are outlet glaciers. The large blue boxes b, c, d, e and f demarcate the coverage of subpanels for five regions reviewed in Section 2. Black squares 3a, 3b, 3c and 3d mark ice rises with double lineations (Fig. 3). Panels (b–f) shows ice rises and rumples labeled as per ice rise inventory (Moholdt and Matsuoka, Reference Moholdt and Matsuoka2015), as well as the relative magnitudes of buttressing to the ice shelves (Furst and others, Reference Fürst2016). Grounding zone (Bindschadler and others, Reference Bindschadler2011) is also shown. Scales are identical for panels (c-f).

Ice rises can be isles or promontories. An isle-type ice rise may be completely surrounded by ice shelves or it may be surrounded by ice shelves and ocean. A promontory-type ice rise (or just promontory) is an extension of the ice sheet into the ice shelves and is sometimes called a ridge or dome. Similar to isle-type ice rises, they have their own local flow, but are also connected to the ice sheet through an upstream saddle. When extended to the calving front, promontories effectively partition the flow between two ice shelves. Considering also their destabilizing effect on the shelf downstream due to tensile forces, ice rises can influence both the longitudinal and the lateral extent of an ice shelf.
In addition to their active role in ice-sheet dynamics, ice rises have been studied for other reasons. We mention four here. First, as they are elevated by several hundreds of meters above the ice shelf, ice rises can influence the surface mass balance (SMB) of the ice shelves around them and thus the regional mass-balance distribution (Schlosser and others, Reference Schlosser, Duda, Powers and Manning2008; Lenaerts and others, Reference Lenaerts2014). Second, if the ice divide has remained stationary, the ice-rise summit can be a prime location for obtaining an ice core, as the ice stays in the vicinity of the ice divide, instead of being advected away to the flanks (Mulvaney and others, Reference Mulvaney2002, Reference Mulvaney, Triest and Alemany2014). Due to the high SMB received at these coastal regions, ice cores from ice-rise summits can provide records of local climate with high temporal resolution, over the past several millennia. Third, ice rises store information regarding their evolution over several millennia in their stratigraphy (Conway and others, Reference Conway, Hall, Denton, Gades and Waddington1999; Martín and others, Reference Martín, Gudmundsson and King2014; Kingslake and others, Reference Kingslake, Martín, Arthern, Corr and King2016). One distinctive feature is a Raymond arch, an upward arch in isochronous layers formed due to accumulated effects of anomalously low vertical strain near the ice divide sustained for an extended period (Raymond, Reference Raymond1983). Other than its presence or absence, the characteristics of a Raymond arch, such as its shape (single- or double-peaked) and the arch amplitude, can reveal past divide migrations, onset of the divide flow and ice thickness changes, which can provide insight into the overall stability of the ice rise and the surrounding ice shelves. This method, also known as Raymond-effect dating (Kingslake and others, Reference Kingslake, Martín, Arthern, Corr and King2016), has been applied to constrain the ice-flow histories of several ice rises in the Weddell Sea (Kingslake and others, Reference Kingslake, Martín, Arthern, Corr and King2016), Ross Sea (Conway and others, Reference Conway, Hall, Denton, Gades and Waddington1999; Martín and others, Reference Martín, Hindmarsh and Navarro2006) and in DML (Drews and others, Reference Drews, Martín, Steinhage and Eisen2013, Reference Drews, Matsuoka, Martín, Callens, Bergeot and Pattyn2015). Fourth, the ice-rise location confirms the presence of bathymetric highs as well as provides information regarding the bed elevation, slope and roughness, all of which can be useful for geological and glaciological studies in the region (Ship and others, Reference Ship, Anderson and Domack1999). For these reasons, ice rises are promising features for future scientific investigations in DML and Enderby Land.
The DML and Enderby Land coasts regulate ice flux from Antarctic drainage basins accounting for more than 5 and 1 m of potential sea-level rise, respectively (estimated with BEDMACHINE's ice-thickness data; Morlighem and others, Reference Morlighem2020). For both regions together, this is of a similar magnitude to the potential sea-level rise from the Greenland ice sheet or the West Antarctic ice sheet, which are major contributors to current sea-level rise. At present, contributions to global sea-level rise from DML and Enderby Land are insignificant; however, little is known about their stability and long-term evolution (Mackintosh and others, Reference Mackintosh2014; Baumhoer and others, Reference Baumhoer, Dietz, Dech and Kuenzer2018). The SMB records from ice cores from this region only go back three centuries, and thus there is a need for deeper ice cores in the region (Thomas and others, Reference Thomas2017). In addition, these SMB records show strong spatial variability across the region, potentially related to orographic effects of ice rises. The large number of ice rises along the DML coast thus provides an excellent opportunity to fill knowledge gaps in regional SMB, evolution and dynamics as well as to eventually constrain the extent and timing of the ice sheet from the Last Glacial Maximum to the future.
This study presents an overview of the current glaciological knowledge of the DML and Enderby Land coasts, with particular focus on ice rises, ice rumples and ice shelves, by reviewing the literature, and using satellite data to determine changes in calving front positions and map ice shelf morphology (Section 2). We then explore the long-term stability of ice rises in these regions by determining, their response times, satellite- and ice-penetrating radar evidence of long-term stability and evolutional stages (Section 3). Finally, we use the above information to suggest key directions of future research for ice-rise studies in ice dynamics and paleoclimate (Section 4).
2. The DML and Enderby Land coasts
2.1. Overall setting
According to an inventory of ice rises and rumples (Moholdt and Matsuoka, Reference Moholdt and Matsuoka2015), Antarctica has 103 isle-type ice rises and 63 promontory-type ice rises. This inventory also includes 510 ice rumples which is likely an underestimate, given that the inventory is not comprehensive enough to include some ice rumples with minimal surface impression (Matsuoka and others, Reference Matsuoka2015). DML has 23 isle-type ice rises, 13 promontories and 97 ice rumples, distributed along a 2800-km-long coastline. Whereas, Enderby Land has eight isle-type ice rises, three promontories and only two ice rumples along the 900-km-long coastline. The majority of these ice rises and ice rumples (65% of ice rises and 54% of ice rumples) are located at the calving front, indicating their role in controlling the shape and extent of the ice shelves in this region (Fig. 1).
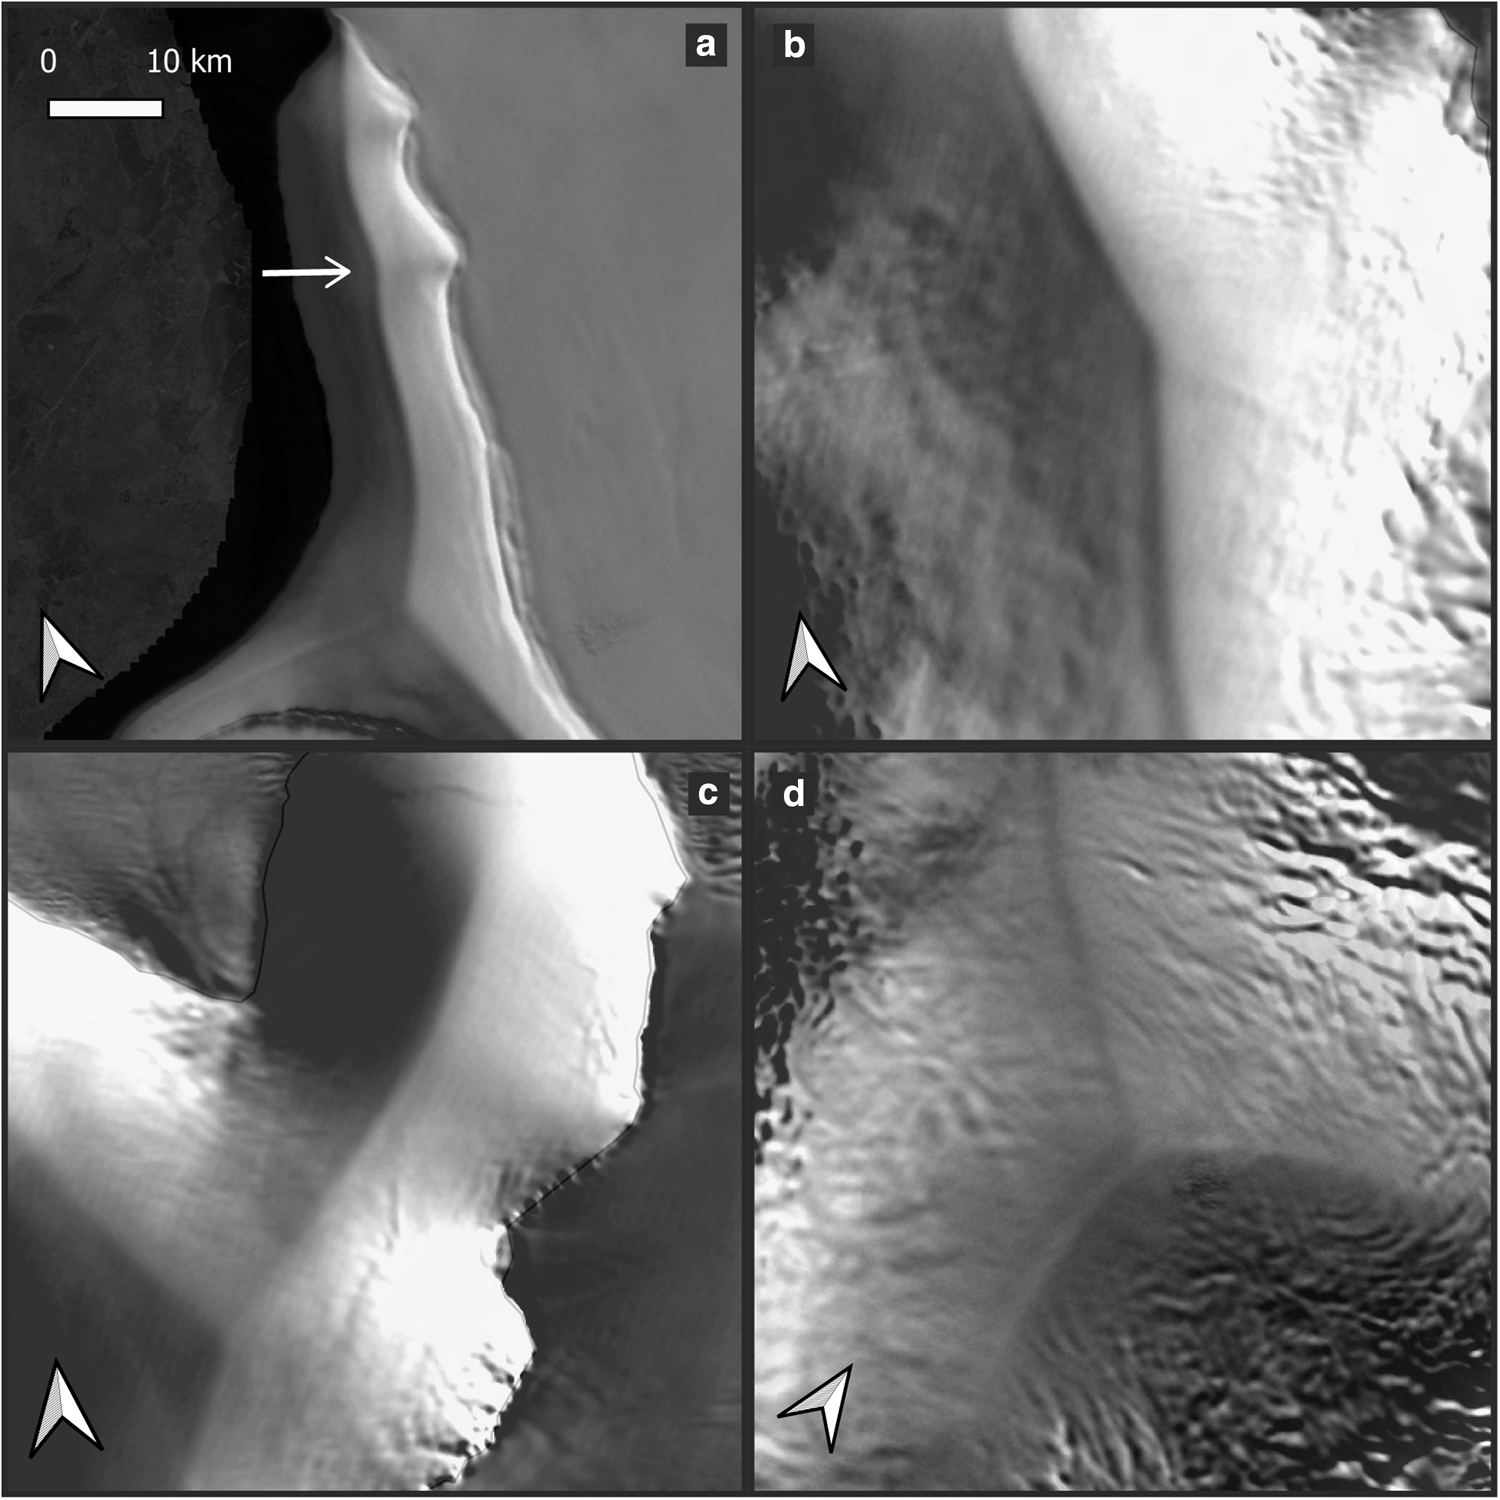
We mapped various surface features on the DML ice shelves, using Radarsat-2 satellite images taken in October 2013. Figure 2 shows that these ice shelves have a variety of surface patterns, a result of their different glaciological settings. These surface patterns are broadly categorized into two types: along-flow features and cross-flow features. Most are surface crevasses or rifts, or surface expressions indicating local ice-thickness changes associated with basal channels or crevasses. Among the along-flow features, some appear to arise at the grounding zone (e.g. Fig. 2a) and continue along the ice shelf, whereas others appear to originate within the ice shelf (e.g. Fig. 2d). The former are likely surface impressions of basal channels formed by the melting caused by subglacial water draining from the ice sheet (Le Brocq and others, Reference Le Brocq2013; Alley and others, Reference Alley, Scambos, Siegfried and Fricker2016; Drews and others, Reference Drews2017), whereas the latter can appear downstream from an ice rumple or in the shear zone around a glacier outlet (Fricker and others, Reference Fricker2009). The cross-flow features (e.g. Fig. 2e) are mostly surface crevasses formed due to shearing over the ice shelf (Wesche and others, Reference Wesche, Jansen and Dierking2013).
Surface features and calving-front displacements. Location of individual panels (a–f) are marked on the map at top. Calving-front positions in 2009 cover the complete DML (MOA coastline dataset; Haran and others, Reference Haran, Bohlander, Scambos, Painter and Fahnestock2014). Calving-front positions in October 2013 extend from 5°W to 34°E and are determined using Radarsat2 imagery. Circle diameters show the apparent calved area, their color showing the timing of the calving event. (a) Western Roi Baudouin Ice Shelf, (b) Lazarevisen and Hugunisen Ice Shelves, (c) Trolltunga ice tongue, (d) Ice-rumple west of the Jutulstraumen outlet glacier, Fimbul Ice Shelf, (e) Jelbart Ice Shelf and (f) Brunt Ice Shelf.
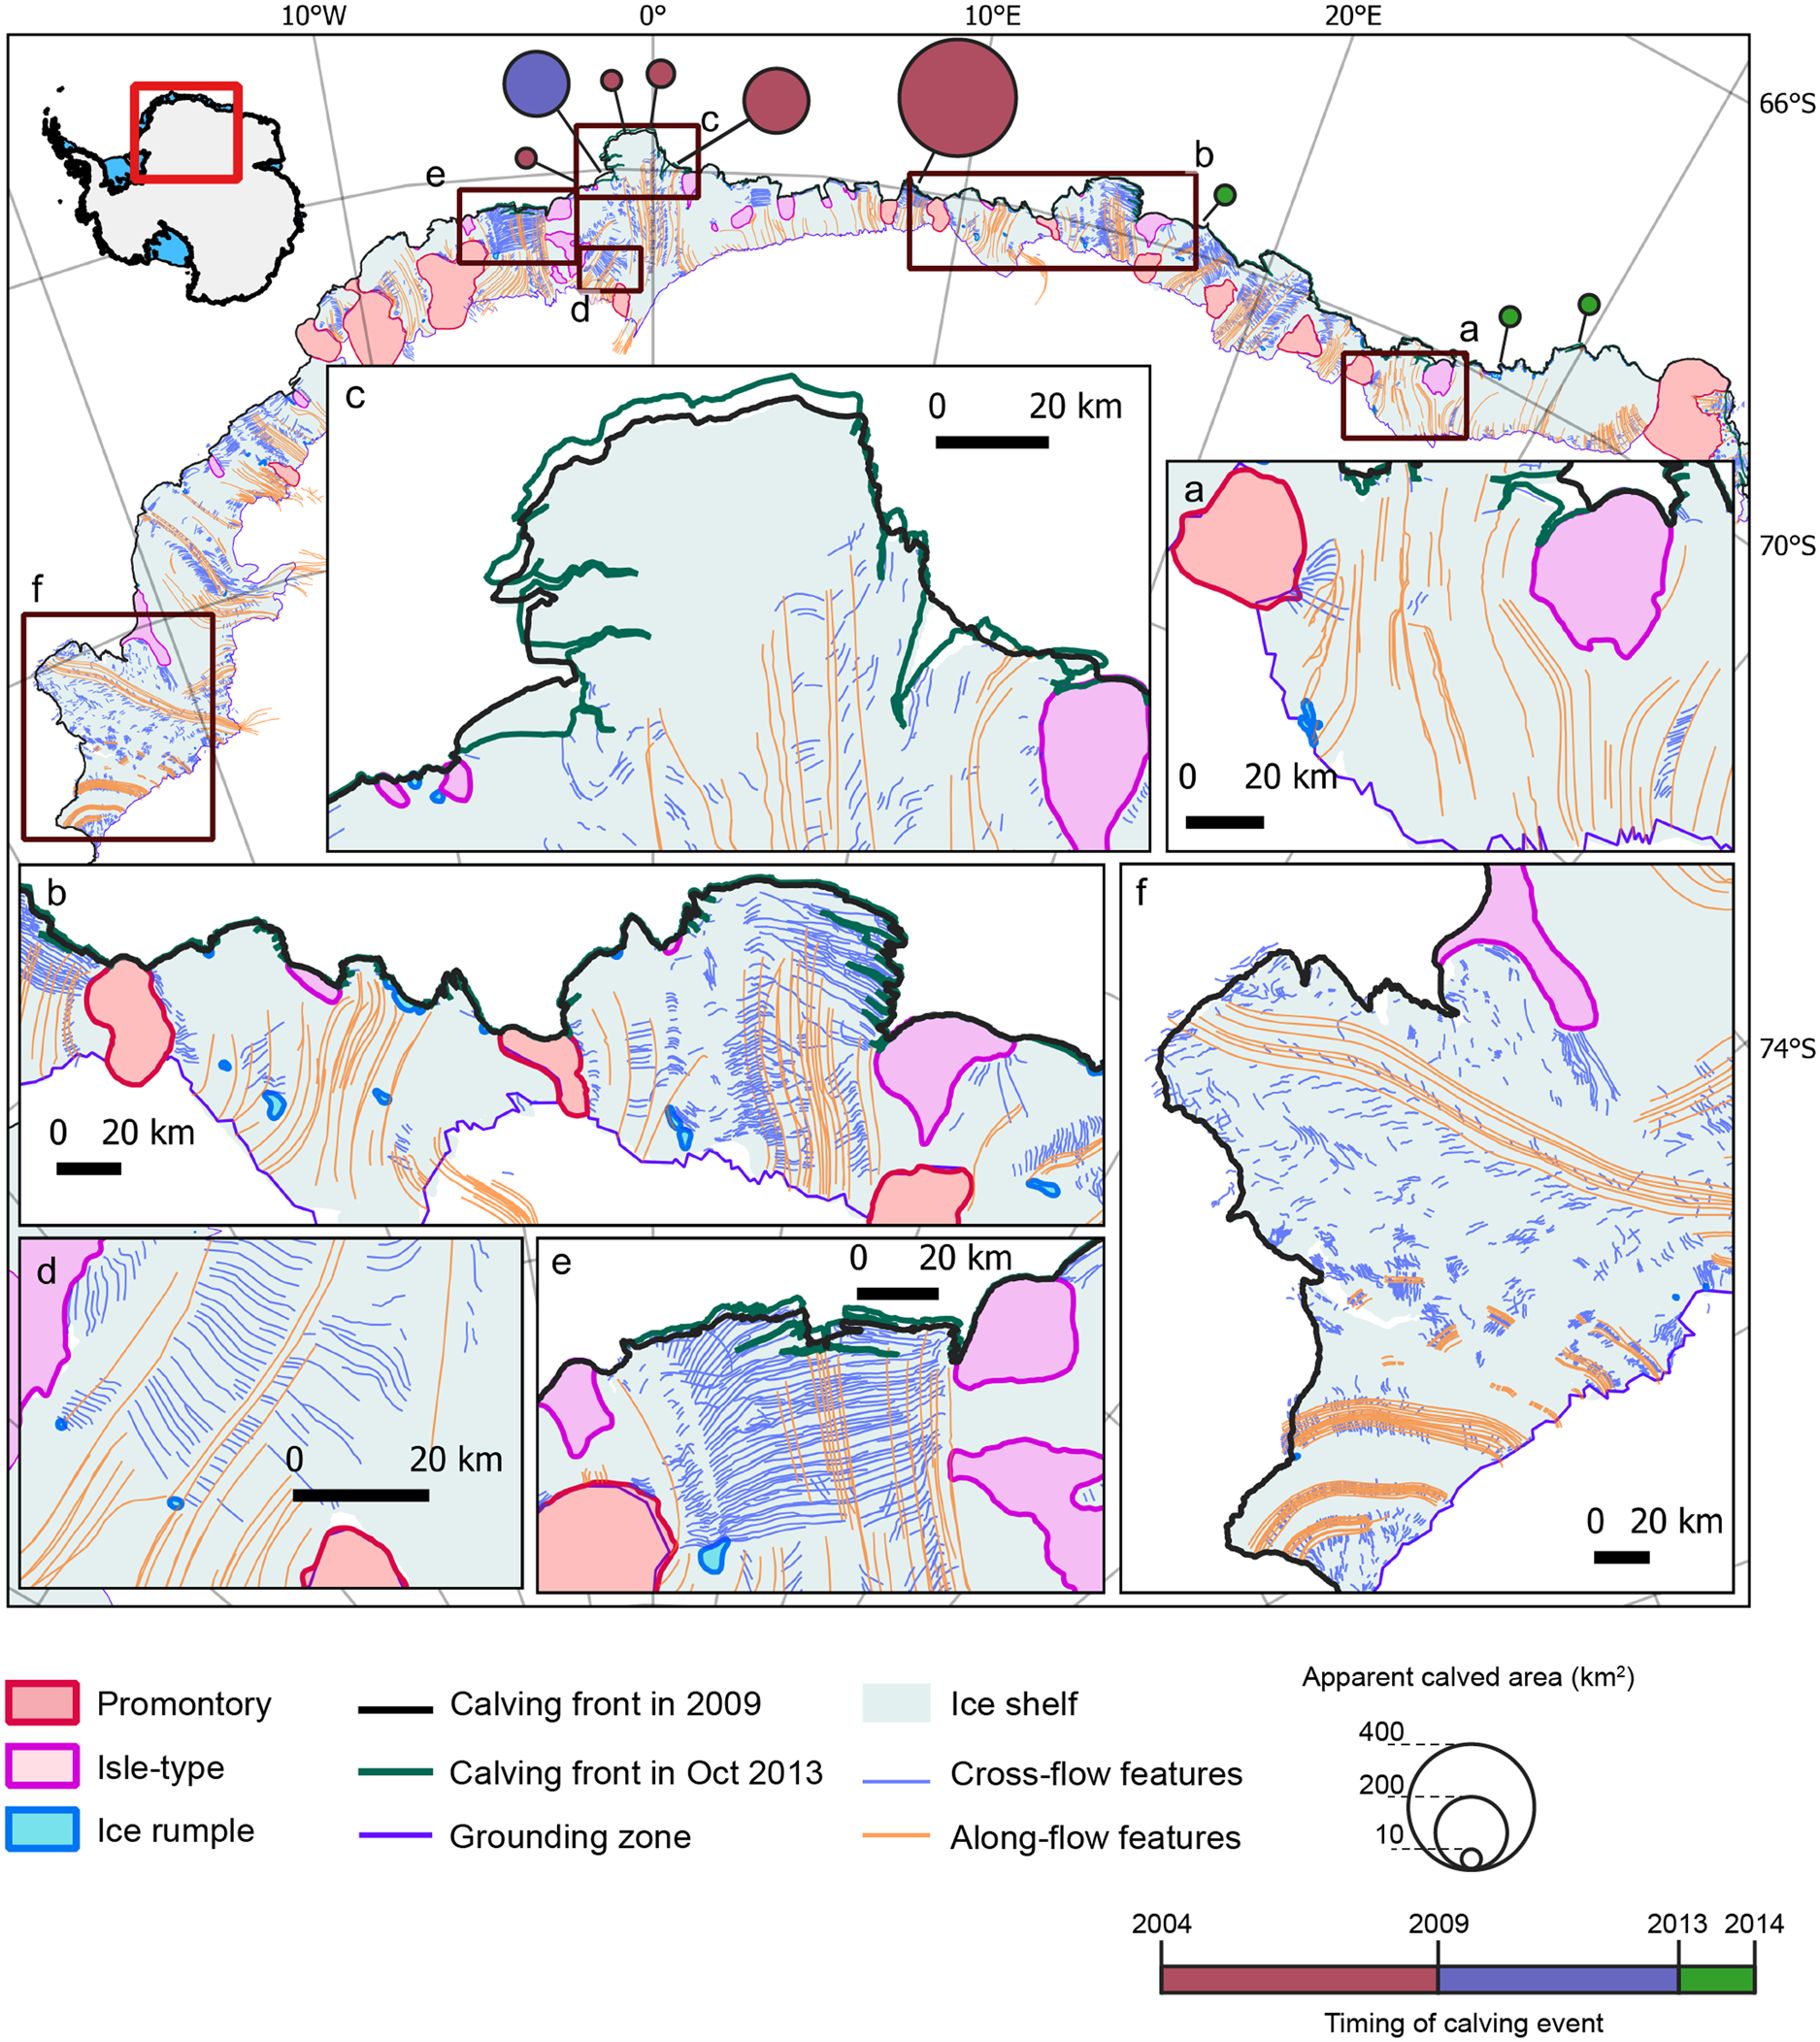
Concerning DML stability, we compared calving front positions between 15°W and 40°E deduced from 2013 satellite imagery and MOA (mosaic of Antarctica) front positions (Haran and others, Reference Haran, Bohlander, Scambos, Painter and Fahnestock2005, Reference Haran, Bohlander, Scambos, Painter and Fahnestock2014). The comparison shows that during 2004–2013, most calving fronts (95%) moved forward in accordance with the local flow (Rignot and others, Reference Rignot, Mouginot and Scheuchl2011), but nine icebergs with areas larger than 10 km2 presumably calved during 2009–2014 (Fig. 2). This observation agrees with the finding in Liu and others (Reference Liu2015) in which ice shelves in the DML region were found to calve as larger tabular icebergs, but infrequently. Such behavior is similar to larger ice shelves such as the Filchner Ronne and Ross Ice Shelves, while it differs from that in Enderby Land and majority of Antarctica where calving occurs frequently as small icebergs (Liu and others, Reference Liu2015). Overall, the ice-shelf front in DML is relatively stable where the ice rises and rumples appear to significantly shape the ice-shelf flow by disrupting, diverging and constraining the flow trajectories.
In the following subsections, we review the current knowledge of ice rises and rumples in DML and Enderby Land, going from west to east. Fürst and others (Reference Fürst2016) assimilated geometry and velocity observations using an ice-flow model to invert for stress regime within the ice. This information was then used to delineate regions of ice shelf that is ‘passive’, meaning that it does not significantly buttress the upstream ice shelf and thus its loss will lead to little or no dynamic response from the upstream ice. We assess the characteristics of the ice rises and rumples in DML using this measure of buttressing as well as the ice-flow field (Rignot and others, Reference Rignot, Mouginot and Scheuchl2011) and the ice-rise inventory (Moholdt and Matsuoka, Reference Moholdt and Matsuoka2015).
2.2. Eastern Weddell Sea ice-shelf region (20°W to 7°W)
The Eastern Weddell Sea region consists of two large ice shelves, the Riiser-Larsenisen and Brunt Ice Shelves (Fig. 1b). These ice shelves are a continuous body of floating ice, with the Lyddan Ice Rise (inventory ID: #655, Moholdt and Matsuoka, Reference Moholdt and Matsuoka2015) in between, but are considered as separate ice shelves due to their different characteristics. The Riiser-Larsenisen Ice Shelf is a continuous ice shelf punctuated with ice rises and rumples, along with occasional surface and basal crevasses. In contrast, the Brunt Ice Shelf is composed of a discontinuous mass of ice blocks bound together by a mélange of thick, fast ice (Fig. 2f; Humbert and others, Reference Humbert2009; King and others, Reference King, Rydt and Gudmundsson2018). West of the Lyddan Ice Rise the Brunt Ice Shelf is fed by the fast-flowing Stancomb-Wills Glacier (~1100 m a−1; Rignot and others, Reference Rignot, Mouginot and Scheuchl2011), whereas on the east of this ice rise, the Veststraumen outlet glacier feeds into the Riiser-Larsenisen Ice Shelf. This ice rise buttresses a large section of ice shelf upstream, and the passive shelf on either side shows the extent of the buttressing effect given by the ice rise.
The Brunt Ice Shelf is also fed by a series of unnamed glaciers bounded to the north by the Stancomb-Wills Glacier Tongue, and to the south by the Dawson Lambton Glacier Tongue (Hodgson and others, Reference Hodgson2019). These glaciers break up and calve into 10–20-km wide icebergs upon reaching the grounding zone. The icebergs eventually fuse together by sea ice and snow layers to form a structurally heterogeneous ice shelf (King and others, Reference King, Rydt and Gudmundsson2018; Hodgson and others, Reference Hodgson2019). Due to its heterogeneous nature, nearly all the ice on the Brunt Ice Shelf is passive. Over the past five decades, the ice-shelf flow speed has fluctuated. This speed fluctuation is heavily influenced by the McDonald Ice Rumple, a rumple of only ~1.5 km2 in areal extent (Gudmundsson and others, Reference Gudmundsson, De Rydt and Nagler2017). This ice rumple was lost when the ice shelf calved in 1971, causing the ice shelf to double its flow speed. The ice rumple gradually re-grounded and by 1997 the contact was again sufficiently strong to reduce the flow speed. Since 2012, the ice shelf has again been speeding up, but the reason is unknown. The recent development of two rifts across the ice shelf suggests an imminent, large calving event (Hodgson and others, Reference Hodgson2019). Given that this shelf is already heterogeneous, if it loses contact with the McDonald Ice Rumple during such a calving event, the shelf may temporarily speed-up or disintegrate due to a loss of structural integrity.
The abrupt transition of the Brunt Ice Shelf into a more homogeneous Riiser-Larsenisen Ice Shelf across Stancomb-Wills Glacier is likely due to the buttressing provided by the Lyddan Ice Rise. The latter ice shelf is punctuated by six ice rises, two being the promontory type, but only the Lyddan Ice Rise has been investigated. The SMB across this ice rise's divide has a weak upwind–downwind contrast (1 : 1.25) with anomalously low SMB just downwind of the ridge (King and others, Reference King, Anderson, Vaughan, Mann, Mobbs and Vosper2004; Vaughan and others, Reference Vaughan2004). Furthermore, King and others (Reference King, Anderson, Vaughan, Mann, Mobbs and Vosper2004) found that very small topographic variations have a disproportionately large impact on SMB variations.
There is a blue-ice region at the western edge of the Riiser-Larsenisen Ice Shelf near the grounding zone, where surface melt ponds have been observed through satellite imagery from as early as 1974 (Kingslake and others, Reference Kingslake, Ely, Das and Bell2017). This region is an ablation zone arising from dry katabatic winds that expose the blue ice, reducing the albedo and causing surface melting.
2.3. Fimbul area (7°W to 8°E)
The Ekström Ice Shelf, east of the Riiser-Larsenisen Ice Shelf, is bound by two large promontories, Søråsen (#684) and Halvfarryggen (#691), of which detailed surveys were carried out at Halvfarryggen. The ice shelf has passive shelf ice extending from the calving front to the middle of the ice shelf and is supported by the two promontories that buttress the shelf upstream. The bathymetry underneath has a deep inland-sloping trough reaching 1100 m below sea level near the current grounding zone (Smith and others, Reference Smith2020). This trough extends from the calving front to the grounding zone, but oceanographic measurements from the same study, performed in the shallow regions of the ice shelf cavity showed no signs of warm sea water in the trough. Basal melt rates obtained using a steady state input–output method applied to the ice-shelf mass balance reveals values up to ~1.1 m a−1 near the grounding zone and at the calving front north of western side of Halvfarryggen (Neckel and others, Reference Neckel, Drews, Rack and Steinhage2012). Model simulations of the catchment of the Ekström Ice Shelf reveal that SMB perturbations result in immediate and sustained divide migration of up to 3.5 km at a speed >2 m a−1 of the Halvfarryggen and Søråsen promontories (Schannwell and others, Reference Schannwell2019). Whereas simulations show that instantaneous ice-shelf disintegration results in small (<0.75 m a−1) divide migration, which is short-lived and delayed.
A firn core retrieved from the ridge of Søråsen Promontory show high SMB of 0.82 mweq a−1 averaged over 1935–2007 (Fernandoy and others, Reference Fernandoy2010). In the same study, a firn core from Halvfarryggen shows an even higher SMB of 1.26 mweq a−1 for the 1960–2007 period. Neither of these SMB measurements shows any significant trend over these time periods. Dated radar reflectors show that Halvfarryggen has a topography-driven SMB distribution, with average SMB over the 1982–2012 period, varying between 0.40 and 1.67 mweq a−1 from the downwind to upwind sides (Drews and others, Reference Drews, Martín, Steinhage and Eisen2013). According to a regional climate model (Lenaerts and others, Reference Lenaerts2014), this contrasting pattern is likely a result of orographic precipitation on the ice rise. Ice-penetrating radar measurement across the ice rise showed the ice thickness to be ~900 m, with well-developed double-peaked Raymond arches and corresponding double lineations on the surface (Fig. 3c, see Section 3.2). Ice-flow modeling reveals that the ice at a depth equal to 90% of the ice thickness (from the surface) is ~11 ka old and the ice divide has been stationary at its current position for at least 2700–4500 years (Drews and others, Reference Drews, Martín, Steinhage and Eisen2013). The same study proposed this ice rise as a candidate for an ice core site fulfilling requirements of the IPICS (International Partnerships in Ice Core Sciences) 2K array (a network of ice core climate and climate forcing records for the last two millennia), considering its high SMB. It also pointed out a possibility to find ice in the last glacial termination close to the bed. Furthermore, it suggested the ice core site to be along the southern divide where the along-flow component (along the ridge) was found to be smallest.
MODIS satellite imagery (Haran and others, Reference Haran, Bohlander, Scambos, Painter and Fahnestock2005) showing double lineations, an indicator of long-term stability over ice rises: (a) Lyddan, (b) Søråsen, (c) Halvfarryggen and (d) Riiser-Larsenhalvøya. Locations of these images are the small black boxes marked 3a–3d in Figure 1. Horizontal arrow in panel (a) marks a double lineation. Distance bar in panel (d) applies to all panels. Arrows in bottom right corners of each panel points to true north.
Further east, in the Jelbart Ice Shelf a mid-shelf ice rumple leads to fractures within the downstream ice shelf (Fig. 2e). Although there are several more ice rises and rumples near the calving front, the ice shelf downstream of this mid-shelf ice rumple is passive ice, highlighting the influence of this small ice rumple in the stability of the shelf. This ice shelf, fed by the fast-flowing Schytt Glacier, has cross-flow surface troughs that align parallel to the calving front, extending between an ice rumple and the ice rises to the east. Beneath the trough lie basal channels and crevasse-like features (Humbert and others, Reference Humbert2015).
The dome-shaped Blåskimen Island Ice Rise (#695) lies at the calving front west of Jutulstraumen Glacier, elevated ~350 m above the surrounding ice shelf and grounded on a nearly flat bed 100 m below sea level (Goel and others, Reference Goel, Brown and Matsuoka2017). Vega and others (Reference Vega2016) analyzed a 20-m-long firn core drilled at the summit, finding an SMB average of 0.70 mweq a−1 between 1996 and 2013. Goel and others (Reference Goel, Brown and Matsuoka2017) analyzed shallow radar profiles and found a strong upwind–downwind (southeast–northwest) contrast, with ~37% more positive SMB on the upwind side. Radargrams from this divide region show a clear Raymond arch. Upward arches similar to a Raymond arch continue to shallow depths, less than tens of meters from the surface. However, the accumulated Raymond effect is not large enough to develop Raymond arches at shallow depths. Rather, these arches are caused by anomalous SMB variations near the ice divide (Vaughan and others, Reference Vaughan, Corr, Doake and Waddington1999; Drews and others, Reference Drews, Matsuoka, Martín, Callens, Bergeot and Pattyn2015; Goel and others, Reference Goel, Brown and Matsuoka2017). Blåskimen Island has been thickening at a rate of ~0.02–0.04 m a−1 over the past 2–4 decades (Goel and others, Reference Goel, Martín and Matsuoka2018). Ice-flow modeling shows that over the past millennia, the ice rise has been in a steady state, maintaining its current surface topography and divide position despite having a stronger upwind–downwind SMB contrast in the past. The causes of these SMB changes are more likely to be a result of changes in synoptic weather patterns rather than changes in orographic precipitation (Goel and others, Reference Goel, Martín and Matsuoka2018).
East of Blåskimen Island, the Fimbul Ice Shelf (Fig. 1c) is fed by Jutulstraumen Glacier, one of the fastest and largest glaciers in DML (Høydal, Reference Høydal1996). This part of the ice shelf moves much faster (~750 m a−1) than the adjacent ice shelf (30–150 m a−1). The resulting sharp transition in flow speeds across the glacier outlet produces a chain of large rifts in its shear margins. A small rumple (2°W) situated at the western shear margin of Jutulstraumen generates a series of crevasses on both of its sides (Fig. 2d). Although the rumple causes significant deformation through the entire thickness, it does not contribute to the rift system further downstream (Humbert and Steinhage, Reference Humbert and Steinhage2011). This glacier feeds the ice tongue, known as Trolltunga, that protrudes ~50 km from the regional calving front, extending beyond the continental-shelf margin. Declassified optical satellite imagery from the 1960s show that this ice tongue had extended out much farther (~80 km more) before calving in 1967 (Kim and others, Reference Kim, Jezek and Sohn2001). The large amount of passive shelf ice in the remaining tongue shows potential for further loss.
The bathymetry underneath the Fimbul Ice Shelf shows a deep trough beneath Jutulstraumen (Nøst, Reference Nøst2004). The basal melt rates measured at various locations from coastal and landward sites are on the order of 1 m a−1 (Langley and others, Reference Langley2014). At two oceanic moorings at the locations of basal melt measurements show that the heat sources are modified warm deep water and fresh surface water (Hattermann and others, Reference Hattermann, Nøst, Lilly and Smedsrud2012).
East of the Jutulstraumen outlet, the ice shelf is buttressed by a series of nearly equally spaced (~50 km) ice rises plus a few ice rumples (Fig. 1c). Most ice extending beyond these ice rises is passive unless buttressed by downstream ice rises or rumples. To the east of Jutulstraumen, two nearby ice rises in the Fimbul Ice Shelf, Kupol Moskovskij (#2) and Kupol Ciolkovskogo (#6), were also investigated. Firn-core analyses show an average SMB value of 0.68 mweq a−1 (1995–2014) for Kupol Moskovskij and 0.24 mweq a−1 (1958–2012) for Kupol Ciolkovskogo (Vega and others, Reference Vega2016). In agreement with the majority of previous SMB studies from this region (Isaksson and Melvold, Reference Isaksson and Melvold2002; Kaczmarska and others, Reference Kaczmarska2004; Thomas and others, Reference Thomas2017), Kupol Ciolkovskogo shows a decreasing trend in SMB over the last five decades.
In addition to the ground-based surveys, an aero-geophysical survey was made over nine ice rises in this region. The profiles in Figure 4 were made with P-band (~400 MHz) radar flying at a constant altitude (Dall and others, Reference Dall2010; Vazquez-Roy and others, Reference Vazquez-Roy, Krozer and Dall2012). (The profile location was designed to cover these ice rises and to be straight between ice rises, for optimal gravity measurements.) For the seaward ice rises, regardless of their bed elevation, the bed reflector appears very smooth, a finding consistent with the ground-based surveys of Blåskimen Island (#695; Goel and others, Reference Goel, Brown and Matsuoka2017) and Derwael Ice Rise (#48; Drews and others, Reference Drews, Matsuoka, Martín, Callens, Bergeot and Pattyn2015). In contrast, a rough bed exists for the landward ice rises Novyy Island (#696) and Trollkjelneset (#703), a finding consistent with ground-based surveys of Lokeryggen Promontory (#44; Matsuoka and others, Reference Matsuoka, Pattyn, Callens and Conway2012). Novyy Island has two profiles, but with different bed topography. This ice rise may be composed of two distinct elevated beds currently covered with a continuous body of ice.
Airborne radar profiles across eight ice rises in the Fimbul Ice Shelf. Yellow lines are the flight path, and ice rises (labeled with inventory IDs) have the corresponding inset radar cross-sections below (labeled with ice rises names). The ice rises covered are Trollkjelneset (#703), Novyy Island (#696), Blåskimen Island (#695), Unnamed (#698), Apollo Island (#702), Kupol Moskovskij (#2), Kupol Lazareva (#11), Kupol Sadko (#17) and Djupranen (#18). In each radargram, the horizontal white bar shows the current sea level, and the red marks the bed position. The upper dark curves represent the ice-rise upper surface (air and firn) and its double-bounced echo appears at the lower part of the radargrams. The scale at bottom left applies to all radargrams. The background satellite image in the map is from MODIS (Haran and others, Reference Haran, Bohlander, Scambos, Painter and Fahnestock2005).

2.4. Central DML (8°E to 24°E)
East of the Fimbul Ice Shelf lies a series of six small ice shelves separated by promontories (Fig. 1d). The two western-most ice shelves are completely separated by promontories extending to the calving front. The next four ice shelves are connected, with the ice shelf flowing beyond the seaward edge of the promontories, and in the cases of Lazarevisen and Huginisen Ice Shelves, flowing between a promontory and an isle-type ice rise.
The Nivlisen Ice Shelf is bound by six ice rises and rumples near the calving front that abut the ice shelf and has almost no passive ice. In contrast, the Muninisen, Huginisen and Lazarevisen Ice Shelves show large regions with passive shelf ice. The absence of a downstream source of buttressing, such as an ice rise or rumple near the calving front, likely explains this characteristic.
The Nivlisen Ice Shelf, fed by the meandering Potsdam Glacier, has a large blue-ice region near its grounding zone that continues on to the ice sheet (Horwath and others, Reference Horwath2006). Observations show surface meltwater lakes that drain, and flood large sections of the ice shelf (Kingslake and others, Reference Kingslake, Ng and Sole2015). Phase-sensitive radar measurements across the Nivlisen Ice Shelf show an average basal melt rate of 0.8 m a−1, with the highest melt rates (3.9 m a−1) observed downstream of an ice rumple. Warm surface waters have been attributed as the source of the melting, with limited influence from deep ocean water (Lindback and others, Reference Lindbäck2019).
The easternmost Jotneisen and Muninisen Ice Shelves are fed by the fast-flowing outlet glaciers Hansbreen and Tussebreen (flow speeds of 400 and 250 m a−1). Modeling suggests Hansbreen to be particularly unstable, with a likely retreat within the next century, driven by both sub-ice-shelf melting and marine ice-sheet instability (Favier and others, Reference Favier, Pattyn, Berger and Drews2016). In contrast, neighboring Tussebreen Glacier (as well as the West Ragnhild) appears stable for the next millennia. Favier and others (Reference Favier, Pattyn, Berger and Drews2016) examined the role of the ice rumple at the calving front of Hansbreen at 23.5°E using ice-flow modeling. After initializing the model with the current settings, the ice rumple, which has area 28 km2, was removed to simulate unpinning. After the unpinning, the ice-flow speed and thus sea-level rise contribution from this drainage basin, increased by ~10%. Conversely, in simulations which did not remove the ice rumple deglaciation was delayed by ~500 years. This example highlights the significance of even small ice rises and rumples near the calving front.
2.5. Eastern DML (24°E to 45°E)
The Roi Baudouin Ice Shelf is the easternmost prominent ice shelf in DML (Fig. 1e) and extends from 24°E to 34°E. From the ice sheet, the ice flow converges through the Yamato and Sør Rondane mountain ranges before reaching this ice shelf. The bed underneath the current grounding zone lowers toward the interior of the ice sheet (Callens and others, Reference Callens2014; Morlighem and others, Reference Morlighem2020), which makes the coastal area of the ice sheet susceptible to the marine ice-sheet instability (Favier and others, Reference Favier, Pattyn, Berger and Drews2016).
The shelf's western section (24–27°E) consists of the third largest outlet glacier in DML, the West Ragnhild Glacier (Callens and others, Reference Callens2014). At the calving front, the ice flow is constrained by three features: the Derwael Ice Rise (#48), the Lokeryggen Promontory (#44) and one unclassified grounded feature (25°E) in between (Berger and others, Reference Berger, Favier, Drews, Derwael and Pattyn2016).
Lokeryggen Promontory (#44) bounds the western edge of the Roi Baudouin Ice Shelf at 24.6°E. It has a saddle and a seaward dome summit where the ice thickness reaches ~600 m (Matsuoka and others, Reference Matsuoka, Pattyn, Callens and Conway2012; Pattyn and others, Reference Pattyn2012). The rough bed underneath this ice rise makes it difficult to identify Raymond arches from its undulating englacial stratigraphy. Ice-flow model results indicate that at the grounding zone, basal melt rates of at least 0.15 m a−1 are required to replicate observed englacial stratigraphy (Pattyn and others, Reference Pattyn2012). Analysis of an ice core collected in the rift zone of the ice shelf farther downstream reveal relatively little accretion of marine ice compared to other parts of Antarctica (Pattyn and others, Reference Pattyn2012). A 208-m-deep ice core was drilled at the ice-rise summit for detailed climatic reconstructions, supplemented by surface radar and automatic-weather station measurements (Kausch and others, Reference Kausch2020). SMB derived from dated radar isochrones show high upwind–downwind contrast (up to 1.5 times) with a local erosion driven minimum near the summit. Moreover, SMB derived from the summit ice core did not matched the temporal evolution of SMB on the upwind side of the ice rise.
Between Derwael Ice Rise and Lokeryggen Promontory lies a small grounded feature (25°E), which is not included in the ice-rise inventory (Moholdt and Matsuoka, Reference Moholdt and Matsuoka2015). Using satellite-based interferometric synthetic aperture radar, speckle tracking and ground-based GNSS (Global Navigation Satellite System) data, Berger and others (Reference Berger, Favier, Drews, Derwael and Pattyn2016) derived an ice-flow map of this region. They found that the ice flows negligibly over this feature and thus it appears to be a small ice rise (only 8.7 km2). This ice rise was found to contribute significantly to the buttressing of the ice shelf, and it likely limits the extent of the passive shelf-ice region to between itself and the Derwael Ice Rise.
Derwael Ice Rise is the most thoroughly investigated ice rise on the Roi Baudouin Ice Shelf. This dome-shaped ice rise is grounded on a smooth bed below sea level with ice up to ~450-m thick (Drews and others, Reference Drews, Matsuoka, Martín, Callens, Bergeot and Pattyn2015). The SMB pattern has strong contrast along the upwind–downwind (southeast–northwest) direction, similar to that observed on Blåskimen Island Ice Rise. Using an ice-flow model, Drews and others (Reference Drews, Matsuoka, Martín, Callens, Bergeot and Pattyn2015) showed that the ice rise has been thinning at a rate of 0.03 m a−1, and this thinning likely goes back 3400 years. Concerning the SMB, analysis of a 120-m-long ice core retrieved from the summit of this ice rise revealed a mean SMB of 0.47 mweq a−1 over the past ~250 years (Philippe and others, Reference Philippe2016). Contrary to other studies in this region reviewed in Thomas and others (Reference Thomas2017), the SMB of this ice rise has generally increased over the past century, with a ~32% increase in the last two decades. Such spatial variabilities in SMB were primarily attributed to atmospheric circulation instead of other factors such as sea-ice extent (Philippe and others, Reference Philippe2016; Thomas and others, Reference Thomas2017). Vertical strain rate measurements near the summit using an optical televiewer show good agreement with full-Stokes ice-flow model results accounting for the Raymond effect (Hubbard and others, Reference Hubbard2020).
This ice shelf's eastern section (27–34°E) flows slowly (<150 m a−1). This section is fed by the East Ragnhild Glacier and abutted by a series of ice rumples located at the calving front (Fig. 1e). Also, it is subject to extensive surface melting, with more melt occurring toward the grounding zone (Trusel and others, Reference Trusel, Frey, Das, Munneke and van den Broeke2013; Lenaerts and others, Reference Lenaerts2017) due to persistent katabatic winds in the region. These winds disrupt the surface-based temperature inversion, thus increasing the surface temperatures and causing melting. In addition, the winds erode the snow surface, exposing the lower-albedo blue ice, leading to further melting (Lenaerts and others, Reference Lenaerts2017). Indeed, supraglacial lakes formed from the meltwater are visible in satellite imagery (Trusel and others, Reference Trusel, Frey, Das, Munneke and van den Broeke2013; Kingslake and others, Reference Kingslake, Ely, Das and Bell2017), and ground surveys show drainage and storage of this water within the ice shelf as englacial lakes (Lenaerts and others, Reference Lenaerts2017). This ponded water can disrupt the structural integrity of the ice shelf and make it vulnerable to hydrofracturing (Glasser and Scambos, Reference Glasser and Scambos2008). Basal melt rates close to 0 in winter to 10 m a−1 in summer were observed near in the grounding zone, with large seasonal and tidal variations (Sun and others, Reference Sun2019). These melt rates are controlled by topographic waves generated at the ice-shelf break. Figure 2a shows along-flow features (~1 km wide) running from the grounding zone toward the calving front. These surface depressions are the surface signature of basal melting arising from subglacial water being discharged from the ice sheet at the grounding zone (Le Brocq and others, Reference Le Brocq2013; Drews and others, Reference Drews2017). These basal channels are zones of elevated localized basal melting, which prevent widespread ice-shelf thinning while aiding crevasse formation (Berger and others, Reference Berger, Drews, Helm, Sun and Pattyn2017). Similar channels also occur on the western part of the Roi Baudouin Ice Shelf (Fig. 2). Considering the small proportion of passive-shelf ice here (Fig. 1e) and landward-sloping bed underneath its grounding zone, the ice-shelf stability may largely depend on the rumples at the calving front.
The easternmost edge of the ice shelf is bound by Riiser-Larsenhalvøya (#70, Fig. 1e), the largest promontory on the DML coast, extending ~40 km beyond the adjacent calving front. Farther east, lies the Shirase Glacier, which is the fastest flowing glacier in the region with flow speeds >2 km a−1. Between Riser-Larsenhalvøya and Shirase Glaciers lie sections of small ice shelves with significant passive ice. These ice shelves have two isle-type ice rises and ten ice rumples, all of which are smaller than 3 km2 in area. Although large in number, almost all of these features are located close to the grounding zone and thus does not help buttress a large proportion of these ice shelves.
2.6. Enderby Land (45°E to 60°E)
East of DML lies the region of Enderby Land, along which there are no continuous ice shelves such as DML (Fig. 1a). For most of this coastline, the ice sheet calves directly to the sea around the grounding zone. There are a few very small ice shelves in this region with limited lateral extent, located at the end of outlet glaciers. Being one of the least explored regions in coastal Antarctica, none of the ice rises in this region have been investigated. The first ice rises to the west are two promontories, Lamykin Dome (#83) and Dingle Dome (#89) situated on either side of the Raynar Glacier. The majority of the perimeter of these promontories is facing the open ocean with very small ice shelves toward the glacier. These promontories form an embayment and could provide lateral support to an ice shelf extended much farther than the current coastline.
Farther east, in the region also knows as Kemp Land, lies four adjacent glaciers, Seaton, Downer, Wilma and Robert Glacier feeding into two narrow ice shelves. The outlet of the Seaton Glacier is bounded by the promontory, King Edward Plateau (#96) to its west and six small isle-type ice rises to its east. Being close to the grounding zone, the buttressing from these six ice rises is limited.
2.7. Summary
Coastal DML is an interconnected system of fast-flowing outlet glaciers and ice shelves, with grounded ice rises and rumples located at various locations within the ice shelves. Radar evidence from ground and airborne surveys shows that most ice rises, particularly those closer to the current calving front, are grounded below sea level on nearly flat beds, while ice rises toward the continent are grounded on rougher beds. As flat beds allow for simpler ice stratigraphy, these ice rises are well suited for ice core drilling and englacial stratigraphic investigations. These smooth beds toward the coast are likely either banks formed of eroded sediments brought by the fast-flowing outlet glaciers and ice streams or marine sediments deposited when they were under the ocean. Samples from the bed of these ice rises would be needed to test this hypothesis.
As many of the ice rises and rumples lie near the current calving front, they likely affect both ice-shelf extent and regional ice dynamics. Over the coast of DML there are several examples of ice rises and rumples buttressing the upstream ice shelves, while promontories provide lateral support. The size of the grounded features does not appear to be important, as relatively small ice rumple can have ice-shelf wide stabilizing (McDonald Ice Rumple and Brunt Ice Shelf) and destabilizing (Jelbart Ice Shelf) effects. It remains unknown why there are no significant ice shelves east of the Roi Baudouin Ice Shelf, especially in the embayments of Shirase and Raynar glaciers. Obtaining bathymetry data would be the first step toward addressing this question.
Given that the ice rises in DML punctuate mostly small ice shelves, the surface topography of the region is highly variable. Such topography leads to strong variability in SMB, not only over the ice rises, but also on the nearby ice shelves (Lenaerts and others, Reference Lenaerts2014). SMB can vary considerably in the summit region and summits of many ice rises show a local minima in SMB, which has been attributed to local erosional processes (King and others, Reference King, Anderson, Vaughan, Mann, Mobbs and Vosper2004; Drews and others, Reference Drews, Matsuoka, Martín, Callens, Bergeot and Pattyn2015). This large variability of SMB thus calls for caution when selecting an ice-core site and when SMB from the core is interpreted regionally.
In addition, coastal DML receives ~50% of all its yearly precipitation through a few storm events (Reijmer and van den Broeke, Reference Reijmer and Van Den Broeke2003; Schlosser and others, Reference Schlosser2010). Thus, regional atmospheric circulation could also be a cause of the observed SMB variability. Mass balance of ice rises also show variability: the Derwael and Halvfarryggen ice rises have been roughly in balance over the past several millennia, whereas Blåskimen Island has been thickening over the past 2–4 decades. Other than the SMB, the mass balance of an ice rise is governed by changes in mass flux. Recent ice-shelf extent changes show that most ice shelves have been flowing without any changes, implying no or small changes in mass flux from ice rises. SMB on the other hand has been variable both spatially and temporally and could be governing the recent mass-balance changes of ice rises.
Significant surface melting and melt-water storage within the ice shelf is observed on three key ice shelves: Riiser-Larsenisen, Nivlisen and Roi Baudouin Ice Shelves. These melt features have persisted throughout the satellite observational periods and would increase with the warming climate (Kingslake and others, Reference Kingslake, Ely, Das and Bell2017). The presence of this water increases the vulnerability of the ice shelves to hydraulically driven fracture.
3. Past stability of DML ice rises
3.1. Indications of long-term stability
Ice-flow divides have a distinct flow regime that typically extends to either side by a few times the local ice thickness. When the divide position remains unchanged for extended periods of time, Raymond arches start to develop. The evolution of these arches thus can be used to assess and compare the long-term stability of ice rises, measured in characteristic timescale T = H/SMB, where H is the ice thickness at the divide. Arch growth is close to linear initially, with well-developed (single) arches reaching an amplitude of 0.1H at ~1T, but slows significantly later (Martín and others, Reference Martín, Hindmarsh and Navarro2009a). The ice underneath an ice divide is subject to a complex stress regime, which leads to the development of strongly anisotropic ice fabric closer to the bed. Depending upon the evolution of the ice fabric, the maximum amplitude of arches in the divide region can vary between 0.13H and 0.3H (Martín and others, Reference Martín, Gudmundsson, Pritchard and Gagliardini2009b; Martín and Gudmundsson, 2012). When the ice rise is stable for a longer period (~4T), the originally single-peaked arch starts transforming into a double-peaked arch, with accompanying flanking inverted arches (or synclines) at intermediate depths, reaching a mature steady-state after 10T (Martín and Gudmundsson, Reference Wesche, Jansen and Dierking2012). The presence of well-developed Raymond arches is also visible on the ice surface, in the form of surface lineations running parallel to the crest of the ice rises on both sides. Goodwin and Vaughan (Reference Goodwin and Vaughan1995) first observed them over three ice rises on the Filchner Ronne Ice Shelf. Using kinematic GPS survey data, they found that these lineations, hereafter double lineations, were concave recesses on the ice surface. They speculated that these features indicated an ongoing divide migration. Later, Martín and others (Reference Martín, Gudmundsson, Pritchard and Gagliardini2009b) used numerical modeling to show that these features are instead associated with a stable Raymond arch, and they appear when the ice rise has been stable for longer than a few times of the characteristic timescales. Thus, double lineations near the summit of an ice rise could be considered as a sign of long-term stability of the ice divide. Matsuoka and others (Reference Matsuoka2015) mapped ice rises with such double lineations in the Antarctic Peninsula and the Amundsen Sea region, finding 23 with double lineations out of 31 ice rises. Out of those 23 ice rises, 12 had characteristic timescales under 500 years and six of 500–1000 years. They concluded that the short characteristic timescales and presence of these features indicates that those regions have been stable for several millennia. Any sustained changes in the more recent past would have led to a loss of these features.
Double lineations are good indicators of long stability. However, the influence of basal sliding on these features is unclear (Martín and others, Reference Martín, Hindmarsh and Navarro2009a). Ice rises in DML are thin (~300–500 m) and have large SMB (0.3–1 m a−1), so their bases should be well below the pressure-melting point (Pattyn, Reference Pattyn2010; Liefferinge and Pattyn, Reference Liefferinge and Pattyn2013). For example, at Blåskimen Island, the basal temperature is −9.2°C according to a steady-state model with a geothermal flux of 60 mW m−2 (Goel and others, Reference Goel, Brown and Matsuoka2017). This geothermal flux value is within the expected range of 45–65 mW m−2 for the coastal DML region (An and others, Reference An2015). Therefore, we assume that the ice rises in DML have beds that have been frozen for the past millennia. As a result, the characteristic timescale should be a useful parameter to examine the stability of these ice rises.
We estimated the characteristic timescales for all ice rises in DML using the following data. For ice thickness, we used direct ground or airborne radar measurements for 12 ice rises. For the remaining ice rises, we used ice thickness estimates from BEDMACHINE dataset (Morlighem and others, Reference Morlighem2020). For SMB data, we used 35-year mean SMB values between 1979 and 2014 that were estimated with the RACMO2 regional climate model at 5.5-km grid resolution (Lenaerts and others, Reference Lenaerts2014). For ice rises east of 46°E, a RACMO output with 27.5-km grid resolution was used instead (Van Wessem and others, Reference Van Wessem2014). Firn-core derived SMB measurements are available for six ice rises, but we use RACMO estimates for these ice rises for consistency. The ice thickness and SMB values were taken at the summit of ice rises located with REMA digital elevation model (Howat and others, Reference Howat, Porter, Smith, Noh and Morin2019). In Enderby Land, three ice rises (#87, #88 and #89) extend farther than the coastline used in the RACMO model, while for another (#94) the BEDMACHINE ice thickness estimate is 0 m, and thus T could not be estimated for these four ice rises.
Although we use the best available data, it is to be noted that the T values obtained here are only guiding estimates for exploratory/comparative analysis, due to the associated uncertainties. Using error estimates provided with the BEDMACHINE dataset and considering a 5% error for field-based ice thickness measurements, we find ice thickness values have an average error of ~18%, with larger errors at poorly resolved small ice rises. The RACMO data used here are averaged over the last 35 years. Considering the SMB composite (of six ice cores sampled in DML) presented in Thomas and others, Reference Thomas2017, over the past three centuries the 35-year mean SMB in DML has increased by ~11%, suggesting a similar order of average uncertainty for this period. Moreover, many ice rises here are represented in one or a few cells in these climate models, even though SMB is highly variable over the ice rises. Comparison of the RACMO SMB values used in calculating T with firn-core derived SMB from six ice rises (averaged over 18–33 years) showed firn-core derived SMB to be higher by an average 70% (min: −16%; max: 113%). These differences could be a result of the large spatial and temporal SMB variability observed over ice rises as well as limitations pertaining to the climate model and thus the associated uncertainties are hard to constrain.
The resulting characteristic timescales T for the 43 ice rises have a mean value of 1165 years with first and third quartiles of 340 and 1520 years (Fig. 5; see Supplement). The distribution is a single mode with a median of 781 years. Twenty-seven ice rises have T < 1000 years, 11 have 1000 < T < 2000 years and 5 have 2000 < T < 6000 years. Overall, the promontories have a larger characteristic timescale (population = 15; mean = 2014 years; first quartile = 970 years; third quartile = 3500 years) than the isle-type ice rises (population = 28; mean = 710 years; first quartile = 335 years; third quartile = 825 years). We found no distinct regional pattern in the characteristic timescale.
Characteristic timescale T of ice rises in DML. A circle's area shows T, its color shows the source of the ice thickness data. The stars indicate four ice rises with double lineations visible in MODIS imagery (Fig. 3).

We searched for double lineations over ice rises in DML and Enderby Land using optical and infrared MODIS imagery (Scambos and others, Reference Scambos, Haran, Fahnestock, Painter and Bohlander2007). To develop an observational criterion to find the double lineations, we examined MODIS imagery of ice rises in the Antarctic Peninsula where Matsuoka and others (Reference Matsuoka2015) identified the double lineations, as well other examples shown in Goodwin and Vaughan (Reference Goodwin and Vaughan1995) and Matsuoka and others (Reference Matsuoka2015). Overall, of the DML and Enderby Land, we found only four ice rises with double lineations (Fig. 5), only 10% of all isle- and promontory-type ice rises. This is a much smaller fraction than the 74% found in the Antarctic Peninsula and the Amundsen Sea region (Matsuoka and others, Reference Matsuoka2015). Therefore, unlike the Antarctic Peninsula, the absence of double lineations on most ice rises shows that large parts of DML and Enderby Land likely have undergone some changes within a few multiples of their characteristic timescales. These timescales range from 370 to 1870 years, which is similar to those in the Antarctic Peninsula (Matsuoka and others, Reference Matsuoka2015). Mass-balance studies show that these regions are currently closer to balance than other regions of Antarctica (e.g. Gardner and others, Reference Gardner2018). The above results suggest that this might not have always been the case during the past few millennia.
The four ice rises with double lineations are marked in Figures 1 and 5, and their satellite images are shown in Figure 3. Among these, Søråsen (#684, 1880 years), Halvfarryggen (#691, 1600 years) and Riiser-Larsenhalvøya (#70, T = 3500 years) are promontories and the Lyddan Ice Rise (#655, 720 years) is an isle-type ice rise located at the calving front of the Riiser-Larsenisen Ice Shelf.
3.2. Stages of ice-rise evolution
Here we examine stages of ice-rise evolution by suggesting a classification scheme based on the presence and magnitude of Raymond arches and double lineations (Martín and others, Reference Martín, Hindmarsh and Navarro2009a, Reference Martín, Gudmundsson, Pritchard and Gagliardini2009b). For the ice rises stable for a period of 1T or less (case I), the Raymond arch is either absent or in its initial stage of rapid growth with maximum arch amplitude <0.1H. Surface lineations are absent at this stage. Longer stable conditions lead to more developed single-peaked Raymond arches with larger amplitudes typically between 0.1H and 0.3H (case II). When the ice rise has been stable for more than 4T, the arches at greater depths then start to develop into double-peaked Raymond arches. In addition, double lineations form. We call this case III. Over time, the double-peaked Raymond arches become more distinct and the double lineations become more prominent, reaching a mature steady state after 10T.
These two criteria for diagnosis i.e. Raymond arches and double lineations, depend on the parameter T, which is often centennial or millennial (Fig. 5), and hence are not sensitive to very recent changes with timescales less than T. When changes started very recently (=T), the possible Raymond arches and double lineations still show the forms developed in the prior steady state or in a state of transition. We call this case 0. Therefore, even if ice rises are categorized into these cases from I to III, we cannot be sure that an ice rise was not subject to ongoing changes started very recently. Divide migrations for example happen over the timescales of the order of T/16 (Hindmarsh, Reference Hindmarsh1996). This diagnostic framework is developed for ideal cases and thus might not apply to complicated cases (e.g. rough bed, highly variable SMB patterns or extremely high geothermal flux). Also, cases where the ice rise surface elevation changes uniformly cannot be distinguished with this framework. The arches in such a case maintain their position relative to the ice divide. However, vertical variations of the arch amplitudes can be investigated to constrain these changes (Conway and others, Reference Conway, Hall, Denton, Gades and Waddington1999; Drews and others, Reference Drews, Matsuoka, Martín, Callens, Bergeot and Pattyn2015).
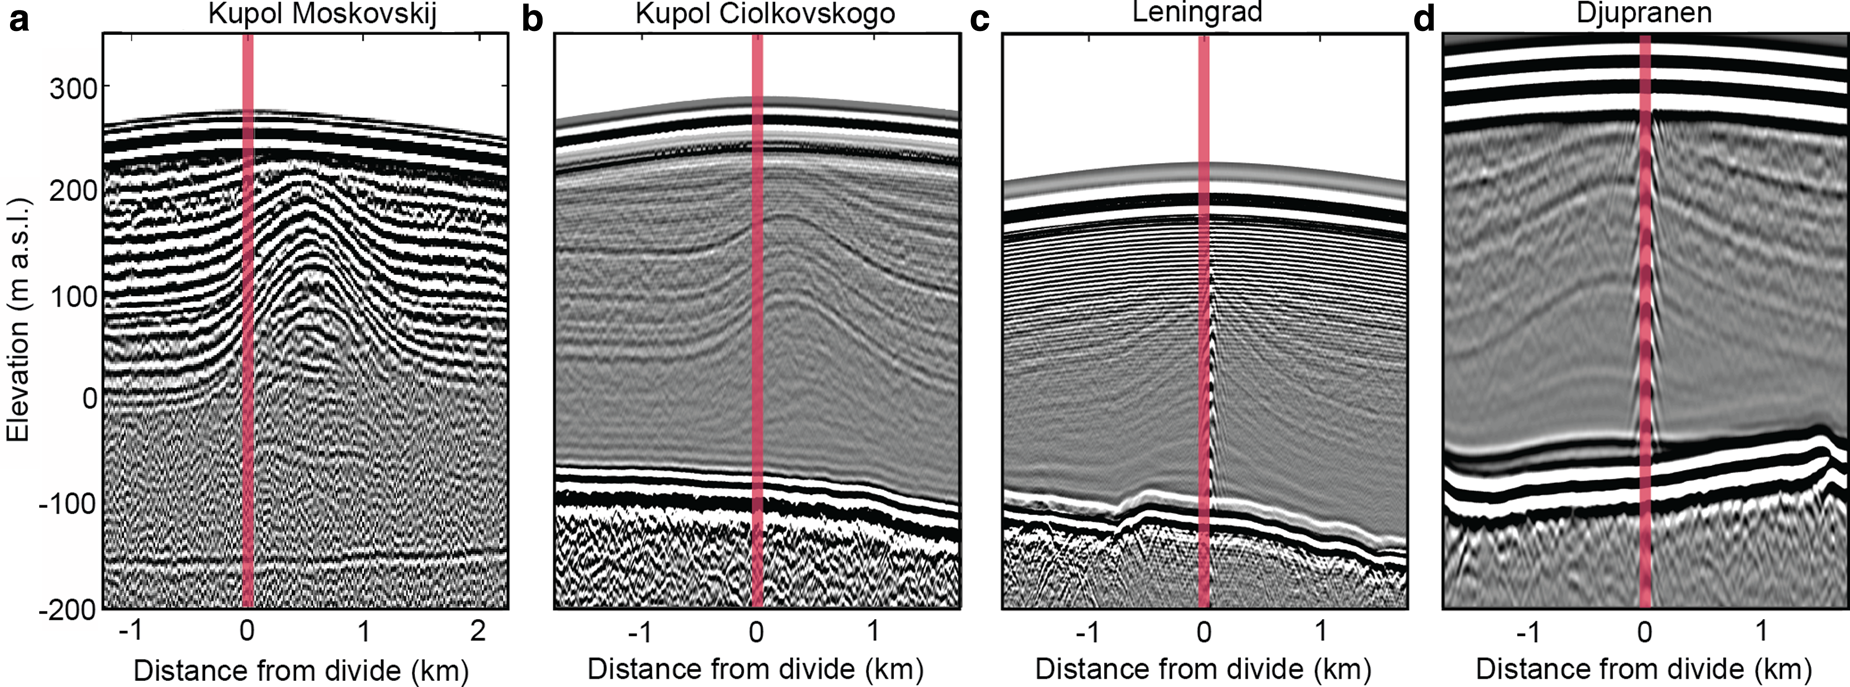
We now apply this classification scheme to radar-stratigraphy data from seven ice rises in DML (Table 1). Halvfarryggen was found to have clear double-peaked Raymond arches and double lineations on the surface (Drews and others, Reference Drews, Martín, Steinhage and Eisen2013). Thus, we classify Halvfarryggen as case III, suggesting that it has likely been stable for at least 4T or 6.4k years. Further east in the Fimbul Ice Shelf, three ice rises have Raymond arches, with no double lineations. Radargrams from these three ice rises, Blåskimen Island (Goel and others, Reference Goel, Brown and Matsuoka2017), Kupol Moskovskij (#2, Fig 6a), and Kupol Ciolkovskogo (#6, Fig 6b), show Raymond arches with amplitudes >0.1H and so we classify all three as case II. Although, arches in all three ice rises are tilted and show an offset from the ice divide with the largest offset visible in Kupol Moskovskij (~0.7 km). These offsets between Raymond arches and ice-divide position are a likely result of very recent changes. These ice rises thus also qualify to be a case 0. Continuing east to the Nivlisen Ice Shelf, we report that Djupranen (#18, Fig 6c) and Leningrad (#28, Fig 6d) Ice Rises both show Raymond arches >0.1H. Djupranen Ice Rise has well-developed but slightly tilted single-peaked Raymond arches, making it a likely cases II and 0. Leningrad Ice Rise has relatively weak single-peaked Raymond arches, but qualifies for case II. West of the Roi Baudouin Ice Shelf, Lokeryggen promontory (#44, Pattyn and others, Reference Pattyn2012) does not have clear Raymond arches due to its undulating bed atypical for promontories (e.g. Trollkjelneset in Fig. 4). The surface shows possible weak double lineations, which hints toward a stationary ice divide, but such surface lineations may instead be due to its rough bed. In contrast, the adjacent Derwael Ice Rise (#48) in the Roi Baudouin Ice Shelf shows clear Raymond arches. Arches in the bottom one-third of the ice appear to be in a transition between matured single-peak and double-peaked Raymond arches (Fig. 9 of Drews and others, Reference Drews, Matsuoka, Martín, Callens, Bergeot and Pattyn2015). However, the surface does not show double lineations; a possible result of the absence of a clear ridge. Specifically, the genesis of double lineations has only been examined for 2-D flow (Martín and others, Reference Martín, Gudmundsson, Pritchard and Gagliardini2009b), and thus the implications are not well known for a more dome-shaped ice rise without a clear ridge. Thus, we infer that Derwael Ice Rise represents a case III. In agreement with this assignment, Drews and others (Reference Drews, Matsuoka, Martín, Callens, Bergeot and Pattyn2015) used ice-flow models to help interpret the shape of the Raymond arches of this ice rise, concluding that the ice rise has been close to steady state (0.03 m a−1 thickening) for 3400 years, or ~4.5T, suggesting a transition between cases II and III. Finally, three other ice rises, Riiser-Larsenhalvøya (#70), Søråsen (684) and Lyddan Ice Rises (#655) show prominent double lineations, suggesting they have been stable for longer time (>4T). Although, we lack radar evidence, these ice rises are likely a case III. For the rest of the ice rises, no double lineations appear and no radar stratigraphy is available. Thus, we speculate that these remaining ice rises have not been stable for longer than 4T and hence are either case I or II.
Radargrams of (a) Kupol Moskovskij, (b) Kupol Coilkovskogo, (c) Leningrad Ice Rise and (d) Djupranen Ice Rise. The red vertical line in each panel marks the portion of the ice divide. All the radargrams are on the same horizontal and vertical scale.
Ice-rise evolution based on double lineations in satellite imagery and Raymond arches
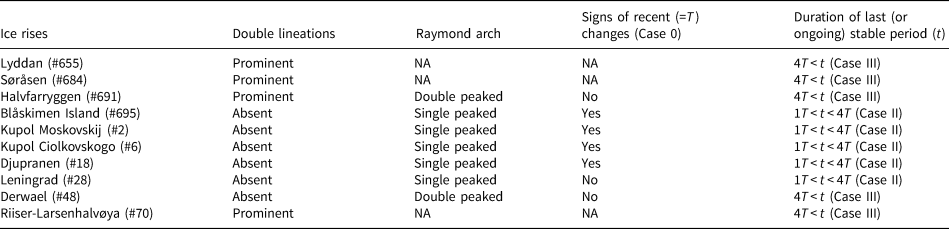
Characteristic timescale T is the ice thickness divided by SMB at the ice-flow divide. NA stands for not available.
4. Directions for future research
Based on our review and the analysis presented above, we discuss key directions for future research of the DML coast including, paleoclimate and ice coring, bed topography and stability of small ice rumples, surface melt, as well as recent deglaciation history.
When an ice rise is diagnosed as stable for a long period, an ice core from its summit can reveal climate information going back several millennia to beyond the Last Glacial Maximum (depending on ice thickness, SMB and stability). Ice-rise summits are especially suitable for ice coring because the ice moves nearly vertically with minimal lateral advection (Mulvaney and others, Reference Mulvaney, Triest and Alemany2014, Reference Mulvaney2002). Low-elevation ice rises may have surface melt that can degrade the core records. Ice cores obtained from Kupol Ciolkovskogo (#6; site elevation = 264 m a.s.l.), Kupol Moskovskij (#2; 268 m a.s.l.) and other ice rises at higher surface elevation have experienced limited melt in their records and thus most ice rises in DML are sufficiently high to avoid this potential issue (Vega and others, Reference Vega2016). As double lineations are signs of long-term stability of a divide, an ice rise with double lineations and a large characteristic timescale could be a suitable candidate for drilling site. Assuming that in the divide region, vertical strain rate varies linearly vertically throughout the ice rise, the ice's age at 0.8H (80% depth) ≈4H/SMB = 4T (a special case of the Dansgaard and Johnsen (Reference Dansgaard and Johnsen1969) parameterization). Modeled vertical velocities at the divide using full-Stokes ice-flow model show differences up to 20% from this parameterization (Martin and Gudmundsson, Reference Martín and Gudmundsson2012), while measurements of vertical velocities vary significantly from this parameterization in ice rises in the Weddell and Ross Seas (Kingslake and others, Reference Kingslake2014). But considering data availability and associated uncertainties, this simple estimate can provide useful guidance. The resulting ages at 0.8H for four ice rises are as follows: Riiser-Larsenhalvøya (#70) as ~14 ka, Halvfarryggen (#691) as ~6.4 ka, Søråsen (#684) as ~7.5 ka and Lyddan Ice Rise (#655) as ~2.9 ka. These ice rises appear in diverse geographical settings over the entire DML coast. Thus, ice core records from these ice rises could be a useful resource to examine the highly variable coastal climate. Of these four potential sites, Halvfarryggen has already been investigated (Drews and others, Reference Drews, Martín, Steinhage and Eisen2013) and identified as suitable for obtaining an ice core.
Along the DML coast, many ice rises and rumples are near the calving front. Safety concerns make ground access to such features, and thus ice-thickness data, difficult to obtain. We suggest airborne survey of ice rises and rumples near the calving front of the eastern Roi Baudouin Ice Shelf. This region has 20 ice rumples at its calving front. The absence of passive ice in this region, suggests that loss of these rumples near the calving front could result in large dynamical changes. Upstream of these ice rumples lies a large region with surface melting near the grounding zone due to the strong katabatic winds, which potentially makes the ice shelf vulnerable to disintegration triggered by hydrofracture (Scambos and others, Reference Scambos, Hulbe, Fahnestock and Bohlander2000, Reference Scambos2009). In addition, measurements indicate that the bed beneath the current grounding zone of the ice sheet is inclined toward the ice sheet (Callens and others, Reference Callens2014), and thus this area could also be susceptible to the marine ice-sheet instability. Hence, it is important to know how well the ice shelf is grounded at these rumples, particularly when the sea level increases, or the ice shelf thins in the future.
The Riiser-Larsenhalvøya Promontory, at the eastern margin of the Roi Baudouin Ice Shelf is an excellent potential ice-coring site for paleoclimate records. As this ice rise lies near, but not in, the high-melt area, the site could also be good for studying temporal changes of surface melt over the millennia. Although in that case, prior to any ice-coring, we should better understand the relationship between the climate at the ice rise and that at locations in the present day high-melt areas.
There are several promontories in DML with an isle-type ice rise at their seaward side. Three such pairs are (1) Kupol Verbljud (#34) and its landward promontory (#33) in the Lazarevisen Ice Shelf (16°E), (2) Halvfarryggen Promontory (#691) and its small seaward ice rise (#692) near 7°W and (3) Søråsen Promontory (#684), together with a small ice rise to its north (10°W). We hypothesize that these isle-promontory pairs were larger promontory-type ice rises in the past that separated during the Holocene deglaciation. Also, Lokeryggen Promontory (#44) has an ice dome seaward that is grounded on an elevated bed (Matsuoka and Pattyn, unpublished data) and a saddle landward along the ice ridge (Matsuoka and others, Reference Matsuoka, Pattyn, Callens and Conway2012). If this regional grounding zone retreats further, the promontory may become smaller and form both an isle-type ice rise, at the current ice dome position, and a landward promontory-type ice rise. Using ice-flow modeling, Favier and others (Reference Favier, Pattyn, Berger and Drews2016) showed that such a transition from promontory to a pair of isle and promontory can occur. Such pairs of seaward isle and landward promontory ice rises should be investigated to document the stages in this transition. Investigations of such pairs can also give insights into the deglaciation history of the region. For example, the shape of Raymond arches from these ice rises can give the timing of the divide-flow onset and the subsequent thinning rates (Drews and others, Reference Drews, Matsuoka, Martín, Callens, Bergeot and Pattyn2015) from which the retreat history of the grounding zone may be better constrained.
Satellite imagery from 1963 shows an ice shelf north of Kupol Koroleva (#8) near 4°E (Kim and others, Reference Kim, Jezek and Sohn2001), a region which is presently ice free. This ice shelf, which extended ~20-km north of the ice rise calved sometime after 1963. The loss of such an ice shelf, and the associated loss of buttressing, could have increased the mass outflux from the northern margin of this ice rise. This is the only documented recent case of significant ice-shelf collapse in the region and provides a unique opportunity to understand the effect of loss of buttressing on ice rise divide position and stratigraphy. Considering its slow response time (T = ~1200 years), a shallow radar survey may detect anomalously low SMB associated with the past divide position, and such upward arches caused by low SMB may reveal recent migration of the divide.
Finally, we highlight the unique setting of the Lyddan Ice Rise (#655, 21°W). This ice rise sits between the Riiser-Larsen and Brunt Ice Shelves. As this ice rise has no distinct landward promontory-type ice rise nearby, it differs from the pairs of promontory and isle ice rises found elsewhere in the DML. Despite distinct flow regimes of the adjacent ice shelves, its double lineations indicate that Lyddan Ice Rise has long been stable (Fig. 3a). Its unique settings make it a good candidate for investigating the regional evolution.
5. Summary and conclusions
Though small, ice shelves in DML buttress a large section of the Antarctic ice sheet. The numerous ice rises and rumples within these ice shelves greatly influence their shape and extent. On the other hand, the ice rises along the almost ice-shelf free coast of Enderby Land does not play as significant role. We reviewed current knowledge of these features, also examining regional datasets and satellite imagery on the associated ice shelves. Stability of the ice shelves depends on the ice rises and rumples distributed within them. We argued that some ice shelves, such as the Roi Baudouin and Brunt Ice Shelves, may be more vulnerable than others to future unpinning of ice rumples at the calving front. We delineated satellite features indicating long-term stability of ice rises and estimated characteristic timescales of ice rises, then used these characteristics to categorize the ice rises into distinct stages in their evolution. Evidence from the ice rises showed that much of coastal DML and Enderby Land has been undergoing changes over the past several millennia, although the primary driver of the changes (ice dynamics or atmosphere) remains unknown. Better millennial-scale paleoclimate and ice-dynamics records are needed to quantify these changes and determine the drivers.
Assimilating the results, we identified four promising ice rises that have been stable for several millennia and could be suitable for ice coring: the Riiser-Larsenhalvøya (34°E), Halvfarryggen (7°W), Søråsen (10°W) and Lyddan (21°W) Ice Rises. For paleoclimate data over shorter timescales, many other ice rises are suitable, particularly in central DML. We also argued that studying pairs of isle-type and promontory-type ice rises should be particularly useful for understanding Holocene deglaciation and the resulting formation of ice rises, suggesting two examples of such pairs, one involving Kupol Verbljud (16°E) and one involving Søråsen Promontory (10°W). Overall, the ice rises in DML provide excellent opportunities to investigate past changes in the region as well as understand the processes that govern these changes.
Data
Surface features over the ice shelves in DML digitized using Radarsat-2 satellite imagery are available at https://doi.org/10.21334/npolar.2017.7b7919c7. Ice thickness data from airborne low-frequency radar profiling over nine ice rises and adjacent Fimbul Ice Shelf in DML are available at https://doi.org/10.21334/npolar.2020.2fff6e30. Ice shelf front positions of DML from August 2012 to December 2013 digitized using Radarsat data are available at: https://doi.org/10.21334/npolar.2017.0f173e4f. A supplementary data sheet for this article can be found at https://doi.org/10.21334/npolar.2020.bd1a75fe.
Acknowledgements
We thank Peter Neff, three anonymous reviewers and science Editor Jonathan Kingslake for their helpful comments. VG received a Ph.D. studentship from the National Centre for Polar and Ocean Research (NCPOR), through financial support (MoES/16/22/12-RDEAS) from the Ministry of Earth Sciences (MoES), Government of India. We thank Jan Lenaerts for providing the SMB output from the regional atmospheric climate model RACMO2. The Fimbul Ice Shelf airborne radar data were acquired in 2011 as a part of the IceGRAV project, an airborne geophysics project led by Technical University of Denmark (DTU) in cooperation with the University of Texas, the Norwegian Polar Institute, the University of Bergen and the Istituto Antarctico in Argentina. Funding for IceGRAV 2011 was provided by the US National Geospatial-Intelligence Agency, ESA and DTU. Satellite data analyses carried out by CDB and IL were supported by the Research Council of Norway's ROMFORSK program (project number: 230945). The Radarsat2 satellite imagery used for this work was provided by Norwegian Space Center and Kongsberg Satellite Services (KSAT) under the Norwegian–Canadian agreement. Airborne radar data analysis was supported by the Research Council of Norway's POLARPROG program (project number: 24780). Ground-based radar data in Fig. 6 (a, b) were collected and analyzed by the Research Council of Norway's POLARPROG program (project number: 24780) and partly supported by the Norwegian Antarctic Research Expeditions and the Center for Ice, Climate and Ecosystems (ICE) of the Norwegian Polar Institute. Radar data in Fig. 6 (c, d) were collected by India-Norway MADICE project jointly supported by India's Ministry of Earth Sciences and by the Research Council of Norway, and analyzed by Katrin Lindback. We acknowledge the logistical support provided by the Maitri station during the MADICE expedition. Figures 1–3 and 5 were developed using a free GIS data package Quantarctica (quantarctica.npolar.no). This is NCPOR contribution no. J-44/2020-21.
Author contribution
VG and KM designed this study. VG conducted the literature survey and data analysis. CDB digitized the calving front positions using Radarsat2 imagery and estimated calving fluxes. IL digitized morphological features over the ice shelves in DML using Radarsat2 imagery. JD and RF collected and processed the airborne radar data over the ice rises in the Fimbul region. VG and KM together led the interpretations of the results. VG prepared the manuscript with support from KM. All authors commented on the final manuscript.


 Open access