


INTRODUCTION
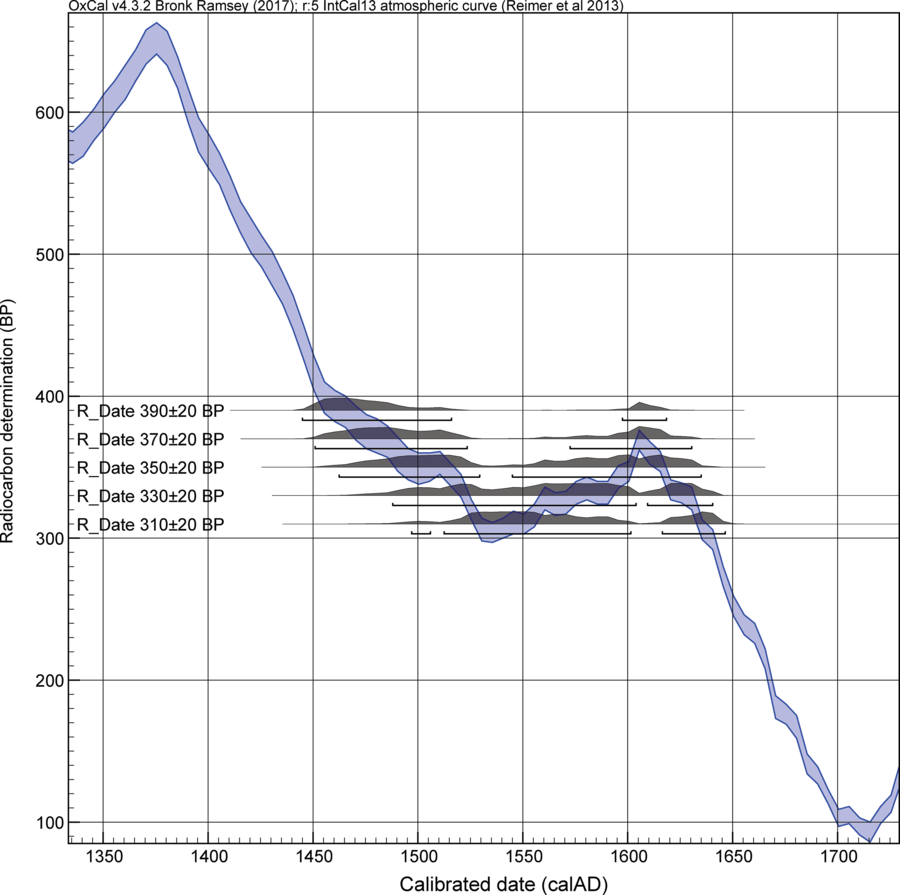
Reversals and plateaus in the radiocarbon (14C) calibration curve are a recognized challenge for archaeological (and other) dating (Taylor et al. Reference Taylor, Stuiver and Reimer1996: 661–662). A given set of 14C values contemporary with a plateau produce calendar dating probability spread over a long period, or periods, largely irrespective of the accuracy and precision of the individual 14C measurements. This poses difficulties for resolving succinct and non-ambiguous timeframes for shorter duration contexts, notwithstanding recent efforts to increase 14C definition across some well-known problematic instances of reversals and plateaus in the calibration curve, such as the Hallstatt Plateau ca. 800–400 BC (e.g. Taylor and Southon Reference Taylor and Southon2013; Park et al. Reference Park, Southon, Fahrni, Creasman and Mewaldt2017; Jacobsson et al. Reference Jacobsson, Hamilton, Cook, Crone, Dunbar, Kinch, Naysmith, Tripney and Xu2018). While the Hallstatt Plateau is a well-known problem zone (Hamilton et al. Reference Hamilton, Haselgrove and Gosden2015), the reversal and plateau in the radiocarbon record ca. AD 1480–1630 is another conspicuous instance (so-called perturbation Ib in Taylor et al. Reference Taylor, Stuiver and Reimer1996: table 2, fig. 3A). This latter case has long been held to render radiocarbon dating unable to contribute usefully to high-resolution dating in this recent period, and hence was observed as a key problem for mid second millennium AD North American archaeology (e.g. Pendergast Reference Pendergast1993). This is an especial problem since this time period coincides with the emergence of historically documented Indigenous polities, the arrival of the first Europeans to northeastern North America, and the subsequent movement of European objects and later European peoples inland. Considered individually, 14C ages hitting this region of the calibration curve yield wide and often ambiguous (bi-modal) calendar probabilities and date ranges: Figure 1. We note that our paper employs the IntCal13 dataset. The upcoming IntCal20 curve (Reimer et al. Reference Reimer, Austin, Bard, Bayliss, Blackwell, Bronk Ramsey, Butzin, Edwards, Friedrich and Grootes2020) contains greatly increased data density and refinements from many new annual 14C data in the second millennium AD. The increased fine structure and resolution in the IntCal20 calibration curve will inherently bring improvements, and create some changes in details. Nonetheless, the fundamental issue of calendar resolution across a 14C plateau remains.
Calendar age calibrated probabilities for five example 14C ages (390 ± 20 BP to 310 ± 20 BP) lying in the region of the ca. AD 1480–1630 reversal/plateau in the 14C calibration curve, illustrating how they yield wide, ambiguous, calendar ranges in the region ca. AD 1450–1650. 95.4% probability ranges are indicated. Data here and in all other figures are from OxCal v.4.3.2 (Bronk Ramsey Reference Bronk Ramsey2009a) and IntCal13 (Reimer et al. Reference Reimer, Bard, Bayliss, Beck, Blackwell, Bronk Ramsey, Buck, Cheng, Edwards, Friedrich, Grootes, Guilderson, Haflidason, Hajdas, Hatté, Heaton, Hoffmann, Hogg, Hughen, Kaiser, Kromer, Manning, Niu, Reimer, Richards, Scott, Southon, Staff, Turney and van der Plicht2013). Curve resolution is set at 5 yr.

Fortunate circumstances excepted, for example, where a set of 14C measurements through the range of values found might indicate the start or end of such a plateau (e.g. Jope Reference Jope1986), these plateau periods largely resisted resolution before the application of Bayesian chronological modeling. Tree-ring sequenced samples which allow wiggle-match 14C dating (Bronk Ramsey et al. Reference Bronk Ramsey, van der Plicht and Weninger2001; Galimberti et al. Reference Galimberti, Bronk Ramsey and Manning2004) are the most obvious solution enabling temporal resolution (for a Hallstatt period example, see e.g. Quarta et al. Reference Quarta, Pezzo, Marconi, Tecchiati, Elia and Calcagnile2010). Although, in situations where only short sequences are available in isolation, these sometimes will potentially remain problematic until calibration curve and sample resolution can be fully aligned (see Bayliss et al. Reference Bayliss, Marshall, Tyers, Bronk Ramsey, Cook, Freeman and Griffiths2017; Jacobsson et al. Reference Jacobsson, Hamilton, Cook, Crone, Dunbar, Kinch, Naysmith, Tripney and Xu2018). In other archaeological cases, where prior stratigraphic or other sequence information are available, the application of Bayesian chronological methods has finally allowed varying degrees of chronological resolution to be achieved across such troublesome plateau periods (e.g. Hamilton et al. Reference Hamilton, Haselgrove and Gosden2015). This is the classic “archaeological” model, where stratigraphy provides a prior known temporal sequence, and such cases were the basis to the original Bayesian chronological paradigm (Buck et al. Reference Buck, Kenworthy, Litton and Smith1991, Reference Buck, Litton and Smith1992), and popular implementations such as OxCal (Bronk Ramsey Reference Bronk Ramsey1995).
However, what about cases where a secure multi-element stratigraphic sequence is not available to provide a temporal structure within which sites or phases may be placed for analysis? The Late Woodland Northeast offers such a situation. It is characterized by relatively short one-phase sites with no or very limited vertical stratigraphy. Estimates of relative placements of sites against each other have been proposed, for example based on assessments (and underlying assumptions) from techniques like ceramic seriation, or from various assumptions about timings and distributions of certain material culture types, such as European trade goods (see reviews in Birch and Williamson Reference Birch and Williamson2013; Birch Reference Birch2015; for examples, see MacNeish Reference MacNeish1952; Bursey Reference Bursey1993; Fitzgerald et al. Reference Fitzgerald, Turgeon, Whitehead and Bradley1993, Reference Fitzgerald, Knight and Bain1995). But all such approaches are assumption-based, rely on untestable stepwise logic transfers, and overall do not offer an independent timeframe. In a few instances, it is believed that community relocation sequences have been identified, where a single community moved from site A to site B to site C (e.g. Birch and Williamson Reference Birch and Williamson2013), but even these cases are invariably not without debate or caveat, and again lack an independent basis separate from various inherent assumptions.
Thus, in practical terms, no prior sequential set of time constraints is available independent of archaeological assumptions and guesswork. These circumstances are a challenge for Bayesian chronological modeling. (This is assuming we avoid the circular situation where we merely build a model based on such existing best estimates/assumptions, and hence just aim to demonstrate that this set of prior assumptions is possible—but of course not necessarily correct.) The additional problem of the AD 1480–1630 plateau in the radiocarbon calibration curve then further exacerbates dating ambiguity.
In recent work addressing dating around the AD 1480–1630 period, Manning et al. (2018; Reference Manning, Birch, Conger, Dee, Griggs and Hadden2019) employed some available ad hoc solutions to try to help to resolve a timeframe across this plateau and for non-stratified sites and sequences. In the former case, some key elements included: (i) a short dendro-wiggle-match, which usefully constrained the date of one site (Warminster) (Manning et al. Reference Manning, Birch, Conger, Dee, Griggs, Hadden, Hogg, Bronk Ramsey, Sanft, Steier and Wild2018: fig. 2); and (ii) selection and dating of terminus post quem (TPQ) dates on charcoal from the early phase of activity at the Jean-Baptiste Lainé (Mantle) site, which constrained its placement (Manning et al. Reference Manning, Birch, Conger, Dee, Griggs, Hadden, Hogg, Bronk Ramsey, Sanft, Steier and Wild2018: fig. S9). In the latter case, some elements of the analysis included: (i) the wiggle-match from the Warminster site (Manning et al. Reference Manning, Birch, Conger, Dee, Griggs and Hadden2019: supplemental fig. 1); and (ii) observation that the dates for each site Phase tended to yield very long possible date ranges—hence we tried employing a range of conservative constraints on the length of time represented by the dates obtained within each site Phase. The justification for a constraint is because the Iroquoian sites under investigation are regarded, both from ethnohistoric, and archaeological, evidence (and derived calculations) to be short. A review of scholarship suggests likely maximum durations of <40 yr, and there is a general view in scholarship that larger sites of this period were typically occupied for 20 or 30 yr at most (Warrick Reference Warrick1988; Birch and Williamson Reference Birch and Williamson2013; Birch Reference Birch2015; see also discussion below). Of course, all such rules will inevitably have exceptions. Thus, we considered conservative duration constraints for the Span of the modeled 14C data ranging from a little larger than the expected maximum duration (50 yr) to 3× the expected maximum duration (120 yr). In Manning and Hart (Reference Manning and Hart2019), use of an Interval constraint was substituted to limit overall site Phase duration (versus just dated events) within the estimated site Phase Boundaries according to conservative assessments.
Ad hoc strategies of these kinds inherently have strengths and weaknesses, and invariably fail to cover all issues. For example, if the context for which a date is sought happens to lie towards the end of a plateau in the radiocarbon calibration curve, then dating material from the context with in-built age—like wood charcoal—can successfully offer a key constraint by ruling out the earlier part of the plateau. The Warminster or Jean-Baptiste Lainé (Mantle) cases in Manning et al. (Reference Manning, Birch, Conger, Dee, Griggs, Hadden, Hogg, Bronk Ramsey, Sanft, Steier and Wild2018) offer examples of this (and another hypothetical example is discussed below). However, if the context of interest lies around the beginning of a plateau, then this same strategy is unlikely to work as effectively. Indeed, it is likely that the effect of creating a TPQ may well be to push the modeled date for the context of interest later along the plateau after accommodating the TPQ information, and so lead to an entirely incorrect age estimate. The only ways to prevent this are either to have a subsequent terminus ante quem (TAQ) constraint (an inherently challenging problem if a sequence of contexts is not known and available), or some means to tie the context to the earlier part of the plateau. One solution here, for example, is potentially using the temporal placement of the in-built age period of a wood-charcoal sample as an additional constraint.
Another issue not addressed in this previous work is whether the assumption of uniform probability for the site Phases is most appropriate, and especially where applying a duration constraint. To explain: if the ethnohistoric information and archaeological assessment is that site Phases were typically no more than 20–30 yr, and definitely less than ~40 yr (see above, and further below), then we have a probability estimate that is not uniform. Rather, there is most likelihood for a duration somewhere up to ~20–30 yr (perhaps typically ~10–25 yr), and then very little probability from 30+ and especially 40+ yr. Thus, rather than simply applying a uniform probability assumption, it would seem as, or more, appropriate to consider alternatives that best capture the prior expert knowledge (or at least to compare such an approach with the uniform probability assumption).
In this paper, we consider the effectiveness of some approaches to chronological resolution, using the ca. AD 1480–1630 plateau and the northeastern North America case study as the example. There is no single solution. Rather, we present a toolkit of some possible strategies that can work in various circumstances, especially when paired together, noting caveats and complications. We emphasize the up-to-now underexploited relevance of even short wiggle-matches on wood charcoal samples.
METHODS
The modeling in this paper employs OxCal 4.3.2 of 2017 (Bronk Ramsey Reference Bronk Ramsey1995, Reference Bronk Ramsey2009a, Reference Bronk Ramsey2009b, Reference Bronk Ramsey2017; Bronk Ramsey et al. Reference Bronk Ramsey, van der Plicht and Weninger2001) and the IntCal13 calibration dataset (Reimer et al. Reference Reimer, Bard, Bayliss, Beck, Blackwell, Bronk Ramsey, Buck, Cheng, Edwards, Friedrich, Grootes, Guilderson, Haflidason, Hajdas, Hatté, Heaton, Hoffmann, Hogg, Hughen, Kaiser, Kromer, Manning, Niu, Reimer, Richards, Scott, Southon, Staff, Turney and van der Plicht2013), current at the time of writing. We use the current default calibration curve resolution of 5 yr. The focus is on practical methods, possibilities, and problems; all cases are hypothetical. We consider two applications of a wiggle-match paired with a duration constraint, and the effects and effectiveness of a duration constraint by itself for plateau cases. For the site Phase duration constraints, we consider both a uniform probability prior (as in previous work), and also some alternatives trying to better capture prior expert knowledge. Example OxCal runfiles for the models shown are provided in the Appendix. OxCal code is listed in Courier format. OxCal key words (like Phase, Boundary, etc.) are capitalized throughout the text. We only report results from successful model runs with Amodel and Aoverall both ≥60 and Convergence ≥95.
The wiggle-match examples employ the D_Sequence function in OxCal with the periods of time between dated tree-rings stated with the Gap(); command. The constituent 14C dates for the hypothetical models are sometimes specified; otherwise, they are simulated for a given calendar age using the R_Simulate function, or simulated for a randomly generated calendar age anywhere within a site Phase range. The latter employs OxCal code along the lines of: R_Simulate(“Date 1”,1480+rand()*30,20); as an example for a simulated date for a hypothetical short-lived sample from a site dating AD 1480–1510 with a 14C dating error of ±20. If a period of time is estimated beyond the last extant tree-ring, and before use in human construction (e.g. 1 ± 1 yr covering instances of cutting in the fall, allowing drying over winter, and then use the following spring/summer, versus immediate use), then this is modeled using the Interval(); command, e.g.: Interval(“Use Timber”,N(1,1)); (see the models in Figure 2). The main proposed additional constraint tested in the examples is the addition of a duration constraint. The first case is where a date or TPQ from the last event in a D_Sequence defines the start of a site Phase, and we then wish to constrain the maximum duration from that point to the end of this Phase. The second case is where the date for an outermost tree-ring in a short D_Sequence belongs within a site Phase, and we wish at the same time to constrain the maximum period of time (duration) of the Phase.
Hypothetical model for Site 1 and House A dated AD 1490–1520. Four 14C dates on short-lived samples from the site Phase are available (note: the 14C age and error of date 1a = date 1b, 2a = 2b, etc.). The difference is illustrated between the upper version (WM and Interval constraint), which incorporates a wiggle-match on 51-yr post sequence to outermost (waney edge) ring and includes an Interval (Int) constraint versus the lower version (No WM and No Int), which has no such extra constraints. Contrast the respective green or orange versus blue Date estimates. The light magenta bar indicates the correct site age. A. employs a uniform prior of 0–60 yr, U(0,60) for the constraint on an Interval query for the Phase duration. B. is as A. but instead employs the prior on the Interval query of LnN(ln(20),ln(2)).

The first case, employed in the model in Figure 2A, uses the Interval(); command, and a uniform probability assumption, and merely sets the duration constraint as, arbitrarily, 2× the maximum estimated site Phase length, thus Interval(“Duration”,U(0,60)); where a maximum of a 30-yr site phase is considered reasonable. The site Phase itself is dated by randomly simulated dates on four short-lived samples from the site period. Such maximum site durations, while based on ethnohistoric observations and archaeological criteria (post densities, site catchment exhaustion estimates, and so on), are of course themselves estimates. Thus, we assume sensible analysis will consider a range of possible duration constraints to determine when and whether there is a change in outcomes, and then to discuss a choice within such a range for a particular case. We note we employ Interval and not Span. Interval quantifies the period of time between the start and end Boundaries of a Phase—what such total site duration estimates refer to—whereas Span quantifies only the period of time represented by the specific 14C dates in the dated set. Hence, unless a large and truly comprehensive set of dates, the latter will inevitably not reflect the total duration of the Phase of interest, whereas the former is trying to estimate the target period of interest.
However, as noted above, the prior assumption of a uniform distribution for the duration in fact appears less than ideal. If we have expert knowledge that the duration should be no more than 30 yr, then allowing a 50% probability for a range greater than this undervalues this prior information. The arbitrary option would be to reduce the uniform prior; for example to 0–45 yr, regarding 40 yr as the total maximum and allowing for only a possible small error on this assumption. However, better, we might instead consider a prior that gives greater weight to the expected range and then much less weight to a range beyond this. One option would be a Normal distribution, e.g. Interval(“Duration”,N(20,10)); (see Figure 3C), but probably more appropriate is a LnN distribution, e.g. Interval(“Duration”,LnN(ln(20),ln(2))); since this does not limit the upper range if, in fact, the data do turn out to indicate a longer site duration than expected. The complication in all this is of course the calibration curve. If a site dates e.g. ~1500 then it can also date around 100 yr later in the early 17th century—which is impossible if total site duration is short. Nonetheless, depending on the dataset, some runs of models will inevitably try to use such a late fit, even if it is unlikely. The control over this comes from using only model results with (i) Amodel and Aoverall values ≥60 and (ii) acceptable OxCal Convergence (C) values ≥95 for all elements. In cases of problematic model runs, one or both of these requirements will usually not be achieved.
Comparison of the results for runs of the Figure 2 model comparing: (i) the duration of time (the site Phase) from the end of the Wiggle-Match to the end of the Phase (end WM + max site Interval), and (ii) the dating probabilities for the end of site Phase Boundary (End Site 1 House A WM Boundary), for versions of the model (same 14C values as in Figure 2A) employing different priors for the Interval query constraint as discussed in the text. A and B employ the prior U(0,60), C and D employ LnN(ln(20),ln(2)), E and F employ N(20,10) and G and H employ U(0,45).

Figure 2B reruns the model in Figure 2A using the LnN Interval constraint. Of course, the exact choice, e.g. ln(15) or ln(20) or ln(25), etc., and error, e.g. ln(1) or ln(2) or ln(3), etc., is arbitrary. The aim is to anticipate a rapid rise in possible probability from 0 yr to a most likely expected duration around ~10–25 yr (the estimated modal site duration), with probability then declining rapidly afterwards, but with no actual hard upper limit. The choice of Interval(“Duration”,LnN(ln(20),ln(2))); offers a probability distribution which is similar to the available expert knowledge for the Iroquoian case (Figure 3B). Clearly, if a specific site is believed to have a shorter, or longer, duration for various reasons, then this Interval model should be adjusted. In Figure 3 we compare the use of an Interval constraint with each of the priors mentioned above, U(0,60) (Figure 3A), LnN(ln(20),ln(2)) (Figure 3C), N(20,10) (Figure 3E) and U(0,45) (Figure 3G), for the same case (using the same 14C ages found by the R_Simulate function in the Figure 2A model run).
For the second case we use both the increased resolution available from a Wiggle Match placement, even from a short tree-ring sequence, paired with a duration constraint applied via a constraint on an Interval query. We consider the following example case. There is a 30-tree-ring (i.e. years) small roundwood charcoal sample from a hypothetical site Phase dating AD 1480–1510. Ideally, this sample has evidence of bark or waney edge. Bark or waney edge are not uncommon on such samples, and, where present, the outermost ring defines human use of the sample. However, even when bark or waney edge is not recognized or present, there are still likely very few missing rings for such small roundwood samples, and so we can still regard the outermost ring as approximately defining a date within the site Phase. Either way, we can assume that ring 30 (the outermost ring) defines a point within the site Phase. This date (“L” in Figure 4) is better defined in contrast to a single 14C date because of the wiggle-match since the dates on ring 1 and ring 30 must be 29 rings (= years) apart. In addition, we can assume, based on expert knowledge, the same maximum of ~30–40 yr duration for such a site Phase as considered in the Figure 2 and 3 models. Therefore, we can model and constrain the expected overall duration of the site Phase between the start Boundary (S) and the end Boundary (E) by, for example, an Interval query using the prior of LnN(ln(20),ln(2)), as discussed above. A slightly different alternative would be to use the OxCal Difference command and the code: Difference(“D”,"E”,"S”,LnN(ln(20),ln(2))); We try two different scenarios to illustrate the range of potential cases. In the first, the charcoal sample is assumed from use (e.g. construction) in year 1 of the site (AD 1480), and, in the second, the charcoal is assumed to relate to use in year 15 of the site (renewal, expansion, in the middle of the site’s overall life-cycle). For the site Phase we have four random 14C dates on short-lived samples from the Phase. In case it is felt that the choice of the LnN prior is decisive, we also consider a simple uniform prior of 0–50 yr, which more than covers the assumed maximum site duration of <30–40 yr (see below), and even some error.
A. Example run of a model where a 30-yr charcoal sample comes from year 1 of a site Phase (e.g. construction). B. Example run where a 30-yr charcoal comes from year 15 of the site Phase (so renewal, expansion, etc.). A duration constraint prior of LnN(ln(20),ln(2)) is applied to an Interval query between Boundary S to Boundary E (see text). The site Phase dates AD 1480–1510; light magenta bar indicates the site Phase date range. 68.2% and 95.4% hpd ranges are indicated.

The basis to the maximum site duration estimates in each of these cases is a body of scholarship reviewing ethnohistoric information, and archaeological observations and calculations concerning site sustainability criteria, for sites in northeastern North America in the 15th to 17th centuries AD. As briefly noted above, this suggests that for any of the substantial and larger settlements the total site durations were only of a few decades at most. An average figure around or less than 15–20 yr is the norm (Thwaites Reference Thwaites1896–1901, 10:275, 15:153; Biggar Reference Biggar, Langton and Ganong1922–1936, 3:124; Wrong Reference Wrong1939:92; Sykes Reference Sykes1980; Fitzgerald Reference Fitzgerald1986:120), and a plausible maximum duration of about 30 yr (Fitzgerald et al. Reference Fitzgerald, Knight and Bain1995:127–131), or 40 yr (Warrick Reference Warrick1988) is evident. Snow (Reference Snow1995: 135) made a theoretical sustainability argument for some small sites potentially having longer durations. However, even so, no scholar (including Snow Reference Snow1995) has regarded any such sites having total durations beyond ca. 50–75 yr (see also Timmins Reference Timmins1997 and his analysis of the small, 0.2 ha, Early Iroquoian Calvert site)—and we are assuming in this hypothetical exercise that we are not working either with such small, or earlier, sites. The figure of <30–40 yr is a statement of the maximum single duration of a village site. Of course, a site locus could be reused over time, with intervals in-between, allowing local area regeneration and recovery (for example, this reuse model is assumed in some cases for the Mohawk Valley by Snow Reference Snow1995). Review of all such considerations leaves us with a generally accepted maximum village life-cycle estimate of around 30–40 yr (and the typical duration is considered to be less than this maximum figure, perhaps, as suggested above, with an expected modal range somewhere around 10–25 yr). However, recognizing that such numbers are of course estimates, which describe a range, and that there will always be exceptions, we tried a range of plausible, but conservative, site duration constraints in previous applications (Manning et al. Reference Manning, Birch, Conger, Dee, Griggs and Hadden2019; Manning and Hart Reference Manning and Hart2019), and regard assessing the effects of a range of values as part of any modeling experiment and investigation. In practical terms, if the constraint is made too short, it can be difficult to get a model with several site Phases to run successfully (changing curve resolution to 1 yr assists, but only so far). As noted above, here we consider also alternatives to a uniform probability prior estimate for the site durations.
The final issue we consider is application of a duration constraint by itself on a Phase. A feature noted for site Phases lying on a 14C plateau is that they tend to indicate wide (and ambiguous) possible dating ranges. The question is the effectiveness of trying to constrain such possible site Phase durations. In particular, in Manning et al. (Reference Manning, Birch, Conger, Dee, Griggs and Hadden2019) and Manning and Hart (Reference Manning and Hart2019), it seemed that this approach could offer some degree of guidance especially for ambiguous sites in the middle period of a plateau – although this was not always clear. To consider the context, we can examine the calibration curve between 1450 and 1650 (Figure 1). If we analyze the 5-yr IntCal13 dataset against itself as a set of independent 14C values placed within a Phase with an Order query applied, there are potential order inversions (because of the reversal in the calibration curve): Figure 5A. The correct calendar temporal order should see only red shaded cells above the blue line. But, for a few periods, we see contradictory values (yellow cells). Those values in bold and underlined indicate the wrong calendar order by more than 5% probability. In particular, the incorrect order occurs when comparing values from ~1490–1600 against those from the narrow time period of ~1595–1615. This age inversion is apparent in Figure 1. The simplest solution, where available, is to use a wiggle-match, even a short one, either to remove the late early 17th century possibility (Figure 2), or to rule out the 16th century (Figure 5B–D) (and see the Warminster example in Manning et al. Reference Manning, Birch, Conger, Dee, Griggs, Hadden, Hogg, Bronk Ramsey, Sanft, Steier and Wild2018). Figure 5B offers another example, employing data direct from IntCal13. With no other constraint, a set of “perfect” dates for a site dating 1600–1625 nonetheless yield a date estimate that is highly ambiguous (Figure 5C). However, incorporation of a wiggle-match element, using 3 dates over a hypothetical 31-yr sample taken from IntCal13, enables close resolution of the correct site age (Figure 5D).
A. Order analysis and probabilities for the 14C ages of the IntCal13 calibration dataset (Reimer et al. Reference Reimer, Bard, Bayliss, Beck, Blackwell, Bronk Ramsey, Buck, Cheng, Edwards, Friedrich, Grootes, Guilderson, Haflidason, Hajdas, Hatté, Heaton, Hoffmann, Hogg, Hughen, Kaiser, Kromer, Manning, Niu, Reimer, Richards, Scott, Southon, Staff, Turney and van der Plicht2013) when placed as independent elements within in an overarching Phase. If the chronological order were correct all the cells above the blue line would be red. Instead, as indicated by the yellow cells (and the corresponding red cells below the blue line), due to the reversal in the calibration curve AD 1595–1615, there is a mis-ordering especially as relates to comparisons with the AD 1595–1615 values. B. A hypothetical Site Phase comprising the IntCal13 values for AD 1600–1625 is considered. Within no additional constraint the Date estimate is entirely ambiguous (cyan histogram) either around AD 1500 or around AD 1600 for ‘Date Estimate Site NO WM’. In contrast, including the short 3-date wiggle-match on a 31-yr hypothetical wood-charcoal sample (using the AD 1565, 1580 and 1595 values from IntCal13) with the last ring setting the start Boundary for the site Phase, then the site Phase Date estimate is closely resolved around the AD 1600 possibility: magenta histogram for ‘Date Estimate Site WITH WM’. C. and D. show details of the respective site Date estimates without (C) and then with (D) the inclusion of the wiggle-match.

Without an extra constraint, like a wiggle-match, simply constraining the site Phase duration will have limited effect. As evident from Figure 5A, if the constraint is made too short, then the ambiguity remains with multiple possible ranges, e.g., around 1500 or 1600. If the constraint is too long, then it lacks any real utility. However, in-between, the order information in Figure 5A would suggest that where data comes from a site Phase spread over a period of several decades then, with the clear exception of the period around 1595–1615, one might hope in at least some cases to obtain an indication of the correct order (e.g. for the period from ~1450–1600). We consider these circumstances across four instances with data drawn from IntCal13 to consider what a “perfect” case could be. Examples 1 and 2 employ 30-yr site Phases with equal (uniform) distribution of dates across the phases of approximately a. 1448–1477, b. 1478–1507, c. 1508–1537, d. 1538–1567, e. 1568–1597 and f. 1598–1627 (and then the same +15 yr for example 2) created with the IntCal datapoints between these ages, and we determine the resultant Order information obtained for the site Phases, when placed as independent site Phases of the form:
Sequence ()
{
Boundary();
Phase ()
{
};
Boundary();
};
within an over-arching Phase, depending on applying (i) no additional constraint, and then with Interval constraints of (ii) U(0,120), (iii) U(0,80), (iv) LnN(ln(20),ln(2)) and (v) N(15,7.5) covering a range from wide/loose to tighter constraints. Examples 3 and 4 follow the same approach but employ 40-yr site Phases of a. 1448–1487, b. 1488–1527, c. 1528–1567, d. 1568–1607 and e. 1608–1647 (and then the same +20 yr for example 4). The Interval constraints in this case are (i) no additional constraint, (ii) U(0,120), (iii) U(0,80) (and U(0,100 for example 4, see below), (iv) LnN(ln(20),ln(2)) and (v) N(20,10). In all cases we use and compare the results of an Order (); query applied to the OxCal Date(); queries for each site Phase. The Date query estimates the calendar dates describing the period between the start and end Boundaries for a Phase. It is not a measure of duration (the Interval query performs this function), but it is a good description of the approximate calendar date of the modeled Phase.
RESULTS AND DISCUSSION
Wiggle-Match Samples with Additional Time Constraints
As noted above, a known time-series appears the obvious route to temporal definition on a reversal or plateau in the 14C calibration curve. Where a context of interest lies towards the end of a plateau, then a wiggle-match can occupy and rule out much of the dating probability from the earlier part of the plateau that would otherwise have created ambiguity (e.g. Manning et al. Reference Manning, Birch, Conger, Dee, Griggs, Hadden, Hogg, Bronk Ramsey, Sanft, Steier and Wild2018: fig. 2) (see Figure 5B–D). But what about the situation where the context of interest lies around the early part of the plateau? Figure 2 illustrates a hypothetical example for a site (Site 1) placed about AD 1490–1520 showing the potential difference in dating comparing with wiggle-match (WM) versus without wiggle-match instances. Here we assume a 51-yr tree-ring sample from a central post in House A at Site 1 ending in a likely complete outermost ring (waney edge, ring immediately below bark). We assume use of the timber as a post within 1 ± 1 yr of felling. A wiggle-match is run on the post’s tree-rings (numbered from ring 1 = innermost ring) 1, 11, 21, 31, 41 and 51, each spaced 10 yr apart (R_Simulate for AD 1450 … 1490 employed – thus every run of the model somewhat differs – but note that the same simulated dates from the Figure 2A model run are employed in the Figure 2B model and Figure 3 models so that all these models compare the same data). House A also produced four 14C dates on short-lived samples from its period of use (same ages used in each instance so the site date is controlled, 14C ages BP of 350 ± 20, 350 ± 20, 340 ± 20, 340 ± 20). As evident in Figures 2A and B, No WM, the four House A dates on short-lived samples, with no other constraints, offer a very wide Date estimate for the context (Blue histograms) of (overall) cal AD 1490–1625 (68.2%) or 1435–1675 (95.4%) (note: all highest posterior density, hpd, estimates are quoted in the text as rounded outwards to 5-yr increments). Even if we apply a constraint to the maximum duration of the site, for example using the LnN(ln(20),ln(2)) model above, then this alone only reduces the hpd ranges a little by removing the extremities of the above ranges (to cal AD 1495–1515, 27.4%, and 1575–1625, 40.8% at 68.2% hpd, and 1480–1525, 38.3% and 1555–1635, 57.1% at 95.4% hpd). Thus useful, but not a route to the correct specific age of about AD 1490–1520.
In contrast, with the wiggle-match and the site duration limits, we have two key constraints to apply. The wiggle-match constrains the start date (TPQ) for House A, and, since we know these sites are of short duration, we may assume a maximum period of time is possible for the House/Site context after the construction episode. We consider use of the uniform 0 to 60 yr constraint and also the LnN(ln(20),ln(2)) constraint on an Interval query – only this time there is a starting point, given the wiggle-match. As evident in Figures 2A and B, the change in dating resolution is substantial. Now House A (in the example runs shown) dates (Figure 2A) 1505–1535 (68.2%) and 1485–1545 (95.4%) and (Figure 2B) 1490–1515 (68.2%) and 1485–1535 (95.4%). It is important to emphasize in a case like this, where the possible ambiguity is to more recent ages, that the wiggle-match alone could not resolve the dating; it was the combination with the Interval constraint that created resolution. Thus the same model with no Interval constraint applied, and only the wiggle-match, usually produces a Date estimate for Site 1/House A only partly improved from the one with no wiggle-match (example run: 1485–1520, 68.2%, but 1480–1620, 95.4%) since in this case the substantial region of ambiguity is mainly to the recent side. For a context in the middle of a plateau on the calibration curve, the duration constraint will also be key; wiggle-match constraining earlier ambiguity, and the duration helping to constrain later ambiguity.
The choice of the prior for the Interval constraint is an important point as noted above. Figure 3 compares the results for the modeled Phase Interval duration and the date for the end Boundary (from the Figure 2 models) considering four different instances all using the same data (from Figure 2A). Figures 3A and B show results from a uniform prior of 0–60 yr U(0,60) (as Figure 2A), C and D show the LnN(ln(20),ln(2)) prior (as Figure 2B), E and F show a normal prior of N(20,10), and G and H show a shorter uniform prior of 0–45 yr U(0,45). All the results in this case are broadly similar; with slightly wider calendar ranges for the less precise U(0,60) prior, and more precise ranges in the other cases. Different starting data will lead to variations in results (versus those shown in Figure 3). However, the examples shown here indicate that although consideration of different priors and selection of an appropriate choice is important, in fact, given efforts in each case to describe approximately similar and short constraint periods, the various options for a prior make only relatively modest end differences.
To explore and illustrate this issue further with a real example, we reconsider Manning and Hart (Reference Manning and Hart2019) Model 2. The site Phase durations involved in this case are considered broadly to be of a similar range to the instances discussed above, but some might have been a little longer (Snow Reference Snow1995) and the available 14C dates for certain of the sites could indicate likely site durations potentially longer than a 30–40 yr maximum (Manning and Hart Reference Manning and Hart2019: Table 3). The data sets involved, which include legacy dates from several laboratories and different sample types, in addition to a set of recent AMS 14C results, further include some complicating additional noise. As a result, use of the relatively tight prior of LnN(ln(20),ln(2)), as above, does not achieve satisfactory Amodel and Aoverall values (typically Amodel = ~41 and Aoverall = ~50). (Similar issues apply to choices such as LnN(ln(20),ln(3)) or LnN(ln(20),ln(4)) or LnN(ln(25),ln(3)).) Some sites with indications of a spread of dates within their site set, in particular Getman and Otstungo, yield poor OxCal Agreement values for the Interval, and often do not achieve satisfactory Convergence values. We thus instead employ a prior that is looser to reflect and accommodate the data: LnN(ln(30),ln(3)). This can achieve satisfactory Amodel (~65) and Aoverall (~73) values with all Convergence values ≥95. If we compare the resultant Order probabilities from this model run with the results from the uniform prior models in Manning and Hart (Reference Manning and Hart2019: Table 4), we find, despite the different priors, very similar results. Figure 6 gives an example, comparing the LnN(ln(30),ln(3)) model with the 0–120 yr uniform prior example in Manning and Hart (Reference Manning and Hart2019: Table 4). As would be expected, we observe small differences (and these vary between runs of each model), but the pattern is very similar. The potential ambiguity between Cayadutta and Garoga (evident in the LnN(ln(30),ln(3)) model) was noted in Manning and Hart (Reference Manning and Hart2019), and especially as the constraint interval was shortened (Manning and Hart Reference Manning and Hart2019: Table 4).
A. Order probabilities between the site Phase Date estimates from a rerun of the Manning and Hart (Reference Manning and Hart2019) model 2 with the site Phase duration constraints changed to LnN(ln(30),ln(3)) (see text). B. Order probabilities from the U(0,120) model run as shown in Manning and Hart (Reference Manning and Hart2019: Table 4). Probabilities for t1 < t2, that is t1 is older than t2, are shown for each comparison. Values >0.5 are shaded red and in bold.

To the majority of readers, the concept of the “wiggle-match” probably implies longer multi-decadal, even centennial tree-ring samples. Usually good precision is the aim (unless the method is employed simply as a range-finder for dendrochronology: e.g. Pearl et al. Reference Pearl, Anchukaitis, Donnelly, Pearson, Pederson, Gaylord, McNichol, Cook and Zimmermann2020). However, valuable information can still be extracted from short sequences (e.g. Bayliss and Tyers Reference Bayliss and Tyers2004; Bayliss et al. Reference Bayliss, Marshall, Tyers, Bronk Ramsey, Cook, Freeman and Griffiths2017; Galimberti et al. Reference Galimberti, Bronk Ramsey and Manning2004; Hogg et al. Reference Hogg, Gumbley, Boswijk, Petchey, Southon, Anderson, Roa and Donaldson2017), and even with just two or a very few dates (of course, the more dates the more accurate and precise the wiggle-match: Galimberti et al. Reference Galimberti, Bronk Ramsey and Manning2004). Where the outermost preserved tree-ring is associated with human cutting and use (so bark or waney edge is present or close), then this date gives a specific date range for use within a site Phase. For the Iroquoian site types discussed in this paper, we further know that the site Phases are not very long. For example, we adopted the Interval constraint of LnN(ln(20),ln(2)) above for the period of time between the start Boundary and the End Boundary. Paired with the more specific date within the site Phase from the last ring of the wiggle-match, these two constraints can help better define the date of a site Phase. We employ an Interval query within the Phase as above.
Two examples for a hypothetical site dating AD 1480–1510 are shown in Figure 4. Charcoal A is a 30 tree-ring sample (and we can assume with bark or waney edge; these are found relatively regularly on what we assume likely to be a small roundwood sample). It is assumed in one case that this wood was used in the first year of the site Phase (so the building of the new village), and in the second case it is assumed to date to year 15 of the village and to renewal or expansion in about the middle of the site’s life-cycle. The outermost ring, ring 30, is placed in calendar terms by a two-date wiggle-match with a gap of 29 yr from ring 1, and must lie within the site Phase, and the site Phase is constrained by the prior. The Figure 4 example employs the prior LnN(ln(20),ln2)). Figure 7 repeats the exercise but with a uniform prior of 0–50 yr for comparison. The results are very similar. Another pair of examples for a hypothetical site mid-plateau, AD 1540–1570, are shown in Figure 8 (also assumed to be year 1 and year 15 of this site). In each instance, the modeled dates for the site Phase are by no means perfect, but they offer relatively good correspondence with the real site age and, in particular, much better estimates than the dates would in the absence of the TPQ and duration constraints. Figure 8A might, “by eye,” seem the worst case illustrated, but even there the Date estimate for the site Phase yields 1520–1565 (59.7%) and 1625–1635 (8.5%) at 68.2% hpd and 1510–1595 (77.9%) and 1615–1644 (17.5%) at 95.4% hpd. The correct date range (1540–1570) is fully within the most likely portion of the 95.4% range, and half the site range is within the most likely 68.2% range, and hence the Date estimate is broadly an accurate indicator, and so useful. To illustrate this point, Figure 9 shows Date estimates for a site Phase dating 1540–1570 with just four random 14C dates on short-lived samples (and no other constraint) from 10 example model runs. Compare these relatively widely dated estimates versus the (more constrained, if still imperfect) modeled results in Figure 8, which offer much greater resolution and a proximate association with the correct calendar period.
A. Example run of a model where a 30-yr charcoal sample comes from year 1 of a site Phase (e.g. construction). B. Example run where a 30-yr charcoal comes from year 15 of the site Phase (so renewal, expansion, etc.). Time constraint is a uniform prior of 0–50 yr, U(0,50) applied with an Interval query between Boundary S to Boundary E (see text). Site Phase dates AD 1480–1510; light magenta bar indicates the site Phase date range. 68.2% and 95.4% hpd ranges are indicated. Compare with Figure 4.

A. Example run of a model where a 30-yr charcoal sample comes from year 1 of a site Phase (e.g. construction). B. Example run where a 30-yr charcoal comes from year 15 of the site Phase (so renewal, expansion, etc.). Time constraint prior is LnN(ln(20),ln(2)) applied with an Interval query between Boundary S to Boundary E (see text). Site Phase dates AD 1540–1570; light magenta bar indicates the site Phase date range. 68.2% and 95.4% hpd ranges are indicated.

Date estimates for 10 runs of a site Phase with four random 14C dates on short-lived samples. Site dates AD 1540–1570. No other constraints are applied. Compare with the modeled results in Figure 8 showing two examples of a site Phase dating 1540–1570 also with four random 14C dates on short-lived samples but with a charcoal wiggle-match and a duration constraint applied.

It is important to note that all runs of such simulations are different. We show example runs with both satisfactory OxCal Amodel and Aoverall values (and not just highest values from a set of runs) and with Convergence values ≥95 (we highlight this last point). Depending on the selection of the R_Simulate functions in each model run, an endless variety of possible options result. We show some typical examples. Needless to say, the scale of possible ambiguity can vary, but is improved versus the situation with no additional constraints (e.g. compare Figure 9 with Figure 8).
The conclusion drawn from this case is that use of even very short (e.g. 25–30+ yr) 2-date wiggle-match samples have the potential to substantially improve chronological resolution for the AD 1480–1630 Northeast (needless to say: longer wiggle-matches will usually be more secure and better resolved: e.g. Galimberti et al. Reference Galimberti, Bronk Ramsey and Manning2004). An exception, without another constraint, is the very early 17th century, unless the wiggle-match catches the reversal in 14C values before ~1605, allowing distinction from the earlier 16th century period. As highlighted in Bayliss et al. (Reference Bayliss, Marshall, Tyers, Bronk Ramsey, Cook, Freeman and Griffiths2017), such short wiggle-matches may not always be entirely accurate. However, in the context of setting site Phase constraints, they will in nearly all cases provide useful information (see also Hogg et al. Reference Hogg, Gumbley, Boswijk, Petchey, Southon, Anderson, Roa and Donaldson2017), and the modeled outcomes are substantially more resolved and relatively accurate (meaning they nearly always include some part of the correct age range within the modeled Date estimate for a site Phase). The upcoming move to a robust single-year calibration dataset for the second millennium with IntCal20 (Reimer et al. Reference Reimer, Austin, Bard, Bayliss, Blackwell, Bronk Ramsey, Butzin, Edwards, Friedrich and Grootes2020) will also improve accuracy and precision (and will likely help alleviate some previous small inaccuracies, such as those observed in Bayliss et al. Reference Bayliss, Marshall, Tyers, Bronk Ramsey, Cook, Freeman and Griffiths2017). This approach thus offers a positive step forward versus ambiguity on a century-plus scale.
In turn, these potentials highlight the corollary: the need to acquire suitable wood-charcoal samples. It is important to affirm this need and the potential relevance and value of such wood-charcoal samples for archaeological chronologies, in addition to those samples on short-lived sample material which have become the standard focus of most archaeological 14C dating in recent years. Dates on (securely associated) short-lived samples of course have the potential to inform directly on the context of interest (Waterbolk Reference Waterbolk1970). Random charcoal with its in-built age may well be too old (Schiffer Reference Schiffer1986; Ashmore Reference Ashmore1999), although random sets of charcoal samples can nonetheless typically be assumed to offer information for the likely period of use with appropriate modeling (Bronk Ramsey Reference Bronk Ramsey2009a; Dee and Bronk Ramsey Reference Dee and Bronk Ramsey2014). But our point is that wood-charcoal (and its in-built age) securely associated with an archaeological context can act as a key dating constraint, and very particularly when the outermost ring (bark, waney edge) is present, and so should also be a focus of archaeological attention.
Up to now, the accessibility of suitable intact multi-tree-ring wood or wood-charcoal samples for detailed 14C wiggle-matching is a fortunate, but uncommon, circumstance for many Iroquoian sites. However, at the same time, it must be observed that investigators have not until now been focused on trying to identify and preserve such samples (contrast archaeologists in the American southwest). It is to be hoped that the demonstrated utility of such samples, even ones with only ~30 or ~50 tree-rings (more is of course better) in the examples above, and in studies like Manning et al. (Reference Manning, Birch, Conger, Dee, Griggs, Hadden, Hogg, Bronk Ramsey, Sanft, Steier and Wild2018, Reference Manning, Birch, Conger, Dee, Griggs and Hadden2019), will encourage those working in all pre-modern contexts to focus more closely on identifying and trying to recover potential wiggle-match samples. In northeastern North America longhouse timbers range from the relatively slender (juvenile tree stems or branches), likely lacking substantial ring counts, to larger central posts. For the latter, the diameters recorded would suggest suitable multi-decade to centennial ring counts potentially suitable for dendrochronology, and certainly radiocarbon wiggle-matching, if it is possible to successfully recover samples (see e.g. discussions, and data, in Wright Reference Wright1974, Reference Wright1995; Kapches Reference Kapches, Beck and Keefer1993, Reference Kapches and Locock1994; Creese Reference Creese, Chapdelaine, Burke and Gernigon2016). It is appreciated that recovery of preserved wood (as wood or charcoal) is sometimes a challenge in the Northeast. However, equally, there is the need for a prior focus on trying to identify such potential samples, and planning to best recover them, and their ring sequences, as central to excavation strategy. It is worth highlighting that a cross-section of such a timber need not be preserved perfectly as one solid section, but merely be securely reconstruct-able, even if recovered (carefully and fully documented in situ and subsequently) in pieces, to still potentially permit useful dendrochronology and wiggle-matching (compare e.g. Barfield et al. Reference Barfield, Manning, Valzolgher and Higham2010). Even the relevance of one poorly preserved post fragment from the Warminster site should redirect attention to all and any wood-charcoal samples with multi-decade plus ring counts that can be securely associated with such site contexts (from houses, palisades, etc.). Note: no chemical consolidant, or preservative, should be employed on such samples—ever—if radiocarbon dating is even possibly anticipated in the future.
If such a wood-charcoal sample is found, the first aim is to document the sample in situ—recording a later potential jigsaw of pieces as they were correctly assembled. Then the second aim is to keep the sample intact and with the segments in their original spatial association, while being especially mindful of retaining and protecting the outer surface (latest rings and best TPQ or potential felling date if bark or waney edge or sapwood are present). With care, wrap the sample securely in gauze bandage, and then tape around this to create a cocoon with the sample inside, before placing—with label with ID, locus and context information—in a box or protective container packed, with filling, so the sample(s) does not move around inside. Keep out of the sun, preferably in a cool location. A long ring count could permit dendrochronology. Even a few decades or more could enable useful radiocarbon wiggle-match dating which could offer key dating potential, as exploited in a range of other areas and periods (e.g. Bayliss and Tyers Reference Bayliss and Tyers2004; Galimberti et al. Reference Galimberti, Bronk Ramsey and Manning2004; Barfield et al. Reference Barfield, Manning, Valzolgher and Higham2010; Quarta et al. Reference Quarta, Pezzo, Marconi, Tecchiati, Elia and Calcagnile2010; Manning et al. Reference Manning, Griggs, Lorentzen, Barjamovic, Bronk Ramsey, Kromer and Wild2016; Hogg et al. Reference Hogg, Gumbley, Boswijk, Petchey, Southon, Anderson, Roa and Donaldson2017; Turkon et al. Reference Turkon, Manning, Griggs, Santos Ramírez, Nelson, Torreblanca Padilla and Wild2018).
What types of samples might be anticipated at Iroquoian archaeological sites in northeastern North America? Juvenile timber or branches are often employed for several elements in longhouses (Wright Reference Wright1995). This limits likely ring counts but could still easily provide sufficient for a 25–30+ yr model use (as in the models in Figures 4, 7, and 8). Further, since juvenile trees growing under the canopy—of the types Wright (Reference Wright1995: 17–19) suggests were employed for various elements in longhouses—have suppressed growth and hence narrow rings, even small diameter wood/branches can in fact include several decades of growth. Such material may often yield relatively small diameter roundwood still with bark/waney edge present. The main vertical posts in longhouses, however, could include older, mature, trees. Wright (Reference Wright1995: 17) regards Thuja occidentalis L., eastern white cedar, as the likely preferred choice where available—since it “is exceptionally rot-resistant in soil” (Warrick Reference Warrick1988; Wright Reference Wright1995: 18; see Bouslimi et al. Reference Bouslimi, Koubaa and Bergeron2013: 4735–4736)—and this species is widespread in the region and long-lived (Johnston Reference Johnston, Burns and Honkala1990). If we use this species as the example, Thuja occidentalis L. typically begins with a period of suppressed growth, before a release, followed by notably fairly even on-going growth (Hofmeyer et al. Reference Hofmeyer, Kenefic and Seymour2010). Based on one study, trees typically reached smaller “post” diameter (~12.7 cm diameter) between 28–171 yr of age, mean 96 yr, and large post/saw-timber diameter (22.9 cm) between 54 to 238 yr of age, mean ~140 yr (Hofmeyer et al. Reference Hofmeyer, Kenefic and Seymour2010). Thus, if recovered, there is clearly considerable dendrochronological and/or wiggle-match potential.
Duration Constraints on a Plateau
The final modeling circumstance considered is the potential effectiveness of a duration constraint in isolation for, even slightly, better defining radiocarbon dating on a plateau. We compare Order resolution using four sets of example site Phases employing data drawn from IntCal13: Figure 10. If the Order analysis finds the correct site temporal order with probability >50%, then all the comparison cells in the grids above the orange diagonal line should be gray. Gray cells below the orange line indicate an incorrect Order finding. For the approximately 30-yr site Phase duration cases (Examples 1 and 2) the correct order is indicated in 80–93% of instances and the two uniform probability prior constraint instances, (ii) and (iii), (slightly) increase the correct probabilities versus the no constraint instance (i). The LnN(ln(20),ln(2)) and U(15,7.5) constraints, (iv) and (v), actually achieve a slightly worse result than the no constraint instance in 2 of 4 cases. In all but one instance, Example 2 (v), the final site Phase period (f) of either 1598–1627 or 1613–1643 is mis-ordered. In Example 2 the penultimate site Phase period (e) of 1583–1612 is also mis-ordered. The common issue is when the site range includes the period from about 1595–1620 (compare Figure 5). For the approximately 40-yr site Phase duration cases (Examples 3 and 4) the correct order is indicated in 90–100% of cases except Example 4 (v) which is only 80% correct. The use of a site Phase duration constraint usually achieves a (slightly) better probability indication than the no constraint instances. The slightly longer site Phase appears to increase the prospects of a correct order indication. The site Phase that includes the entire 1595–1620 range is problematic when a shorter/tighter constraint is used (Example 4 (iv) and (v)).
Schematic representation of the four example Order analyses using groups of values from IntCal13 for (Examples 1&2) six 30-yr site Phases and (Examples 3&4) five 40-yr site Phases, and applying (i) no Interval constraint, (ii) a U(0,120) Interval constraint, (iii) a U(0,80) Interval constraint (except for Example 4 (iii) where it is a U(0,100) Interval constraint because constraints of U(0,80) or U(0,90) usually failed to achieve satisfactory Convergence values ≥95), (iv) a LnN(ln(20),ln(2)) Interval constraint and (v) a N(15,7.5) Interval constraint for Examples 1&2 and a U(20,10) Interval constraint for Examples 3&4, as described in the text. The correct order would see all the cells above the orange lines shaded gray.

Overall, these examples suggest that for the period not including around 1590–1620 especially, use of an Order analysis can potentially yield accurate indications, and use of various case-appropriate site Phase duration constraints can slightly improve such resolution. In turn, these order indications—noting caveats below—can be used to place the set of relevant site Phases into a proposed ordered series for a Sequence analysis which enables much greater chronological resolution (e.g. Buck et al. Reference Buck, Litton and Smith1992; Bronk Ramsey Reference Bronk Ramsey1995: 426–428). It must be noted, however, that probabilities are often less than decisive, and even with the Interval constraints applied they only rise slightly (see also Manning and Hart Reference Manning and Hart2019: Appendix S1). For example, the comparisons with an “X” in Figure 10 indicate where the probability is >50% but less than 55%. This includes almost 10% of the correct order indications. It also includes 47% of the incorrect order findings in Figure 10, suggesting that the incorrect order results are only marginal in almost half such cases. The situation highlights that such Order findings are many times best seen as indicative. The addition, where possible, of extra constraints, such as a wiggle-match on a wood-charcoal sample (see above), is thus desirable.
CONCLUSIONS
Dating across the period of a plateau in the 14C calibration curve inherently introduces challenges. However, allied with the ability to achieve much more precise 14C dates on small (e.g. annual plant matter, or single or few tree-rings) samples using modern AMS 14C dating, Bayesian approaches provide for a range of solutions. As shown in much work from the past three decades, where a known sequence is available, whether from a tree-ring series, stratigraphy, or historical information, good to at least reasonable resolution can be achieved (classic Sequence analysis). Cases lacking stratigraphic (or other) informed sequences remain more difficult. We considered in hypothetical terms the AD 1480–1630 reversal/plateau and the case of the relatively short duration Late Woodland village sites of northeastern North America. Here, despite the absence of stratigraphic sequences, we illustrated that use of even short tree-ring sequences from wood-charcoal samples paired with conservative ethnographically appropriate duration constraints could provide additional constraints to afford much greater chronological resolution. In addition, plausible culturally appropriate duration constraints by themselves can sometimes usefully assist temporal resolution. Where possible, the addition of a wood-charcoal wiggle-match enhances such resolution, which can in turn then be employed for a Sequence analysis. Contexts which date around the late part of the plateau on the 14C calibration curve are especially problematic for duration constraint resolution. Here additional constraining information is necessary to achieve resolution—for example through inclusion of a wiggle-match from a wood charcoal sample. Our overall conclusion is to highlight the potential value of even short wiggle-matches on wood charcoal samples with as few as ~25–30+ tree-rings. Such material forms a category of evidence which has been under-exploited in work to now. There is considerable potential to resolve and refine archaeological chronology across plateau periods using such samples (and more so when the finer structure of IntCal20 becomes available), in particular, when paired with an additional set of data and a second constraint.
ACKNOWLEDGMENTS
We thank the organizers of the Radiocarbon & Archaeology Symposium at the University of Georgia. We thank the anonymous reviewers for their very useful and constructive comments and suggestions. This work was conducted in the context of the Dating Iroquoia project, and we gratefully acknowledge support from the National Science Foundation, award BCS 1727802.
Supplementary material
To view supplementary material for this article, please visit https://doi.org/10.1017/RDC.2020.51


 Open access