




1. Biological rhythms as generative musical structures
Music is a hidden arithmetic exercise of the soul, which does not know that it is counting.
—Gottfried Wilhelm von LeibnizBiological rhythms – whether measured in heartbeats, plant electrophysiology or neural oscillations – harbour rich, self-organising structures that offer profound artistic potential (Oliveira Reference Oliveira and Brooks2024). This paper proposes that the harmonic architecture of brain–body oscillations (HABBOs), rooted in the principles of harmonicity found in both human biological rhythms and musical systems, provides a scientifically-informed foundation for musical exploration. We discuss technological innovations that open up opportunities within this realm, especially expanding real-time applications driven by brain dynamics.
The concept of harmonicity, tracing back to Pythagoras’ exploration of integer ratios in vibrating strings, has been observed across various natural phenomena, including DNA structures, ion motion, electron wave functions and vocal resonances (Schrödinger Reference Schrödinger1926; Qi and Hillman Reference Qi and Hillman1997; Lewicki Reference Lewicki2002; Köster Reference Köster2009; Joshi et al. Reference Joshi, Fabre, Maier, Brydges, Kiesenhofer, Hainzer, Blatt and Roos2020; Petoukhov et al. Reference Petoukhov, Petukhova and Svirin2021). This universality underscores the self-organising capacities of physical and biological systems and their potential to inform creative processes.
By positioning biological rhythms as generative musical structures, this work extends traditional approaches in ubiquitous music (ubimus) and creative biofeedback, offering novel pathways for embodied artistic practices (Weiser Reference Weiser1991; Wanderley and Orio Reference Wanderley and Orio2002; Magnusson Reference Magnusson2009). While ubimus has traditionally focused on the role of technology in participatory and context-aware music-making, our approach emphasises the creative potential of harmonic structures within neural dynamics (Sethares Reference Sethares2005; Chan et al. Reference Chan, Dong and Li2019), highlighting the body’s role as an interactive element in a broader musical ecosystem (Magnusson Reference Magnusson2009). Grounded in neurophenomenology of music (Lloyd Reference Lloyd2013; Schiavio Reference Schiavio2014) and informed by recent advances in signal processing techniques, this paper develops computational methods to identify harmonic patterns in electrophysiological signals, translating them into adaptive tunings and chord progressions (Klimesch Reference Klimesch2018; Young et al. Reference Young, Hunt and Ericson2022).
Harmonic analysis of biosignals enables the exploration of isomorphisms (i.e., similarities in form) (Greer and Harel Reference Greer and Harel1998), between the body’s harmonic patterns and musical systems, providing solutions to generate auditory feedback that captures the oscillatory properties of human physiology (Bidelman and Krishnan Reference Bidelman and Krishnan2009; Lee et al. Reference Lee, Skoe, Kraus and Ashley2015). It further supports the development of adaptive biofeedback tools that dynamically align with the body’s natural musicality (see Figure 1). This contribution extends the scope of ubimus by emphasising the body’s endless source of natural harmonies, offering a medium to cultivate embodied creativity.
Schematic representation of a brain–computer interface, constituting an isomorphism between domains of sounds and brain electrophysiology. The system integrates harmonic analysis and harmonic audification within a closed-loop process. Brain activity is analysed for its harmonic structure, which is then used to generate auditory feedback through harmonic audification. This feedback is designed to reflect the user’s neural dynamics, creating a bidirectional flow of information between the brain and the computer interface. The isomorphism consists in the structural similarity between the brain’s harmonic patterns and the resulting sensory feedback.

This article examines how harmonic structures in biosignals can inform the design of creative brain–computer interfaces (cBCIs). By integrating principles from music theory, neuroscience and signal processing, we develop methods to identify and model harmonic patterns in brain–body oscillations. We apply these methods to enable new compositional and improvisational workflows in which biosignal harmonic structure directly shapes tuning, harmony, and form.
We address three central questions:
-
1. What is the functional role of nested harmonic structures in brain/body dynamics?
-
2. How can the harmonic structures of biological signals be identified and sonified through adaptive musical systems?
-
3. How can real-time feedback loops based on bioharmonic modelling both modulate lived experience and lead to novel musical structures?
To address the first question regarding the functional role of harmonicity, we highlight how this principle underpins auditory perception, biological organisation and resonance in complex systems, supported by a neuronal model of consonance and theories linking harmonic structures to physiological coordination and state transitions. Turning to the second question on identification and sonification, we present tools for analysing HABBOs, deriving adaptive tuning systems and tracking transitional harmony in biological signals. This includes the introduction of both the Biotuner Archive, documenting aesthetic outcomes of the toolbox, as well as the Biotuner Engine, a user-friendly web application that enables intuitive generation of tuning systems from time-series data. Finally, addressing the third question on real-time feedback and phenomenology, we explain how these methods could guide the development of cBCI (see Figure 1), transforming real-time neural activity into adaptive soundscapes. We explore how this modelling of bioharmonicity can drive experientially meaningful transformations of the musical output, concluding with a discussion on transdisciplinary implications, ranging from social neuroscience to cross-species interactions and the design of creative cyber-ecosystems.
2. Historical context: from musical harmony to dynamical systems
2.1. The origins of harmony in music
Accounts of musical consonance trace back to Pythagoras, who postulated that the consonance of musical intervals is determined by the simplicity of their frequency ratios (Ferguson Reference Ferguson2011). Euler proposed a system grading chord aesthetics based on the least common multiple of the notes (Euler Reference Miranda2006), while harmonicity of specific scales has been quantified using the averaged similarity between each pair of notes and the natural harmonic series (Gill and Purves Reference Gill and Purves2009). Historically, two main schools of thought have shaped our understanding of harmony. The Pythagorean school emphasises temporal features, deriving consonance from wavelength ratios. In contrast, the Helmholtzian school adopts a psychoacoustic lens, emphasising the role of spectral features in auditory harmony. Helmholtz introduced the notion of beating frequencies, denoting the perceived amplitude modulations resulting from the interaction of two closely spaced frequencies, where increasing modulation frequency leads to perceived discordance – at least up to around 20 Hz of beating frequency, beyond which the tones are perceived as two distinct notes (Rasch Reference Rasch1984).
Bridging these viewpoints, Chan et al. (Reference Chan, Dong and Li2019) offered a holistic model of harmony, encapsulating stationary and transitional aspects through inter-harmonic and subharmonic modulations. They demonstrated that such modulations could account for both perceptual tension–resolution and computational harmony statistics, reconciling the Helmholtzian and Pythagorean paradigms. Their contributions pave the way for mathematical frameworks of transitional harmony, aimed at computing tension–resolution trajectories.
Building on harmonic structures, musical tuning systems – dividing octaves into sets of frequency ratios – have evolved to balance harmonicity with practical performance needs. The Pythagorean scale, rooted in the 3/2 ratio (the fifth), expresses harmony through integer ratios in the form of 2q3p. Just intonation refined this system by incorporating the prime 5, yielding ratios of the form 2q3p5r, for example simplifying the Pythagorean major third from 81/64 to 5/4. (Fauvel et al. Reference Fauvel, Flood and Wilson2003). However, these tuning systems, dominant until the 18th century, struggled to accommodate key changes, significantly slowing the evolution of new musical genres. Equal temperament resolved this by dividing the octave into 12 equal steps, each corresponding to a frequency ratio of 21/12, enabling transposition at the cost of interval accuracy (Barbour Reference Barbour1947).
More recently, computers revolutionised musical tunings by enabling dynamic adjustments for precise intervals without sacrificing transposition (Sethares Reference Sethares1994, Reference Sethares2002). This computational capability has inspired innovative tuning methods, such as the dissonance curve and harmonic tuning, often explored in microtonality and diverse cultural contexts (Werbock Reference Werbock2011; Benetos and Holzapfel Reference Benetos and Holzapfel2015; Ader Reference Ader2020).
Sethares (Reference Sethares2005) connected timbre (i.e., the unique quality of a sound, defined by its harmonics) to tuning. The dissonance curve, rooted in Helmholtz’s beating frequencies concept, maps perceived dissonance across ratios, aligning timbre and tuning. For example, a flute’s harmonic spectrum yields simple ratios – and therefore a corresponding tuning close to just intonation – while a bell’s inharmonic spectrum reflects complex ratios – and therefore inharmonic tuning. This approach allows perceptually dissonant intervals to become consonant when matched to a compatible timbre, making it a valuable tool for deriving adaptive tuning systems from brain signals.
Complementing this timbre-based approach, harmonic (overtone-derived) tunings establish frequency ratios within the unison (1:1) and octave (2:1) range by iteratively dividing harmonic positions, for example, 3:1 or 5:1, by 2 n , where n represents the number of octaves. This process uncovers simple ratios inherent in classical tunings, as illustrated by the 8th Octave Overtone Tuning, which spans 128 harmonics across 8 octaves (Reinhard Reference Reinhard2011).
These methods, based on spectral morphology and harmonic positions, offer bridges between musical formalism and biological rhythms. Beyond providing tools for constructing EEG-informed tunings, we suggest that these musical formalisms offer a novel lens for characterising the harmonic organisation of brain dynamics.
2.2. Unveiling musical structure in dynamical systems
Before investigating harmonicity in brain dynamics, it is essential to consider prior efforts exploring dynamical systems in music composition. Recent advancements have leveraged the potential of simulated nonlinear dynamics, inspiring novel generative music systems.
Bell and Gabora (Reference Bell and Gabora2016) developed a generative musical algorithm operating ‘at the edge of chaos’, using hierarchical scale-freeFootnote 1 topologies to produce highly creative outputs. As musical genres often exhibit scale-free behaviours (Levitin et al. Reference Levitin, Chordia and Menon2012), such systems open pathways to deconstruct conventional musical formalisms. Similarly, ecosystem-based generative music (Bown Reference Bown2009) and meta-generative approaches (Dahlstedt Reference Dahlstedt2009), both relying on evolutionary algorithms that simulate adaptation and interaction within multi-agent systems, use statistical properties of these agents’ nonlinear behaviours and ecological dynamics to generate complex, evolving musical outputs.
Project Santiago integrates biologically inspired neuron models with interactive music generation by mapping neural activity, including spikes and firing rates, to musical events such as notes and sound parameters (e.g., pitch, duration, intensity). This real-time system leverages the intrinsic dynamics of individual neurons and their network connectivity to produce complex, evolving sonic structures that maintain a cohesive interaction across temporal and musical scales (Kerlleñevich et al. Reference Kerlleñevich, Riera and Eguia2011). Complementing these algorithmic approaches, Trulla et al. (Reference Trulla, Stefano and Giuliani2018) revealed that the dynamical fingerprints of consonance and dissonance can be recovered directly via Recurrence Quantification AnalysisFootnote 2 on continuous glissandi, suggesting a universal, data-driven framework for harmony grounded in dynamical systems theory.
Building on this line of work, we propose advancing algorithmic music systems by integrating real-time biosignal processing, particularly from the human brain. By mirroring the unfolding of harmonic structures in these neural dynamics, we create adaptive musical experiences that evolve in synchrony with human phenomenology (i.e., of auditory perception, at least).
3. Models and theories of brain harmonicity
To understand the functional role of nested harmonic structures in brain dynamics, we examine how the harmonic architecture of neural signals can describe cognitive and phenomenological states. We frame this discussion within three contexts: (1) auditory perception, (2) multiscale biological organisation and (3) resonance in complex systems. We wish to emphasise that using brain harmonicity patterns in artistic practices not only translates biological harmonies into music but also defies the idea that only static isomorphisms are present between the internal states of a biological organism and the sensory inputs it processes (Lloyd Reference Lloyd2013). Hence, integrating the harmonicity of brain dynamics into BCIs can potentially generate insights for exploring the interconnection between phenomenology and brain dynamics through real-time feedback loops.
3.1. Neuronal model of consonance
To extract musically relevant features from HABBOs, auditory processing of stimuli offers a meaningful lens through which we can examine the connections between auditory sensory input and the corresponding brain signals. The auditory system, with its finely tuned ability to process harmonic structures in sound, provides a natural example of how external harmonic stimuli are translated into neural patterns. This translation process reveals isomorphisms – or structural similarities – between the organisation of sensory inputs, such as musical tones, and the patterns of neural activity they evoke. By studying these parallels, we can uncover how harmonic relationships in sound are mirrored in the brain’s dynamic responses, providing a foundation for exploring harmonicity within neural processes. To clarify these structural parallels, Figure 2 presents a visual glossary aligning key concepts between neuroscience and music theory.
Visual Glossary: Neuroscience & Music Parallels. A comparative illustration of the candidate structural isomorphisms between spectral representations of electrophysiological signals and harmonic representations in music theory. The figure aligns key concepts: (1) spectral peaks in the power spectrum correspond to harmonic partials in sound, (2) frequency ratios between neural oscillations mirror musical intervals, (3) the PSD shape (spectral envelope) is analogous to timbre and (4) ratio folding (nested biological oscillations) functions as the mathematical equivalent of octave equivalence.

A neuronal model of consonance highlights the role of the brainstem and primary auditory cortices in processing auditory stimuli (Bidelman and Krishnan Reference Bidelman and Krishnan2009; Lerud et al. Reference Lerud, Almonte, Kim and Large2014). It aligns with evidence of the brain’s sensitivity to musical pitch relationships (Fritz et al. Reference Fritz, Jentschke, Gosselin, Sammler, Peretz, Turner, Friederici and Koelsch2009) and the encoding of consonant and dissonant intervals through phase synchronisation between stimulus and frequency-following response (FFR) – a sustained neural response in the brainstem that reflects the temporal and spectral properties of sound (Bidelman and Krishnan Reference Bidelman and Krishnan2009; Lee et al. Reference Lee, Skoe, Kraus and Ashley2015). Neural synchrony, reflecting the periodicity of musical intervals, is central to auditory processing (Boomsliter and Creel Reference Boomsliter and Creel1961; Lots and Stone Reference Lots and Stone2008) and has been shown to be stronger for consonant intervals compared to dissonant ones (Langner Reference Langner1992; Bones et al. Reference Bones, Hopkins, Krishnan and Plack2014, suggesting that consonance perception may arise from neural synchronisation (Lots and Stone Reference Lots and Stone2008).
A key question remains: does neural encoding of musical intervals merely mirror acoustic properties, or are nonlinear modulatory processes involved? Studies reveal nonlinear FFRs in the brainstem and auditory cortex (Galbraith Reference Galbraith1994; Pandya and Krishnan, Reference Pandya and Krishnan2004; Purcell et al. Reference Purcell, Ross (ß), Picton and Pantev2007; Lee et al. Reference Lee, Skoe, Kraus and Ashley2009), driven by mode-locking,Footnote 3 where periodic stimuli interact with neural oscillations to produce n:m locked cycles (Lerud et al. Reference Lerud, Almonte, Kim and Large2014). This supports the idea that low-order integer frequency ratios underpin consonance as a principle of stability in oscillatory systems (Heffernan and Longtin Reference Heffernan and Longtin2009; Klimesch Reference Klimesch2018). Hence, consonant and dissonant intervals predict brainstem FFRs, with consonant intervals prominently eliciting common subharmonics in FFR, interpreted as a physical manifestation of the missing fundamentalFootnote 4 (Lee et al. Reference Lee, Skoe, Kraus and Ashley2015). In contrast, dissonant intervals evoke a higher number of nonlinear resonances, indicating increased neural complexity. Musicians, compared to non-musicians, exhibit greater nonlinearity in interval encoding, reflecting neural plasticity and subjective expertise in musical perception (Lee et al. Reference Lee, Skoe, Kraus and Ashley2009, Reference Lee, Skoe, Kraus and Ashley2015).
These findings highlight the brain’s capacity for nonlinear processing, where neural ‘filling-in’ mechanisms (Bregman Reference Bregman1994; Varela, Reference Varela1999; Cervantes Constantino and Simon, 2017) associated with ambiguous sound perception might shape the tension–resolution patterns characteristic of musical progressions. Collectively, these insights underscore that consonance and dissonance are encoded in the brain through phase synchronisation, mode-locking, and nonlinear dynamics. This highlights a deep connection between musical perception and oscillatory brain dynamics, suggesting that the coordination of frequencies in brain–body oscillations provides a fertile ground for exploring novel musical structures as much as their corresponding experiential dimensions.
3.2. Theories of harmonicity in brain dynamics
Two complementary theories, the Binary Hierarchy Brain–Body Oscillation theory (which proposes HABBOs) and the General Resonance Theory of Consciousness (GRTC), suggest that harmonic relationships in brain dynamics not only underlie auditory perception but also support physiological coordination and brain state transitions with corresponding shifts in lived experience.
The Binary Hierarchy Brain–Body Oscillations theory (Klimesch, Reference Klimesch2018) emphasises the role of phase synchronisation and harmonicity, particularly binary (2:1) frequency ratios, in coordinating physiological systems and cognitive processes across timescales (Klimesch Reference Klimesch2013). This framework draws a compelling parallel to octave-based musical structures, where frequency doubling or halving creates harmonious relationships. Similarly, these binary ratios in neural dynamics minimise spurious synchronisation and enhance communication across distinct frequency bands, supporting efficient integration of brain processes. Klimesch further emphasizes that the architecture is shaped by principles of optimal phase decoupling to reduce interference between frequency domains. Ratios near the golden mean (≈1.618) are proposed to support maximal separation between oscillatory bands. Empirical evidence further supports this theory, showing that EEG harmonic frequency ratios dominate during alert states, while non-harmonic ratios prevail during sleep (Rassi et al. Reference Rassi, Dorffner, Gruber, Schabus and Klimesch2019). Cross-frequency coupling (CFC) techniques,Footnote 5 such as phase-amplitude coupling (PAC) and cross-frequency synchrony (CFS), are instrumental in studying how neural frequencies interact to coordinate brain processes at multiple scales (Lisman and Idiart Reference Lisman and Idiart1995; Jensen and Colgin Reference Jensen and Colgin2007; Hyafil et al. Reference Hyafil, Giraud, Fontolan and Gutkin2015). These methods highlight the importance of harmonic relationships in integrating and regulating distributed neural activity, while recent advances have improved the ability to distinguish genuine coupling from spurious effects caused by non-sinusoidal rhythms (Idaji et al. Reference Idaji, Zhang, Stephani, Nolte, Müller, Villringer and Nikulin2022).
Building on these observations of cross-frequency coordination, the GRTC (Hunt et al. Reference Hunt, Schooler and Lane2019) proposes that harmonic interactions among neural oscillators underlie the integration processes that give rise to unified conscious experience. It posits that resonance among coupled oscillators creates nested harmonic structures, optimising energy and information flow for inter- and intra-system coherence (Young et al. Reference Young, Hunt and Ericson2022). GRTC suggests that the harmonic architecture of spontaneous neural activity encodes information about state transitions, with the slowest shared resonance serving as an indicator of subsystem communication (Hunt Reference Hunt2020; Young et al. Reference Young, Hunt and Ericson2022). In this account, networks of coupled oscillators operate near criticality,Footnote 6 balancing stability and adaptability (O’Byrne and Jerbi Reference O’Byrne and Jerbi2022), with local resonances potentially driving phase transitions in brain state dynamics. Temporal structures in brain activity, as revealed through rhythmic and harmonic patterns in fMRI studies, provide a foundation for understanding how the brain constructs a world that is simultaneously stable and dynamic, resembling the temporal nature of music (Lloyd Reference Lloyd2020).
HABBO and GRTC converge on the role of harmonic structures as markers of physiological and conscious states. While HABBO emphasises binary harmonic ratios for coordination across scales, GRTC situates these harmonic dynamics within the framework of conscious state transitions. Collectively, these theories offer a robust framework for connecting neural harmonicity to the design of adaptive musical systems. In the following sections, we explore how these theoretical insights inform new sonification techniques and guide the development of real-time feedback systems grounded in harmonic audification.
4. From classical brain sonification to harmonic audification
Sonification is defined as the transformation of data relations into perceptible patterns in acoustic signals, with the primary purpose of facilitating communication or interpretation (Kramer et al. Reference Kramer, Walker, Bonebright, Cook and Flowers2010). It can also serve expressive and artistic purposes by revealing the aesthetic potential of data through sound. It has sparked collaboration among musical composers and scientific researchers from various disciplines, inviting for works increasingly mediated by computational and generative systems (Helmuth and Schedel Reference Helmuth and Schedel2022). In the context of brain signals, sonification involves converting neural patterns into sounds that might offer insights into brain dynamics and functions. This section outlines established sonification techniques, presents a novel approach termed ‘harmonic audification’ and discusses its potential implications and applications.
Brian sonification’s challenge lies in balancing the inherent constraints of data with the versatility of sound (Grond and Hermann Reference Grond and Hermann2012). The chosen sonification technique can largely be influenced by the nature of the data structure (Campo Reference Campo2007). Several methods have been employed over the years (Väljamäe et al. Reference Väljamäe, Holland, Marimon, Benitez, Mealla and Oliveira2013):
-
1. Audification: A direct translation of EEG signals into audible content, resulting in soundscapes resembling pink noise due to the inverse relationship between frequency and power characteristic of physiological signals (Adrian and Matthews Reference Adrian and Matthews1934; Pritchard and Duke Reference Pritchard and Duke1992).
-
2. Parameter Mapping: EEG features are mapped directly onto synthesis parameters (Campo Reference Campo2007).
-
3. Model-Based Sonification: EEG features drive sound synthesis model (often physics-/process-inspired), yielding an indirect auditory display of the data (Halim et al. Reference Halim, Baig and Bashir2007).
-
4. Generative Music: EEG features drive music-generating rules/structures (e.g., scale/harmony/rhythm constraints) to produce organized musical output. For instance, EEG band power can modulate rule-based composition processes (Miranda Reference Miranda2006).
While traditional sonification techniques offer valuable insights, there is a burgeoning interest in exploring the harmonic structures of brain signals (Klimesch Reference Klimesch2018; Young et al. Reference Young, Hunt and Ericson2022), particularly as a way to preserve a closer isomorphism between signal structure and perceived sound. We propose ‘harmonic audification’ as a method that employs harmonic analysis of biosignals to create adaptive musical structures. Unlike traditional methods that might focus on direct translations or mapping specific neurocognitive markers onto predetermined musical rules, this technique seeks to preserve the signal’s inherent musicality by modelling interdependencies among frequency components over time, thereby reflecting their integrated functions.
The process of harmonic audification enables the creation of auditory perceptions aligning with brain signals in terms of harmonic content. It incorporates elements of pitch, rhythm and timbre, coupled with adaptive tuning systems, to present a more detailed and integrated auditory portrayal of brain dynamics. Harmonic audification, with its emphasis on capturing the nuanced harmonies of biosignals, allows not just an auditory experience but potentially a deeper understanding of the brain and its associated phenomenology.
5. Methodology: musical systems derived from neural dynamics
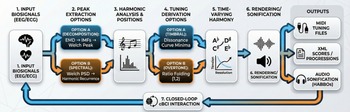
To address how biological harmonic structures can be identified and sonified, this section outlines a computational pipeline for transforming neural dynamics into musical forms. We first demonstrate two distinct methods for extracting spectral peaks – Empirical Mode Decomposition (EMD) and Harmonic Recurrence – which serve as the foundation for our analysis. Next, we illustrate how these spectral features can be translated into adaptive tunings based on harmonic positions. We further introduce two techniques for capturing the temporal evolution of brain harmonicity: generating spectral chords and quantifying subharmonic tension between successive spectral states. Finally, to support practical use beyond the present analyses, we implement this pipeline in the Biotuner Engine, a web interface for generating tunings and harmonic outputs from time-series data. To facilitate navigation through these technical steps, a schematic reader’s guide summarising the full harmonic audification pipeline is provided in Figure 3. To demonstrate the computational pipeline on real biological signals (rather than synthetic waveforms), we applied these methods to a representative segment of EEG data (ethically approved, blinded). These data serve strictly as a proof-of-concept input to visualise the algorithmic steps and do not constitute an empirical study of the specific cohort.
Reader’s Guide: The Harmonic Audification Pipeline. A schematic overview of the methodology for transforming physiological oscillations into creative harmonic biofeedback. The pipeline outlines the progression from input biosignals (1) through peak extraction (2) and harmonic analysis (3). It details the derivation of adaptive tunings (4) using timbral (dissonance curve) or overtone (ratio folding) methods, followed by the analysis of time-varying harmony (5). The final stage involves rendering and sonification (6), producing outputs such as MIDI tunings, XML scores and audio that drive the closed-loop creative brain–computer interface (cBCI) interaction (7).

5.1. Computation of spectral peaks in the framework of harmonic analysis
Traditional methods of frequency analysis in neuroscience categorise brain rhythms into fixed frequency bands (delta, theta, alpha, beta, gamma) based on empirical evidence (Berger, 1929; Teplan Reference Teplan2002; Cohen Reference Cohen2017). While effective, these static boundaries fail to capture dynamic shifts in brain rhythms, such as under altered states of consciousness, where alpha peak frequencies can deviate significantly from the standard 8–12 Hz range (Mierau et al. Reference Mierau, Klimesch and Lefebvre2017).
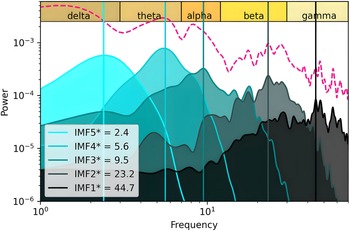
EMD offers a data-driven alternative by decomposing signals into intrinsic mode functions (IMFs)Footnote 7 through a sifting procedureFootnote 8 (Rilling et al. Reference Rilling, Flandrin and Goncalves2003). Acting as a dyadic filter bank, EMD isolates components in a log2 relationship, aligning with octave-based models of brain oscillations (Klimesch Reference Klimesch2018) (see Figure 4). Recent studies using EMD in MEG analyses highlight its precision over traditional time-frequency methods (Skiteva et al. Reference Skiteva, Aleksandr, Vadim, Denis and Boris2016). By computing the Welch transformFootnote 9 on each IMF and identifying frequency peaks with maximal power, EMD reveals a detailed spectral hierarchy suited for analysing HABBOs.
Peaks extraction based on Empirical Mode Decomposition (EMD). Power spectrum density plot of five intrinsic mode functions (IMF; blue) and global signal (pink). The bin with maximum power is selected as a peak and compared to classical frequency bands: Delta (1–3Hz), Theta (3–7Hz), Alpha (7–12Hz), Beta (12–30Hz), Gamma (30–60Hz). Stars (*) beside IMFs in the legend mean that the peak falls within classical frequency band.

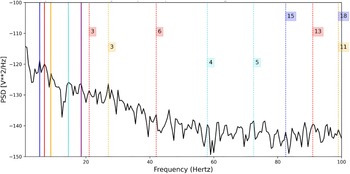
We propose a complementary approach, termed harmonic recurrence, which identifies spectral peaks by analysing their recurrence within the harmonic series of the signal. Using the Welch transform, this method extracts all spectral peaks and compares their harmonics across the spectrum. Peaks with the highest recurrence – those whose harmonics overlap with other peaks – are selected, reflecting their embeddedness across spectral scales. This method also quantifies inter-harmonic concordance, capturing alignment between harmonics of distinct peaks (e.g., Figure 5).
Peaks selection using harmonic recurrence method. Welch transform has been computed on a single time series to derive the power spectrum density. Then, peaks are identified using scipy find_peaks. A pairwise comparison is done to determine if a peak is a harmonic of another. Selected peaks (solid lines) are peaks having the highest number of harmonics (dashed lines) as other peaks of the spectrum. Numbers on dashed lines correspond to the harmonic positions. Hence, the blue peak has its 15th and 18th harmonics as other peaks, the yellow peak has its 3rd and 11th harmonics as other peaks, while the 11th harmonic of the yellow peak and the 18th harmonic of the blue peak coincide.

The harmonic recurrence approach is inspired by the harmonic product spectrum,Footnote 10 a pitch-tracking method that identifies recurrent peaks across downsampled versions of the same signal (Sripriya and Nagarajan Reference Sripriya and Nagarajan2013). By focusing on harmonic alignment and embeddedness, this method provides a nuanced view of spectral architecture, enabling the identification of key frequencies that resonate across multiple scales. Together, EMD and harmonic recurrence offer robust, data-driven frameworks for analysing HABBOs, laying the groundwork for exploring how brain oscillations reflect physiological rhythms and inform adaptive musical systems.
5.2. Neural tunings as embedding of brain harmonic structures
EEG spectral peaks and their associated frequency ratios reflect both functionally and musically relevant information that can be used to derive tuning systems. We apply two methods to derive tunings from brain spectral peaks and amplitudes.
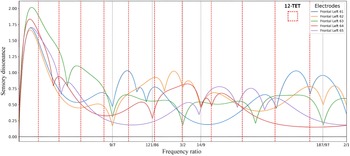
Building on Sethares’ demonstration of the isomorphism between timbre and tuning (Sethares Reference Sethares2005), dissonance curves are derived from brain spectral peaks and their amplitudes, features that can be understood as the brain’s spectral signature, functionally analogous to musical timbre. Dissonance values are calculated for every pair of peaks, representing how harmonicity varies across frequency ratios. The resulting curve highlights dissonance changes over a range of intervals, allowing identification of local minima that correspond to consonant tunings. Figure 6 illustrates dissonance curves from EEG sensors in the occipital region, with local minima compared to the 12-step equal temperament (12-TET). Notably, shared minima, such as the ratio 9/7 across multiple sensors, indicate converging harmonic structures. These curves reveal tunings reflective of the signal’s timbral structure, serving as a creative tool for musical exploration.
Dissonance curves from multiple EEG electrodes. Each coloured line corresponds to the dissonance curve of one electrode based on spectral peaks derived using EMD. Grey and red vertical lines represent the dissonance local minima shared between at least two EEG dissonance curves and of 12-TET equal temperament, respectively.

Another approach derives a set of frequency ratios from the harmonic positions identified using the harmonic recurrence method, inspired by the 8th Octave Overtone Tuning (Reinhard Reference Reinhard2011). Harmonic positions are iteratively divided by 2 until ratios fall within the range of unison (1:1) to octave (2:1) (see Equation 1):
 $${R_i} = {{{H_i}} \over {{2^n}}}$$
where R is the resulting ratio, H is the harmonic position, and n is the number of divisions required.
Both methods offer opportunities for music creators to explore dynamic tuning systems informed by real-time biological processes.
5.3. Time-resolved and transitional harmony in brain oscillations
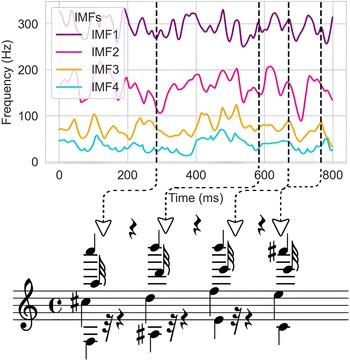
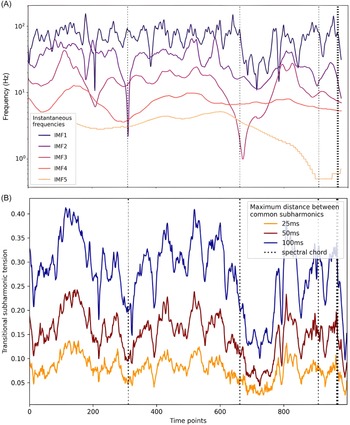
Before discussing the broader implications of the methods presented, we introduce sonification methods designed to capture stationary and transitional harmony in brain dynamics. Transitional harmony refers to the dynamic process of resolving perceptual tension between successive harmonic structures, as opposed to stationary harmony, which describes tension within a single chord or harmonic moment (Chan et al. Reference Chan, Dong and Li2019). We first quantify stationary harmony over time in brain signals by deriving spectral chords that represent consecutive moments of harmonicity within a single time series (Figures 7 and 8A). We extract instantaneous frequency (IF)Footnote 11 information by decomposing the signal into IMFs using EMD and then applying the Hilbert transform.Footnote 12 Harmonicity (e.g., harmonic similarity; (Gill and Purves Reference Gill and Purves2009)) is computed among all pairs of IFs at each timepoint, identifying spectral chords when the harmonicity exceeds a predefined threshold. This approach captures the temporal evolution of harmonic structures within brain dynamics, offering valuable insights for dynamic musical systems.
 $$Subharmonic{\mkern 1mu} Tension{\mkern 1mu} \left( {ST} \right) = {1 \over N}\sum\limits_{i = 1}^N {\left( {{{\Delta {t_i}} \over {Su{b_i}}}} \right)} $$
Identification of spectral chords using time-resolved harmonicity. The top panel represents the instantaneous frequencies (IFs) of each IMF, with dashed lines corresponding to moments of high harmonic similarity between all pairs of IFs. The bottom panel illustrates the corresponding musical notation of the identified spectral chords.

Transitional (sub)harmony using instantaneous frequencies of intrinsic mode functions. (A) Spectral chords based on harmonic similarity threshold (as in Figure 7). For every point in time, harmonic similarity was computed on each pair of instantaneous frequencies among the five IMFs. When the average harmonic similarity exceeded a value of 20, a spectral chord was identified, corresponding to dashed grey lines. (B) Transitional subharmonic tension representing the level of subharmonic congruence between two successive sets of frequencies. Each set of frequencies corresponds to instantaneous frequencies (IFs) of intrinsic mode functions (IMFs) at a specific moment in time. Congruent subharmonics are identified with maximum distance thresholds set to 25ms (yellow), 50ms (red) and 100ms (blue). Dotted black lines are moments of high harmonic similarity between the peaks of a single set of frequencies (stationary harmony).

To extend this framework, the concept of subharmonic tension is introduced to quantify dissonance or stability across successive sets of spectral peaks derived from IFs, offering a way to quantify transitional harmony in biosignals. The metric, defined in Equation 2, reflects temporal irregularities among subharmonics within an octave span and provides a means to visualise fluctuations in tension–resolution patterns over time (Figure 8B). Notably, periods of high stationary harmonicity often correspond to transitions in tension and resolution, highlighting the interplay between static and dynamic aspects of harmonicity in brain oscillations.
Together, the methods presented in this section provide a robust computational foundation for exploring the harmonic architecture of brain dynamics. By bridging empirical analysis with creative applications, they potentially enable novel pathways for integrating neurophenomenology into adaptive musical systems.
5.4. Biotuner Engine
To make these tools accessible, we created the Biotuner Engine, a user-friendly web application that allow users to upload any oscillatory time-series data (e.g., from EEG and heart rate recordings to audio or mobile sensor data) and automatically derive musical tunings from their harmonic architecture (Figure 9). Outputs include XML musical scores, MIDI tuning files and audio files that sonify the data as evolving chord progressions, enabling both scientific exploration and artistic experimentation. The underlying code is freely available through the Biotuner Python toolbox, which supports advanced customisation and integration into broader research or creative pipelines (Bellemare-Pepin & Jerbi, Reference Bellemare-Pepin and Jerbi2025). Complementing this, the Biotuner Engine provides an immediate, no-code interface for exploring the sonic potential of biological rhythms. To demonstrate the aesthetic outcomes of these processes, we have established the Biotuner Archive, a dedicated companion repository that showcases a growing collection of musical and sonic outputs created by the authors and external collaborators, with the aim of becoming an online community-driven platform of biological music sharing. Both the Biotuner Engine and Biotuner Archive are available at https://biotuner.kairos-hive.org.
Harmonic analysis of brain signals using Biotuner Engine. This interface enables users to upload time-series data and extract harmonic structures from selected time intervals, visualised in red against the broader EEG waveform in blue. The tuning analysis results panel displays harmonic ratios derived from spectral peaks, including integer-based interval names (e.g., ‘Thirty-fifth Harmonic’), tuning consonance scores and a dissonance matrix illustrating inter-ratio consonance. The matrix enables visual comparison of consonance across ratios based on pairwise harmonicity metrics.

6. Creative brain–computer interfaces
This section explores the integration of bioharmonicity into brain-computer interfaces (BCIs), proposing a framework that bridges neural dynamics and lived experiences through immersive real-time feedback systems. Inspired by the principles of the Naturalisation of Phenomenology (Roy et al. Reference Rassi, Dorffner, Gruber, Schabus and Klimesch2019), we present designs for BCIs that carefully align first-person phenomenological experiences and third-person neural observations. By embedding harmonic features of brain–body oscillations into sensory feedback loops, these systems transcend static mappings of neural activity, with potential for cyberdelic expansion of the senses (Hartogsohn Reference Hartogsohn2023), and more-than-human relationality. Because music embeds emotional processing with temporal evolution, we suggest it provides an intuitive model for users to gain insight into the dynamics of their subjective experience (Negretto Reference Negretto2016; Greer et al. Reference Greer, Ma, Sachs, Habibi and Narayanan2019). This alignment of musical and neural temporality may offer unique insights into both the physiology of self-organising systems (Lloyd Reference Lloyd2013) and their associated aesthetic possibilities. This approach extends the neurophenomenological proposal that musical form captures the pervasive experience of subjective temporality (Lloyd Reference Lloyd2013). By leveraging these inherent temporal dynamics, BCIs could induce a felt sense of resonance with one’s own physiology, potentially altering self-awareness. Consequently, musical principles of consonance and dissonance could become practical tools for representing and modulating neural states, thereby operationalising the link between first-person phenomenology and third-person brain dynamics within a creative context.
6.1. BCIs and creative extensions
BCIs typically establish communication pathways between brain activity and external devices, translating neural signals into actionable outputs (Zander and Kothe Reference Zander and Kothe2011). Traditionally employed in clinical or performance-enhancement contexts, BCIs often incorporates neurofeedback – real-time information about neural activity – to support self-regulation, emotional modulation, or cognitive enhancement. Broadly, these systems fall into passive and active categories: passive BCIs monitor spontaneous neural activity without user intentionality, whereas active BCIs respond explicitly to user-driven neural modulation.
Extending beyond these paradigms, we propose the concept of a creatice BCI (cBCI). Distinct from traditional BCIs, a cBCI facilitates a generative, reciprocal dialogue between sensory feedback and endogenous neural activity (Tholke et al. Reference Tholke, Bellemare-Pepin, Harel, Lespinasse and Jerbi2024). In this context, cBCIs move beyond passive mappings or control systems towards engines of creative exploration. Sensory feedback loops amplify the coupling between external perception and self-awareness/interoception. In this recursive dynamic, the act of sensing and perceiving becomes an act of creation itself, as the observer’s phenomenological response directly drives the evolution of the generative output. This process aims to dissolve traditional boundaries between subject (the perceiver) and object (the external sensory stimuli), moving towards a more relational understanding of music and creativity in general. As a framework, cBCIs unite real-time neural data streams, adaptive generative algorithms, and participatory phenomenology. This provides a systematic scaffold for art-technology experiments aimed at designing interactive experiences as cyber-ecosystems, defined here as physical and virtual spaces that integrate multimodal sensory signals and feedback loops across biological and technological domains (Friston et al., Reference Friston, Ramstead, Kiefer, Tschantz, Buckley and Albarracin2024; Lewis et al., Reference Lewis, Arista, Pechawis and Kite2018, Reference Lewis, Abdilla, Arista, Baker, Benesiinaabandan and Brown2020; Taylor et al., 2024). Crucially, informed by Indigenous ontologies and perspectives on more-than-human relationality, such as those articulated by (Lewis et al., Reference Lewis, Arista, Pechawis and Kite2018), these ecosystems can be envisioned as more-than-human-controlled environments, becoming spaces where living and computational systems might co-evolve and co-create as reciprocal partners, or even kin. This view fundamentally challenges the idea that music is human-centric, while shifting away from treating technology solely as a tool and aligning with the goal of ubimus of providing open-ended, participatory forms of creative engagement (Mori, Reference de Mori2017). Moreover, such a systematic understanding of music also seeks to provide empirical methodology for dynamically aligning first-person subjective experiences with third-person neuroscientific data (Roy et al., Reference Roy, Petitot, Pachoud, Varela, Petitot, Varela, Pachoud and Roy1999; F. J. Varela et al., Reference Varela, Rosch and Thompson1991), enabling richer phenomenological insight through embodied artistic interaction.
6.2. Implementation of cBCIs
Our proposed implementations of cBCIs leverage harmonic audification, a novel sonification methodology based on harmonic structures extracted from real-time brain dynamics. Rather than imposing predefined mappings or arbitrary associations, harmonic audification directly translates the intrinsic harmonic architecture of brain–body oscillations into adaptive sensory experiences. Concretely, neural spectral peaks and harmonic relationships dynamically generate personalised soundscapes or visual environments.
For instance, cBCIs can transform a musician’s brainwaves into real-time microtonal tunings mapped onto MIDI instruments. This enables musicians to improvise with their biological rhythms, directly interacting with the emergent harmonies of their own neural patterns (see Figure 10). Additionally, well-established neural markers of cognitive and emotional states (e.g. focused attention, meditative state, or creative flow states) could dynamically steer the generative process of neural soundscapes, tailoring auditory outputs to reflect shifts in cognitive or emotional states. By embedding these markers into the feedback loop, the system could adapt its harmonic trajectories to support or enhance desired mental states.
Schematic representation of a creative brain–computer interface. This diagram illustrates the integration of harmonic analysis and audification, as well as the associated microtonal ‘bio-tunings’, within a creative brain–computer interface (cBCI). Neural data undergo harmonic analysis to extract spectral features from which the system derives adaptive soundscapes through harmonic audification. Alternatively, a MIDI keyboard can be tuned according to the current HABBOs. Passive feedback is represented by the auditory perception of harmonic audification, while active feedback comprises both user-driven interaction via bio-augmented musical improvisation and system-initiated modulation of the harmonic audification.

More broadly, harmonic trajectories may inform personalised sensory experiences by projecting tension–resolution patterns of neural activity into evolving, immersive, and emotionally engaging auditory and visual feedback. In summary, cBCIs offer a platform for emergent forms of expression in which the interplay between harmonic neural processes and sensory feedback stimulates creative trajectories of mental states, inviting speculation about a future where posthuman language could be realised as a form of embodied musical communication between humans and machines (Dueck Reference Dueck2020).
7. Transdisciplinary implications
The cBCIs proposed here invite a profound rethinking of the relationship between biological systems and the generative processes involved in artistic creation. By embedding harmonic architectures of neural activity into adaptive feedback systems, these tools serve as both a mirror and a bridge – reflecting the intricacies of human lived experience while enabling new pathways for shared meaning-making. Rooted in the phenomenology of the observer and the structural dynamics of biological rhythms, cBCIs open a space where subjective awareness and objective data are no longer dichotomous but co-emergent.
These systems extend beyond the confines of personal creativity and may offer novel insights into the ‘momentary unfolding of lived experience’ while inviting for ‘metacognitive self-regulatory processes’ (Dorjee Reference Dorjee2016). When integrated with immersive environments such as augmented or virtual reality, the generative capacity of cBCIs may amplify contemplative practices, revealing novel ways to engage with the dynamics of attention, emotion, and embodied cognition. While the current work establishes the methodological framework, future empirical studies are needed to systematically investigate how real-time harmonic feedback modulates user phenomenology and behavioural states.
Methods for quantifying the harmonic architecture of brain activity and creating adaptive musical systems offer significant transdisciplinary potential beyond individual brain neuroscience, providing artistic and scientific communities with new tools for creation and exploration. The functional role of harmonicity and resonance we discussed can be directly extended to social neuroscience paradigms employing hyperscanning methodologies – studies that investigate the similarities of signals across brains in a given condition. Here, measures of bioharmonicity can be adapted to identify shared neural signatures and emergent harmonic patterns in interacting individuals, offering quantifiable insights into social dynamics, which can even drive real-time modulations in cinematographic or performing arts mediums (Dikker et al. Reference Dikker, Michalareas, Oostrik, Serafimaki, Kahraman, Struiksma and Poeppel2021; Bellemare-Pepin et al. Reference Bellemare-Pepin, Thölke, Harel and Jerbi2024). In parallel, real-time bioharmonic information enables machines to interpret human biodata into musical structures, creating sonic environments that are both responsive to and reflective of biological states. This establishes a two-way flow of information that highlights artistic meaning as an active process through which the audience learns how their mental states or actions influence the generative environment.
Furthermore, the concept of bioharmonicity can be broadened to investigate cross-species interactions and explore more-than-human forms of relationality. For instance, analysing harmonic oscillatory patterns in plant electrophysiological signals provides a novel avenue for investigating potential stimulus-response patterns, and even commonalities in functional organisation across multiple organisms of the same ecosystem. This, in turn, prompts innovative musical interactions where humans can improvise and respond to the intriguing chord progressions emerging from plant biosignals (see Figure 11). The ability to derive tunings and model dynamic harmonic progressions directly from biological data offers a concrete basis for novel musical forms and interactive systems. To demonstrate the aesthetic outcomes of these processes, the Biotuner Archive (www.biotuner.kairos-hive.org) hosts a collection of these sonifications, illustrating the diversity of harmonic phenomena observable across different signal sources, such as plant electrophysiology and organoids spike train data.
Schematic representation of a creative cyber-ecosystem. This cyber-ecosystem integrates multimodal inputs, including signals from plants, human hearts and multiple brains, through harmonicity and connectivity analyses. Interventions such as sleep, meditation or other non-ordinary states of consciousness – induced by psychedelic substances like psilocybin, for instance – influence the feedback process, shaping harmonic audification and bio-augmented musical improvisation. This system offers a platform that invites for intuitive and collaborative interactions across biological and artificial agents, bridging human, social and cross-species dynamics, and enabling new pathways for transdisciplinary research and artistic exploration.

This capacity for our methodology to bridge individual, social and cross-species analyses within a creative cyber-ecosystem (see Figure 11) highlights its potential for nurturing transdisciplinary research and creative endeavours (Glăveanu and de Miranda Reference Glăveanu and de Miranda2022; Mejía et al. Reference Mejía, Henriksen, Xie, García-Topete, Malina and Jung2023). We suggest that modelling harmony and resonance in biological data could allow for more intuitive and creative interactions with other forms of life, offering a window into the musicality of self-organising dynamics. By enacting these connections, creative practices could be thought of as symbiotic. In this sense, harmonic principles act as a bridge for diverse ontologies, framing cyber-ecosystems as fundamentally intersubjective and potentially opening avenues to study the collaborative potential across biological and artificial agents. While beyond the scope of this work, these transdisciplinary threads ultimately lead to broader socio-cultural considerations regarding how historical research priorities in neuroscience may have underemphasised the inherent musicality of biological systems as a common language for sensing and interacting across species and ecosystems (Abram Reference Abram1997). This perspective, facilitated by the harmonic analysis of biosignals and technologies such as cBCIs, invites the practices of neuroscience and music to move together beyond human-centric frameworks, towards a systematic engagement with the deep harmonicity that permeates life itself.
8. Methodological constraints and interpretive caution
The methods in this paper treat harmonic structure in electrophysiological signals as a pragmatic analytic construct rather than a definitive readout of underlying mechanisms or experience. In practice, estimates of spectral peaks, frequency ratios and time-varying harmonicity are sensitive to signal quality and analysis choices. In EEG (specifically mobile dry electrodes EEG headset) and related biosignals, movement artefacts, muscle activity, changes in electrode impedance and environmental noise can introduce spurious peaks or distort spectral morphology. In addition, non-sinusoidal waveform shapes can generate harmonic components that may mimic cross-frequency structure (Cole and Voytek Reference Cole and Voytek2017), and short analysis windows or low signal-to-noise regimes can reduce the stability of peak tracking across time.
These constraints imply that scientific interpretations of harmonic analyses in biosignals should be made conservatively. We therefore recommend (i) explicit reporting of preprocessing steps and parameter settings (e.g., window length, peak-finding thresholds, etc), (ii) basic robustness checks (e.g., repeating analyses across nearby parameter values, sensors or time windows) and (iii) triangulation with complementary descriptors (e.g., signal quality indices, artefact metrics, and traditional band-limited measures). In cBCI applications, latency, packet loss and transient artefacts can degrade real-time estimates, hindering the user’s sense of connection and agency. Therefore, practical systems should include quality gating (e.g., freezing or smoothing outputs when confidence drops) and should inform users and/or experimenters of inaccurate feedback.
Finally, while our framework is motivated by isomorphisms between musical and physiological organisation, the mapping from biosignal structure to perceived consonance, tension or meaning is not one-to-one. Musical coherence can be compelling even when the underlying data are noisy, and users may attribute meaning to feedback due to expectation, attention, or aesthetic framing. We therefore treat harmonic audification and bio-tunings as compositional and exploratory tools whose validity should be evaluated in context, such as user studies, phenomenological reports and task-dependent outcomes.
9. Conclusion
This paper has explored the intersection of computational harmonicity and brain dynamics, suggesting a novel paradigm for biologically informed adaptive music. We have discussed the empirical evidence and theoretical foundations suggesting that harmonic patterns within biosignals are reflective of underlying neurophysiological processes and states of consciousness. We have introduced computational methods for extracting bio-tunings and delineating both stationary and transitional harmonic structures associated with brain activity. Integrating these methods with cBCI, we proposed that these systems could facilitate the real-time transformation of harmonic brain patterns into adaptive musical structures, creating immersive feedback loops that bridge neural activity with creative sensory perception.
To facilitate the practical investigation of these concepts, the Biotuner toolbox (Bellemare-Pepin & Jerbi Reference Bellemare-Pepin and Jerbi2025) emerges as a significant resource: it offers modules for extracting harmonic structures from time-series data, computing adaptive tuning systems, and generating bio-informed sonifications. Complementing this, the Biotuner Engine provides a user-friendly web interface that allows researchers and practitioners – regardless of coding experience – to upload oscillatory datasets (e.g., EEG, heart rate, audio) and instantly derive XML scores, MIDI tunings and audio renditions of their data’s inherent harmonies. Together, these tools deliver both programmatic flexibility and low-barrier access, empowering a wide audience to engage with and advance our understanding of complex harmonic processes in brain dynamics.
Our goal is to augment traditional computational strategies for analysing brain signals with harmonic analysis techniques. We view this work as a first step towards empirical cross-fertilisation between music theory and neuroscience, aspiring to unlock new insights into cross-frequency coupling and resonance phenomena and their connection to phenomenological experiences. Through this lens, we imagine brain dynamics as a symphony of self-organising neural oscillators performing in a (near) critical state, creating tension and resolution patterns over various spatiotemporal scales, thereby orchestrating adaptive behaviour.
Competing interests
The authors declare no competing interests (financial or non-financial). The Biotuner Engine and companion toolbox are released as open-source tools; the authors receive no remuneration or commercial benefit from their use.
AI use statement
Generative AI tools were used to assist with language editing and formatting during revision; no AI system was listed as an author, and all content was reviewed and approved by the authors.




 Open access

