

Introduction
The COVID-19 pandemic represented an unprecedented global crisis, affecting not only the health of millions of people but also the economic, social, and political stability of countries. Faced with this scenario, governments adopted various strategies to mitigate the financial impact of the crisis, among which emergency cash transfers played a central role. Particularly in Latin America and southern Europe, these measures were key to sustaining the incomes of the most vulnerable sectors and guaranteeing social cohesion in a context of extreme uncertainty.
This article focuses on the analysis of the implementation of social policies during the COVID-19 pandemic in Argentina, Brazil, Mexico, and Spain between 2020 and 2021, with a particular focus on the emergency transfer measures adopted by each country in the initial stage known as the “first wave” (Rubio et al., Reference Rubio, Escaroz, Machado, Palomo and Sato2019; Dorlach, Reference Dorlach2023). We examine the main initiatives in each of these contexts, along with the management of the pandemic in relation to social policies during times of crisis. These countries, although with different institutional structures and welfare regimes, faced the common challenge of ensuring rapid and effective assistance to millions of citizens affected by the economic downturn. Comparing these cases allows us to understand the factors that facilitated or hindered the implementation of these policies and to draw key lessons for the design of future responses to large-scale crises. The study builds on the literature on state capacity and crisis response (Lotta Spanghero et al., Reference Lotta Spanghero, Morangueira Magri, Nunes, Soares Benedito, Aliberti, Caracho Ribeiro and Santos2021; Christensen and Lægreid, Reference Christensen and Lægreid2022; Capano and Toth, Reference Capano and Toth2023; Stoney et al., Reference Stoney, Asquith, Kipper, McNeill, Martin and Spano2023), exploring how differences in technological infrastructure, inter-agency coordination, and political leadership influenced the effectiveness of cash transfers. The study argues that the existence of a strong bureaucracy and efficient digital platforms allowed for a more agile and targeted response, while institutional fragmentation and lack of political coordination hindered implementation. The central research question guiding this study is: How and to what extent did state capacity, political leadership, and territorial governance shape the implementation of emergency cash transfer programmes in Argentina, Brazil, Mexico, and Spain during the first wave of the COVID-19 pandemic? This question allows for a comparative analysis of implementation patterns across different institutional configurations, levels of decentralisation, and ideological orientations, while also accounting for variations in digital infrastructure and administrative coordination.
To this end, the article adopts a comparative approach based on the analysis of secondary sources, including government reports, academic literature, and data from multilateral agencies. It examines in detail the transfer programmes in each country: the Ingreso Familiar de Emergencia (IFE) in Argentina, the Auxilio Emergencial in Brazil, the Tandas para el Bienestar and the Programa Jóvenes Construyendo el Futuro in Mexico, and the Expedientes de Regulación Temporal de Empleo (ERTE) and Ingreso Mínimo Vital (IMV) in Spain. In addition, the main obstacles and achievements of these initiatives are discussed, identifying common patterns and significant differences.
State capacity played a crucial role in determining the effectiveness of policies implemented for the two major groups. Differences in technological and administrative infrastructure, along with inter-institutional coordination, significantly influenced policy outcomes. Each country adopted distinct approaches to managing cash transfers, facing unique challenges in responsiveness, coordination, and resource accessibility. National governments, in partnership with public and private banks, oversaw the administration of these transfers. In several cases, authorities introduced digital platforms to streamline the application process and improve access to aid during the pandemic and government office closures. However, aid distribution encountered issues such as payment delays, complex requirements, and insufficient information (Maggetti and Trein, Reference Maggetti and Trein2021; Hadorn et al., Reference Hadorn, Sager, Mavrot, Malandrino and Ege2022; Cingolani, Reference Cingolani2023).
While these policies played a crucial role in mitigating the social and economic impacts of the pandemic, they also highlighted the importance of effective and coordinated health crisis management (Blofield et al., Reference Blofield, Pribble, Giambruno, Merike, Pribble and Giambruno2023; Robles et al., Reference Robles, Holz, Jacas, Farías and Holz2023). Thus, the analysis of the implementation of transfers during the COVID-19 pandemic in Argentina, Brazil, Mexico, and Spain reveals that their effectiveness was determined by four main conditions: (1) digital capacity (DC), which includes technological infrastructure and information systems; (2) intergovernmental coordination (IC), which reflects the articulation between levels of government; (3) banking infrastructure (BI), which conditions the capacity to distribute benefits; and (4) previous experience in social programmes (PE), which facilitates institutional adaptation. Empirical evidence shows that successful implementation (SI) requires a specific combination of these state capacities, especially the integration between digital capacity and inter-institutional coordination (León Ramón-Borja, Reference León Ramón-Borja, del Pino Matute and Subirats i Humet2021; Subirats i Humet, Reference Subirats i Humet, del Pino Matute and Subirats i Humet2021; Vallespín Oña, Reference Vallespín Oña, del Pino Matute and Subirats i Humet2021).
This article follows the following structure. First, the theoretical framework contextualises the discussion on state capacity and crisis response, incorporating a review of previous studies on the implementation of public policies during emergencies. Next, the research methodology outlines the criteria for selecting case studies and the sources of information used. The analysis then examines the selected cases, identifying their main characteristics, outcomes, innovations, and challenges in implementing cash transfers. A comparative discussion follows, using a structured qualitative approach to identify the key institutional configurations that shaped the success or limitations of the implemented policies. Finally, the study concludes by summarizing the lessons learned and discussing their implications for the design of adaptive and resilient public policies in crisis contexts.
This analysis contributes to the debate on implementing social policies in emergency contexts by offering a comparative perspective to better understand the conditions necessary for an effective government response. The pandemic tested state capacities worldwide and provided valuable lessons on the need for robust, flexible, and adaptive social protection systems. It also underscored the role of inter-agency coordination and the digitisation of administrative systems in ensuring efficient resource allocation. This study aims to enhance preparedness and response to future crises by strengthening the state’s role in safeguarding public welfare and promoting greater equity in access to social assistance during emergencies.
Literature review
Historically, public policy implementation was conceived through a rationalist and linear lens, where success depended on the state’s technical and bureaucratic capacity to translate objectives into action. This paradigm, shaped by the Weberian ideal of an efficient and neutral bureaucracy, dominated early implementation (Bardach, Reference Bardach1977; Pressman and Wildavsky, Reference Pressman and Wildavsky1984), assuming that well-designed policies would be predictably executed given sufficient resources and professional administration. However, practice revealed persistent obstacles, and later scholarship emphasized that implementation is not automatic but contingent on the interaction of actors, institutions, and political dynamics that can reshape outcomes (Howlett et al., Reference Howlett, Perl and Ramesh2021). From the 1980s onwards, approaches emerged that questioned the idea of linear implementation and highlighted the role of the bureaucracy as a political actor with its interpretative capacity and agency (Peters, Reference Peters2001). One of the main contributions in this sense comes from the street-level bureaucracy theory, which emphasises the discretion of civil servants in the implementation of policies and their role in adapting these to specific contexts (Lipsky, Reference Lipsky1980). This approach argues that policy outcomes vary significantly due to interactions between administrative actors and beneficiaries, rather than being implemented uniformly.
More recently, in contrast to traditional approaches that conceived of policy implementation as a planned and rational process, concepts such as resilience and policy learning have emerged, which emphasise the adaptability and versatility of states in contexts of crisis and polycrisis (Freeman, Reference Freeman, Moran, Rein and Goodin2006; Zaki et al., Reference Zaki, Pattyn and Wayenberg2024). These approaches break with the idea that implementation must follow a predefined logic and highlight the need for dynamic responses, in which the capacity for continuous adjustment and learning plays a central role. State resilience has been defined as the ability of institutions to absorb shocks, reorganise, and continue to operate in highly unstable environments (Correia Pereirinha and Pereira, Reference Correia Pereirinha and Pereira2021; Oana et al., Reference Oana, Ronchi and Truchlewski2023). This concept highlights that, beyond bureaucratic infrastructure, what is crucial is the state’s capacity to modify its processes and adapt to changing scenarios without losing effectiveness in service provision. On the other hand, policy learning emphasises the capacity of states to incorporate past experiences in the formulation and implementation of new strategies. In crises, learning becomes essential to adjust policies in real-time, avoiding repeating mistakes and optimising available resources (Zaki and Wayenberg, Reference Zaki and Wayenberg2023). The empirical evidence presented in this research argues that governments that have been able to generate effective learning mechanisms have managed to improve the management of social policies in recurrent crises. Building on this trajectory, Munck and Luna (Reference Munck and Luna2022) emphasize that emergency responses must be understood within the broader tradition of comparative politics in Latin America, where institutional legacies and historical trajectories shape state capacity. Their perspective highlights that pre-existing arrangements conditioned how governments delivered emergency transfers during COVID-19. In parallel, De La O (Reference De La O2015) shows how conditional cash transfer programmes in the early 2000s transformed the relationship between citizens and the state, creating expectations of social rights and building administrative infrastructures. These legacies proved essential during the pandemic, as emergency measures built upon prior innovations rather than emerging in isolation.
The literature on policy implementation in crisis contexts has generated several debates and conceptual frameworks that provide insight into different approaches and perspectives on state response. This section presents the main theoretical discussions on policy implementation in emergencies, contrasting different lines of research that have explored state capacity, inter-agency coordination, and the role of technology in emergency management. The literature on social policies in crisis identifies three main lines of analysis.
The first focuses on state capacity as a key determinant of policy implementation. This perspective, widely explored in the institutionalist literature, argues that states with strong institutions and consolidated bureaucracies are more likely to design effective responses to emergencies (Ansell et al., Reference Ansell, Sørensen and Torfing2023; Cingolani, Reference Cingolani2023; del Pino Matute and Rubio Lara, Reference del Pino Matute, Rubio Lara, del Pino Matute and Rubio Lara2024). Within this line, some authors highlight the importance of administrative capacity and the existence of adequate regulatory frameworks for efficient policy implementation. Others, however, warn that state capacity does not always guarantee equity in the distribution of resources, as it may be conditioned by political and structural factors (Martínez Franzoni and González Hidalgo, Reference Martínez Franzoni and González Hidalgo2021; Franzoni and Sánchez-Ancochea, Reference Martínez Franzoni and Sánchez-Ancochea2024). In the Latin American context, these challenges are compounded by the historically uneven development of state institutions. An approach that complements this vision is that of state resilience, which suggests that, beyond pre-existing institutional capacity, the ability of states to adapt and reorganise their structures in response to crises is key. This line of thought has been central to recent studies analysing how different countries adjusted their social protection systems during the pandemic (Bresser-Pereira, Reference Bresser-Pereira2021; Jara and Palacio Ludeña, Reference Jara and Palacio Ludeña2024). In this sense, some authors have pointed out that institutional flexibility and the capacity to improvise can be as decisive as the existence of previously established bureaucratic frameworks (Alves et al., Reference Alves, Berniell and de la Mata2021). At the same time, research has also highlighted the role of legacies of social policy systems in shaping emergency responses (da Silva e Silva et al., Reference da Silva e Silva, Arregui, Bentura Alonso and Fernandes Soto2022; da Silva e Silva et al., Reference da Silva e Silva, Carbajal Arregui, Paulo-Bevilacqua, Bentura and Fernández Soto2024). These studies emphasise that while cash transfer programmes expanded significantly, they often reproduced structural limitations of social protection systems in Latin America.
The second line of analysis examines models of governance and inter-institutional coordination, contrasting two main approaches: centralised and decentralised. From the centralised perspective, some studies argue that the concentration of decisions at the national level allows for greater coherence, and faster and more homogeneous responses, avoiding policy fragmentation (Cardozo, Reference Cardozo, Gutiérrez and María de Monserrat2021; Peters et al., Reference Peters, Grin, Abrucio, Peters, Grin and Abrucio2021). In contrast, other authors emphasise that decentralised models facilitate the adaptation of policies to local needs and allow for greater articulation with subnational and private sector actors (Correia Pereirinha and Pereira, Reference Correia Pereirinha and Pereira2021; Zahariadis et al., Reference Zahariadis, Petridou, Exadaktylos and Sparf2021; Stoney et al., Reference Stoney, Asquith, Kipper, McNeill, Martin and Spano2023). A point of consensus in this literature is that the effectiveness of governance depends, to a large extent, on the capacity of states to generate cooperation mechanisms between levels of government and administrative sectors (Cook and Ulriksen, Reference Cook and Ulriksen2021; Cyr et al., Reference Cyr, Bianchi, González and Perini2021). In this framework, some studies have introduced the concept of “hybrid governance,” which combines elements of centralisation and decentralisation in the management of social policies (Calò et al., Reference Calò, Scognamiglio, Bellazzecca and Ongaro2024). Recent crises have demonstrated the value of this model, emphasising the need for flexibility and strong inter-institutional networks to deliver more effective, context-specific responses. De Castro Maia Senna et al. (Reference de Castro Maia Senna, Souto Maior Ferreira and Suarez Baldo2021) show how Argentina, Brazil, and Mexico combined different governance strategies, influenced both by their institutional legacies and by the political orientation of incumbent governments. In Brazil, the implementation of the Auxílio Emergencial revealed severe coordination problems and the weakening of traditional social assistance channels (Marins et al., Reference Marins, Nogueira Rodrigues, Maldonado Lago da Silva, Martins da Silva and Loureiro Carvalho2021; Simoni Junior, Reference Simoni Junior2021), while other analyses have stressed the lack of preparedness in terms of communication and risk management (Silva Jiménez and Lizondo Valencia, Reference Silva Jiménez and Lizondo Valencia2021).
A third stream in the literature focuses on the impact of technology and digitisation on policy implementation. In this regard, work has extensively discussed the role of digital platforms and data systems in optimising emergency transfers and improving beneficiary targeting (National Institute of Public Administration, 2021; Palomo et al., Reference Palomo, Vargas Faulbaum, Machado, Rolon, Veras Soares, Rubio and Escaroz2022). Some studies highlight the benefits of digitisation for administrative efficiency and fraud reduction, while others warn about the risks of digital exclusion and technology access gaps for vulnerable populations (Carmody et al., Reference Carmody, McCann, Colleran and O’Halloran2020; Chudnovsky and Peeters, Reference Chudnovsky and Peeters2020). Questions have also been raised about data privacy and citizen trust in the digital management of public policies (Lapuente Giné, Reference Lapuente Giné, del Pino Matute and Subirats i Humet2021; Busemeyer, Reference Busemeyer, Green-Pedersen, Jensen and Vis2023; Cingolani, Reference Cingolani2023). In this area, an emerging perspective is that of technological inclusion in social policy, which analyses how digital innovations can be equitably and effectively integrated into social protection systems (Berner and Van Hemelryck, Reference Berner and Van Hemelryck2021). Other studies suggest that while digitalisation can improve the efficiency of cash transfers, complementary mechanisms need to be considered to ensure accessibility for the most vulnerable sectors (Alves et al., Reference Alves, Berniell and de la Mata2021; Bárcena and Etienne, Reference Bárcena and Etienne2021). Dettano et al. (Reference Dettano, Tardío and Virto2024) compare the Argentine and Spanish experiences, showing how digitalisation accelerated transfer implementation but also revealed inequalities in registration and access. Similarly, Poy and Robles (Reference Poy and Robles2023) stress that structural informality limited the effectiveness of digital mechanisms in several Latin American countries.
Beyond these theoretical approaches, the literature has also identified many recurrent challenges in policy implementation in emergency contexts. These include the tension between efficiency and equity in resource allocation (Blofield and Filgueira, Reference Blofield and Filgueira2020). While most studies have highlighted the need for rapid responses in times of crisis, others warn that urgency can lead to errors in targeting and the exclusion of certain population groups. In the Latin American context, recent research on social protection during the COVID-19 crisis has shown that although governments expanded income support significantly, responses varied considerably depending on policy legacies, fiscal space, and political configurations (Blofield et al., Reference Blofield, Pribble, Giambruno, Merike, Pribble and Giambruno2023). In particular, countries with more developed social protection infrastructures and stronger institutional arrangements were able to scale up emergency assistance more effectively, whereas others faced serious limitations in reaching vulnerable populations.
Another point of debate is the fiscal sustainability of emergency policies. Some authors argue that massive transfers of resources can generate long-term financial pressures, compromising the stability of social protection systems (Vallespín Oña, Reference Vallespín Oña, del Pino Matute and Subirats i Humet2021). In Argentina, empirical studies show that the IFE played a central role in supporting informal and vulnerable sectors (Kaplan and Delfino, Reference Kaplan and Delfino2021; Messina, Reference Messina2022; Hornes, Reference Hornes2024), although it also faced important limitations. In Brazil, the Emergency Aid expanded coverage dramatically but left millions of “invisible” citizens outside traditional registers, revealing the erosion of assistance structures (Simoni Junior, Reference Simoni Junior2021). Finally, there have been discussions on the capacity of states to learn from previous experiences and strengthen their response systems to future crises (Subirats i Humet, Reference Subirats i Humet, del Pino Matute and Subirats i Humet2021; Hornes, Reference Hornes2024).
The literature on policy implementation in turbulent times presents a diversity of approaches and perspectives that reflect the complexity of the phenomenon. While some studies emphasise the role of state capacity and governance in policy effectiveness, others highlight the challenges arising from inequality, digitalisation, and fiscal sustainability. These discussions provide insights into the dilemmas states face in managing emergencies and offer tools for designing more equitable and effective responses in the future. Below is a summary of the main approaches (Table 1).
Approaches to the implementation of public policies in times of crisis

Table 1. Long description
The table is organized into four columns: Approach, Main dimensions, Key aspects of implementation, and Challenges identified.
Row 1: State capacity. Main dimensions focus on institutional and bureaucratic strength. Key aspects include administrative tradition, civil service, and strong governments. Challenges involve potential inequity in resource distribution and lack of flexibility.
Row 2: Inter-institutional coordination. Main dimensions focus on articulation between government levels and actors. Key aspects include coherence, cooperation, and leadership type. Challenges involve tensions between centralized and decentralized models and intergovernmental cooperation difficulties.
Row 3: Digitalisation and technology. Main dimensions focus on using digital platforms for optimization and targeting. Key aspects include citizen access via intuitive applications for rapid mass coverage. Challenges involve digital exclusion of vulnerable sectors, database limitations, data privacy risks, and citizen trust.
Source: Own elaboration based on literature.
Against this backdrop, the emergency expansion of social protection during the COVID-19 pandemic must be situated within a broader historical trajectory. Following the retrenchment trends that marked the post-commodity boom period (Garay, Reference Garay2016; Niedzwiecki and Pribble, Reference Niedzwiecki and Pribble2022), the pandemic triggered a renewed expansionary impulse – one driven not by ideological alignment or fiscal abundance, but by urgent social need and institutional improvisation. Recent research has examined this expansion by highlighting the role of policy legacies, fiscal space, and political configurations in shaping the scale of emergency responses (Blofield et al., Reference Blofield, Pribble, Giambruno, Merike, Pribble and Giambruno2023). Building on this literature, this study shifts the analytical focus from the political determinants of policy expansion to the institutional conditions that shape policy implementation. In particular, it opens the “black box” of emergency policy execution by analysing how different forms of state capacity – digital infrastructure, intergovernmental coordination, banking systems, and administrative experience – conditioned the effectiveness of emergency cash transfer programmes.
Methodology
Comparative analysis of social policy implementation during the pandemic serves a dual purpose: to contribute to theoretical knowledge about state capacities and to generate practical lessons for improving public management in the face of future crises. Systematic comparison makes it possible to identify which institutional configurations are most effective, under which conditions, and which elements are potentially transferable across contexts (Schmitt, Reference Schmitt, Araral, Fritzen, Howlett, Ramesh and Wu2012; Geva-May et al., Reference Geva-May, Hoffman and Muhleisen2018; Peters, Reference Peters and Fontaine2020). This comparative perspective is particularly valuable in the current context, where global crises demand responses that, while locally adapted, benefit from knowledge about diverse experiences. The COVID-19 pandemic, by presenting a common external shock that required similar responses in different institutional contexts, offers an ideal scenario to analyse how different state capacities conditioned the effectiveness of emergency social policy implementation.
Case selection strategy
Argentina, Brazil, Mexico, and Spain are strategically selected cases that allow for a systematic analysis of the relationship between state capacities and implementation effectiveness. This selection follows a “similar systems” logic, combining shared structural characteristics with significant variations in key dimensions for the analysis.
First, the four countries present decentralised territorial structures that generate similar challenges in terms of policy coordination and implementation. Argentina, Brazil, and Mexico operate under federal systems, while Spain has an autonomous model that, although legally distinct, faces comparable challenges in terms of territorial articulation. This common feature is particularly relevant for analysing how different models of intergovernmental coordination affected policy implementation during the crisis. Spain’s inclusion responds to institutional rather than geographical criteria: its 17 autonomous regions hold significant social policy competencies, generating multilevel coordination challenges structurally like Latin American federations. During COVID-19, both Spanish autonomous communities and Latin American states/provinces faced tensions between central emergency measures and subnational jurisdictions. Spain also introduces crucial variation in state capacity, representing a consolidated institutional framework exposed to similar external shocks as developing systems, thereby enriching the comparative analysis of implementation patterns across different levels of institutional maturity.
Second, the selection deliberately excludes unitary and smaller Latin American countries – such as Chile, Peru, and Ecuador – where limited territorial complexity and population scale constrain analytical depth. Colombia was excluded due to data limitations and scope boundaries. The chosen cases represent the region’s largest federal or quasi-federal systems, ensuring relevance for examining multilevel governance and policy delivery. They also share a comparable institutional base: robust bureaucracies – albeit with varying degrees of professionalisation (Iacoviello and Chudnovsky, Reference Iacoviello and Chudnovsky2015), institutionalised social protection systems, and prior experience managing mass social programmes. This baseline enables analysis of how differences in digital, administrative, and coordination capacities shaped implementation effectiveness.
Third, all four countries were significantly affected by the COVID-19 pandemic, requiring urgent and large-scale responses. This common external shock provides a fertile ground to explore how institutional configurations and political decisions conditioned state responsiveness. At the same time, the cases vary in welfare regime typologies: Argentina reflects a protectionist model with strong state intervention; Brazil and Mexico follow productivist schemes with differing institutional depth; and Spain operates under a universalist model embedded in the European social protection framework (Martínez Franzoni, Reference Martínez Franzoni2008; Cruz-Martínez et al., Reference Cruz-Martínez, Vargas Faulbaum, Velasco, del Pino Matute and Rubio2024).
Finally, digital and administrative capacities differ markedly – from Spain’s robust infrastructure to Mexico’s developing systems, and Argentina and Brazil’s hybrid configurations – offering a valuable spectrum for assessing how state capacity influenced emergency cash transfer implementation.
Analytical strategy
This study adopts a structured comparative approach to examine how different configurations of state capacity shaped the implementation of emergency cash transfer programmes during the first wave of the COVID-19 pandemic. The strategy relies on systematic cross-case comparison supported by narrative synthesis and tabular evidence. The analytical framework focuses on four institutional dimensions that condition implementation capacity:
-
▪ Digital capacity (DC): Availability and integration of technological infrastructure, including digital platforms, automated verification systems, and beneficiary databases.
-
▪ Intergovernmental coordination (IC): Effectiveness of articulation between national and subnational levels, including cooperative governance, administrative alignment, and crisis management mechanisms.
-
▪ Banking infrastructure (BI): Extent of financial inclusion and the ability to deliver transfers efficiently through banking systems or alternative channels.
-
▪ Previous experience (PE): Institutional learning and prior implementation of large-scale social programmes, which condition administrative readiness and targeting capacity.
These dimensions are assessed across four country cases – Argentina, Brazil, Mexico, and Spain – using qualitative indicators and secondary data. The analysis does not seek to identify universal causal pathways, but rather to highlight how different combinations of capacities shaped implementation outcomes in context-specific ways. This methodological strategy allows not only to assess these hypotheses but also to identify specific causal configurations that lead to successful implementation, thus contributing to both theoretical development and practical improvement of social policy management in crisis contexts.
To evaluate implementation effectiveness, the study introduces the concept of Successful Implementation (SI), defined as the relative ability of each country to deliver emergency cash transfers under crisis conditions. SI is assessed through four observable indicators:
-
▪ Speed: Promptness of programme rollout and first disbursement
-
▪ Coverage: Proportion of the population reached, especially informal and vulnerable groups
-
▪ Distributional adequacy: Alignment of benefit amounts and targeting mechanisms with socioeconomic needs
-
▪ Adaptability: Capacity to adjust implementation to territorial, administrative, and political constraints
Each indicator is scored on a three-point ordinal scale (0 = low, 1 = moderate, 2 = high), allowing for comparative assessment across cases. The SI score (maximum 8) provides a synthetic measure of implementation effectiveness, without assuming normative success or long-term impact.
The analysis is guided by three hypotheses:
H1: Successful implementation requires a combination of high digital capacity and effective intergovernmental coordination.
H2: Banking infrastructure is a necessary but not sufficient condition for successful implementation.
H3: Prior experience with large-scale social programmes can compensate for limitations in other capacities when paired with strong territorial governance.
These hypotheses are explored through cross-case comparison, aiming to identify patterns and trade-offs that illuminate the conditions under which emergency social protection can be effectively deployed.
The COVID-19 pandemic and the implementation of emergency measures in Argentina, Brazil, Mexico, and Spain
The COVID-19 pandemic represented an unprecedented global crisis that demanded extraordinary public policy responses. The economic impact was particularly severe because of the synchronised nature of the shock: the containment measures implemented between March and May 2020 simultaneously paralysed economic activity in virtually all countries analysed during what became known as the “first wave” (Greer et al., Reference Greer, King, Massard da Fonseca, Peralta-Santos, Greer, King, da Fonseca and Peralta-Santos2021). As the data show, the economic contraction was dramatic and widespread in 2020: Spain experienced a 10.94% drop, Argentina a 9.90% drop, Mexico an 8.35% drop, and Brazil a 3.27% drop.
The depth of the crisis stems from the unique combination of factors that shaped the health emergency. Confinements caused a simultaneous paralysis of supply and demand, particularly affecting the service sector and informal employment. This situation created an exceptional challenge for implementing social policies, as health constraints directly limited traditional structures of service provision and social assistance. As the literature on policy management during crises highlights, the effectiveness of responses relied heavily on institutional adaptive capacity and state resilience (Howlett et al., Reference Howlett, Perl and Ramesh2021). The four countries analysed faced the challenge of deploying massive social protection measures in the context of mobility restrictions, which required significant innovations in identification, registration and benefit payment mechanisms. The experience demonstrated the importance of key factors identified in the theoretical framework: pre-existing administrative capacity, technological infrastructure, and intergovernmental coordination.
The subsequent recovery, evidenced in the 2021 growth (Argentina 10.44%, Brazil 4.76%, Spain 6.68%, and Mexico 6.04%), although significant, did not fully compensate for the previous year’s losses and was marked by important sectoral and social inequalities. These dynamics underline the importance of analysing not only the design of emergency policies but also the specific implementation mechanisms that determined their effectiveness in reaching the populations most affected by the crisis (Figure 1).
Growth of economic activity 2002–2023 in countries studied (in GDP points).
Source: Compiled by the author based on data.worldbank.org.

Figure 1. Long description
The X axis represents years from 2002 to 2023. The Y axis represents G D P points ranging from minus 15 to 15 in increments of 5.
Argentina, shown as a thick solid black line, exhibits the most extreme volatility. It starts at a low of minus 11 in 2002, surges to nearly 10 by 2003, maintains high growth until 2008, then fluctuates wildly with significant peaks in 2010 and 2021, and sharp drops in 2009, 2012, 2014, 2016, 2018, and 2020.
Brazil, shown as a double-lined thin gray line, follows a similar but less extreme pattern to Mexico. It peaks in 2010 at approximately 7.5 points and hits a significant trough in 2020 at minus 4 points.
Spain, shown as a dashed black line, remains relatively stable between 0 and 5 points until 2008. It dips below zero in 2009 and 2012 to 2013, recovers slightly, and then experiences its sharpest decline in 2020, reaching the graph's lowest point near minus 11 before rebounding in 2021.
Mexico, shown as a solid gray line, tracks closely with Brazil. It shows moderate growth until a sharp dip in 2009 to minus 6, a recovery peaking in 2010, and another major decline in 2020 to minus 8 before recovering in 2021.
In this context of deep economic crisis and unprecedented challenges for social protection systems, the differences in growth and recovery trajectories among the countries analysed reveal the critical importance of state capacities and social policy implementation mechanisms. The synchronised contraction in 2020 and the subsequent rebound in 2021 are evidence of both the magnitude of the shock and the heterogeneity in institutional response capacity.
Argentina: Digital innovation and centralisation in emergency management
Argentina’s response to the COVID-19 crisis during the first wave took place within the framework of a presidential federal system with a strong centralisation in the management of social policies (Sánchez Villa, Reference Sánchez Villa2024). Under the government of Alberto Fernández (2019–2023), the country implemented one of the strictest quarantines globally, establishing Social, Preventive, and Obligatory Isolation (ASPO) through Decree 297/2020 (Palomo et al., Reference Palomo, Vargas Faulbaum, Machado, Rolon, Veras Soares, Rubio and Escaroz2022). In this context, the government deployed emergency social protection measures, including the Emergency Family Income (IFE), the Emergency Assistance Programme for Work and Production (ATP), the extension of the Food Card, and extraordinary bonuses for pensioners and beneficiaries of social programmes.
The Emergency Family Income (IFE) was an exceptional cash transfer targeted at informal workers, the self-employed in the lowest categories, domestic workers, and beneficiaries of the conditional transfers of Universal Child Allowance (AUH) and Universal Pregnancy Allowance (AUE). Eligibility requirements included a minimum legal residence of 2 years, age between 18 and 65 years, and the exclusion of people with formal income or social security benefits. It provided support to 8.9 million beneficiaries, covering ~59% of households, with monthly payments of ARS 10,000 for 3 months (~150 USD in April 2020).
The Emergency Assistance to Labour and Production Programme (Programa de Asistencia de Emergencia al Trabajo y la Producción- ATP) assisted firms in the payment of wages. Firms had to demonstrate a reduction in turnover after 12 March 2020 to access coverage of between 50% and 100% of net wages, with a minimum of one minimum living and mobile wage and a maximum of two. In parallel, the Tarjeta Alimentar (Food Card), originally implemented in December 2019, expanded its coverage to reach 1.9 million children up to 6 years old who benefit from the AUH programme. The programme provided amounts ranging from ARS 4,000 to 6,000 through pre-loaded cards exclusively for food purchases. Additionally, the government delivered extraordinary bonuses to retirees with minimum pensions, allocating ARS 3,000 in April and May 2020 and ARS 1,500 for those receiving up to 1.5 minimum pension benefits. The National Social Security Administration (ANSES) oversaw these payments, managing social security and social assistance programmes.
The implementation process revealed both institutional capacities and structural challenges linked to the target population that the policy aimed to reach. ANSES designed a digital platform for the enrolment and payment of benefits, incorporating automated verification systems and virtual appointments. However, eligibility verification required cross-checking information with multiple government databases, which revealed gaps in the coverage of the social protection system. A key challenge was beneficiary banking: the opening of 4.8 million bank accounts for previously unbanked individuals was coordinated with the financial system, requiring innovations in identity verification mechanisms and remote account opening.
Argentina’s response to COVID-19 had a significant impact on mitigating the socio-economic crisis, partially compensating for income losses and reducing the increase in poverty and inequality (Lustig et al., Reference Lustig, Martínez Pabon, Sanz and Younger2021). At the same time, it fostered innovations in public management, including biometric verification systems, mass digital signatures, and mobile applications for the administration of social benefits, consolidating institutional capacities with the potential for permanence beyond the emergency context.
Brazil: Digital innovation and federal tensions in emergency management
The management of emergency social policies in Brazil during the COVID-19 pandemic took place in a context of institutional complexity and tensions between the federal government and the states. As a presidential federal republic with 214 million inhabitants, the crisis response reflected regional inequalities and the complex distribution of competencies. Jair Bolsonaro’s rule was characterised by conflicts with state governments, especially over confinement measures, resulting in fragmented responses that hindered the implementation of social policies in the first wave (Scelza Cavalcanti and Garcia Marques, Reference Scelza Cavalcanti and Garcia Marques2020).
Auxílio Emergencial (Emergency Aid), approved in April 2020, became the main federal measure to mitigate the socio-economic crisis. Initially designed to provide five payments of R$600, later reduced to four instalments of R$300, it aimed to support informal workers, the unemployed, and beneficiaries of Bolsa Família (Family Grant). Implementing the programme posed an unprecedented logistical challenge: Caixa Econômica Federal developed the “Caixa Tem” application, enabling the large-scale creation of free digital accounts and facilitating the financial inclusion of millions of Brazilians previously unregistered in formal banking systems. The programme reached 68.2 million people (32% of the population), requiring complex intergovernmental coordination. However, federal decentralisation and a lack of coordination with states and municipalities led to overlapping benefits and operational challenges, particularly in regions with limited banking and digital infrastructure.
The adjustment of the Auxílio Emergencial from September 2020 reflected the tension between social needs and fiscal constraints, reducing amounts and tightening eligibility criteria. In parallel, the government launched the Programa Nacional de Apoio às Microempresas e Empresas de Pequeno Porte – Pronampe – (National Support Programme for Micro and Small Enterprises), offering financing at preferential rates for small businesses, complementing the economic mitigation strategy. The Cadastro Único (Single Registry), developed for the Bolsa Família, proved to be crucial for the identification of beneficiaries, although it showed limitations in the coverage of unregistered populations. The crisis encouraged its updating, expanding the social database and strengthening the state’s capacity to respond to future emergencies.
Although the programme helped contain the increase in poverty, it temporarily reduced extreme poverty in the North and Northeast regions, traditionally the most vulnerable. However, the rapid implementation also resulted in fraud and improper payments: audits by the Tribunal de Contas da União (TCU) detected 5.2 million irregular benefits, underlining the difficulties in balancing urgency and administrative control. Nonetheless, the Auxílio Emergencial left a legacy in Brazilian social policy, demonstrating the state’s capacity to execute massive transfers through innovative digital solutions, but also highlighting shortcomings in intergovernmental coordination and access to vulnerable populations. The crisis accelerated the modernisation of public administration, consolidating new digital infrastructures for future social protection policies.
Mexico: Programmatic continuity in centralised federalism
Mexico’s response to the COVID-19 pandemic reflected its institutional architecture and the political vision of Andrés Manuel López Obrador’s government. Despite its federal structure, social policy implementation remained highly centralised, a tendency reinforced by the health emergency. Unlike other countries in the region, the government avoided strict lockdowns and did not introduce large-scale new transfer programmes. Instead, it focused on strengthening existing initiatives under the Bienestar (Welfare) strategy, which prioritised direct and unconditional transfers. The Welfare Secretariat and Servants of the Nation played a central role in executing this approach, acting as direct intermediaries with beneficiaries (Galindo Castro, Reference Galindo Castro2022).
The Jóvenes Construyendo el Futuro (Youth Building the Future) programme, which covered 1.4 million beneficiaries and provided a monthly stipend of USD 200, adapted its implementation to a virtual format, exposing significant inequalities in digital access. Its eligibility criteria – young people aged 18–29 years without employment or education, with priority given to highly marginalised areas – remained unchanged. Meanwhile, Tandas para el Bienestar (Well-being Microloans) supported half a million microentrepreneurs with interest-free loans ranging from 6,000 to 15,000 Mexican pesos, amounting to a total disbursement of USD 110.3 million in 2020. The programme relied on the Censo del Bienestar (Well-being Census), a mechanism that facilitated targeting but also excluded vulnerable sectors not previously registered (Consejo Nacional de Evaluación de la Política de Desarrollo Social, 2020).
The Banco del Bienestar played a key role in the dispersion of resources, expanding its branch network to reach territories excluded from the formal financial system. However, delays in its expansion and technological limitations generated challenges in the timely delivery of support (Martínez Espinoza and Ziccardi, Reference Martínez Espinoza and Ziccardi2023). One of the most significant measures was the advance payment of the Pension for Older Adults, which benefited 9 million people with the early delivery of 4 months of support, seeking immediate liquidity without altering the structure of the programmes. Its implementation required logistical adaptations, such as flexibility in the proof of survival and staggered payment schemes.
Centralised management generated friction with state governments, some of which implemented complementary measures without formal coordination mechanisms. At the territorial level, the structure of the Development Integration Centres and Servants of the Nation took on additional functions, including health counselling and channelling of requests. However, their operation was criticised for the possible politicisation of social assistance and the subordination of state and municipal bodies to federal logic.
This strategy produced mixed results. The continuity of the programmes made it possible to maintain support for previously identified populations, but the rigidity in the incorporation of new beneficiaries showed gaps in social protection, especially among urban informal workers and populations not registered in the Welfare Census. Moreover, disparities in territorial implementation reflected the limitations of the centralised model to respond to differentiated needs. While some states with greater institutional capacity complemented federal policies, others relied exclusively on national resources, generating inequalities in social protection coverage.
The Mexican experience of the pandemic shows both the advantage of having a pre-existing programme structure and the costs of prioritising continuity over flexibility. Although the articulation of programmes made it possible to sustain support to already targeted groups, the absence of specific emergency response mechanisms left unprotected sectors affected by the crisis without prior coverage in federal schemes (Martínez Espinoza and Ziccardi, Reference Martínez Espinoza and Ziccardi2023). This situation underlines the need to assess the adaptive capacity of social policies in the face of future contingencies.
Spain: Social protection and multilevel governance in the autonomous state
Spain faced the COVID-19 pandemic within the framework of its autonomous structure and its integration into the European Union, which posed additional challenges in managing the crisis. The strategy of Pedro Sánchez’s government combined mobility restrictions through the State of Alarm with a significant reinforcement of social protection, which highlighted the tensions of the multilevel governance model. In this sense, the state response was marked by inter-administrative coordination, which, although it allowed for a rapid regulatory adaptation, also exposed the difficulties of articulation between levels of government and the unequal management capacity in different autonomous communities (Arredondo Quijada and Macias León, Reference Arredondo Quijada and Macias León2022).
The impact of the pandemic on social exclusion and poverty was particularly severe in the second wave, with poverty peaking at 27.6% of the population in 2021 and extreme poverty at 8.1% in 2022. This deterioration particularly affected precarious workers, young people, and migrants, who experienced income reductions or lost access to formal protection mechanisms. In this context, the third sector assumed a fundamental role in emergency care, with organisations such as Caritas and the Red Cross registering increases in the demand for assistance of up to 60% compared to the pre-pandemic period (Morcillo Martinez, Reference Morcillo Martinez2022).
One of the fundamental pillars of the response was the massive implementation of Temporary Redundancy Programmes (ERTE), which reached their peak with 865,677 workers and 550,000 companies benefiting from them. Although this mechanism already existed in labour legislation, its adaptation in the context of the health emergency implied the relaxation of criteria and the exemption of employers’ social security contributions. However, the unprecedented volume of files processed generated significant delays in the payment of benefits, which highlighted the administrative overload and the need for urgent digitalisation of SEPE procedures (INAP, 2021).
The implementation of the Minimum Living Income (IMV) in June 2020 brought a structural change to Spain’s minimum income policy by establishing a guaranteed threshold at the state level. However, restrictive eligibility criteria, challenges in verifying requirements, and weak coordination with pre-existing regional programmes limited its initial effectiveness. These issues reduced expected coverage and created unequal access, depending on the administrative capacity of each autonomous community (Ocaña et al., Reference Ocaña, Bandrés, Chuliá, Fernández, Malo, Rodriguez and Torres2022).
The crisis also accelerated the digitalisation of social services and the implementation of new interoperability tools between administrations. However, this technological transformation was not without difficulties, as many vulnerable people lacked access or knowledge to use these new management channels. At the same time, the pressure on municipal services revealed territorial inequalities in institutional response capacity, which reinforced the need to strengthen articulation between levels of government and improve social policy planning in crisis contexts (Wolski, Reference Wolski2020).
In sum, the pandemic acted as a catalyst for institutional change, but it also revealed the limitations of social governance in Spain. While the ERTEs proved effective in preserving employment, the IMV exposed difficulties in its implementation that restricted its initial scope. The emergency highlighted the importance of flexible and well-coordinated protection systems, as well as the need to improve responsiveness in a multilevel governance scheme with marked regional disparities.
Comparative analysis of the implementation of emergency measures in the pandemic
General considerations
The COVID-19 pandemic posed an unprecedented challenge to social protection systems, testing multiple dimensions of state capacity. A comparative analysis of Argentina, Brazil, Mexico, and Spain during the first wave of contagion highlights how structural differences shaped both implementation strategies and outcomes, revealing patterns previously identified in the literature on policy implementation in crisis contexts. This integrated perspective shows that the effectiveness of social policy management during the crisis relied on a complex interaction between technical capacities, institutional coordination, and political decisions. The variations in outcomes indicate that no single factor guarantees successful implementation; rather, the coherence between state capacities, political leadership, and social protection architecture determines the effectiveness of crisis responses. The following section presents a comparative overview of social programme implementation in the four countries analysed (Table 2).
Comparative analysis of institutional capacity and COVID-19 response (2020)

Table 2. Long description
The table is organized into four main sections across columns for Argentina, Brazil, Mexico, and Spain.
1. Institutional structure:
- Population: Argentina 46 M, Brazil 214 M, Mexico 126 M, Spain 47 M.
- Government System: Presidential for Argentina, Brazil, and Mexico; Parliamentary for Spain.
- Territorial Organisation: Federal for Argentina (23 provinces), Brazil (26 states), and Mexico (32 states); Autonomous for Spain (17 regions).
- Welfare Regime: Protectionist (Argentina), Productivist (Brazil and Mexico), Universalist (Spain).
- H D I: Argentina 0.849 (Very High), Brazil 0.760 (High), Mexico 0.781 (High), Spain 0.911 (Very High).
2. State capacity:
- Bureaucratic Capacity: Medium (Argentina, Mexico), High (Brazil, Spain).
- Digital Infrastructure: High (Argentina, Brazil, Spain), Low (Mexico).
- Banking Infrastructure: Medium (Argentina), High (Brazil), Low (Mexico), Very High (Spain).
- Previous Social Programs: Strong (Argentina, Brazil, Spain), Medium (Mexico).
3. Pandemic response:
- New Benefits Created: Yes (Argentina, Brazil), No (Mexico, Spain).
- Leadership Style: Cooperative (Argentina), Confrontational (Brazil), Delegative (Mexico), Technocratic (Spain).
- Economic Impact: Severe over 9.9 percent (Argentina), Low 3.9 percent (Brazil), Severe 8.2 percent (Mexico), Severe 10.8 percent (Spain).
- Aid Management: High Centralization (Argentina, Brazil, Mexico), High Decentralization (Spain).
- Intergovernmental Coordination: High (Argentina, Spain), Low (Brazil, Mexico).
4. Health outcomes:
- Mobility Restrictions: Total over 80 percent (Argentina, Spain), Partial 40 to 80 percent (Brazil, Mexico).
- Deaths per 100 k: Argentina 288.68, Brazil 328.98, Mexico 260.73, Spain 255.54.
- Healthcare System Capacity: Medium (Argentina, Brazil), Low (Mexico), High (Spain).
Source: Own elaboration.
The comparison of institutional structures shows that, beyond the distinction between presidential (Argentina, Brazil, and Mexico) and parliamentary (Spain) systems, differences in welfare regimes were crucial. The universalist model in Spain and the protectionist model in Argentina demonstrated a greater capacity for institutional adaptation than the productivist schemes in Brazil and Mexico. This distinction is particularly reflected in the implementation infrastructure: while Spain exhibits a combination of high bureaucratic (high) and banking (very high) capacity, the Latin American cases show significant variations that conditioned their responsiveness. Leadership style during the crisis emerged as a determining factor in the effectiveness of implementation. Argentina’s cooperative and Spain’s technocratic models facilitated effective intergovernmental coordination (high), while Brazil’s confrontational and Mexico’s delegative style (both low) generated significant tensions in territorial articulation.
These structural differences shaped the scope of the implemented programmes. Brazil and Argentina reached massive coverage (62% and 59% of households, respectively) through new emergency programmes, while Spain, despite its robust institutional capacity, provided limited coverage with the MVI (1.2%), prioritising the protection of formal employment through ERTEs. Mexico, in contrast, maintained a strategy of programme continuity with reduced coverage (4.1%) (Table 3).
Emergency cash transfer programmes for the working-age population and unemployed during COVID-19 pandemic

Table 3. Long description
The table is divided into two main categories: New programmes and Existing programmes.
New programmes include:
* Argentina: Emergency Family Income for unemployed and informal workers. It reached 8,900,000 beneficiaries (one per family). Coverage was 19 percent of individuals and 59 percent of households (H H) with 3 payments in 2020.
* Brazil: Emergency Relief for adults 18 plus without formal employment and low family income. It reached 68,300,000 beneficiaries (max 2 per family). Coverage was 32 percent of individuals (I I) and 62 percent of households with 9 payments in 2020.
Existing programmes include:
* Mexico: Youth Building the Future for youth 18 to 29 not in education or employment. It reached 1,435,097 individuals. Coverage was 1.14 percent of individuals and 4.10 percent of households with 12 payments.
* Mexico: Tandas for Wellbeing for adults 30 plus with small businesses. It reached 495,988 individuals. Coverage was 0.38 percent of individuals and 1.40 percent of households with 10 payments.
* Spain: Minimum Living Income for vulnerable individuals. It reached 203,838 beneficiaries (one per family). Coverage was 0.43 percent of individuals and 1.20 percent of households with 12 payments per year.
Source: Own elaboration based on data from Palomo et al. (Reference Palomo, Vargas Faulbaum, Machado, Rolon, Veras Soares, Rubio and Escaroz2022), ECLAC, ANSES (Argentina), CONEVAL (Mexico), and INE (Spain). II, individuals; HH, households.
The increase in social spending showed divergent patterns that confirm Howlett et al.’s (Reference Howlett, Perl and Ramesh2021) theorisation of the tension between technical capacity and political will. The fiscal effort made during the crisis reflects these different approaches. Argentina and Brazil implemented the largest increases in social spending (3.5% and 4.8% percentage points of GDP, respectively), while Mexico maintained a modest increase (0.6%). The Spanish case is particularly illustrative: it doubled its public aid, but prioritised guarantees (93%) over direct transfers, evidencing a different conception of the state’s role in social protection during the crisis (Figure 2).
Change in central government spending on social protection in the years 2019–2020 countries studied (as % of GDP).
Source: Own elaboration based on CEPALSTAT and EUROSTAT data.

Figure 2. Long description
The vertical Y axis represents the percentage of G D P, ranging from 0 to 35 in increments of 5. The horizontal X axis lists four countries: Argentina, Brasil, Mexico, and Spain. A legend at the bottom indicates that light gray bars represent the year 2019 and dark gray bars represent the year 2020.
Data points from left to right:
* Argentina: Spending increased from 10.76 in 2019 to 14.28 in 2020.
* Brasil: Spending increased from 12.71 in 2019 to 17.47 in 2020.
* Mexico: Spending increased from 3.92 in 2019 to 4.49 in 2020.
* Spain: Spending increased from 23.95 in 2019 to 29.78 in 2020.
Spain has the highest overall spending in both years, while Mexico has the lowest.
Analysis of health spending reveals divergent priorities in the comprehensive response to the crisis. Spain and Argentina showed the most significant increases, reflecting a comprehensive approach to social protection. Brazil presents a notable peculiarity: it managed to implement massive transfers with a relatively modest increase in health spending, while Mexico maintained moderate increases in both dimensions despite the severity of the crisis (Figure 3).
Evolution of central government spending on health between 2007 and 2020 countries studied (as % of GDP).
Source: Own elaboration based on data from data.worldbank.org.

Figure 3. Long description
The x-axis represents years from 2007 to 2020. The y-axis represents the percentage of G D P ranging from 0 to 12.
* Spain is represented by a dotted line at the top of the graph. It starts near 8 percent in 2007, remains relatively stable around 9 percent through 2018, then rises sharply to 9.1 in 2019 and 10.7 in 2020.
* Brazil is represented by a dashed grey line. It shows a gradual upward trend starting below 2 percent in 2007 and rising to 2.2 in 2019 and 2.7 in 2020.
* Mexico is represented by a thin double-lined black line. It remains relatively flat, starting near 1 percent in 2007 and ending at 1.2 in 2020.
* Argentina is represented by a thick solid black line at the bottom. It follows a similar flat trajectory to Mexico, starting below 1 percent in 2007, dipping slightly to 0.8 in 2019, and ending at 1.2 in 2020.
The results in terms of COVID-19 mortality show the impact of these different capacities and implementation strategies. The correlation between intergovernmental coordination and health effectiveness is clear: Spain and Argentina, with greater coordination, recorded lower mortality rates (255.54 and 288.68 per 100,000) than Brazil (328.98), where federal tensions complicated the implementation of coordinated measures (Figures 4 and 5).
Number of confirmed COVID-19 cases and deaths in the countries studied (in millions of people).
Source: Own elaboration based on data from coronavirus.jhu.edu/data/mortality. The survey concluded on 3 October 2023.

Deaths from COVID-19 per 100 K inhabitants in countries surveyed.
Source: Own elaboration based on data from coronavirus.jhu.edu/data/mortality. The survey concluded on 3 October 2023.

The evolution of poverty indicators (Figure 6) presents complex results that challenge simplistic explanations. In Argentina, despite substantial fiscal efforts and extensive transfer coverage, poverty surged to 44.7% in 2020. Brazil, on the other hand, temporarily contained the rise in poverty through a large-scale emergency transfer programme. Spain maintained relatively stable poverty levels, largely due to the effectiveness of its labour protection mechanisms. Meanwhile, Mexico experienced a moderate decline, aligning with its strategy of maintaining existing social programmes rather than introducing large-scale emergency measures.
Evolution of the population in income poverty between 2008 and 2022 (as % of total population).
Source: Compiled by author based on data.worldbank.org.

Figure 6. Long description
The x-axis represents years from 2008 to 2023. The y-axis represents the percentage of the population in income poverty, ranging from 0 to 50 in increments of 5.
* Argentina (solid black line): Starts at 36.1 in 2008, fluctuates downward to a low of 24.4 in 2013, then rises sharply to 44.7 in 2020, ending at 44.7 in 2023.
* Brazil (dashed light gray line): Starts at 25.3 in 2008, trends downward to a low of 16.5 in 2014, fluctuates, and ends at 16.1 in 2023.
* Spain (dotted dark gray line): Starts at 23.8 in 2008, shows a gradual increase to 29.6 in 2015, and remains relatively stable, ending at 26.4 in 2023.
* Mexico (double-lined light gray): Starts at 43.0 in 2008, remains high until 2014, then drops significantly to 35.5 in 2018, before rising and then falling again to 28.8 in 2022.
* Latin America (solid dark gray line): Starts at 33.5 in 2008, trends slowly downward to 28.2 in 2014, then rises to 32.8 in 2020, ending at 27.4 in 2023.
Figure 7 reveals that extreme poverty followed similar patterns but with certain particularities. The impact of the crisis was particularly severe in Argentina, where extreme poverty increased from 6.7% in 2018 to 9.9% in 2020. Brazil maintained relatively stable levels at around 5%, while Mexico experienced an increase from 7.7% to 9.2% between 2018 and 2020. Spain, although at lower levels, also saw a progressive deterioration, reaching 8.1% in 2022.
Evolution of the population in extreme poverty 2008–2022 (as % of total population).
Source: Compilation based on data from CEPALSTAT, Observatorio de la Deuda Social Argentina and EUROSTAT.

Figure 7. Long description
The Y axis represents the percentage of the total population from 0 to 14. The X axis lists biennial years from 2008 to 2022.
* 2008: Argentina 8.2, Brazil 4.3, México 11.8, Spain 3.6, Latin America 9.1.
* 2010: Argentina 7.6, Brazil 4.3, México 12.7, Spain 4.9, Latin America 8.6.
* 2012: Argentina 6.1, Brazil 3.9, México 12.9, Spain 5.8, Latin America 8.2.
* 2014: Argentina 6.9, Brazil 3.3, México 13.0, Spain 7.1, Latin America 7.8.
* 2016: Argentina 6.6, Brazil 5.3, México 8.4, Spain 5.8, Latin America 9.8.
* 2018: Argentina 6.7, Brazil 5.6, México 7.7, Spain 5.4, Latin America 10.5.
* 2020: Argentina 9.9, Brazil 5.1, México 9.2, Spain 7, Latin America 13.2.
* 2022: Argentina 8.2, Brazil 5.3, México 6.2, Spain 8.1, Latin America 11.1.
Overall trends show México peaking in 2014 before a significant decline, while Latin America as a whole shows a general upward trend peaking in 2020. Spain shows a steady increase over the period.
The complexity of these institutional interactions – and the need to identify how specific configurations of state capacity shaped implementation outcomes – calls for a structured, qualitative comparative approach. This study analyses four country cases – Argentina, Brazil, Mexico, and Spain – using narrative synthesis, structured cross-case comparison, and tabular evidence. The analysis focuses on how distinct combinations of digital infrastructure, intergovernmental coordination, banking systems, and prior administrative experience conditioned the effectiveness of emergency cash transfer programmes. This methodological strategy enables the identification of causal patterns, strategic trade-offs, and context-specific implementation logics across diverse welfare and governance settings.
Implementation narratives and strategic logics
The four country cases reveal contrasting implementation logics, shaped by institutional capacity, political coordination, and welfare regime orientation. While all governments faced similar pressures to deliver emergency assistance rapidly and at scale, their responses diverged in strategic intent, administrative design, and operational outcomes.
In Argentina, the government responded with rapid digital innovation and centralized execution. The Ingreso Familiar de Emergencia (IFE) was deployed within 3 weeks of lockdown, reaching nearly 9 million beneficiaries. ANSES, the national social security agency, leveraged existing databases and developed new digital tools, including the creation of 4.8 million bank accounts for previously unbanked individuals. Political consensus across levels of government facilitated smooth coordination, enabling a swift rollout despite fiscal constraints. The Argentine model exemplifies how administrative innovation and cooperative governance can converge to produce high-speed, moderately inclusive emergency responses.
A similar emphasis on scale and digital infrastructure was evident in Brazil, though under markedly different political conditions. The Auxílio Emergencial reached over 68 million people, making it one of the largest emergency transfer programmes globally. Caixa Econômica Federal developed the Caixa Tem app to enable digital registration and payment, integrating with the Cadastro Único registry. Legislative leadership drove programme design, while the executive’s confrontational stance created coordination challenges. Despite technical success, the programme faced high error rates and fraud, reflecting the limits of implementation under fragmented federalism. Brazil’s case demonstrates how digital infrastructure and banking access can enable mass coverage, but political fragmentation undermines control and precision.
In contrast, Mexico adopted a markedly different approach, prioritizing programmatic continuity over emergency innovation. Rather than creating a new transfer scheme, the government expanded existing programmes under the Bienestar strategy, relying on the Censo del Bienestar and the Banco del Bienestar for delivery. While this ensured operational stability and preserved institutional routines, it excluded informal workers not previously registered and offered limited adaptability. The Mexican case illustrates the risks of institutional rigidity in crisis contexts, where continuity may come at the cost of responsiveness and inclusion.
Finally, Spain, operating within a universalist welfare regime and a complex multilevel governance structure, pursued a dual strategy: employment protection through ERTEs and targeted poverty assistance via the Ingreso Mínimo Vital (IMV). Strong digital and banking infrastructure supported precise targeting, but restrictive eligibility criteria and uneven regional capacities limited coverage. Spain’s model reflects a technocratic logic focused on sustainability and precision, rather than expansive emergency reach. While administratively sophisticated, its selective targeting approach constrained the programme’s ability to respond inclusively to the socioeconomic fallout of the pandemic.
Taken together, these narratives reveal four distinct implementation models: consensus-driven digital expansion (Argentina), federal technical innovation under legislative leadership (Brazil), institutional continuity with limited responsiveness (Mexico), and selective efficiency within a universalist regime (Spain). Each reflects a different configuration of state capacity and crisis governance, offering valuable insights into the conditions under which emergency social protection can be effectively deployed. These contrasting implementation logics can be further clarified through a comparative matrix that synthesizes both institutional capacities and observed outcomes. The following table presents the four country cases side by side, allowing for a structured assessment of how different configurations of state capacity translated into varying degrees of implementation effectiveness (Table 4).
Capacities and implementation outcomes

Table 4. Long description
The table consists of ten columns: Country, D C, I C, B I, P E, Speed, Coverage, Distribution, Adaptability, and S I score.
* Argentina: D C High, I C High, B I Med, P E High. Outcomes: Speed 2, Coverage 1, Distribution 1, Adaptability 1. S I score 5.
* Brazil: D C High, I C Low, B I High, P E High. Outcomes: Speed 2, Coverage 2, Distribution 2, Adaptability 1. S I score 7.
* Mexico: D C Low, I C Low, B I Low, P E Med. Outcomes: Speed 0, Coverage 0, Distribution 0, Adaptability 0. S I score 0.
* Spain: D C High, I C High, B I V High, P E High. Outcomes: Speed 1, Coverage 0, Distribution 1, Adaptability 2. S I score 4.
Note: Outcome scores range from 0 (low) to 2 (high) per dimension. The S I score is the sum of the four outcome dimensions.
Note: Scores range from 0 (low) to 2 (high) per dimension. SI score is the sum of the four.
Patterns, hypotheses, and strategic trade-offs
The comparative evidence lends strong support to the hypotheses outlined in Section “Variables and hypotheses”, offering a nuanced understanding of how institutional configurations shaped emergency policy outcomes.
First, the analysis confirms that high digital capacity combined with effective intergovernmental coordination tends to produce more successful implementation. Both Argentina and Spain exemplify this pattern, albeit with different emphases: Argentina prioritized broad coverage through centralized execution and digital expansion, while Spain focused on administrative precision and fiscal sustainability within a multilevel governance framework. Second, the findings reinforce the idea that banking infrastructure is a necessary but insufficient condition. Brazil and Spain both benefited from robust financial systems that enabled efficient transfer delivery, yet their outcomes diverged due to differences in coordination and targeting. Brazil’s fragmented federalism undermined control, while Spain’s technocratic targeting limited reach. Third, the hypothesis that prior experience can compensate for other limitations is only partially confirmed. Argentina and Brazil successfully leveraged institutional memory to scale rapidly, drawing on existing registries and programme expertise. In contrast, Mexico’s longstanding social programme infrastructure did not translate into adaptability, revealing that experience alone is not enough – it must be paired with flexible governance and political will.
Beyond these hypotheses, the analysis reveals a set of strategic trade-offs that shaped implementation trajectories:
-
▪ Speed versus control: Brazil achieved rapid scale through digital innovation, but faced high error rates and administrative inconsistencies. Argentina, by contrast, balanced speed with centralized oversight, mitigating operational risks.
-
▪ Coverage versus sustainability: Spain’s selective targeting and emphasis on employment protection reflected a deliberate choice to prioritize fiscal discipline over universal reach. This trade-off limited the programme’s inclusiveness but preserved long-term viability.
-
▪ Innovation versus stability: Mexico’s decision to reinforce existing programmes ensured institutional continuity, but came at the cost of responsiveness. The lack of new mechanisms constrained the state’s ability to address emergent vulnerabilities.
These trade-offs are not merely technical – they reflect deeper governance philosophies and regime logics. Argentina’s model was rooted in political consensus and administrative innovation, aiming for inclusion under fiscal constraint. Brazil relied on technical capacity to overcome political fragmentation, achieving scale but sacrificing control. Mexico emphasized stability and programmatic continuity, resisting emergency expansion. Spain pursued selective efficiency, aligning its response with a universalist welfare regime and multilevel administrative architecture.
Taken together, these findings underscore that successful emergency implementation is not the product of any single variable, but of the dynamic interplay between institutional capacity, political coordination, and strategic intent. The pandemic exposed both the strengths and limitations of existing welfare architectures, offering valuable lessons for the design of adaptive and resilient social protection systems in future crises.
Final remarks
The management of emergency aid during the first wave represented an enormous challenge for social protection systems, functioning as a natural experiment in policy implementation in crisis contexts. The comparative analysis of Argentina, Brazil, Mexico, and Spain reveals significant patterns that contribute both to the literature on state capacities and to the practical understanding of the management of social emergencies. The main finding of this paper is that pre-existing technological infrastructure emerged as a necessary but not sufficient condition for effective implementation, in line with Cingolani’s (Reference Cingolani2023) hypotheses on the importance of digital state capacity. Argentina and Brazil, with high technological capacity, managed to implement massive transfers (59% and 62% coverage), while Spain, despite its robust infrastructure, opted for a different strategy focused on protecting formal employment. Mexico, with technological limitations, maintained a continuist approach that significantly restricted its scope.
A second idea suggested by the evidence is that intergovernmental coordination, identified by Peters et al. (Reference Peters, Grin, Abrucio, Peters, Grin and Abrucio2021) as a critical factor in federal systems, proved to be a determinant in the effectiveness of responses. Argentina’s cooperative model and Spain’s technocratic model facilitated a more homogeneous implementation, reflected in lower mortality rates. In contrast, the Brazilian confrontational style and the Mexican delegative style generated tensions that complicated territorial articulation, validating the importance of leadership in multilevel coordination Cardozo (Reference Cardozo, Gutiérrez and María de Monserrat2021).
Third, the pre-existing social protection architecture, highlighted by Martínez Franzoni & Sánchez-Ancochea (Reference Martínez Franzoni and Sánchez-Ancochea2024), emerged as a crucial factor. The more developed welfare regimes showed greater adaptive capacity, although the Brazilian experience shows that institutional innovation can partially compensate for structural limitations, as suggested by Alves et al. (Reference Alves, Berniell and de la Mata2021). However, the implementation of emergency transfers for Argentina’s large informal sector highlights the structure of its labour market, where nearly half of all workers lack social protection – a pattern also present, though to a lesser extent, in Brazil. In contrast, Spain focused its response on measures targeting formal workers and indirect support, such as financial guarantees.
A fourth key point is that fiscal effort did not directly translate into effectiveness. This finding highlights the tension between efficiency and equity in resource allocation. Spain, despite a more contained fiscal expansion focused on guarantees, managed to stabilise poverty levels by protecting formal employment, underscoring the role of fiscal sustainability in emergency policies. In contrast, Argentina undertook a major fiscal effort with large-scale new transfers but struggled to curb poverty growth during the first wave of the pandemic.
Fifth, the crisis catalysed significant transformations in public management through the implementation of innovations aimed at improving beneficiary registries. These efforts mainly involved the construction of new targeting instruments, the adoption of alternative mechanisms to identify potential beneficiaries, the expansion of social information systems and protection registries, and the use of information and communication technologies. These developments strengthened information systems and enabled broader coverage of populations requiring support (Berner and Van Hemelryck, Reference Berner and Van Hemelryck2021), particularly in countries that introduced new emergency transfers such as Argentina and Brazil. However, they also exposed structural vulnerabilities related to financial inclusion and territorial inequalities, as highlighted by Chudnovsky and Peeters (Reference Chudnovsky and Peeters2020). Some of the innovations implemented during the crisis, analysed by Palomo et al. (Reference Palomo, Vargas Faulbaum, Machado, Rolon, Veras Soares, Rubio and Escaroz2022), included accelerated digitisation of public services, new verification and payment mechanisms, the adaptation of bureaucratic structures, and the creation of integrated monitoring systems. In this regard, previous research on conditional cash transfer programmes has shown that the establishment of clear eligibility rules, monitoring systems, and administrative infrastructures can strengthen transparency and credibility in the allocation of social benefits (De La O, Reference De La O2015), reinforcing the institutional foundations of social protection systems.
Finally, this study contributes to the literature on crisis policy implementation by demonstrating that the effectiveness of emergency social policies cannot be explained by a single determinant. Rather, it emerges from the interaction between multiple forms of state capacity, including technological infrastructure, institutional coordination, banking and administrative systems, and strategies aimed at incorporating historically unprotected populations. By shifting the analytical focus from the political determinants of policy expansion to the institutional mechanisms that shape policy implementation, the study opens the “black box” of emergency policy execution and highlights how different configurations of state capacity condition the effectiveness of crisis responses.
In this sense, the findings suggest that governance models capable of responding effectively to large-scale crises must combine strategic centralisation with territorial flexibility, enabling coordinated yet adaptive responses across different levels of government. Institutional innovation – such as the rapid digitalisation of administrative processes, the expansion of social registries, and new mechanisms of intergovernmental coordination – can partially compensate for structural limitations when supported by effective political leadership and robust administrative cooperation. These dynamics illustrate how crises can act not only as stress tests for state capacity but also as catalysts for institutional experimentation and learning.
Data availability statement
Data will be available on request.
Acknowledgements
The author would like to thank Ricardo Velázquez Leyer, Gibrán Cruz-Martínez, and Theodoros Papadopoulos for their valuable comments and suggestions during the seminar, where an earlier version of this paper was discussed. Their insights greatly contributed to improving the arguments presented in this article. Any remaining errors are the sole responsibility of the author.
Funding statement
The author did not receive support from any organization for the submitted work.
Disclosure statement
The author declares none.

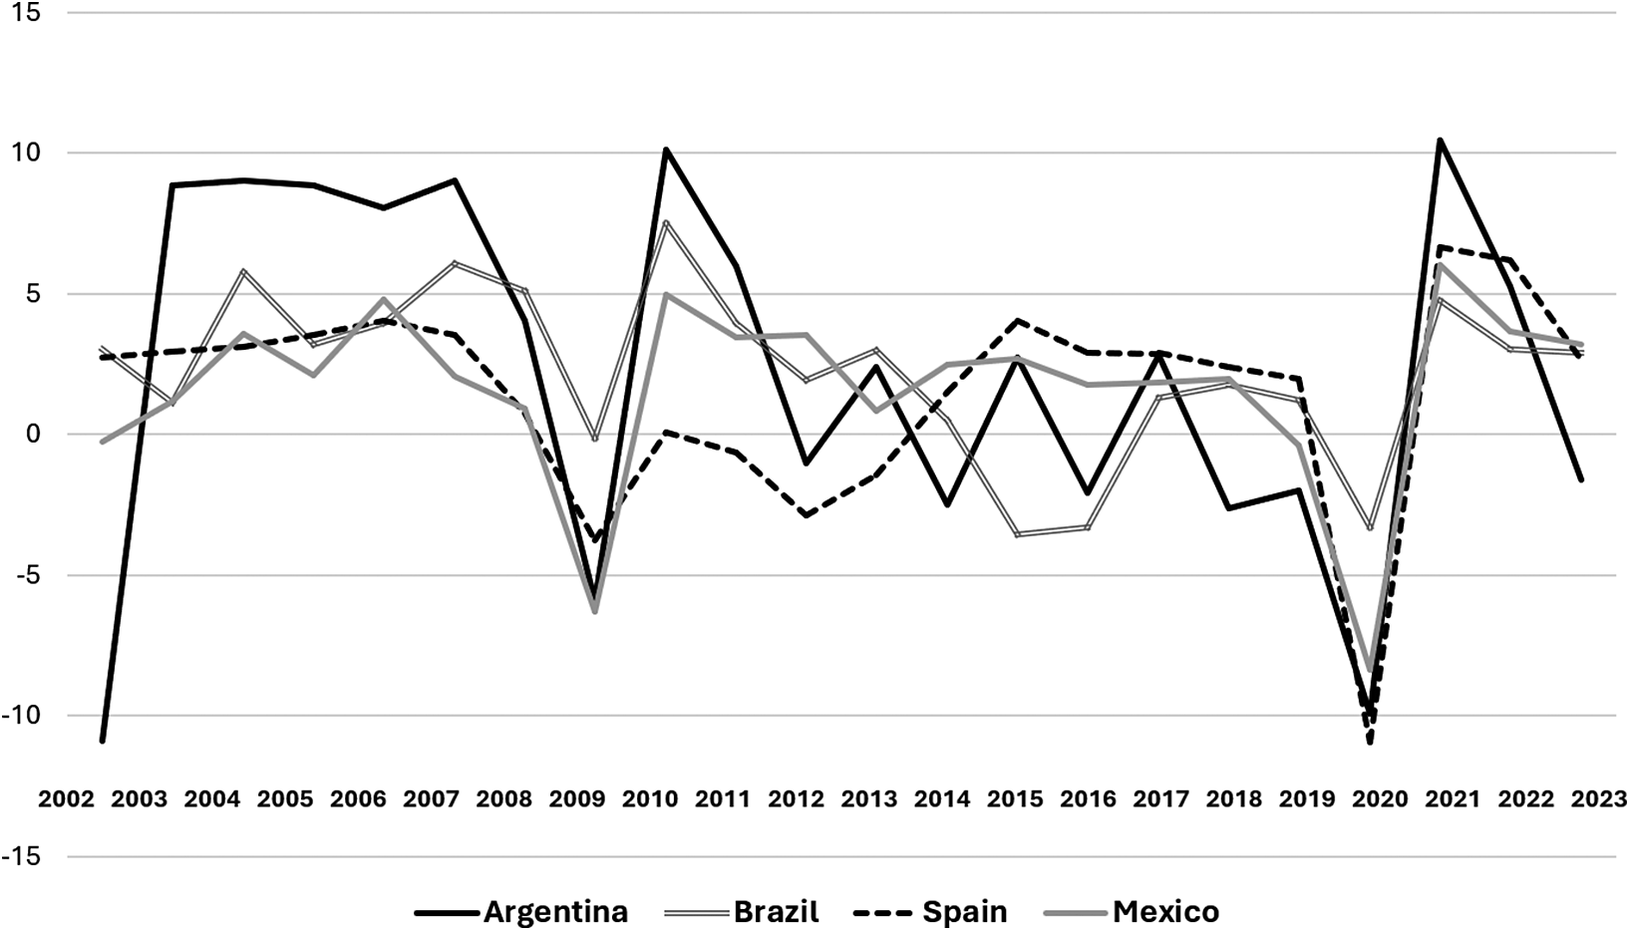


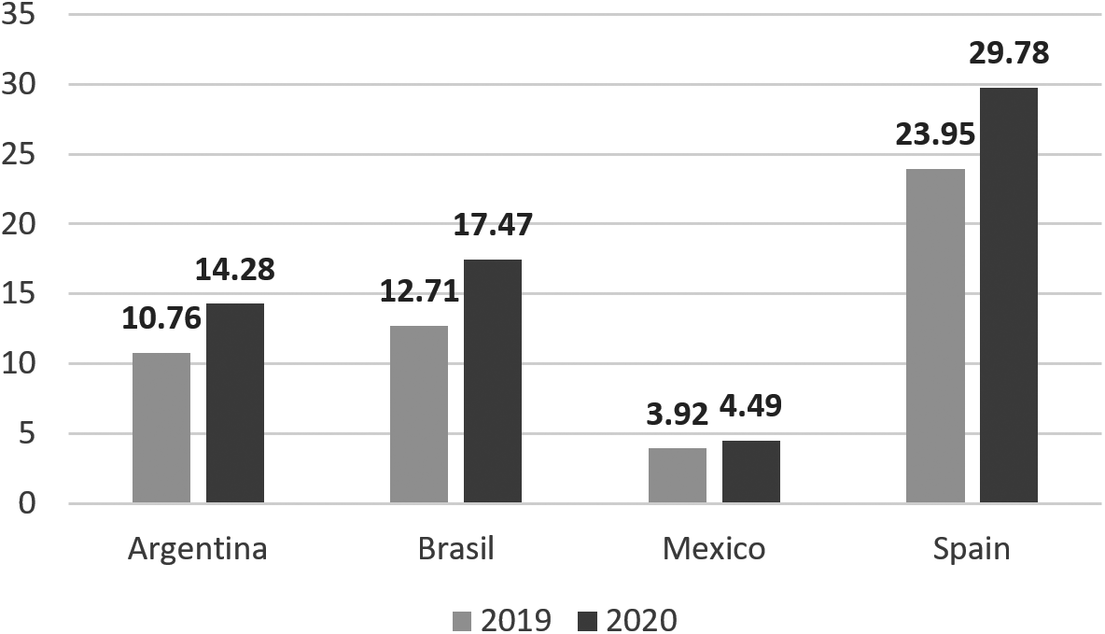
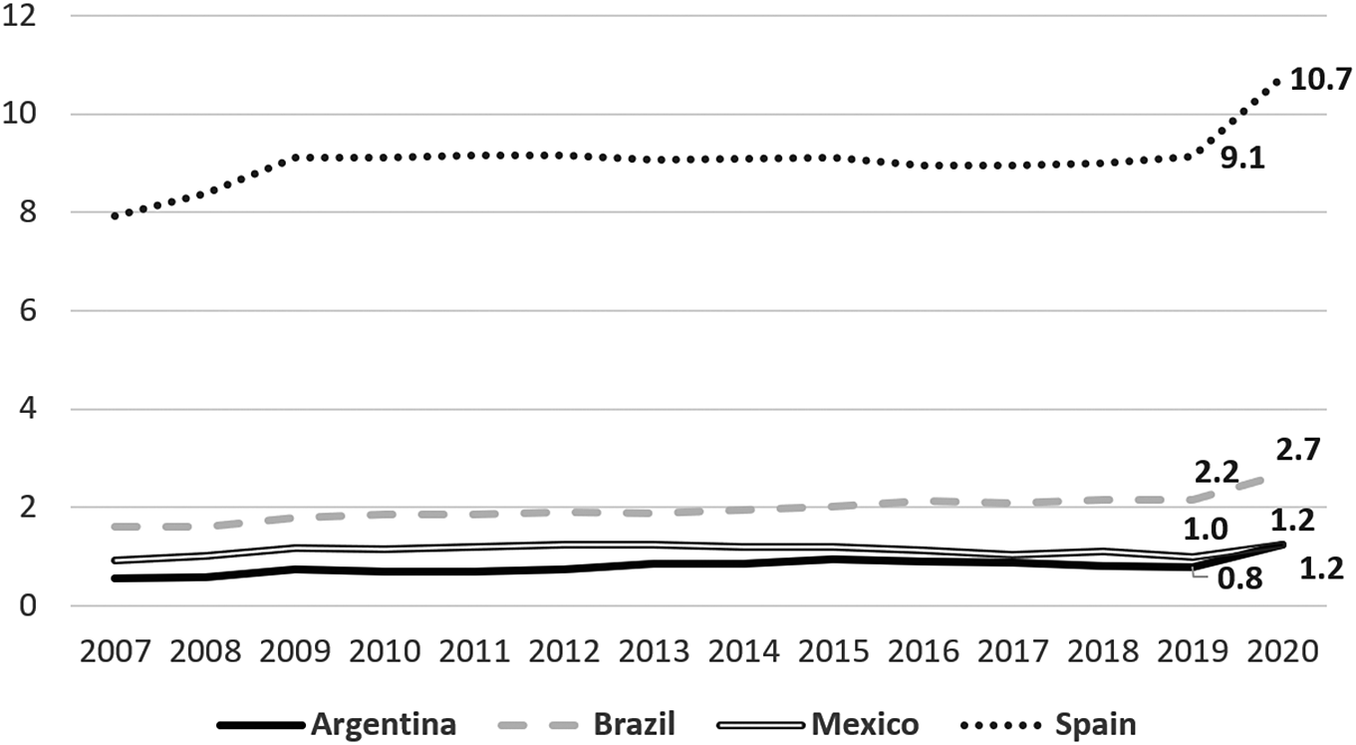
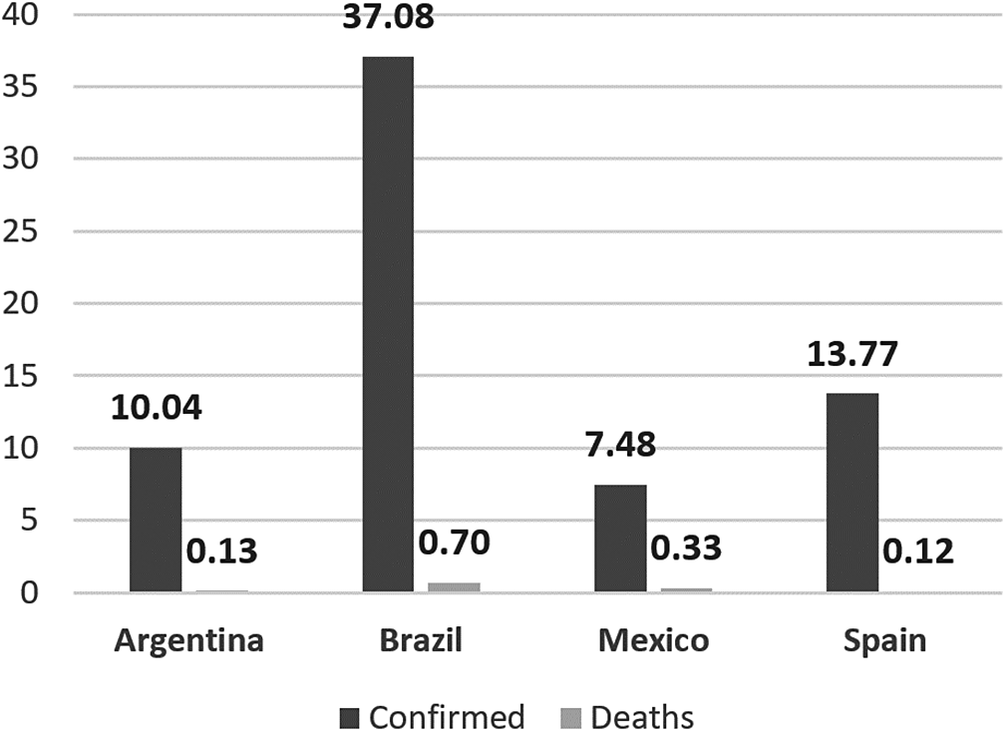

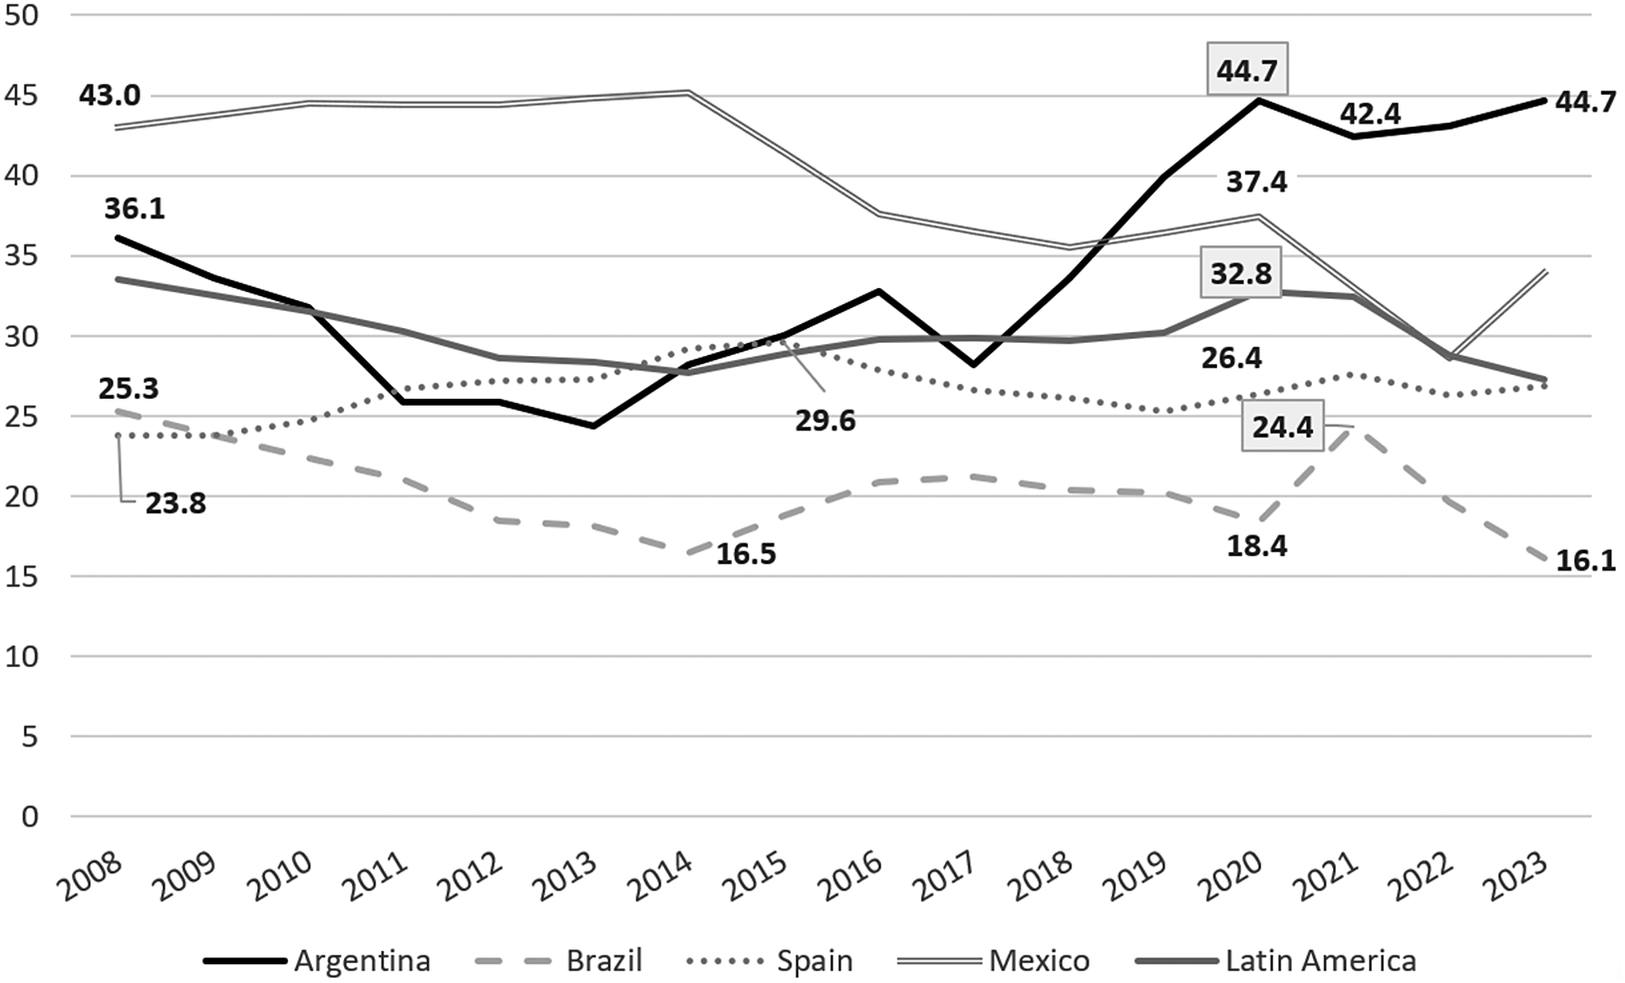

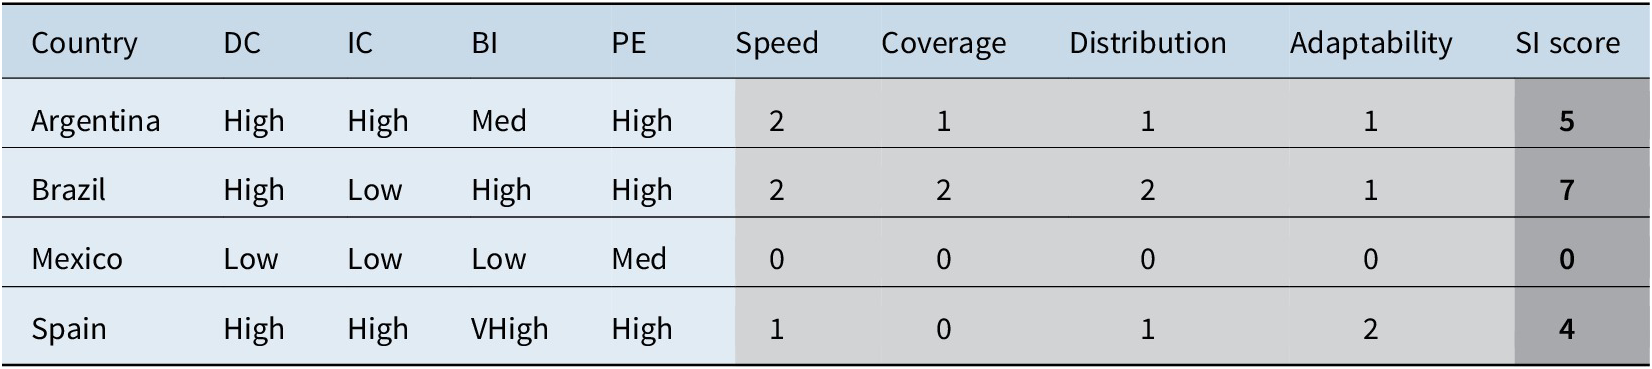

 Open access

