

1. Introduction
Despite high heritability, most complex traits and diseases in humans have such a polygenic inheritance pattern that prediction of phenotype or liability on the basis of genetic risk profile has proven elusive. The possible benefits of genetic risk evaluation were recognized more than a decade ago (Collins et al., Reference Collins, Green, Guttmacher and Guyer2003; Bell, Reference Bell2004; Wray et al., Reference Wray, Goddard and Visscher2008), but only recently has the application of high-density genotyping technology (Khoury et al., Reference Khoury, Jones and Grosse2006) brought us closer to the goal. Polygenic scores, which represent the summed effects of multiple trait-associated genetic variants, contain more information than single markers and explain more of the variance in phenotype or disease risk. This type of analysis has been applied to several complex traits including height (Lango Allen et al., Reference Lango Allen, Estrada, Lettre, Berndt, Weedon, Rivadeneira, Willer, Jackson, Vedantam and Raychaudhuri2010), body mass index (BMI) (Stahl et al., Reference Stahl, Wegmann, Trynka, Gutierrez-Achury, Do, Voight, Kraft, Chen, Kallberg and Kurreeman2012) and rheumatoid arthritis (Speliotes et al., Reference Speliotes, Willer, Berndt, Monda, Thorleifsson, Jackson, Allen, Lindgren, Luan and Magi2011), in each case evaluating the joint effects of polymorphisms identified in samples of tens or even hundreds of thousands of individuals, in large validation cohorts of several thousands.
Most cohort studies are focused on a single trait or condition, so do not allow the evaluation of genetic risk across multiple phenotypes. Here we report on common variant contributions to three traits and three diseases in the Emory-Georgia Tech Center for Health Discovery and Well Being study of clinically deeply profiled adults, 182 of whom have whole genome genotype information available. Despite the relatively small size of the cohort, we nevertheless detect significant association with quantitative traits, and take the opportunity to compare methods that do or do not weigh allelic effects, while also comparing genetic risk scores with Framingham risk scores for coronary artery disease (CAD) and type 2 diabetes (T2D). Examination of the correlations highlights the strong influence of outliers on risk prediction, and raises the hope that in a well-characterized cohort it may be possible to identify the hidden variables that are shared by such outliers, which may in turn suggest strategies for conditional analysis to uncover more of the hidden heritability.
Some studies have also reported that most of the variation explained by polygenic risk scores can actually be explained by the top-ranked markers (Kang et al., Reference Kang, Kugathasan, Georges, Zhao and Cho2011; Peterson et al., Reference Peterson, Maes, Holmans, Sanders, Levinson, Shi, Kendler, Gejman and Webb2011). The rationale is that the top-ranked markers tend to have the largest genetic effects; so explain more of the disease or trait than markers that only emerge once large-scale meta-analyses have been performed. The proportion of variance that they explain will be a function of the distribution of effect sizes, which is itself difficult to estimate due to the high noise level in genome-wide association study (GWAS) data. Therefore, the risk attributable to top-ranked SNPs is an empirical question, and our dataset allows us to address performance across phenotypes in the same individuals. We applied forward-step regression adding alleles sequentially to investigate the influence of adding more marker information to the regression on explaining the genetic variance. It turns out that in small cohorts, the inclusion of covariates such as gender and ethnicity, influences performance of genetic risk scores, presumably because of residual correlation between genotype and those covariates. While the detection of positive genotype–phenotype associations in a small study is encouraging, the results also highlight the limited clinical potential of risk scores based on common variants identified in genome-wide association studies (Kraft & Hunter, Reference Kraft and Hunter2009).
2. Materials and methods
(i) Participants
The CHDWB is a longitudinal study of health measures in over 600 employees of Emory University. We describe data for 182 participants for whom genotypic data were available, consisting of 136 Caucasians, 34 Africans, 11 Asians and one American Indian. Two-thirds of the individuals were women (120 females and 62 males), and the ages ranged from 26 to 79. The data of interest for this study are height (in cm), BMI (weight/height2 in kg/m2), serum triglyceride levels (mg/dl), serum cholesterol levels (mg/dl) and various measures of blood flow and arterial stiffness. We also computed Framingham risk scores for T2D and for CAD as described in Wilson et al. (Reference Wilson, Meigs, Sullivan, Fox, Nathan and D'Agostino2007) and D'Agostino et al. (Reference D'Agostino, Vasan, Pencina, Wolf, Cobain, Massaro and Kannel2008).
(ii) Genotypes
Whole genome genotypes were measured using Illumina OmniExpress arrays. Identities of 169 height, 49 BMI, 48 triglyceride, 34 CAD, 66 T2D and 31 asthma-related SNPs listed in Supplementary Table S1 (available at http://journals.cambridge.org/grh) were collected from the dbGaP database. All of the selected SNPs were previously reported to be significantly associated with the respective traits or diseases at the significance level of P < 10−7. Individual genotypes for each of these SNPs were extracted, or if missing from the Illumina genotype data files, were imputed using IMPUTE2 (Howie et al., Reference Howie, Marchini and Stephens2011). Accuracy of the imputation was estimated to be 98% by comparison with nine individual whole genome sequences (two African Americans, seven Caucasians – GG, unpublished) as indicated in Supplementary Table S2 (available at http://journals.cambridge.org/grh).
(iii) Genetic risk score analyses
Three approaches to calculating the proportion of phenotypic variance explained by the common genetic variants were considered. All computations were performed using R scripts. For the continuous quantitative traits height, BMI and triglyceride level, we first calculated the sum of increasing alleles for each individual. Second, we calculated a weighted sum of allelic effects according to the effect size of each SNP reported in dbGaP. Each of these allelic sum and weighted allelic effect scores was then linearly regressed on the relevant phenotype(s), with or without adjustment for gender and ethnicity. In the latter case, the genotypic contribution was estimated from the difference in the variance explained (R-squared) by the models including the genetic risk (allelic sum or weighted allelic effect) score and without it. Furthermore, the influences of gender and ethnicity were estimated directly from our cohort by including these terms as covariates; or by incorporating reported population averages for each gender and ethnicity from the CDC website as ‘pre-height’.
For disease risk variants, the third approach was to compute the odds ratio essentially as described in Ashley et al. (Reference Ashley, Butte, Wheeler, Chen, Klein, Dewey, Dudley, Ormond, Pavlovic and Morgan2010). We computed an adjusted relative genetic risk by setting each individual's prior odds as that corresponding to the prevalence for their gender and ethnicity as reported by the CDC. In order to obtain the genetic contribution to the post-test odds, a slight adjustment to the Ashley et al. (Reference Ashley, Butte, Wheeler, Chen, Klein, Dewey, Dudley, Ormond, Pavlovic and Morgan2010) method was performed as follows. According to those authors, pre-test odds = pre-test probability/(1 − pre-test probability), post-test odds = pre-test odds × likelihood ratio (LR) and post-test probability = post-test odds/(1 + post-test odds). Rearranging their equations, post-test probability = pre-test probability × LR/(1 + pre-test probability × (LR − 1)). As the reported 95% confidence intervals for genotypic contribution LRs lie between 1·6 and 0·7, pre-test probabilities range between 4·2 and 14·3%, then post-test probabilities range from (0·93∼1·04) × pre-test probability × LR. It follows that we can approximate the post-test probability as the pre-test probability × LR (thus log10(post-test probability) = log10(pre-test probability) + log10(LR)). We confirmed this relationship by observing that this approximated post-test probability is highly significantly linearly associated with the post-test probability using Ashley et al.'s method (P < 2 × 10⁻¹⁶). Our partitioning allows estimation of the genetic contribution to the post-test probability independent of the pre-test probability.
In order to ask whether addition of more SNPs continuously improves risk prediction, the SNPs were sorted by previously reported effect sizes from larger to smaller. Each SNP was added sequentially to the regression model, taking the negative log10P-value and percent variance explained by each successive model. For comparison with the random SNP selection, we randomly sorted the SNPs 100 times and averaged the results of these permutations.
3. Results
(i) Regression of genotypic risk scores on phenotypes
Significant and positive regression of genotype on phenotype was observed, as expected, for each of the continuous traits, height, BMI and serum triglycerides as shown in Table 1. In each case, the estimated variance explained by the SNPs is in the range of 3–5%, which is lower than that reported in the respective discovery samples (Lango Allen et al., Reference Lango Allen, Estrada, Lettre, Berndt, Weedon, Rivadeneira, Willer, Jackson, Vedantam and Raychaudhuri2010; Teslovich et al., Reference Teslovich, Musunuru, Smith, Edmondson, Stylianou, Koseki, Pirruccello, Ripatti, Chasman and Willer2010; Speliotes et al., Reference Speliotes, Willer, Berndt, Monda, Thorleifsson, Jackson, Allen, Lindgren, Luan and Magi2011). The inclusion of estimated effect size in weighted sum scores did not significantly improve the model fitting. For each of these traits, gender and ethnicity explains considerably more of the variance than the genotypes, and fitting these covariates slightly improved the estimate of the genetic contribution (with the exception of the weighted sum for BMI). The weighted sum was not calculated for triglycerides since the effect sizes are not fully reported in dbGaP. We also fit multiple regression models based on all of the SNPs for each trait, and although the variance explained reached 16% for height the estimates were not significant after adjustment for the number of SNPs included.
Variance explained by genetic risk scores

Regressions were also computed for disease-associated risk scores, namely: T2D risk with the Framingham T2D risk score, and with serum triglyceride, cholesterol, fasting glucose and insulin levels; CAD risk with the Framingham CAD risk score, blood pressure, arterial stiffness and serum metabolites; and asthma risk with estimated VO2-max from treadmill performance. Only two of these analyses (CAD SNPs with Framingham CAD risk score and with cholesterol) yielded nominally significant correlations as reported in Table 1, and these would not formally survive adjustment for multiple comparisons. Nevertheless, for CAD, the total number of increasing alleles shows a somewhat surprising positive relationship with the total cholesterol levels, given that there is little overlap between these SNPs and those associated with cholesterol by GWAS.
Table 1 shows that the regression of genotypic risk scores on phenotypes was little affected by considering only the Caucasians. The proportion of variance explained by SNPs for triglycerides and CAD was slightly increased relative to the full cohort, probably due to better capture of LD between tagging and causal SNPs in Caucasians, but this effect is offset by the smaller sample size for other traits.
(ii) Effect of number of alleles on risk prediction
Step forward regression, sequentially adding SNPs in the order of previously reported effect size, was performed to address whether the addition of more SNPs to the model continuously improves the prediction. Figure 1 shows the results for height, BMI and cholesterol on the left-hand panels, compared with average effects for 100 randomly permuted orders of SNP addition on the right-hand panels. In each case, explanatory power of the SNPs increases at least for the first 30 SNPs included in the model.
Left: The percentage of variance explained by the model by sequentially adding SNPs in the order of their effect sizes (height, BMI and cholesterol-CAD SNPs from top to bottom, (a), (c) and (e)). Right: The percentage of variance explained by the models randomly adding SNPs (height, BMI and cholesterol-CAD SNPs from top to bottom, (b), (d) and (f)) averaged over 100 permutations. SA refers to models with just the sum of alleles score, while eg_SA refers to models additionally fitting ethnicity and gender as covariates with the sum of alleles score. WS refers to models with sum of weighted allelic effects, while eg_WS and pre_WS refer to weighted allelic sum includng ethnicity and gender in the CHDWB cohort, or taken as the population averages, as covariates respectively. LR refers to likelihood ratio models, with or without pre-test probability as a covariate. Variance explained (%) refers only to the genetic contribution in each model.
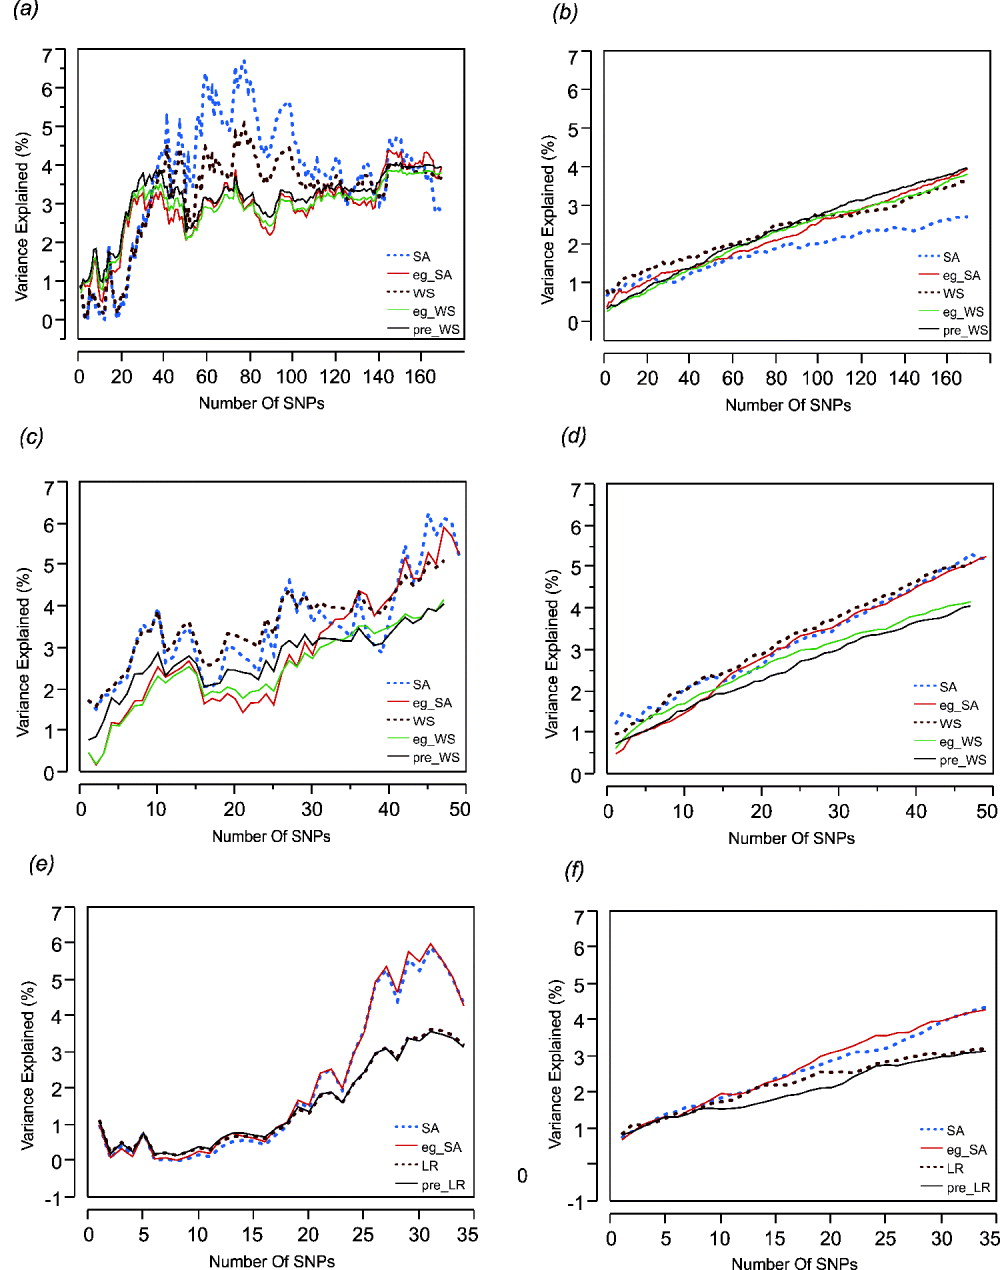
For height (Figs 1 a and b) it is also clear that most of the variance is explained by the top 30 SNPs and that sequential addition up to 169 SNPs does not improve the fit. Models without gender and ethnicity covariates (blue and brown curves) actually explained the most variance when an intermediate number of SNPs were selected. However, since inclusion of more SNPs reduced the estimates to levels more consistent with those obtained when gender and ethnicity are included, the scores with intermediate numbers of SNPs are likely to be overestimates. For BMI (Figs 1 c and d), there is a suggestion of a plateau effect after 10 SNPs, without a clear further increase until 40 SNPs are included in the model. In this case, fitting gender and ethnicity does not affect the genetic estimates. For CAD (Figs 1 e and f), significant explanation is not observed until 30 SNPs are included, but there may be a plateau thereafter, and the estimates are not obviously influenced by inclusion of the covariates. For BMI and cholesterol, the weighted sum (or likelihood ratio) scores performed slightly less well than the simple allelic sum predictors.
(iii) Effect of outliers on explanatory power
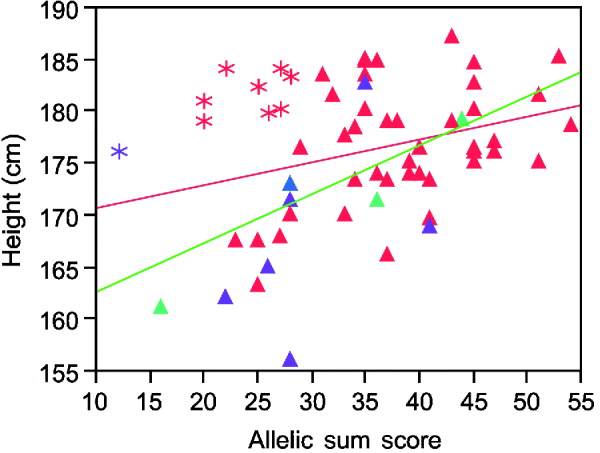
Inspection of the regression plots in Fig. 2 suggests the estimated variance explained can be strongly influenced by outliers. Thus, the sum of alleles test for height in males shows several men who grow taller than their genetic information predicts (asterisks in Fig. 2). Except for one Asian, all of these men were Caucasians. Excluding their data improves the per cent variance explained from 8 to 37%.
Linear regression plot fitting real height by sum of increasing alleles in males. Red symbols Caucasians; blue American Indian; green African Americans; purple Asians. Asterisks, the individuals who are taller than their genetic information would indicate. Red line, regression fitting line for all men. Green line, regression fitting line for males without those taller than the expected men.
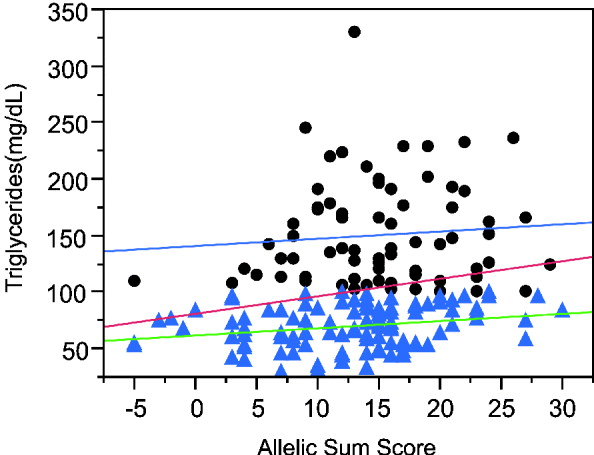
The sum of alleles test plot for triglycerides (TG) (Fig. 3) appears to differ between higher and lower triglyceride levels. If the analysis is restricted to individuals with TG more than 100 mg/dl, the genotypes explain a trivial 0·5% of the variance, while regression on the remaining individuals with lower TG has a similar slope but explains 5·3% of the variance. The increased phenotypic variance in the high triglyceride range reduces the significance of the overall regression even though the slope is greater than in either the low or high TG ranges. Moreover, the association is more significant in Caucasians than other ethnicities and more significant in males than females.
Linear regression plot fitting total triglyceride levels by sum of increasing alleles. Dots: triglyceride levels greater than 100 mg/ml. Triangles, triglyceride levels lower than 100 mg/ml. Red line, linear regression fitting line for all the individuals (P = 0·0053, R 2 = 0·042). Blue line, linear regression fitting line for individuals with TG levels higher than 100 mg/ml (P = 0·5453, R 2 = 0·005). Green line, linear regression fitting line for individuals with lower TG levels (P = 0·0169, R 2 = 0·053).
For BMI (Supplementary Fig. S1c, available at http://journals.cambridge.org/grh), the weighted sum regression plot suggests that the genotypes are more strongly associated with the BMI in African Americans than Europeans. While weighted sum of effects account for 17% of BMI variation in African Americans, the effects only explain 3% of BMI variation in Caucasians. The high variance explained in African Americans is plausibly an overestimate due to the small sample.
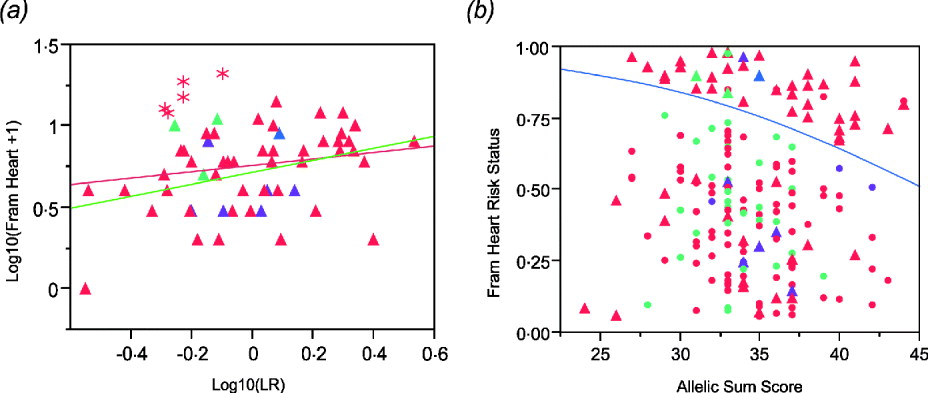
The regression plot for logarithm transformation of Framingham heart disease risk score and likelihood ratio for CAD SNPs in males shows that there are five Caucasian males (asterisks in Fig. 4 a) who have higher Framingham risk scores than expected. They are all older than the average male. Exclusion of those five males results in a more significant association (Fig. 4 a). In addition, we set Framingham risk status as 0 and 1 based on the Framingham risk scores (0 when FRS <4; 1 when FRS ≧4). The logistic regression shows a significant association between Framingham risk status and sum of CAD risk alleles (Fig. 4 b), but the area under the receiver operating characteristic (ROC) curve is just 0·60, indicating that this is not a clinically useful predictor (Fan et al., Reference Fan, Upadhye and Worster2006).
(a) Regression of log10(Framingham Risk Score for heart disease) against genotypic log likelihood in males. Exclusion of five older Caucasian males indicated with asterisks elevates the regression from non-significant (P = 0·18, R 2 = 0·03) to nominally significant (P = 0·0065, R 2 = 0·13). (b) Logistic regression of Framingham risk status on sum of CAD risk alleles in all study participants shows a significant association. (P = 0·0221, R 2 = 0·027). Red symbols, Caucasians; blue, American Indian; green, African Americans; purple, Asians. Circles females, Triangles males.
(iv) Stability of height predictions to number of included SNPs
We also re-estimated each person's height predictors (allelic sum score and weighted allelic effect score) from the average of 100 bootstrap samples of 50, 75 and 100 SNPs. The estimates are all highly correlated (Spearman's rank correlation coefficient ρ > 0·99) and explain almost the same percentage of variance for height. Similarly, the BMI predictors from the average of 100 bootstrap samples of 30, 40 and 49 SNPs are also highly correlated and contribute similarly to the BMI variance. This suggests that the increased estimated variance explained for intermediate number of SNPs in height and for more than 40 SNPs in BMI is probably just noise contributing false-positive signal. A corollary is that while it is tempting to include all available SNPs in a model, this is not necessarily guaranteed to yield the most accurate predictor, since, for example, had we only had the top 80 SNPs for height available, more variance is explained than is reasonable given the stepwise increments expected for each additional SNP. Conversely, the addition of the last 10 SNPs has markedly reduced the proportion of variance explained using just the allelic sum score for height, suggesting that more stable predictors might sometimes be obtained by considering a range of numbers of included SNPs.
4. Discussion
According to our results, genotypes ascertained for the most part in large GWAS meta-analyses are somewhat predictive of the relevant traits in our small study cohort of typical residents of Atlanta, Georgia. In general, however, the amount of variance explained is smaller than expected, and for CAD and T2D the genotypes are not significant predictors of individual disease status. Approximately 4% of height variance was explained by the 169 SNPs whether using sum of increasing alleles or using weighted sum of effects. This contrasts with 10·5% of adult height variance (using sum of effects method) being explained by 180 SNPs in the analysis of 133 653 individuals (Lango Allen et al., Reference Lango Allen, Estrada, Lettre, Berndt, Weedon, Rivadeneira, Willer, Jackson, Vedantam and Raychaudhuri2010). The 700-fold decrease in sample size may contribute to the halving of the variance explained, since inspection of the data suggests that a small fraction of outliers (taller than expected men) strongly influence the regression. Additionally, the Atlanta cohort is ethnically diverse, and covers three generations that would have experienced very different socio-economic conditions during growth. On the other hand, it is surprising that the amount of variance in BMI explained by our 49 SNPs is similar to the 4·1% of variance in BMI that is accounted for by 56 variants in a 3600 sample discovery cohort (Peterson et al., Reference Peterson, Maes, Holmans, Sanders, Levinson, Shi, Kendler, Gejman and Webb2011). The heritability of BMI is considerably lower than that of height, and gender and ethnic differences are strong, yet the genotypic risk score is more consistent than that for height.
In comparison with the recorded 10% triglyceride variance explained by common SNPs (Johansen & Hegele, Reference Johansen and Hegele2012), the 48 SNPs in our study explained just 4·5% of triglyceride variation. An unexpected finding was that approximately 4·3 and 3·2% of the variation of total cholesterol levels could be attributed to the 34 CAD-related SNPs, performing sum of increasing alleles and multiplication of likelihood ratios, respectively. This is the same order of magnitude of explanation as height and BMI, both of which are due to SNPs discovered for the respective trait. The CAD SNPs are related to all forms of CAD, including atherosclerosis, which is certainly related to cholesterol levels, but there is no obvious enrichment in the SNPs for cholesterol metabolism. Correspondingly, variation in the Framingham risk score is also partially explained by the likelihood ratio score from the CAD-related SNPs, at a level only slightly less than the 4% explained in Peden & Farrall (Reference Peden and Farrall2011).
Weighting the allelic effects by the effect sizes reported on dbGaP did not notably improve the prediction of height, BMI, triglycerides or cholesterol. This is perhaps not surprising since there is large variance in the estimation of effect sizes, and to some extent including them in the model adds as much noise as it does signal. In addition, the effect sizes recorded in dbGaP were obtained from the studies that are usually composed of one specific ethnicity (generally European). Even in a few studies whose samples contain more than one ethnicity, the compositions are different from ours. For example, Gudbjartsson et al. (Reference Gudbjartsson, Walters, Thorleifsson, Stefansson, Halldorsson, Zusmanovich, Sulem, Thorlacius, Gylfason and Steinberg2008) recorded effect sizes for 35 of our height SNPs in a study composed of 25 174 Icelanders, 2876 Dutch, 1770 European Americans and 1148 African Americans, which is obviously different from the ethnicity composition in our study, 19% African American and 6% Asian. These differences in ethnicity composition could result in the different effect sizes of the SNPs, further reducing the accuracy of the weighted allelic effect scores. It should also be recognized that reduced linkage disequilibrium in Africans is expected to decrease the proportion of causal effects captured by tagging SNPs, which will tend to reduce the variance explained in the full model.
The identification of subsets of outlier individuals who do not fit the general correlation between genotype and phenotype has implications both for improved estimation of individual genetic effects, and also for prediction. To the extent that shared properties of such individuals can be identified, those properties can be considered as covariates in statistical models, either as regular environmental effects or sources of genotype-by-environment interaction. This conclusion is prima facie at odds with arguments that G × E is unlikely to contribute strongly to explained genetic variance (Hill et al., Reference Hill, Goddard and Visscher2008) or prediction (Aschard et al., Reference Aschard, Chen, Cornelis, Chibnik, Karlson and Kraft2012), but formally interactions such as those implied in Fig. 2 are between the environmental property shared by the outliers, and the genotypic risk score, rather than with single genotypes. Since the risk score is the sum of 30 or more effects, individual genotype-by-environment interactions can be small, and if they only affect a few individuals, they will not make a substantive contribution to risk averaged across the population.
One of the conundrums of predictive health genetics is that it is by now well appreciated that the variants that exceed GWAS thresholds only explain a small fraction of the heritability (Kraft & Hunter, Reference Kraft and Hunter2009; Manolio et al., Reference Manolio, Collins, Cox, Goldstein, Hindorff, Hunter, McCarthy, Ramos, Cardon and Chakravarti2009), and yet there is widespread intention to use these variants to classify individuals with respect to disease risk. A possible rationale for this can be seen in the result that most of the genetic signal is actually due to the SNPs with the strongest effect sizes. This is clearly the case for height, and to some extent triglycerides and cholesterol, although we do not yet have data on whether the addition of a further 100 SNPs would improve the BMI prediction. Intuitively, if effect sizes are Poisson-distributed, then the contributions of the top 30 SNPs are likely to be much greater than those of the next 100 SNPs, which may just tend to cancel one another out and contribute noise. While whole genome regression methods show that inclusion of undiscovered variants can improve genetic prediction (Yang et al., Reference Yang, Benyamin, McEvoy, Gordon, Henders, Nyholt, Madden, Heath, Martin, Montgomery, Goddard and Visscher2010; Makowsky et al., Reference Makowsky, Pajewski, Klimentidis, Vazquez, Duarte, Allison and de los Campos2011), our results suggest that for individually ascertained SNPs, the top few dozen variants will often be as good as the top few hundreds. Although they only explain a small fraction of the variance, in keeping with individually small effect sizes, it is nevertheless notable that the effects are significant across multiple traits even in a cohort of fewer than 200 people.
The generation of genotypes was funded by start-up funds to GG from the Georgia Tech Research Institute. JZ was partially supported by NIH award R01-HL085481. The Center for Health Discovery and Well-Being is funded jointly by Emory University and Georgia Institute of Technology. We are particularly grateful to Jennifer Vazquez and Lynn Cunningham for administrative and managerial support.
5. Supplementary material
The online data can be found available at http://journals.cambridge.org/GRH


