


1. Introduction
In recent decades, there has been a pronounced shift from employer-sponsored defined benefit (DB) pension plans to participant-driven defined contribution (DC) plans (Dahlquist et al., Reference Dahlquist, Setty and Vestman2018). While DC participants manage their contributions and investment choices, many, due to inertia or limited financial literacy, lean toward strategies like fund delegation (Christiansen & Steffensen, Reference Christiansen and Steffensen2018). Given the complexity of financial markets, the allure of delegating investments to professionals has grown. Foundational insights on investment delegation were offered by Sharpe (Reference Sharpe1981), with comprehensive literature reviews by Stracca (Reference Stracca2006) and Inderst & Ottaviani (Reference Inderst and Ottaviani2012). Although mutual funds’ delegated investments have been well studied (e.g., Huang et al., Reference Huang, Qiu and Yang2020; Wu et al., Reference Wu, Wermers and Zechner2016), there is a notable gap in literature on pension fund delegation. This gap is evident within DC plans, largely due to the limited availability of pension fund return data. While studies such as Blake et al. (Reference Blake, Rossi, Timmermann, Tonks and Wermers2013) and Rossi et al. (Reference Rossi, Blake, Timmermann, Tonks and Wermers2018) have explored DB funds, our research delves into a less explored domain, placing a unique emphasis on examining the value-add of delegated investment in the DC pension fund realm. Moreover, Kim et al. (Reference Kim, Maurer and Mitchell2016) analyze investment delegation in the DC fund setting and model investment delegation simply by adding management fee costs and removing financial decision-making time costs. In contrast, we model the agency risk inherent in external fund delegation by allowing the fund manager to have a separate objective function. Furthermore, with fund delegation, we consider both active fund investment and passive fund investment scenarios.
Our research question centers on whether a DC plan participant should craft an investment strategy or delegate it to a fund manager while allowing for the existence of agency risk in the latter. We evaluate optimal investment, consumption trajectories, and retirement outcomes for utility-driven workers within a life cycle model. Drawing from recent DC investment trends, such as those highlighted by The Vanguard Group (2022), our model encompasses four primary investment options favored by DC participants: delegation to a passive fund manager, delegation to an active fund manager, dynamic self-investment, and deterministic self-investment.
In delegated investment, contemporary trends underscore a growing preference among workers for broader, risk-imbued investment opportunities, especially those offering leveraged exposure. This inclination enhances the allure of delegated investments (Hitzemann et al., Reference Hitzemann, Sokolinski and Tai2022). Recognizing this trend, we model the passive fund manager with broader allocation constraints to risky assets. In addition, acknowledging the significant impact of a manager’s stock-picking skill (De Franco, Reference De Franco2021), the active fund management will gauge its influence. Hence, rather than explicitly modeling the detailed knowledge and expertise of the fund managers, we aim to proxy the superior investment expertise of managers through the outcomes of different investment delegations, such as better risk-adjusted returns for active management and broader allocation constraints for passive management. Moreover, following the trends and fund mandates highlighted in previous research (e.g., Covrig et al. Reference Covrig, Lau and Ng2006), the manager’s decisions in our model are driven by investment targets. Consequently, within the delegated investment framework, the workers make consumption decisions based on a utility-based objective value function and the managers perform delegated investment with reference to a target-driven objective value function.
Regarding other investment avenues, dynamic self-investment offers flexibility, allowing workers actively tailor their own portfolios based on utility-based objectives. This caters to individual risk profiles and investment horizons. Thus, workers can determine their consumption and investment choices based on the same utility-based objective function. In contrast, deterministic self-investment, typical of life cycle or target date funds, features a “glide path” (Forsyth et al. Reference Forsyth, Vetzal and Westmacott2019). This strategy is marked by age-dependent asset shifts. It begins with a high proportion of risky assets and, as retirement approaches, transitions to safer assets. This aligns risk exposure with the proximity to retirement (Khemka et al. Reference Khemka, Tang and Warren2021). Hence, under this option, workers only need to decide on consumption based on the utility-based objective function.
For each investment strategy, we optimize financial decisions during the fund accumulation phase. To streamline our model, we posit that post-retirement expenditures are financed by converting the accumulated DC fund into a life annuity at retirement in the vein of Butt & Khemka (Reference Butt and Khemka2015) and Donnelly et al. (Reference Donnelly, Khemka and Lim2022). Adopting a constant relative risk aversion (CRRA) utility, recognized for its mathematical properties and its widespread use in various studies like Menoncin & Regis (Reference Menoncin and Regis2020), we model utility derived from both ongoing consumption and the eventual annuity purchase. Calibrated with US data, our model employs numerical dynamic programming to determine optimal decisions. Inspired by Kim et al. (Reference Kim, Maurer and Mitchell2016), and based on the corresponding forward simulation results, we calculate key metrics such as certainty equivalents and extra management fees to compare the lifetime utility outcomes of the investment options. To this end, we aim to quantify the value-add that render different fund delegation strategies and self-management strategies comparable.
Our findings indicate that fund delegations yield superior retirement outcomes compared to self-managed investments. In the case of passive fund management, the advantage of investment flexibility allows for the adoption of more aggressive strategies, fostering higher risk-adjusted returns and thereby boosting fund accumulations. Conversely, in active fund management, the benefit of better stock-picking skills enables managers to embrace a better expected risk premium, thus enhancing retirement outcomes. However, the benefit diminishes once management fees, such as the average US passive fund fee rate of 0.4% per annum reported by Morningstar Manager Research (2022) in 2021, are factored in. In such scenarios, dynamic self-investment emerges as the top choice, followed by delegated investments, with deterministic investment lagging behind. Given the agency costs coupled with management fees, our analysis suggests caution against opting for fund delegation in the presented context. Furthermore, our sensitivity analysis reveals that, when determining the fund delegation, it is important to consider not only the investment objective and the fee expense but also key factors such as investment constraints (e.g., short-selling and borrowing) and stock-picking ability (e.g., manager’s alpha estimate). Overall, our findings carry significant implications for individual workers, offering insights on selecting fund investment options and making fund delegation decisions.
Our study also intersects with two other strands of literature. The first strand pertains to life cycle modeling for optimal portfolio formation applied to the individual households. Building on the foundational work of Samuelson (Reference Samuelson1969), there have been numerous extensions, integrating various life cycle choices such as housing (Flavin & Yamashita, Reference Flavin and Yamashita2011; Marekwica et al. Reference Marekwica, Schaefer and Sebastian2013), labor supply (Chai et al., Reference Chai, Maurer, Mitchell and Rogalla2011; Menoncin & Regis, Reference Menoncin and Regis2020), and annuitization (Horneff et al., Reference Horneff, Maurer and Stamos2008; Maurer et al., Reference Maurer, Mitchell, Rogalla and Kartashov2013). For an extensive overview of these developments in portfolio choice over the life cycle, see Gomes (Reference Gomes2020). However, limited research has extended the basic life cycle model to account for tax implications and contribution limits to DC funds. Love (Reference Love2007) and Gomes et al. (Reference Gomes, Michaelides and Polkovnichenko2009) investigate the effects of having tax-deferred retirement accounts on savings decisions and stock market participation. Horneff et al. (Reference Horneff, Maurer and Mitchell2020) apply the progressive taxation and withdrawal rules to a 401(k) retirement saving account with a focus on evaluating the worker’s optimal demand for annuities. Differing from Horneff et al. (Reference Horneff, Maurer and Mitchell2020)’s research focus, our study broadens this literature through investigating the added value of delegated investment to a worker’s lifetime utility. As a contribution in this field, we employ a discrete-time life cycle model within a Stackelberg game framework, a setting that has precedence in investment literature as observed in Han et al. (Reference Han, Rong, Shen and Zhao2021). The specifics of our application are detailed further in Section 2.2, capturing the dynamic of delegation between workers and fund managers.
The second literature strand focuses on numerical dynamic programming methods, where dynamic programming facilitates sequential decision-making (Khemka & Butt Reference Khemka and Butt2017). The value function iteration (VFI) method stands out due to its adaptability in solving diverse economic problems, such as retirement planning (Butt et al., Reference Butt, Khemka and Warren2022), principal-agent problem (Renner & Schmedders, Reference Renner and Schmedders2020), and business cycles (Heutel, Reference Heutel2012). Our distinctive contribution to the application of VFI in retirement planning is utilizing VFI to optimize lifetime financial decisions, notably by integrating the Stackelberg game setting into delegated fund investment.
The remainder of this paper is structured as follows. Section 2 introduces the specific research problem and outlines the method and data. Section 3 presents the results and discussions. Section 4 concludes and drafts future directions. Further technical details are relegated to the appendices.
2. Model formulation and analysis
Consider a discrete-time retirement planning problem for a worker, who earns a yearly income and finally retires with purchasing an annuity being equivalent to her ultimate retirement saving balance. In this retirement saving problem, the worker not only needs to determine the optimal consumption strategy for reward by herself but also faces four distinct and irrevocable options for choosing her optimal investment strategy:
-
(i) Self-management with dynamic investment (S): actively self-managing her fund;
-
(ii) Self-management with benchmark investment (B): passively self-managing her fund by following a benchmark allocation strategy (e.g., an investment strategy from a target date fund);
-
(iii) Hire-management with flexible allocation ( $\text{H}_1$
): delegating fund management to a professional fund manager with a flexible allocation, allowing extended limits for risky asset investment;
$\text{H}_1$
): delegating fund management to a professional fund manager with a flexible allocation, allowing extended limits for risky asset investment; -
(iv) Hire-management with alpha focus (
$\text{H}_2$
): delegating fund management to a professional fund manager who possesses distinct stock-picking skill and aims to attain higher risk-adjusted expected returns.


2.1 The basic formulation
We model an individual worker who saves for retirement benefits during the accumulation phase from the work-entry age $x_0$
(i.e.,
$x_0$
(i.e., $t=0$
) to the retirement age
$t=0$
) to the retirement age $Y = x_0 + T$
(i.e.,
$Y = x_0 + T$
(i.e., $t=T \gt 0$
). For simplicity, assume the worker lives until retirement with certainty. The yearly positive constant compensation
$t=T \gt 0$
). For simplicity, assume the worker lives until retirement with certainty. The yearly positive constant compensation $e \gt 0$
will be paid at the beginning of each year (i.e., at time
$e \gt 0$
will be paid at the beginning of each year (i.e., at time $t=0,1,\dots, T-1$
). At the start of each year, the worker sets aside a portion of acquired compensation for consumption (i.e.,
$t=0,1,\dots, T-1$
). At the start of each year, the worker sets aside a portion of acquired compensation for consumption (i.e., $W_t \in [0,e]$
) and contributes the remaining portion of annual compensation (i.e.,
$W_t \in [0,e]$
) and contributes the remaining portion of annual compensation (i.e., $e - W_t \in [0,e]$
) to her retirement saving fund. It is worth noting that any income not invested in the retirement fund is fully consumed by the worker, and thus investing liquid savings in the worker’s bank account is not considered in this paper but can be incorporated easily with a slight extension on the formulation and results. In addition, the yearly contribution is subject to a government-mandated non-negative contribution limit
$e - W_t \in [0,e]$
) to her retirement saving fund. It is worth noting that any income not invested in the retirement fund is fully consumed by the worker, and thus investing liquid savings in the worker’s bank account is not considered in this paper but can be incorporated easily with a slight extension on the formulation and results. In addition, the yearly contribution is subject to a government-mandated non-negative contribution limit $\overline{B}_t \geq 0$
(i.e.,
$\overline{B}_t \geq 0$
(i.e., $e - W_t \leq \overline{B}_t$
). This implies that
$e - W_t \leq \overline{B}_t$
). This implies that $W_t \geq \underline{W}_t$
, where
$W_t \geq \underline{W}_t$
, where $ \underline{W}_t = e- \overline{B}_t$
.
$ \underline{W}_t = e- \overline{B}_t$
.
Moreover, we assume that there are only two assets available in the financial market: one risk-free asset (with constant annual risk-free return $r\gt 0$
) and one risky asset (with annual stochastic return
$r\gt 0$
) and one risky asset (with annual stochastic return $R_{t+1}$
,
$R_{t+1}$
, $t=0,1,\dots, T-1$
), in line with Christiansen & Steffensen (Reference Christiansen and Steffensen2018). The annual return of the risky asset generates a natural filtration which is denoted as
$t=0,1,\dots, T-1$
), in line with Christiansen & Steffensen (Reference Christiansen and Steffensen2018). The annual return of the risky asset generates a natural filtration which is denoted as $\mathbb{F}=\left \{\mathcal{F}_t\right \}_{t=0}^{T}$
, with
$\mathbb{F}=\left \{\mathcal{F}_t\right \}_{t=0}^{T}$
, with $\mathcal{F}_0$
being a trivial one. At each period
$\mathcal{F}_0$
being a trivial one. At each period $[t,t+1]$
(where
$[t,t+1]$
(where $t=0,1,\dots, T-1$
), the worker first makes the tax-deferred contribution
$t=0,1,\dots, T-1$
), the worker first makes the tax-deferred contribution $e-W_t$
to her retirement saving fund and then determines the continuous proportion of the fund invested in the risky asset
$e-W_t$
to her retirement saving fund and then determines the continuous proportion of the fund invested in the risky asset $\pi _t\in \left [\underline{\pi }_t,\overline{\pi }_t\right ]$
, where
$\pi _t\in \left [\underline{\pi }_t,\overline{\pi }_t\right ]$
, where $\underline{\pi }_t$
and
$\underline{\pi }_t$
and $\overline{\pi }_t$
are deterministic limits of the investment strategy, which can be time-specific. For instance,
$\overline{\pi }_t$
are deterministic limits of the investment strategy, which can be time-specific. For instance, $\underline{\pi }_t$
and
$\underline{\pi }_t$
and $\overline{\pi }_t$
can be set as 0 and 1, respectively. Under each of the aforementioned investment options (i.e., S, B,
$\overline{\pi }_t$
can be set as 0 and 1, respectively. Under each of the aforementioned investment options (i.e., S, B, $\text{H}_1$
, and
$\text{H}_1$
, and $\text{H}_2$
), the risky asset allocation
$\text{H}_2$
), the risky asset allocation $\pi _t$
is determined over time, reflecting the unique objectives of each option.
$\pi _t$
is determined over time, reflecting the unique objectives of each option.
For time $t=0,1,\dots, T$
, we denote
$t=0,1,\dots, T$
, we denote $M_t$
as the worker’s fund balance at time
$M_t$
as the worker’s fund balance at time $t$
prior to the fund injection. Hence, the worker’s retirement saving fund dynamic can be shown as below:
$t$
prior to the fund injection. Hence, the worker’s retirement saving fund dynamic can be shown as below:
 \begin{equation} \begin{aligned} M_0=&\;0,\\ M_{t+1}=&\;\left (M_t+e-W_t\right )\times \left (1+\left (1-\pi _t\right )r+\pi _t R_{t+1}\right ),\;t=0,1,\dots, T-1. \end{aligned} \end{equation}
Furthermore, for $t=0,1,\dots, T-1$
, the contribution amount
$t=0,1,\dots, T-1$
, the contribution amount $e-W_t$
is tax-deferred due to the retirement planning encouragement, while the consumption amount
$e-W_t$
is tax-deferred due to the retirement planning encouragement, while the consumption amount $W_t$
is taxable (i.e.,
$W_t$
is taxable (i.e., $W_t$
is regarded as pre-tax consumption). Here, we denote
$W_t$
is regarded as pre-tax consumption). Here, we denote $\tau\; :\; \mathbb{R}_+\rightarrow \mathbb{R}_+$
as the income taxation function proposed by the government, and the actual annual consumption amount is given by
$\tau\; :\; \mathbb{R}_+\rightarrow \mathbb{R}_+$
as the income taxation function proposed by the government, and the actual annual consumption amount is given by $W_t - \tau (W_t)$
(i.e.,
$W_t - \tau (W_t)$
(i.e., $W_t - \tau (W_t)$
is treated as post-tax consumption). Assume that the taxation follows a
$W_t - \tau (W_t)$
is treated as post-tax consumption). Assume that the taxation follows a $n$
-fold progressive system, in the way that there exist marginal tax rates
$n$
-fold progressive system, in the way that there exist marginal tax rates $J_1,J_2,\dots, J_n$
, with
$J_1,J_2,\dots, J_n$
, with $0\lt J_1\lt J_2\lt \dots \lt J_n\lt 1$
, and thresholds
$0\lt J_1\lt J_2\lt \dots \lt J_n\lt 1$
, and thresholds $K_1,K_2,\dots, K_{n-1}$
, with
$K_1,K_2,\dots, K_{n-1}$
, with $0\lt K_1\lt K_2\lt \dots \lt K_{n-1}$
, such that, for any
$0\lt K_1\lt K_2\lt \dots \lt K_{n-1}$
, such that, for any $i=1,2,\dots, n$
, and
$i=1,2,\dots, n$
, and $w\in \mathbb{R}_+$
, if
$w\in \mathbb{R}_+$
, if $K_{i-1}\leq w\leq K_i$
, then we have the corresponding income taxation function:
$K_{i-1}\leq w\leq K_i$
, then we have the corresponding income taxation function:
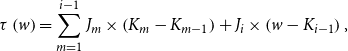 \begin{equation} \tau \left (w\right )=\sum _{m=1}^{i-1}J_m\times \left (K_m-K_{m-1}\right )+J_i\times \left (w-K_{i-1}\right ), \end{equation}
with the conventions that $\sum _{m=1}^{0}J_m\times \left (K_m-K_{m-1}\right )=0$
,
$\sum _{m=1}^{0}J_m\times \left (K_m-K_{m-1}\right )=0$
, $K_0=0$
, and
$K_0=0$
, and $K_n=\infty$
.
$K_n=\infty$
.
2.2 The optimization problems
Assume the worker is risk-averse with an increasing concave utility function $u(\!\cdot\!)$
representing her satisfaction derived from the yearly post-tax consumption. To model the worker with risk aversion preference, we incorporate the CRRA utility function in the worker’s objective function. Based on the formulated problem, the objective functions will be shown in the following subsections, depending on the investment strategy option selected by the worker.
$u(\!\cdot\!)$
representing her satisfaction derived from the yearly post-tax consumption. To model the worker with risk aversion preference, we incorporate the CRRA utility function in the worker’s objective function. Based on the formulated problem, the objective functions will be shown in the following subsections, depending on the investment strategy option selected by the worker.
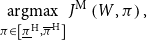
2.2.1 Self-management with dynamic investment (S)
Under this circumstance, the worker can actively self-manage her retirement fund without external financial guidance. Thus, we have the following objective function for the worker at time $t=0$
:
$t=0$
:
 \begin{equation} J^{\text{W}}\left (W,\pi \right )=\mathbb{E}\left [\sum _{t=0}^{T-1}\beta ^{t}\times u\left (W_t-\tau \left (W_t\right )\right ) +\beta ^{T}\times u\left (\frac{M_{T}}{\ddot{a}_{Y}^{\left (r\right )}}-\tau \left (\frac{M_{T}}{\ddot{a}_{Y}^{\left (r\right )}}\right )\right )\times \ddot{a}_{Y}^{\left (\beta \right )}\right ], \end{equation}
where
-
•
$\beta \in \left [0,1\right ]$
is a subjective discount factor; -
•
$u(W)=\frac{W^{1-\rho }}{1-\rho }$
is the CRRA utility function with the coefficient of relative risk aversion
$\rho$
; -
•
$\ddot{a}_{Y}^{\left (r\right )}$
is the fair price of an annuity due, with
$\$1$
annual payments starting from the time of retirement
$T$
at her age
$Y$
, based on the risk-free rate
$r$
; -
•
$\ddot{a}_{Y}^{\left (\beta \right )}$
is the fair price of the annuity due based on the subjective discount factor
$\beta$
.


In this context, the term $\beta ^{T}\times u\left (\frac{M_{T}}{\ddot{a}_{Y}^{\left (r\right )}}-\tau \left (\frac{M_{T}}{\ddot{a}_{Y}^{\left (r\right )}}\right )\right )\times \ddot{a}_{Y}^{\left (\beta \right )}$
represents the utility of post-tax annuity income during retirement transformed into its capital equivalent. Specifically,
$\beta ^{T}\times u\left (\frac{M_{T}}{\ddot{a}_{Y}^{\left (r\right )}}-\tau \left (\frac{M_{T}}{\ddot{a}_{Y}^{\left (r\right )}}\right )\right )\times \ddot{a}_{Y}^{\left (\beta \right )}$
represents the utility of post-tax annuity income during retirement transformed into its capital equivalent. Specifically, $\frac{M_{T}}{\ddot{a}_{Y}^{\left (r\right )}}$
converts the accumulated retirement wealth
$\frac{M_{T}}{\ddot{a}_{Y}^{\left (r\right )}}$
converts the accumulated retirement wealth $M_T$
into an annuity income stream based on the risk-free rate
$M_T$
into an annuity income stream based on the risk-free rate $r$
. The term
$r$
. The term $\tau \left (\frac{M_{T}}{\ddot{a}_{Y}^{\left (r\right )}}\right )$
accounts for taxes on this income, to reflect the non-tax-exempt status of post-retirement income in the USA.
$\tau \left (\frac{M_{T}}{\ddot{a}_{Y}^{\left (r\right )}}\right )$
accounts for taxes on this income, to reflect the non-tax-exempt status of post-retirement income in the USA.
To transform this post-tax annuity income into its capital equivalent, we adjust it by the subjective discount factor $\beta$
, which reflects the worker’s personal time preference for consumption. The factor
$\beta$
, which reflects the worker’s personal time preference for consumption. The factor $\beta ^T$
discounts the future utility back to time
$\beta ^T$
discounts the future utility back to time $T$
, and
$T$
, and $\ddot{a}_{Y}^{\left (\beta \right )}$
provides the present value of this annuity income based on
$\ddot{a}_{Y}^{\left (\beta \right )}$
provides the present value of this annuity income based on $\beta$
. Therefore, the product
$\beta$
. Therefore, the product $\beta ^T \times \ddot{a}_{Y}^{\left (\beta \right )}$
serves as a capital equivalent factor, converting the future utility of the annuity income into its present value in the worker’s objective function. Appendix A provides a more detailed derivation of Equation (3).
$\beta ^T \times \ddot{a}_{Y}^{\left (\beta \right )}$
serves as a capital equivalent factor, converting the future utility of the annuity income into its present value in the worker’s objective function. Appendix A provides a more detailed derivation of Equation (3).
For time $t=0,1,\dots, T-1$
, in terms of the investment constraints, the worker’s investment allocation
$t=0,1,\dots, T-1$
, in terms of the investment constraints, the worker’s investment allocation $\pi _t$
subjects to the deterministic limits
$\pi _t$
subjects to the deterministic limits $\underline{\pi }^{\text{S}}_t$
and
$\underline{\pi }^{\text{S}}_t$
and $\overline{\pi }^{\text{S}}_t$
. Then in this case, the optimal pre-tax consumption and investment allocation strategies of the worker
$\overline{\pi }^{\text{S}}_t$
. Then in this case, the optimal pre-tax consumption and investment allocation strategies of the worker $\left (W^{\text{S},*},\pi ^{\text{S},*}\right )\in \left [\underline{W},e\right ]\times \left [\underline{\pi }^{\text{S}},\overline{\pi }^{\text{S}}\right ]$
can be given by:
$\left (W^{\text{S},*},\pi ^{\text{S},*}\right )\in \left [\underline{W},e\right ]\times \left [\underline{\pi }^{\text{S}},\overline{\pi }^{\text{S}}\right ]$
can be given by:
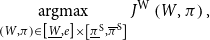 \begin{equation} \mathop{\textrm{argmax}}_{\left(W,\pi\right)\in\left[\underline{W},e\right]\times\left[\underline{\pi}^{\text{S}},\overline{\pi}^{\textrm{S}}\right]}J^{\textrm{W}}\left(W,\pi\right), \end{equation}
where $J^{\text{W}}$
function is shown in (3).
$J^{\text{W}}$
function is shown in (3).
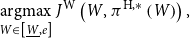
2.2.2 Self-management with benchmark investment (B)
In this case, the worker invests deterministically with reference to a defined benchmark (i.e., $\pi _t^T$
) and determines annual pre-tax consumption amount
$\pi _t^T$
) and determines annual pre-tax consumption amount $W_t$
based on the same objective value function
$W_t$
based on the same objective value function $J^{\text{W}}$
as in (3) (for any
$J^{\text{W}}$
as in (3) (for any $t=0,1,\dots, T-1$
).
$t=0,1,\dots, T-1$
).
Based on some deterministic target date fund’s strategy $\pi ^T_t$
, for
$\pi ^T_t$
, for $t=0,1,\dots, T-1$
, the deterministic limits (
$t=0,1,\dots, T-1$
, the deterministic limits ( $\underline{\pi }^{\text{B}}_t$
and
$\underline{\pi }^{\text{B}}_t$
and $\overline{\pi }^{\text{B}}_t$
) of the investment strategy satisfy that
$\overline{\pi }^{\text{B}}_t$
) of the investment strategy satisfy that $\underline{\pi }^{\text{B}}_t=\overline{\pi }^{\text{B}}_t=\pi ^T_t$
. Hence, for any
$\underline{\pi }^{\text{B}}_t=\overline{\pi }^{\text{B}}_t=\pi ^T_t$
. Hence, for any $t=0,1,\dots, T-1$
, the investment strategy of the worker (i.e.,
$t=0,1,\dots, T-1$
, the investment strategy of the worker (i.e., $\pi ^{\text{B}}$
) is given by
$\pi ^{\text{B}}$
) is given by $\pi ^{\text{B}}_t=\pi ^T_t$
. Then the optimal pre-tax consumption strategy of the worker
$\pi ^{\text{B}}_t=\pi ^T_t$
. Then the optimal pre-tax consumption strategy of the worker $W^{\text{B},*}\in \left [\underline{W},e\right ]$
can be given by:
$W^{\text{B},*}\in \left [\underline{W},e\right ]$
can be given by:
 \begin{equation} \mathop{\textrm{argmax}}_{W\in \left [\underline{W},e\right ]}J^{\text{W}}\left (W,\pi ^{\text{B}}\right ), \end{equation}
where $J^{\text{W}}$
is shown in (3).
$J^{\text{W}}$
is shown in (3).
2.2.3 Hire-management cases (
$\text{H}_1\,\&\,\text{H}_2$
)

Within the delegated investment framework, the worker hires a professional fund manager to perform the fund investment on her behalf. This means the manager exogenously determines the investment strategy. Given the trends and fund mandates highlighted in previous research (e.g., Covrig et al., Reference Covrig, Lau and Ng2006), the manager’s decisions are target-driven in our model. The manager’s objectives incorporate both the investment benchmark target and the terminal fund balance target. Our choice of investment objectives is influenced by past research in this area, where mutual fund managers often focus on benchmark returns, as noted by Becker et al. (Reference Becker, Ferson, Myers and Schill1999), and on specific final fund balances, as discussed by Li & Tiwari (Reference Li and Tiwari2009). Specifically, the targets are shown below:
-
(A) Interim Target: maximizing the probability that annual return rate of the fund
$\left (1-\pi _t\right )r+\pi _tR_{t+1}$
is more than that of the target date fund
$A_{t+1}=\left (1-\pi ^{\text{T}}_t\right )r+\pi ^{\text{T}}_t R_{t+1}$
, for
$t=0,1,\dots, T-1$
; -
(B) Terminal Target: maximizing the probability that the worker’s final balance
$M_{T}$
is adequate for purchasing an annuity achieving a predetermined post-retirement annual post-tax consumption target
$B=L\times \left (e-\tau \left (e\right )\right )$
, where
$L\in \left [0,1\right ]$
is the income replacement ratio.


Thus, the manager’s objective function at the time $t=0$
is given by:
$t=0$
is given by:
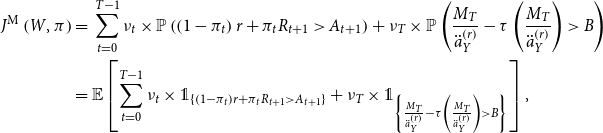 \begin{equation} \begin{aligned} J^{\text{M}}\left (W,\pi \right )=&\;\sum _{t=0}^{T-1}\nu _t\times \mathbb{P}\left (\left (1-\pi _t\right )r+\pi _t R_{t+1}\gt A_{t+1}\right )+\nu _T\times \mathbb{P}\left (\frac{M_{T}}{\ddot{a}_{Y}^{\left (r\right )}}-\tau \left (\frac{M_{T}}{\ddot{a}_{Y}^{\left (r\right )}}\right )\gt B\right )\\=&\;\mathbb{E}\left [\sum _{t=0}^{T-1}\nu _t\times \unicode{x1D7D9}_{\left \{\left (1-\pi _t\right )r+\pi _t R_{t+1}\gt A_{t+1}\right \}}+\nu _T\times \unicode{x1D7D9}_{\left \{\frac{M_{T}}{\ddot{a}_{Y}^{\left (r\right )}}-\tau \left (\frac{M_{T}}{\ddot{a}_{Y}^{\left (r\right )}}\right )\gt B\right \}}\right ], \end{aligned} \end{equation}
where $\nu _0,\nu _1,\dots, \nu _T\geq 0$
are weights evaluating the relative importance among the objectives. For time
$\nu _0,\nu _1,\dots, \nu _T\geq 0$
are weights evaluating the relative importance among the objectives. For time $t=0,1,\dots, T-1$
, the deterministic limits
$t=0,1,\dots, T-1$
, the deterministic limits $\underline{\pi }^{\text{H}}_t$
and
$\underline{\pi }^{\text{H}}_t$
and $\overline{\pi }^{\text{H}}_t$
represent the investment allocation constraints of the fund manager.
$\overline{\pi }^{\text{H}}_t$
represent the investment allocation constraints of the fund manager.
Under the hire-management cases, the worker and the manager are delegated to a Stackelberg game setting (Von Stackelberg, Reference Von Stackelberg1952), in the sense that the worker first aims to solve the optimal pre-tax consumption pattern $W^{\text{H},*}\in \left [\underline{W},e\right ]$
, while the manager then aims to solve the corresponding optimal investment allocation strategy
$W^{\text{H},*}\in \left [\underline{W},e\right ]$
, while the manager then aims to solve the corresponding optimal investment allocation strategy $\pi ^{\text{H},*}\left (W^{\text{H},*}\right )\in \left [\underline{\pi }^{\text{H}},\overline{\pi }^{\text{H}}\right ]$
. Typically, a standard technique for solving the Stackelberg game involves a two-step backward induction. In the first step, for any
$\pi ^{\text{H},*}\left (W^{\text{H},*}\right )\in \left [\underline{\pi }^{\text{H}},\overline{\pi }^{\text{H}}\right ]$
. Typically, a standard technique for solving the Stackelberg game involves a two-step backward induction. In the first step, for any $W\in \left [\underline{W},e\right ]$
, the optimal investment allocation strategy
$W\in \left [\underline{W},e\right ]$
, the optimal investment allocation strategy $\pi ^{\text{H},*}\left (W\right )\in \left [\underline{\pi }^{\text{H}},\overline{\pi }^{\text{H}}\right ]$
is given by:
$\pi ^{\text{H},*}\left (W\right )\in \left [\underline{\pi }^{\text{H}},\overline{\pi }^{\text{H}}\right ]$
is given by:
 \begin{equation} \mathop{\textrm{argmax}}_{\pi \in \left [\underline{\pi }^{\text{H}},\overline{\pi }^{\text{H}}\right ]}J^{\text{M}}\left (W,\pi \right ), \end{equation}
where $J^{\text{M}}$
is given in (6). Then in the second step, the optimal pre-tax consumption strategy
$J^{\text{M}}$
is given in (6). Then in the second step, the optimal pre-tax consumption strategy $W^{\text{H},*}\in \left [\underline{W},e\right ]$
is given by:
$W^{\text{H},*}\in \left [\underline{W},e\right ]$
is given by:
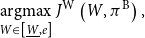
 \begin{equation} \mathop{\textrm{argmax}}_{W\in \left [\underline{W},e\right ]}J^{\text{W}}\left (W,\pi ^{\text{H},*}\left (W\right )\right ), \end{equation}
where $J^{\text{W}}$
is, again, given in (3). Therefore, the optimal pre-tax consumption and investment allocation strategies are given as
$J^{\text{W}}$
is, again, given in (3). Therefore, the optimal pre-tax consumption and investment allocation strategies are given as $\left (W^{\text{H},*},\pi ^{\text{H},*}\left (W^{\text{H},*}\right )\right )\in \left [\underline{W},e\right ]\times \left [\underline{\pi }^{\text{H}},\overline{\pi }^{\text{H}}\right ]$
.
$\left (W^{\text{H},*},\pi ^{\text{H},*}\left (W^{\text{H},*}\right )\right )\in \left [\underline{W},e\right ]\times \left [\underline{\pi }^{\text{H}},\overline{\pi }^{\text{H}}\right ]$
.
We break down hire-management into two distinct cases, taking into account the diverse skill sets of fund managers as discussed in El Ghoul et al. (Reference Ghoul, Sadok, Patel and Ramani2023). We delve into the specifics of these two cases below:
-
• For the scenario where the manager has broader investment allocation constraints (i.e.,
$\text{H}_1$
), we assume the manager’s investment allocation
$\pi _t$
subjects to the deterministic limits
$\underline{\pi }^{\text{$\text{H}_1$}}_t$
and
$\overline{\pi }^{\text{$\text{H}_1$}}_t$
such that
$\underline{\pi }^{\text{$\text{H}_1$}}_t\leq \underline{\pi }^{\text{S}}_t\leq \overline{\pi }^{\text{S}}_t\leq \overline{\pi }^{\text{$\text{H}_1$}}_t$
. This aligns with the growing interest among investors in flexible investment options that offer both greater risks and the chance for higher returns, as noted by Hitzemann et al. (Reference Hitzemann, Sokolinski and Tai2022). -
• In the case where the manager has a distinct stock-picking skill (i.e.,
$\text{H}_2$
), we adjust the expected risk premium with the manager’s alpha
$\alpha \in \mathbb{R}$
. However,
$\pi _t$
is assumed to adhere to the same deterministic limits as those in the S case, ensuring
$\underline{\pi }^{\text{$\text{H}_2$}}_t=\underline{\pi }^{\text{S}}_t\leq \overline{\pi }^{\text{S}}_t=\overline{\pi }^{\text{$\text{H}_2$}}_t$
. This setting is supported by the insights by De Franco (Reference De Franco2021), who highlights the impact of a manager’s stock-picking ability.


Note that in these two cases, we proxy the superior investment expertise of managers through the specifics of different fund delegations, such as wider allocation constraints for passive management (i.e., $H_1$
) and higher expected risk premium for active management (i.e.,
$H_1$
) and higher expected risk premium for active management (i.e., $H_2$
), instead of explicitly modeling the knowledge and expertise of the managers.
$H_2$
), instead of explicitly modeling the knowledge and expertise of the managers.
2.3 Bellman equations
We determine optimal policy functions for consumption and risky investment allocation by utilizing stochastic dynamic programming for the life cycle problems outlined in Sections 2.1 and 2.2.
Under the S case, for any $t=0,1,\dots, T-1$
, based on the objective function defined in (3), the Bellman equation of the value function
$t=0,1,\dots, T-1$
, based on the objective function defined in (3), the Bellman equation of the value function $V^{\text{W,S}}$
for (4) is given by, for any
$V^{\text{W,S}}$
for (4) is given by, for any $t=T-1,T-2,\dots, 1,0$
,
$t=T-1,T-2,\dots, 1,0$
,
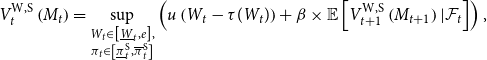 \begin{equation} V^{\text{W,S}}_t\left (M_t\right )=\sup _{\substack{{W_t\in \left [\underline{W}_t,e\right ],}\\\pi _t\in \left [\underline{\pi }^{\text{S}}_t,\overline{\pi }^{\text{S}}_t\right ]}}\left (u\left (W_t-\tau (W_t)\right )+\beta \times \mathbb{E}\left [V^{\text{W,S}}_{t+1}\left (M_{t+1}\right )\vert \mathcal{F}_t\right ]\right ), \end{equation}
and $V^{\text{W,S}}_T\left (M_T\right )=u\left (\frac{M_{T}}{\ddot{a}_{Y}^{\left (r\right )}} - \tau \left (\frac{M_{T}}{\ddot{a}_{Y}^{\left (r\right )}}\right )\right )\times \ddot{a}_{Y}^{\left (\beta \right )}$
.
$V^{\text{W,S}}_T\left (M_T\right )=u\left (\frac{M_{T}}{\ddot{a}_{Y}^{\left (r\right )}} - \tau \left (\frac{M_{T}}{\ddot{a}_{Y}^{\left (r\right )}}\right )\right )\times \ddot{a}_{Y}^{\left (\beta \right )}$
.
Since B can be regarded as a special case of S, the Bellman equation of the B case for (5) is then simplified as, for any $t=T-1,T-2,\dots, 1,0$
,
$t=T-1,T-2,\dots, 1,0$
,
 \begin{equation} V^{\text{W,B}}_t\left (M_t\right )=\sup _{\substack{{W_t\in \left [\underline{W}_t,e\right ]}}}\left (u\left (W_t-\tau (W_t)\right )+\beta \times \mathbb{E}\left [V^{\text{W,B}}_{t+1}\left (M_{t+1}\right )\vert \mathcal{F}_t\right ]\right ), \end{equation}
and $V^{\text{W,B}}_T\left (M_T\right )=u\left (\frac{M_{T}}{\ddot{a}_{Y}^{\left (r\right )}} - \tau \left (\frac{M_{T}}{\ddot{a}_{Y}^{\left (r\right )}}\right )\right )\times \ddot{a}_{Y}^{\left (\beta \right )}$
, in which
$V^{\text{W,B}}_T\left (M_T\right )=u\left (\frac{M_{T}}{\ddot{a}_{Y}^{\left (r\right )}} - \tau \left (\frac{M_{T}}{\ddot{a}_{Y}^{\left (r\right )}}\right )\right )\times \ddot{a}_{Y}^{\left (\beta \right )}$
, in which $\pi ^{\text{B}}_t=\pi ^T_t=\underline{\pi }^{\text{B}}_t=\overline{\pi }^{\text{B}}_t$
.
$\pi ^{\text{B}}_t=\pi ^T_t=\underline{\pi }^{\text{B}}_t=\overline{\pi }^{\text{B}}_t$
.
Moreover, in the hire-management cases, for any $t=T-1,T-2,\dots, 1,0$
, based on the objective functions defined in (6) and (3), the coupled Bellman equations of the value functions
$t=T-1,T-2,\dots, 1,0$
, based on the objective functions defined in (6) and (3), the coupled Bellman equations of the value functions $V^{\text{M,H}}$
and
$V^{\text{M,H}}$
and $V^{\text{W,H}}$
for (7) and (8) are given by:
$V^{\text{W,H}}$
for (7) and (8) are given by:
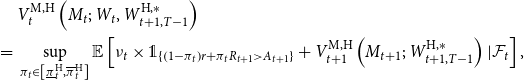 \begin{equation} \begin{aligned} &\;V^{\text{M,H}}_t\left (M_t;\;W_t,W^{\text{H},*}_{t+1,T-1}\right )\\=&\;\sup _{\pi _t\in \left [\underline{\pi }^{\text{H}}_t,\overline{\pi }^{\text{H}}_t\right ]}\mathbb{E}\left [\nu _t\times \unicode{x1D7D9}_{\left \{\left (1-\pi _t\right )r+\pi _tR_{t+1}\gt A_{t+1}\right \}}+V^{\text{M,H}}_{t+1}\left (M_{t+1};\;W^{\text{H},*}_{t+1,T-1}\right )\vert \mathcal{F}_t\right ], \end{aligned} \end{equation}
 \begin{equation} V^{\text{W,H}}_t\left (M_t\right )=\sup _{W_t\in \left [\underline{W}_t,e\right ]}\left (u\left (W_t-\tau (W_t)\right )+\beta \times \mathbb{E}\left [V^{\text{W,H}}_{t+1}\left (M_{t+1}\right )\vert \mathcal{F}_t\right ]\right ), \end{equation}
where $W^{\text{H},*}_{t+1,T-1}=\left (W^{\text{H},*}_{t+1},W^{\text{H},*}_{t+2},\dots, W^{\text{H},*}_{T-1}\right )$
, with the convention that, for
$W^{\text{H},*}_{t+1,T-1}=\left (W^{\text{H},*}_{t+1},W^{\text{H},*}_{t+2},\dots, W^{\text{H},*}_{T-1}\right )$
, with the convention that, for $t=T-1$
,
$t=T-1$
, $W^{\text{H},*}_{T,T-1}$
is null.
$W^{\text{H},*}_{T,T-1}$
is null.
From the coupled Bellman equations, the optimal consumption and asset allocation strategies can be numerically solved by employing VFI method under a sequential Stackelberg setting as described in Section 2.4.
2.4 Methods
2.4.1 Optimization
In the self-management S and B cases, optimal strategies are determined using the numerical dynamic programming method, specifically the VFI method, as outlined in Butt & Khemka (Reference Butt and Khemka2015). The annual financial decisions for the S case are optimized recursively using the Bellman equation from (9). Similarly, the B case employs the Bellman equation from (10).
For the hire-management cases, namely $\text{H}_1$
and
$\text{H}_1$
and $\text{H}_2$
, we can employ the VFI method within a Stackelberg game setting to optimize financial choices. To this end, we define the grids as, for
$\text{H}_2$
, we can employ the VFI method within a Stackelberg game setting to optimize financial choices. To this end, we define the grids as, for $t=0,1,\dots, T-1$
,
$t=0,1,\dots, T-1$
,
 \begin{equation*} \tilde {\mathcal {G}}^{M}_t=\left \{M^1,M^2,\dots, M^K\right \}, \end{equation*}
 \begin{equation*} \mathcal {G}^{M,W}_t=\Big \{\left (M,W\right )\;:\;M=M^k\text {, for }k=1,2,\dots, K\text {, and }W=W_t^z\text {, for }z=1,2,\dots, Z\Big \}; \end{equation*}
here, we set $0=M^0\leq M^1\leq M^2\leq \dots \leq M^K$
and
$0=M^0\leq M^1\leq M^2\leq \dots \leq M^K$
and $\underline{W}_t=W_t^0\leq W_t^1\leq W_t^2\leq \dots \leq W_t^Z=e$
;
$\underline{W}_t=W_t^0\leq W_t^1\leq W_t^2\leq \dots \leq W_t^Z=e$
; $K$
is a large enough positive integer, such that the mesh
$K$
is a large enough positive integer, such that the mesh $\max _{k=1,2,\dots, K}\vert M^k-M^{k-1}\vert$
is sufficiently small, while
$\max _{k=1,2,\dots, K}\vert M^k-M^{k-1}\vert$
is sufficiently small, while $M^K$
is sufficiently large;
$M^K$
is sufficiently large; $Z$
is also a large enough positive integer, such that the mesh
$Z$
is also a large enough positive integer, such that the mesh $\max _{z=1,2,\dots, Z}\vert W_t^z-W_t^{z-1}\vert$
is sufficiently small. Given the grid setting, we implement the VFI method as follows.
$\max _{z=1,2,\dots, Z}\vert W_t^z-W_t^{z-1}\vert$
is sufficiently small. Given the grid setting, we implement the VFI method as follows.
At time $t=T-1,\dots, 0$
, given the Bellman equation in (11), together with the computed future value function and allocation constraints, we numerically compute, on the grid
$t=T-1,\dots, 0$
, given the Bellman equation in (11), together with the computed future value function and allocation constraints, we numerically compute, on the grid $\mathcal{G}^{M,W}_t$
, the locally optimal asset allocation strategy
$\mathcal{G}^{M,W}_t$
, the locally optimal asset allocation strategy $\pi ^{*}_{t}\left (M^k;W_t^z\right )$
and the locally optimal value of the manager
$\pi ^{*}_{t}\left (M^k;W_t^z\right )$
and the locally optimal value of the manager $V^{\text{M,H}}_t\left (M^k;W_t^z\right )$
, for any
$V^{\text{M,H}}_t\left (M^k;W_t^z\right )$
, for any $k=1,2,\dots, K$
and
$k=1,2,\dots, K$
and $z=1,2,\dots, Z$
. By utilizing function approximation on
$z=1,2,\dots, Z$
. By utilizing function approximation on $W_t^z$
(herein, we use simple linear interpolations), for any
$W_t^z$
(herein, we use simple linear interpolations), for any $k=1,2,\dots, K$
, we obtain the locally optimal asset allocation strategy
$k=1,2,\dots, K$
, we obtain the locally optimal asset allocation strategy $\pi ^{*}_t\left (M^k;W_t\right )$
and the locally optimal value of the manager
$\pi ^{*}_t\left (M^k;W_t\right )$
and the locally optimal value of the manager $V^{\text{M,H}}_t\left (M^k;W_t\right )$
. Then, we numerically optimize, on the grid
$V^{\text{M,H}}_t\left (M^k;W_t\right )$
. Then, we numerically optimize, on the grid $\tilde{\mathcal{G}}^{M}_t$
, the consumption strategy
$\tilde{\mathcal{G}}^{M}_t$
, the consumption strategy $W^*_t(M^k)$
with the optimal value of the worker
$W^*_t(M^k)$
with the optimal value of the worker $V^{\text{W,H}}_t\left (M^k\right )$
, based on the Bellman equation in (12), the computed future value function, constraints on consumption strategy, and the locally optimal asset allocation strategy
$V^{\text{W,H}}_t\left (M^k\right )$
, based on the Bellman equation in (12), the computed future value function, constraints on consumption strategy, and the locally optimal asset allocation strategy $\pi ^{*}_t\left (M^k;W_t\right )$
; correspondingly, the optimal asset allocation strategy and the optimal value of the manager are given by
$\pi ^{*}_t\left (M^k;W_t\right )$
; correspondingly, the optimal asset allocation strategy and the optimal value of the manager are given by $\pi ^{\text{H},*}_t\left (M^k\right )=\pi ^{*}_{t}\left (M^k;W^*_t(M^k)\right )$
and
$\pi ^{\text{H},*}_t\left (M^k\right )=\pi ^{*}_{t}\left (M^k;W^*_t(M^k)\right )$
and $V^{\text{M,H}}_t\left (M^k\right )=V^{\text{M,H}}_t\left (M^k;W^*_t(M^k)\right )$
. Note, though, that another function approximation for
$V^{\text{M,H}}_t\left (M^k\right )=V^{\text{M,H}}_t\left (M^k;W^*_t(M^k)\right )$
. Note, though, that another function approximation for $\pi ^{\text{H},*}_t\left (M^k\right )$
and
$\pi ^{\text{H},*}_t\left (M^k\right )$
and $V^{\text{M,H}}_t\left (M^k\right )$
on
$V^{\text{M,H}}_t\left (M^k\right )$
on $M^k$
is not necessary since, in VFI,
$M^k$
is not necessary since, in VFI, $M_t$
takes those values
$M_t$
takes those values $M^k$
on the grid
$M^k$
on the grid $\tilde{\mathcal{G}}^{M}_t$
. In addition, the VFI algorithm details in the Stackelberg game setting is included in Appendix B.
$\tilde{\mathcal{G}}^{M}_t$
. In addition, the VFI algorithm details in the Stackelberg game setting is included in Appendix B.
Note, all numerical computations, including evaluation which will be discussed below, are performed in R (R Core Team, 2022). For the VFI analysis, the optimization procedure is conducted using the genetic algorithm from the DEoptim package (Mullen et al., Reference Mullen, Ardia, Gil, Windover and Cline2011).
2.4.2 Evaluation
We conduct $10,000$
fund accumulation simulations for each case during the pre-retirement period (i.e., from age 25 to age 65 years), based on random draws with replacement from the risky return samples, which will be outlined in Section 2.5. Hence, for simulation trajectory
$10,000$
fund accumulation simulations for each case during the pre-retirement period (i.e., from age 25 to age 65 years), based on random draws with replacement from the risky return samples, which will be outlined in Section 2.5. Hence, for simulation trajectory $n=1,\dots, 10,000$
, the simulated lifetime utility
$n=1,\dots, 10,000$
, the simulated lifetime utility $\tilde{U}_n\in \mathbb{R}$
for the worker is computed as:
$\tilde{U}_n\in \mathbb{R}$
for the worker is computed as:
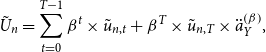 \begin{equation*} \tilde {U}_{n}=\sum _{t=0}^{T-1}\beta ^{t}\times \tilde {u}_{n,t} +\beta ^{T}\times \tilde {u}_{n,T}\times \ddot {a}_{Y}^{\left (\beta \right )}, \end{equation*}
where $\tilde{u}_{n,t}$
, for
$\tilde{u}_{n,t}$
, for $t=0,\dots, T-1$
, is the simulated utility from consumption and
$t=0,\dots, T-1$
, is the simulated utility from consumption and $\tilde{u}_{n,T}$
represents the simulated utility from the annuity purchase based on the terminal wealth; see equation (3) in which the optimal consumption and optimal asset allocation strategies are based on one of the cases S, B,
$\tilde{u}_{n,T}$
represents the simulated utility from the annuity purchase based on the terminal wealth; see equation (3) in which the optimal consumption and optimal asset allocation strategies are based on one of the cases S, B, $\text{H}_1$
, and
$\text{H}_1$
, and $\text{H}_2$
solved by Section 2.4.1.
$\text{H}_2$
solved by Section 2.4.1.
Moreover, inspired by Kim et al. (Reference Kim, Maurer and Mitchell2016), we convert the simulated utilities into certainty equivalents to facilitate comparisons across the four cases. A certainty equivalent consumption is computed by numerically searching for $w\in \mathbb{R}_+$
such that the following equation holds:
$w\in \mathbb{R}_+$
such that the following equation holds:
 \begin{equation*} \bar {U} = \sum _{t=0}^{T-1}\beta ^{t}\times u\left (w-\tau \left (w\right )\right ) +\beta ^{T}\times u\left (w-\tau \left (w\right )\right )\times \ddot {a}_{Y}^{\left (\beta \right )}, \end{equation*}
where $\bar{U}=\frac{1}{10,000}\sum _{n=1}^{10,000} \tilde{U}_{n}$
is the estimated average lifetime utility.
$\bar{U}=\frac{1}{10,000}\sum _{n=1}^{10,000} \tilde{U}_{n}$
is the estimated average lifetime utility.
Based on the simulated lifetime utility outcomes, we also calculate the extra annual management fee rate, denoted as $F_0 \in \left [0,1\right ]$
, to economically capture the value added between those investment options. As an illustration, if the average lifetime utility in Case 1 surpasses that in Case 2, we adjust the fund dynamics in Case 1 for
$F_0 \in \left [0,1\right ]$
, to economically capture the value added between those investment options. As an illustration, if the average lifetime utility in Case 1 surpasses that in Case 2, we adjust the fund dynamics in Case 1 for $t = 0,1,\dots, T-1$
as:
$t = 0,1,\dots, T-1$
as:
 \begin{equation*} M_{t+1} = \left (M_t + e - W_t\right )\times \left (1 +(1-\pi _t)r+\pi _t R_{t+1}\right )\times \left (1-F_0\right ). \end{equation*}
Using this revised fund dynamics in Case 1, our goal is to determine the $F_0$
value that yields the same average lifetime utility as in Case 2. Note that we compute this metric using pairwise comparisons. The B case is set as the reference level because of the reality that most workers primarily choose target date fund investments (i.e., B) over other investment options. This analysis requires calculations for each of the other three cases. In essence, we contrast the B case individually with the S,
$F_0$
value that yields the same average lifetime utility as in Case 2. Note that we compute this metric using pairwise comparisons. The B case is set as the reference level because of the reality that most workers primarily choose target date fund investments (i.e., B) over other investment options. This analysis requires calculations for each of the other three cases. In essence, we contrast the B case individually with the S, $\text{H}_1$
, and
$\text{H}_1$
, and $\text{H}_2$
cases.
$\text{H}_2$
cases.
Furthermore, drawing from the life cycle portfolio investment literature, such as Forsyth et al. (Reference Forsyth, Vetzal and Westmacott2019) and Ni et al. (Reference Ni, Li, Forsyth and Carroll2022), we calculate the 99% value at risk (VaR) and conditional value at risk (CVaR) based on the simulated terminal balances. These measures help us assess the severity of worst-case fund accumulation outcomes and understand the investment risk associated with each strategy.
2.5 Parameter calibrations and data source
We assume that the worker is aged exactly 25 ( $x_0$
), and she remains in the workforce until reaching the retirement age 65 (
$x_0$
), and she remains in the workforce until reaching the retirement age 65 ( $Y$
). This implies the overall contribution and investment horizon of the worker is
$Y$
). This implies the overall contribution and investment horizon of the worker is $T=40$
years. We calibrate the coefficient of relative risk aversion as
$T=40$
years. We calibrate the coefficient of relative risk aversion as $\rho = 4$
following the work of Hambel et al. (Reference Hambel, Kraft and Munk2022) and the subjective discount factor as
$\rho = 4$
following the work of Hambel et al. (Reference Hambel, Kraft and Munk2022) and the subjective discount factor as $\beta = 0.96$
(Yogo, Reference Yogo2016). The annual real salary is set to be
$\beta = 0.96$
(Yogo, Reference Yogo2016). The annual real salary is set to be $e = \$70,000$
which is comparable to the median household income of $70,781 as reported by U.S. Census Bureau (2022). The value of
$e = \$70,000$
which is comparable to the median household income of $70,781 as reported by U.S. Census Bureau (2022). The value of $L=0.7$
is an approximation of the retirement replacement ratio of
$L=0.7$
is an approximation of the retirement replacement ratio of $0.68212$
estimated by Cocco, Gomes, and Maenhout (2005) and subsequently used in Li et al. (Reference Li, Liu, Yang and Yao2016).
$0.68212$
estimated by Cocco, Gomes, and Maenhout (2005) and subsequently used in Li et al. (Reference Li, Liu, Yang and Yao2016).
For the stochastic risky asset returns, represented by the S&P 500 US equity index, we utilize historical monthly rolling annual returns of the S&P 500 US equity index over the period from July 1982 to June 2022. Those returnsFootnote 1 are adjusted by CPI to represent real returns. Over this period, the mean annual real return $\mu$
was approximately 6.0% with an annual standard deviation
$\mu$
was approximately 6.0% with an annual standard deviation $\sigma$
of 15.43%. We set the constant real risk-free return to
$\sigma$
of 15.43%. We set the constant real risk-free return to $r=1.0\%$
per annum, which is consistent with long-term US treasury bills return from the Dimson, Marsh, and Staunton (DMS) database, as reported in Credit Suisse Research Institute (2022). Hence, the corresponding expected risk premium is
$r=1.0\%$
per annum, which is consistent with long-term US treasury bills return from the Dimson, Marsh, and Staunton (DMS) database, as reported in Credit Suisse Research Institute (2022). Hence, the corresponding expected risk premium is $\mu - r = 5\%$
. Further, using the example positive alpha
$\mu - r = 5\%$
. Further, using the example positive alpha $\alpha = 1.224\%$
estimated by Ferson & Lin (Reference Ferson and Lin2014), we determine the adjusted expected risk premium
$\alpha = 1.224\%$
estimated by Ferson & Lin (Reference Ferson and Lin2014), we determine the adjusted expected risk premium $\mu - r + \alpha = 6.224\%$
for the
$\mu - r + \alpha = 6.224\%$
for the $\text{H}_2$
case.
$\text{H}_2$
case.
As this worker has no investment expertise, we assume the constraints of no borrowing and short-selling are applied under the S case, that is, $\underline{\pi }^{\text{S}} = 0$
and
$\underline{\pi }^{\text{S}} = 0$
and $\overline{\pi }^{\text{S}}=1$
. Similarly, given our assumption that the manager in the
$\overline{\pi }^{\text{S}}=1$
. Similarly, given our assumption that the manager in the $\text{H}_2$
case shares the same allocation constraints as the S case, we set
$\text{H}_2$
case shares the same allocation constraints as the S case, we set $\underline{\pi }^{\text{$\text{H}_2$}} = 0$
and
$\underline{\pi }^{\text{$\text{H}_2$}} = 0$
and $\overline{\pi }^{\text{$\text{H}_2$}} =1$
. Chen et al. (Reference Chen, Desai and Krishnamurthy2013) report evidence of short-selling in the US domestic equity mutual funds on average by 16% of fund assets. Consequently, for the manager in the
$\overline{\pi }^{\text{$\text{H}_2$}} =1$
. Chen et al. (Reference Chen, Desai and Krishnamurthy2013) report evidence of short-selling in the US domestic equity mutual funds on average by 16% of fund assets. Consequently, for the manager in the $\text{H}_1$
case, we relax the constraints to reflect this behavior and set
$\text{H}_1$
case, we relax the constraints to reflect this behavior and set $\underline{\pi }^{\text{$\text{H}_1$}} = -0.16$
and
$\underline{\pi }^{\text{$\text{H}_1$}} = -0.16$
and $\overline{\pi }^{\text{$\text{H}_1$}} =1.16$
. It is important to note, for simplicity, that we assume the fund objective defines the limit of short-selling and borrowing over time. Thus, the corresponding asset allocation boundary remains constant over time, an assumption also applied in life cycle modeling papers such as Andréasson et al. (Reference Andréasson, Shevchenko and Novikov2017).
$\overline{\pi }^{\text{$\text{H}_1$}} =1.16$
. It is important to note, for simplicity, that we assume the fund objective defines the limit of short-selling and borrowing over time. Thus, the corresponding asset allocation boundary remains constant over time, an assumption also applied in life cycle modeling papers such as Andréasson et al. (Reference Andréasson, Shevchenko and Novikov2017).
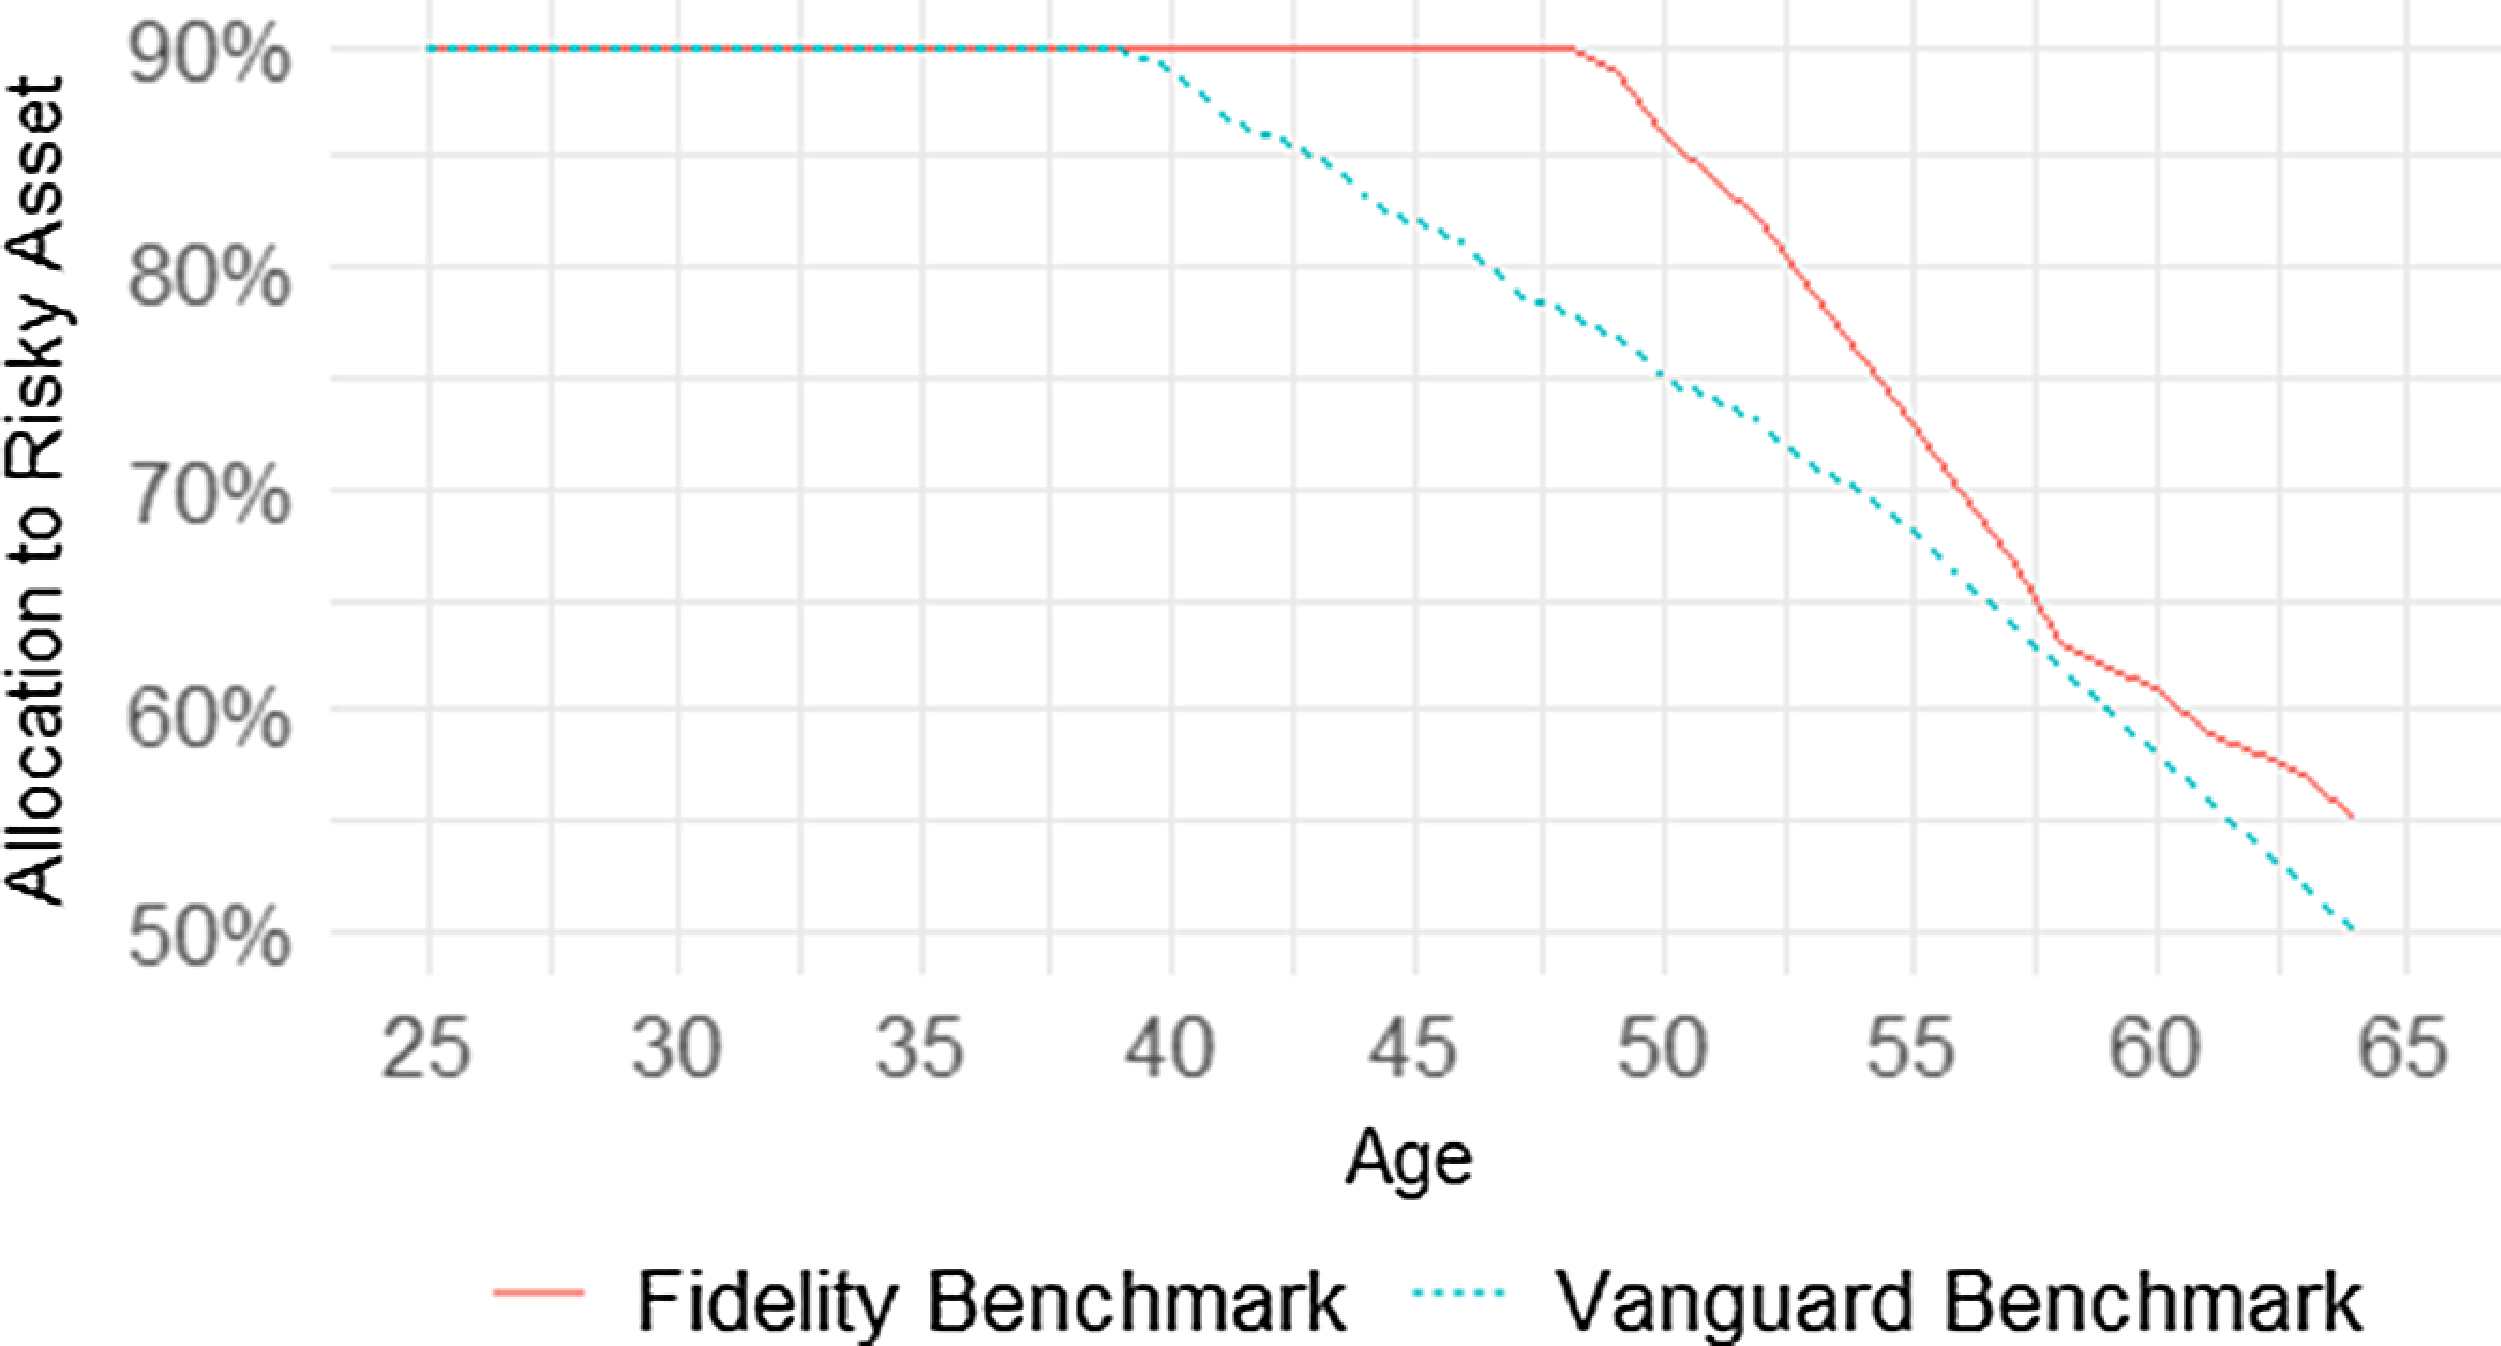
Since Fidelity Freedom Fund 2060Footnote 2 is an example target date fund in the US market, we determine the manager’s interim target based on its proposed glide path. It retains a risky asset allocation of 90% until age 48 years and then gradually transitions to a minimum allocation of 55% at age 64 years. For comparison, we use another US target date fund, the Vanguard Target Retirement 2060 FundFootnote 3 as sensitivity analysis. The investment strategy from Vanguard is relatively more conservative, maintaining a risky proportion of 90% up to age 39 years and then gradually transitioning to a minimum allocation of 50% by age 64 years. Fig. 1 plots the deterministic risky investment strategies (i.e., $\pi _t^T$
for
$\pi _t^T$
for $t=0,1,\dots, T-1$
) across working ages.
$t=0,1,\dots, T-1$
) across working ages.
Asset allocations by age under the benchmark strategies.
Next, recall that, under the hire-management setting, which includes both the $\text{H}_1$
and
$\text{H}_1$
and $\text{H}_2$
cases, the manager aims to pursue two targets simultaneously: (i) interim target: the annual fund returns outperform the benchmark A for any
$\text{H}_2$
cases, the manager aims to pursue two targets simultaneously: (i) interim target: the annual fund returns outperform the benchmark A for any $t = 0,1,\dots, T-1$
; (ii) terminal target: the final fund balance exceeds the prespecified target B. Here, we set
$t = 0,1,\dots, T-1$
; (ii) terminal target: the final fund balance exceeds the prespecified target B. Here, we set $\nu _t=0.5$
and
$\nu _t=0.5$
and $\nu _T=1$
for
$\nu _T=1$
for $t=0,1,\dots, T-1$
to exhibit that the importance of achieving the final target outweighs the importance of achieving the interim targets.
$t=0,1,\dots, T-1$
to exhibit that the importance of achieving the final target outweighs the importance of achieving the interim targets.
The actuarial formula for calculating the value of the immediate annuity at retirement that pays $1 annually in real terms is shown below:
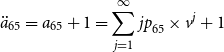 \begin{equation} \ddot{a}_{65} = a_{65} +1 = \sum _{j=1}^{ \infty }{jp}_{65}\times v^j +1 \end{equation}
where
-
•
${jp}_{65}$
is the probability of surviving
$j$
years for an individual aged 65 years. These probability results are directly acquired based on the 2020 US female life table data from the National Center for Health Statistics (Arias et al., Reference Arias, Xu, Tejada-Vera, Murphy and Bastian2022). -
•
$v^j$
is the corresponding discount factor.


From these inputs, we obtain $ \ddot{a}_{65}^{\left (r\right )} = 18.1313$
, where
$ \ddot{a}_{65}^{\left (r\right )} = 18.1313$
, where $v$
is given by
$v$
is given by $\frac{1}{1+r} = 0.9901$
. In addition, the value of the immediate annuity at retirement using the subjective discount factor
$\frac{1}{1+r} = 0.9901$
. In addition, the value of the immediate annuity at retirement using the subjective discount factor $\beta$
is
$\beta$
is $\ddot{a}_{65}^{\left (\beta \right )}=13.3559$
, with
$\ddot{a}_{65}^{\left (\beta \right )}=13.3559$
, with $v$
taking a value of
$v$
taking a value of $\beta = 0.96$
.
$\beta = 0.96$
.
The personal income taxation rules for $\tau$
are set based on the US Internal Revenue Service (2022a) and the corresponding taxation in 2022 is seven-fold progressive (i.e.,
$\tau$
are set based on the US Internal Revenue Service (2022a) and the corresponding taxation in 2022 is seven-fold progressive (i.e., $n=7$
). Table 1 presents the specific figures for the marginal tax rates
$n=7$
). Table 1 presents the specific figures for the marginal tax rates $J_1,J_2,\ldots, J_n$
and thresholds
$J_1,J_2,\ldots, J_n$
and thresholds $K_1, K_2,\ldots, K_{n-1}$
.
$K_1, K_2,\ldots, K_{n-1}$
.
Internal Revenue Service (2022b) specifies the contribution limits for the retirement saving account. Referring to the limits specified, for any $t=0,1,\ldots, 24$
, we have the basic contribution limit
$t=0,1,\ldots, 24$
, we have the basic contribution limit $\overline{B}_t = \$20,500$
; and for any
$\overline{B}_t = \$20,500$
; and for any $t=25,26,\ldots, T-1$
(i.e., from age 50 onward), along with the catch-up contribution limit
$t=25,26,\ldots, T-1$
(i.e., from age 50 onward), along with the catch-up contribution limit $\$6,500$
, we have the updated contribution limit
$\$6,500$
, we have the updated contribution limit $\overline{B}_t = \$27,000$
.
$\overline{B}_t = \$27,000$
.
3. Results and discussions
Section 3.1 reports the results for the major metrics, namely certainty equivalent consumption and the extra annual management fee rate. Section 3.2 examines how these major metrics vary under modified hire-management-related parameters. Section 3.3 provides a discussion of implications in the fund management industry. In addition, Appendix C presents the numerical optimization and simulation results, and a supplementary sensitivity analysis is included in Appendix D.
3.1 Key metrics analysis
Under each of the four investment options (i.e., S, B, $\text{H}_1$
, and
$\text{H}_1$
, and $\text{H}_2$
), the worker determines the amount of pre-tax consumption to maximize lifetime utility. Our analysis begins with a comparison of the certainty equivalent pre-tax consumption (CEC) in these different cases to understand the differences in the outcomes on the worker’s value function. A higher CEC value, as described in Section 2.4, indicates a better outcome for the worker, reflecting higher lifetime utility. Subsequently, we explore the added value of fund delegation by analyzing extra management fees and compare these to the empirical data on fees typically charged in practice. At the end of this subsection, we also study risk metrics such as the 99% VaR and the 99% CVaR on the simulated final balances.
$\text{H}_2$
), the worker determines the amount of pre-tax consumption to maximize lifetime utility. Our analysis begins with a comparison of the certainty equivalent pre-tax consumption (CEC) in these different cases to understand the differences in the outcomes on the worker’s value function. A higher CEC value, as described in Section 2.4, indicates a better outcome for the worker, reflecting higher lifetime utility. Subsequently, we explore the added value of fund delegation by analyzing extra management fees and compare these to the empirical data on fees typically charged in practice. At the end of this subsection, we also study risk metrics such as the 99% VaR and the 99% CVaR on the simulated final balances.
Table 2 compares the worker’s CECs across the four cases. We find that the $\text{H}_2$
case has the highest CEC, followed by
$\text{H}_2$
case has the highest CEC, followed by $\text{H}_1$
and S, while B has the lowest CEC. The underperformance of B is in line with the findings of Bodie & Treussard (Reference Bodie and Treussard2007) and Khemka et al. (Reference Khemka, Steffensen and Warren2021) who discover that a deterministic age-based investment strategy is sub-optimal compared to a dynamic investment strategy. The higher CECs in both
$\text{H}_1$
and S, while B has the lowest CEC. The underperformance of B is in line with the findings of Bodie & Treussard (Reference Bodie and Treussard2007) and Khemka et al. (Reference Khemka, Steffensen and Warren2021) who discover that a deterministic age-based investment strategy is sub-optimal compared to a dynamic investment strategy. The higher CECs in both $\text{H}_2$
and
$\text{H}_2$
and $\text{H}_1$
cases suggest that hiring a manager can add value to the retirement outcome of the worker (with a 4.31% (1.29%) difference in CECs between the
$\text{H}_1$
cases suggest that hiring a manager can add value to the retirement outcome of the worker (with a 4.31% (1.29%) difference in CECs between the $\text{H}_2$
(
$\text{H}_2$
( $\text{H}_1$
) case and the B case) due to their superior investment expertise despite the existence of agency risk. In addition, the simulation analysis in Appendix C, which examines the median outcomes of 10,000 simulations for the four cases, confirms our findings regarding the relative standings of CECs among the four cases.
$\text{H}_1$
) case and the B case) due to their superior investment expertise despite the existence of agency risk. In addition, the simulation analysis in Appendix C, which examines the median outcomes of 10,000 simulations for the four cases, confirms our findings regarding the relative standings of CECs among the four cases.
Marginal tax rates and thresholds under the US progressive taxation system
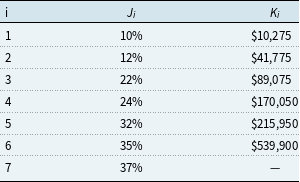
Table shows the marginal tax rates $J_i$
$J_i$ $(i=1,2,\dots, 7)$
and the corresponding thresholds
$(i=1,2,\dots, 7)$
and the corresponding thresholds $K_i$
$K_i$ $(i=1,2,\dots, 6)$
in the seven-fold progressive taxation system.
$(i=1,2,\dots, 6)$
in the seven-fold progressive taxation system.
Simulation results for average CEC: percentages in brackets indicate differences relative to the B case
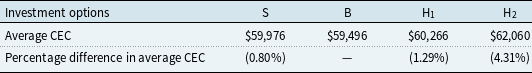
Table shows the average CEC and the percentage difference in average CEC (with case B as the reference level) for self-management with dynamic investment (S), self-management with benchmark investment (B), hire-management with flexible allocation ( $H_1$
), and hire-management with alpha focus (
$H_1$
), and hire-management with alpha focus ( $H_2$
), respectively.
$H_2$
), respectively.
Simulation results for extra management fee (reference level: B)

Table shows the simulation results for the extra management fee for the hire-management with flexible allocation ( $H_1$
), hire-management with alpha focus (
$H_1$
), hire-management with alpha focus ( $H_2$
), and self-management with dynamic investment (S) cases compared to the reference case self-management with benchmark investment (B).
$H_2$
), and self-management with dynamic investment (S) cases compared to the reference case self-management with benchmark investment (B).
Table 3 provides the simulation results of the extra management fees, using B as the reference level, in accordance with the setting previously outlined in Section 2.4. The concept of extra management fee denotes the proportion of the retirement saving fund subtracted annually under one scenario to match the lifetime utility of another. Simulation results indicate that the passive (active) fund manager can charge a fee of up to 0.42% (1.35%) of the fund balance and still provide added value to the worker’s lifetime utility. Moreover, while the act of a worker remunerating themselves through a fee lacks economic significance, the worker can subtract over 0.2% of funds from her saving account and still be better off than the benchmark investment. For our supplementary analysis, Table 4 is also included, showing the simulation results of the extra management fees, with S being set as the reference level. Similar to Table 3, the fee results reported in Table 4 confirms the superior fund performances of hire-management cases compared to self-management cases.
Simulation results for extra management fee (reference level: S)

Table shows the simulation results for the extra management fee for the hire-management with flexible allocation ( $H_1$
), hire-management with alpha focus (
$H_1$
), hire-management with alpha focus ( $H_2$
), and self-management with benchmark investment (B) cases compared to the reference case self-management with dynamic investment (S).
$H_2$
), and self-management with benchmark investment (B) cases compared to the reference case self-management with dynamic investment (S).
While Tables 3 and 4 show that delegated investment can add value (in isolation), these must be compared to the actual fees that are charged by active managers to draw inference on the “net” value-add of delegated investments. Table 5
Footnote 4 provides the empirical data on indicative fees charged in practice for the various options. Taking the examples of the B case and the $\text{H}_2$
case, we can compare the empirical fund management expense figures (i.e., 0.12% and 1.36%, respectively) with the relevant simulated management fee results (i.e., 1.35%). It becomes apparent that utilizing an active fund manager’s service can still benefit the worker who originally chose the target date fund investment. However, the comparisons between the S and
$\text{H}_2$
case, we can compare the empirical fund management expense figures (i.e., 0.12% and 1.36%, respectively) with the relevant simulated management fee results (i.e., 1.35%). It becomes apparent that utilizing an active fund manager’s service can still benefit the worker who originally chose the target date fund investment. However, the comparisons between the S and $\text{H}_2$
cases suggest that shifting to active fund management may not yield additional benefits for those who engage in dynamic self-investment. Similarly, as indicated by the market figures (i.e., 0.40% and 0.03%) as well as the related simulation figure (i.e., 0.16%), shifting to delegated passive fund management is not beneficial for the worker engaged in dynamic self-investment. These findings align with the US mutual fund literature, including studies like Jones & Wermers (Reference Jones and Wermers2011), which suggest that hiring a fund manager might not add significant value when considering the cost of fund management. The results indicate that dynamic self-investment (case S) is clearly the most superior and incurs a remarkably low fund investment cost. If the worker has the capability and financial literacy, this should be the optimal choice. However, if the worker’s default choice is a target date fund, then there is scope of improvement in retirement outcomes through delegation to professionals.
$\text{H}_2$
cases suggest that shifting to active fund management may not yield additional benefits for those who engage in dynamic self-investment. Similarly, as indicated by the market figures (i.e., 0.40% and 0.03%) as well as the related simulation figure (i.e., 0.16%), shifting to delegated passive fund management is not beneficial for the worker engaged in dynamic self-investment. These findings align with the US mutual fund literature, including studies like Jones & Wermers (Reference Jones and Wermers2011), which suggest that hiring a fund manager might not add significant value when considering the cost of fund management. The results indicate that dynamic self-investment (case S) is clearly the most superior and incurs a remarkably low fund investment cost. If the worker has the capability and financial literacy, this should be the optimal choice. However, if the worker’s default choice is a target date fund, then there is scope of improvement in retirement outcomes through delegation to professionals.
Empirical results for extra management fee

Table shows the empirical results for the extra management fee for the self-management with dynamic investment (S), self-management with benchmark investment (B), hire-management with flexible allocation ( $H_1$
), and hire-management with alpha focus (
$H_1$
), and hire-management with alpha focus ( $H_2$
) cases.
$H_2$
) cases.
Furthermore, we can break down the fund management fees and explicitly account for one of the major components, direct transaction fees, to understand how this factor affects the worker’s choice of investment options. As highlighted by Kim et al. (Reference Kim, Maurer and Mitchell2016), individual investors are not greatly affected by transaction costs when investing stocks and bonds in the market. Target date funds, such as the Fidelity Freedom Fund 2060, involve zero transaction fees. Therefore, the transaction fees for the S and B cases have very minimal impact on our current analysis. However, other studies, such as those by Berk & Van Binsbergen (Reference Berk and Van Binsbergen2015), Kooli & Stetsyuk (Reference Kooli and Stetsyuk2021), and Jiang et al. (Reference Jiang, Yao and Zaynutdinova2023), confirm the significant negative impacts of transaction costs on both passive and active funds, with more severe impacts on active funds due to their active trading strategies. Given we have assumed post-transaction costs returns, if the returns were instead pre-transaction cost, then the extra management fee that the investor should pay and gain utility would be even lower, thereby making delegated investments even less of a value-add.
Table 6 provides insights into the investment risk associated with the four options. The 99% VaR on the simulated final balances is computed as the 1st percentile of the simulated final balances. We find that the 99% VaR results for the self-management cases are higher than those for the hire-management cases. Unlike the self-management cases, the nature of the target functions can lead the $H_1$
and
$H_1$
and $H_2$
cases to undertake relatively more investment risk throughout the fund accumulation period. Additionally, the preference for taking more risky investments at lower balances in later ages (Blake et al. Reference Blake, Wright and Zhang2014) exacerbates the worst outcomes for these hire-management cases. As the risky investment allocation upper bound for the
$H_2$
cases to undertake relatively more investment risk throughout the fund accumulation period. Additionally, the preference for taking more risky investments at lower balances in later ages (Blake et al. Reference Blake, Wright and Zhang2014) exacerbates the worst outcomes for these hire-management cases. As the risky investment allocation upper bound for the $H_1$
case is 16% more than that for the
$H_1$
case is 16% more than that for the $H_2$
case, we see that the 99% VaR for the
$H_2$
case, we see that the 99% VaR for the $H_1$
case ($416,651) is significantly lower than that for the
$H_1$
case ($416,651) is significantly lower than that for the $H_2$
case ($490,237). Moreover, the lower 99% VaR of the S case ($520,943) compared to the B case ($536,955) is mainly due to the S case being more aggressive in risky asset investment at earlier ages (e.g., between age 25 and age 40 years).Footnote 5 Hence, although the S,
$H_2$
case ($490,237). Moreover, the lower 99% VaR of the S case ($520,943) compared to the B case ($536,955) is mainly due to the S case being more aggressive in risky asset investment at earlier ages (e.g., between age 25 and age 40 years).Footnote 5 Hence, although the S, $H_1$
, and
$H_1$
, and $H_2$
cases outperform the B case under the certainty equivalent consumption metric, the downside of a more aggressive investment strategy can lead to more severe worst-case scenarios.
$H_2$
cases outperform the B case under the certainty equivalent consumption metric, the downside of a more aggressive investment strategy can lead to more severe worst-case scenarios.
Results for the 99% VaR and CVaR on the simulated final balances
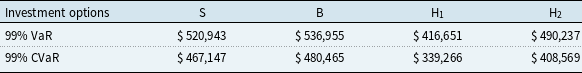
Table shows the results for the 99% VaR and CVaR on the simulated final balances for the Self-Management with Dynamic Investment (S), Self-Management with Benchmark Investment (B), Hire-Management with Flexible Allocation ( $H_1$
), and Hire-Management with Alpha Focus (
$H_1$
), and Hire-Management with Alpha Focus ( $H_2$
) cases.
$H_2$
) cases.
The 99% CVaR on the simulated final balances is computed as the mean of the simulated final balances that fall below the 1st percentile. These results echo the findings of the VaR analysis, but more importantly show that the worst outcomes under $H_1$
and
$H_1$
and $H_2$
cases are significantly worse compared to the self-management cases. Relative to the B (S) case,
$H_2$
cases are significantly worse compared to the self-management cases. Relative to the B (S) case, $H_2$
outcomes are 14.96% (12.54%) lower, while
$H_2$
outcomes are 14.96% (12.54%) lower, while $H_1$
cases are significantly lower at 29.39% (27.37%) due to the ability to invest more heavily in the risky asset. The worst outcomes under the S case are relatively close to those of the B case, reflecting marginal average loss.
$H_1$
cases are significantly lower at 29.39% (27.37%) due to the ability to invest more heavily in the risky asset. The worst outcomes under the S case are relatively close to those of the B case, reflecting marginal average loss.
3.2 Sensitivity analysis
In this section, we conduct sensitivity tests to see how the critical metrics like CEC outcomes vary with changes in hire-management-related model parameters. For the sake of brevity and focus, in this section, we present only selected key results for sensitivity analysis, relegating the rest to the Appendix as supplementary materials.Footnote 6 The key statistics are summarized in Table 7. For conciseness, we include only CEC results and the percentage difference compared to the baseline in this table. The baseline results are shown in the top row of Table 7, followed by major sensitivity test results. A blank value for a sensitivity indicates it is irrelevant to that case. In subsequent subsections, we discuss each test, referencing the table results.
Key sensitivity test results for average CEC
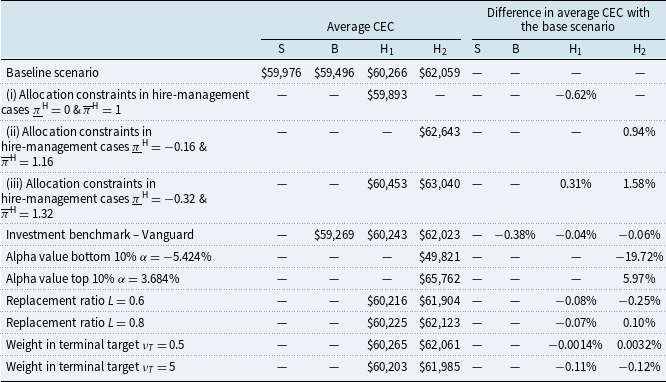
Table shows the key sensitivity test results on average CEC and the corresponding percentage difference compared with the base scenario for self-management with dynamic investment (S), self-management with benchmark investment (B), hire-management with flexible allocation ( $H_1$
), and hire-management with alpha focus (
$H_1$
), and hire-management with alpha focus ( $H_2$
), respectively. In this table, we present sensitivity results for allocation constraints in hire-management cases, investment benchmark, alpha value, replacement ratio, and weight in the terminal target.
$H_2$
), respectively. In this table, we present sensitivity results for allocation constraints in hire-management cases, investment benchmark, alpha value, replacement ratio, and weight in the terminal target.
3.2.1 Allocation constraints in hire-management cases
For the $\text{H}_1$
case, relative to the baseline allocation constraint with
$\text{H}_1$
case, relative to the baseline allocation constraint with $\underline{\pi }^{\text{$\text{H}_1$}} = -0.16$
and
$\underline{\pi }^{\text{$\text{H}_1$}} = -0.16$
and $\overline{\pi }^{\text{$\text{H}_1$}}=1.16$
, we examine the scenarios where the manager has no capacity to short-sell or borrow (i.e.,
$\overline{\pi }^{\text{$\text{H}_1$}}=1.16$
, we examine the scenarios where the manager has no capacity to short-sell or borrow (i.e., $\underline{\pi }^{\text{$\text{H}_1$}} = 0$
and
$\underline{\pi }^{\text{$\text{H}_1$}} = 0$
and $\overline{\pi }^{\text{$\text{H}_1$}}=1$
) and where the manager has the wider capacity to perform short-selling or borrowing (i.e.,
$\overline{\pi }^{\text{$\text{H}_1$}}=1$
) and where the manager has the wider capacity to perform short-selling or borrowing (i.e., $\underline{\pi }^{\text{$\text{H}_1$}} = -0.32$
and
$\underline{\pi }^{\text{$\text{H}_1$}} = -0.32$
and $\overline{\pi }^{\text{$\text{H}_1$}}=1.32$
). As expected, imposing the constraint of no borrowing and short-selling on the passive fund manager results in a reduction of the CEC value under the
$\overline{\pi }^{\text{$\text{H}_1$}}=1.32$
). As expected, imposing the constraint of no borrowing and short-selling on the passive fund manager results in a reduction of the CEC value under the $\text{H}_1$
case. With the same allocation constraints applied over all four cases, dynamic self-management becomes a more attractive option. This is not only due to the agency risk implied from the manager’s objective function but also the potential fund management cost. The worker’s interest in choosing delegated investment can be further deteriorated by the enforcement of a positive fund management fee charged to the savings account. On the other hand, easing constraints on short-selling and borrowing enables the manager to take further advantage of aggressive investment, thus giving rise to a higher CEC value under the hire-management cases. In addition, the nonlinear effect here primarily results from the constraints on annual consumption.
$\text{H}_1$
case. With the same allocation constraints applied over all four cases, dynamic self-management becomes a more attractive option. This is not only due to the agency risk implied from the manager’s objective function but also the potential fund management cost. The worker’s interest in choosing delegated investment can be further deteriorated by the enforcement of a positive fund management fee charged to the savings account. On the other hand, easing constraints on short-selling and borrowing enables the manager to take further advantage of aggressive investment, thus giving rise to a higher CEC value under the hire-management cases. In addition, the nonlinear effect here primarily results from the constraints on annual consumption.
Moreover, by adopting extended allocation constraints (specifically, $\underline{\pi }^{\text{$\text{H}_2$}} = -0.16$
and
$\underline{\pi }^{\text{$\text{H}_2$}} = -0.16$
and $\overline{\pi }^{\text{$\text{H}_2$}}=1.16$
as well as
$\overline{\pi }^{\text{$\text{H}_2$}}=1.16$
as well as $\underline{\pi }^{\text{$\text{H}_2$}} = -0.32$
and
$\underline{\pi }^{\text{$\text{H}_2$}} = -0.32$
and $\overline{\pi }^{\text{$\text{H}_2$}}=1.32$
), we assess the impact of wider flexibility for short-selling or borrowing on the CEC values under the
$\overline{\pi }^{\text{$\text{H}_2$}}=1.32$
), we assess the impact of wider flexibility for short-selling or borrowing on the CEC values under the $\text{H}_2$
case (recall that the baseline involves the allocation constraints ranging between 0 and 1). Similar to the
$\text{H}_2$
case (recall that the baseline involves the allocation constraints ranging between 0 and 1). Similar to the $\text{H}_1$
case, due to the constraints on annual consumption, expanding the allocation constraints can lead to an increase in the CEC value for the
$\text{H}_1$
case, due to the constraints on annual consumption, expanding the allocation constraints can lead to an increase in the CEC value for the $\text{H}_2$
case, but at a diminishing rate. Furthermore, the
$\text{H}_2$
case, but at a diminishing rate. Furthermore, the $\text{H}_2$
case shows more significant CEC fluctuations compared to the
$\text{H}_2$
case shows more significant CEC fluctuations compared to the $\text{H}_1$
case, owing to the greater expected risk premium.
$\text{H}_1$
case, owing to the greater expected risk premium.
3.2.2 Investment benchmark
While the investment benchmark strategy is set based on the Fidelity Freedom Fund 2060 in the baseline setting, the Vanguard Target Retirement 2060 is chosen to develop the correspondent benchmark strategy in this sensitivity test. Compared to the Fidelity Freedom Fund 2060, the Vanguard Target Retirement 2060 has a lower overall risk exposure due to its earlier shift to take more conservative investments and a lower risky asset allocation at retirement. Consequently, the CEC results for $\text{H}_1$
case,
$\text{H}_1$
case, $\text{H}_2$
case, and B case decrease under the Vanguard benchmark.
$\text{H}_2$
case, and B case decrease under the Vanguard benchmark.
3.2.3 Manager’s alpha
For active fund management (i.e., in the $\text{H}_2$
case), we test two alternative values of alpha,
$\text{H}_2$
case), we test two alternative values of alpha, $\alpha$
: the bottom 10% at
$\alpha$
: the bottom 10% at $\alpha = -5.424\%$
and the top 10% at
$\alpha = -5.424\%$
and the top 10% at $\alpha = 3.684\%$
. Consistent with the baseline
$\alpha = 3.684\%$
. Consistent with the baseline $\alpha = 1.224\%$
, both of these alpha values are estimated by Ferson & Lin (Reference Ferson and Lin2014). Recall that a higher value of
$\alpha = 1.224\%$
, both of these alpha values are estimated by Ferson & Lin (Reference Ferson and Lin2014). Recall that a higher value of $\alpha$
indicates that the active fund manager possesses better stock-picking ability and thus can generate a better adjusted expected risk premium
$\alpha$
indicates that the active fund manager possesses better stock-picking ability and thus can generate a better adjusted expected risk premium $\mu -r+\alpha$
. Consequently, when
$\mu -r+\alpha$
. Consequently, when $\alpha$
is upgraded to the top 10% level, the more favorable risky asset return distribution promotes the accumulation of savings wealth, resulting in higher CEC values. Conversely, downgrading
$\alpha$
is upgraded to the top 10% level, the more favorable risky asset return distribution promotes the accumulation of savings wealth, resulting in higher CEC values. Conversely, downgrading $\alpha$
can lead to poorer risky investment performance, contributing to even worse CEC results than the other three cases.
$\alpha$
can lead to poorer risky investment performance, contributing to even worse CEC results than the other three cases.
3.2.4 Replacement ratio
For the replacement ratio parameter $L$
, we test both
$L$
, we test both $L=0.6$
and
$L=0.6$
and $L=0.8$
and compare the results to the baseline (with
$L=0.8$
and compare the results to the baseline (with $L=0.7$
). Since the replacement ratio is positively correlated with the terminal target wealth, a higher value of
$L=0.7$
). Since the replacement ratio is positively correlated with the terminal target wealth, a higher value of $L$
leads to a broader range of balances for which the manager chooses not to fully invest in risky asset at near-retirement ages. Further analysis implies that, due to a $0 starting balance, a higher value of
$L$
leads to a broader range of balances for which the manager chooses not to fully invest in risky asset at near-retirement ages. Further analysis implies that, due to a $0 starting balance, a higher value of $L$
allows the manager to spend a longer period of time fully invested in the risky asset and catching up to the possible range of balances that require more conservative investment to secure the terminal target. Furthermore, as the replacement ratio increases, it is observed that the worker’s consumption is slightly lower than the baseline setting at earlier ages. These combined effects account for the fluctuations in CECs observed in the hire-management cases over the tested
$L$
allows the manager to spend a longer period of time fully invested in the risky asset and catching up to the possible range of balances that require more conservative investment to secure the terminal target. Furthermore, as the replacement ratio increases, it is observed that the worker’s consumption is slightly lower than the baseline setting at earlier ages. These combined effects account for the fluctuations in CECs observed in the hire-management cases over the tested $L$
values. In addition, due to the higher expected risk premium, the
$L$
values. In addition, due to the higher expected risk premium, the $\text{H}_2$
case exhibits relatively larger CEC fluctuations than the
$\text{H}_2$
case exhibits relatively larger CEC fluctuations than the $\text{H}_1$
case.
$\text{H}_1$
case.
3.2.5 Relative weighting in terminal target
Changing the relative weighting of the manager’s two targets is captured by adjusting the weighting of the terminal target relative to the interim target (i.e., $\nu _T$
). Relative to the baseline value
$\nu _T$
). Relative to the baseline value $\nu _T=1$
, we test both
$\nu _T=1$
, we test both $\nu _T=0.5$
and
$\nu _T=0.5$
and $\nu _T=5$
(while still setting
$\nu _T=5$
(while still setting $\nu _t=0.5$
for
$\nu _t=0.5$
for $t=0,1,\dots, T-1$
). We find that the higher
$t=0,1,\dots, T-1$
). We find that the higher $\nu _T$
value results in a moderately wider range of balances that the manager chooses not to fully invest in the risky assets for the ages closer to retirement. On the other hand, similar to aforementioned analysis, with a $0 starting balance, a higher
$\nu _T$
value results in a moderately wider range of balances that the manager chooses not to fully invest in the risky assets for the ages closer to retirement. On the other hand, similar to aforementioned analysis, with a $0 starting balance, a higher $\nu _T$
value also encourages the manager to remain fully invested in the risky investment for a longer period to secure the terminal target. Overall, the impact of altering
$\nu _T$
value also encourages the manager to remain fully invested in the risky investment for a longer period to secure the terminal target. Overall, the impact of altering $\nu _T$
value is marginal on the CEC results for the hire-management cases.
$\nu _T$
value is marginal on the CEC results for the hire-management cases.
3.3 Implication discussion
The analyses in the previous subsections reveal two major findings. In this subsection, we highlight these major findings and further discuss their implications for individual workers.
3.3.1 Selection of investment option
The key metric analysis presented in Section 3.1 underscores that active fund management can yield the best utility outcomes, followed by passive fund management and dynamic self-management, with benchmark investment ranking last. Despite the existence of agency risk and without considering the cost of fund management fees, delegating fund investment to a beyond-average active fund manager with strong stock-picking skills (thereby achieving consistently positive alpha) can be the best choice for workers. However, the advantages of choosing fund delegation (i.e., active or passive fund management) diminish when empirical fund fee data are considered. Thanks to the relatively low management costs associated with investing in equity indexes (e.g., exchange traded funds or ETFs), dynamic self-management tends to add more value compared to other investment options.
Implications from the comparative analysis of these investment options suggest that, for an individual worker with a risk-averse utility preference, opting for dynamic fund investment without delegation can lead to enhanced fund accumulation and thus the best retirement outcome. The US mutual fund literature (such as Barras et al., Reference Barras, Scaillet and Wermers2010; Fulkerson & Hong, Reference Fulkerson and Hong2021; Gennaioli, et al. Reference Gennaioli, Shleifer and Vishny2015; Huang et al., Reference Huang, Pilbeam and Pouliot2021) shares a similar view that, net of fund management fee expenses, fund delegation does not yield advantageous investment returns for the worker. Furthermore, fund investment papers like Estrada (Reference Estrada2014), Khemka et al. (Reference Khemka, Steffensen and Warren2021) and Turner & Klein (Reference Turner and Klein2021) concur that deterministic investments (e.g., those with target date strategies) tend to be sub-optimal for workers. In addition, to enhance dynamic self-management, it could be suggested to focus on the importance of financial literacy and the ability of workers to understand and interpret market dynamics. This knowledge empowers workers to make informed decisions that are more closely aligned to their risk tolerance and financial goals. This suggestion chimes with Lusardi et al. (Reference Lusardi, Michaud and Mitchell2017) and (Reference Lusardi, Michaud and Mitchell2020).
3.3.2 Key considerations for selecting delegated funds
The sensitivity analysis conducted in Section 3.2 demonstrates that both asset allocation constraints and the manager’s alpha can significantly influence variations in average CEC results. Alterations in other factors, such as the investment benchmark, replacement ratio, and weight in the terminal target, contribute only limited fluctuations to the lifetime utility outcomes. Thus, when choosing a fund manager, it is advisable for the individual worker to consider not only the investment objective and the fee expense but also critical factors such as investment constraints (e.g., for short-selling and borrowing) and stock-picking ability (e.g., manager’s alpha estimate). Mutual fund investment papers, such as Chen et al. (Reference Chen, Desai and Krishnamurthy2013) and Huang et al. (Reference Huang, Pilbeam and Pouliot2021), also emphasize the importance of allocation flexibility and underscore the significance of stock-picking ability. Furthermore, a recent mutual fund survey by Holden et al. (Reference Holden, Bogdan and Schrass2022) shows that the majority of mutual fund investors in the US tend to base their fund delegation decisions on factors such as the fund’s investment objective, the risk level of the fund’s investments,Footnote 7 performance relative to an index/benchmark, and fund fees and expenses, in alignment with our findings.
4. Concluding remarks and future directions
In this paper, we explore a stochastic life cycle planning problem where the individual worker is presented with four irrevocable investment options, which are (S) self-management with dynamic investment, (B) self-management with benchmark investment, ( $\text{H}_1$
) hire-management with flexible allocation, and (
$\text{H}_1$
) hire-management with flexible allocation, and ( $\text{H}_2$
) hire-management with alpha focus. We examine the investment allocations and pre-tax consumption behaviors during the DC fund accumulation period, ending with purchasing a life annuity to finance post-retirement consumption. Our findings indicate that hiring a fund manager can enhance a worker’s lifetime utility, especially when the manager demonstrates exceptional stock-picking ability. This expertise allows for improved risk-weighted investment outcomes, thereby boosting fund accumulation for individual workers. Our numerical analysis reveals that a worker could allocate up to 1.11% (resp. 0.16%) and 1.35% (resp. 0.42%) of the funds as management fees to active (resp. passive) fund managers, while still surpassing the outcomes of dynamic self-management and deterministic investments. However, when incorporating the latest US fund fee data, the advantage of delegated investments wanes against dynamic self-management, though both retain an edge over the deterministic strategy. Moreover, as highlighted by mutual fund research such as Fama & French (Reference Fama and French2010) and Harvey & Liu (Reference Harvey and Liu2022), finding a fund manager who can deliver consistently high positive alpha over time is challenging. Considering this alongside agency risk and management fee concerns, dynamic self-management may emerge as a more viable investment option for the worker. This insight also underscores the potential superiority of dynamic self-investment strategies, as aligned with Dahlquist et al. (Reference Dahlquist, Setty and Vestman2018) and Khemka et al. (Reference Khemka, Steffensen and Warren2021), over deterministic age-based strategies. Importantly, our findings shed light on the potential of delegated strategies over age-based life cycle ones, a unique contribution to pension fund literature, given the scarcity of such comparative studies.
$\text{H}_2$
) hire-management with alpha focus. We examine the investment allocations and pre-tax consumption behaviors during the DC fund accumulation period, ending with purchasing a life annuity to finance post-retirement consumption. Our findings indicate that hiring a fund manager can enhance a worker’s lifetime utility, especially when the manager demonstrates exceptional stock-picking ability. This expertise allows for improved risk-weighted investment outcomes, thereby boosting fund accumulation for individual workers. Our numerical analysis reveals that a worker could allocate up to 1.11% (resp. 0.16%) and 1.35% (resp. 0.42%) of the funds as management fees to active (resp. passive) fund managers, while still surpassing the outcomes of dynamic self-management and deterministic investments. However, when incorporating the latest US fund fee data, the advantage of delegated investments wanes against dynamic self-management, though both retain an edge over the deterministic strategy. Moreover, as highlighted by mutual fund research such as Fama & French (Reference Fama and French2010) and Harvey & Liu (Reference Harvey and Liu2022), finding a fund manager who can deliver consistently high positive alpha over time is challenging. Considering this alongside agency risk and management fee concerns, dynamic self-management may emerge as a more viable investment option for the worker. This insight also underscores the potential superiority of dynamic self-investment strategies, as aligned with Dahlquist et al. (Reference Dahlquist, Setty and Vestman2018) and Khemka et al. (Reference Khemka, Steffensen and Warren2021), over deterministic age-based strategies. Importantly, our findings shed light on the potential of delegated strategies over age-based life cycle ones, a unique contribution to pension fund literature, given the scarcity of such comparative studies.
Finally, we acknowledge the limitations of our study and provide a non-comprehensive list of potential improvements. We only consider power utility for individual workers. The key findings may vary if we employ a different preference ordering (e.g., reference-dependent utility) in our model. As previously noted, maintaining a constantly high positive alpha over time is actually challenging for an active fund manager. Hence, adopting a model that allows alpha to vary around zero (or a median value) might provide a more realistic representation of manager’s performance. Moreover, future research could extend our model to other countries to see if similar conclusions apply across different retirement systems. Allowing for stochastic salary and including the post-retirement phase decision-making process are avenues of future research. In addition, enriching our analysis to include factors like family status, health, and investment transaction costs could provide further insights.
Supplementary material
The supplementary material for this article can be found at https://doi.org/10.1017/S1748499524000253
Acknowledgment
Earlier drafts of this paper were presented at the Online International Conference in Actuarial Science, Data Science, and Finance in 2020; the International Centre for Asset Management, Insurance, and Risk Management online seminar in 2020; the Australian National University Research School of Financial, Actuarial Studies, and Statistics Actuarial PhD Mini-Symposium in 2021; and the Australasian Actuarial Education and Research Symposium in 2023. The authors thank Fedor Ishkakov, Adam Butt, and Geoff Warren for their comments on an earlier draft of the paper.
Data availability statement
The computation data and code supporting the findings of this study are available at https://github.com/LeoHuang8988/AAS_paper_code_2024.
Funding statement
No funding was provided for this project.
Competing interests
“None.”
Appendix A. Derivation of Equation (3)
Let $T_{x_0}\geq 0$
be the future lifetime of the worker currently aged
$T_{x_0}\geq 0$
be the future lifetime of the worker currently aged $x_0$
. As we assume that the worker lives until retirement with certainty,
$x_0$
. As we assume that the worker lives until retirement with certainty, $ \mathbb{P}(T_{x_0}\gt T)=1$
. Let also
$ \mathbb{P}(T_{x_0}\gt T)=1$
. Let also $C\geq 0$
be the constant annuity income received by the worker during retirement.
$C\geq 0$
be the constant annuity income received by the worker during retirement.
Based on the problem formulation for the worker, we have the following objective function for the worker at time $t=0$
:
$t=0$
:
 \begin{equation} J^{\text{W}}\left (W,\pi \right )=\mathbb{E}\left [\sum _{t=0}^{T-1}\beta ^{t}\times u\left (W_t-\tau \left (W_t\right )\right )\times \unicode{x1D7D9}_{\{T_{x_0}\gt t\}} + \sum _{t=T}^{\infty }\beta ^{t}\times u\left (C-\tau \left (C\right )\right )\times \unicode{x1D7D9}_{\{T_{x_0}\gt t\}} \right ]. \end{equation}
Since
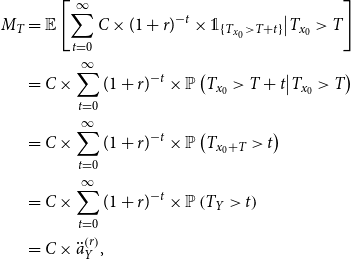 \begin{equation*} \begin {aligned} M_T&=\mathbb {E}\left [\sum _{t=0}^{\infty }C\times (1+r)^{-t} \times \unicode {x1D7D9}_{\{T_{x_0}\gt T+t\}}\big \vert T_{x_0}\gt T\right ]\\ &=C\times \sum _{t=0}^{\infty } (1+r)^{-t} \times \mathbb {P}\left ({T_{x_0}\gt T+t}\big \vert T_{x_0}\gt T\right ) \\ &=C\times \sum _{t=0}^{\infty } (1+r)^{-t} \times \mathbb {P}\left (T_{x_0+T}\gt t\right )\\ &=C\times \sum _{t=0}^{\infty } (1+r)^{-t} \times \mathbb {P}\left (T_Y\gt t\right )\\ &= C\times \ddot {a}_{Y}^{\left (r\right )}, \end {aligned} \end{equation*}
we have
 \begin{equation} C= \frac{M_T}{\ddot{a}_{Y}^{\left (r\right )}}. \end{equation}
By substituting equation (A2) into equation (A1), we obtain
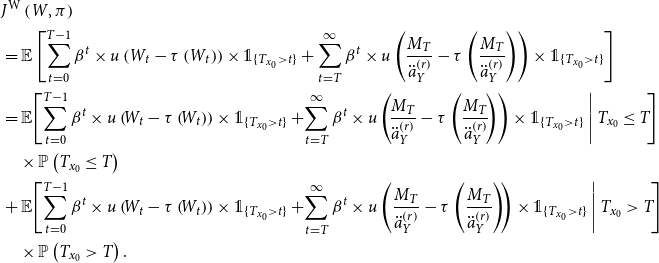 \begin{equation} \begin{aligned} &J^{\text{W}}\left (W,\pi \right )\\ &=\mathbb{E}\left [\sum _{t=0}^{T-1}\beta ^{t}\times u\left (W_t-\tau \left (W_t\right )\right )\times \unicode{x1D7D9}_{\{T_{x_0}\gt t\}} + \sum _{t=T}^{\infty }\beta ^{t}\times u\left (\frac{M_T}{\ddot{a}_{Y}^{\left (r\right )}}-\tau \left (\frac{M_T}{\ddot{a}_{Y}^{\left (r\right )}}\right )\right )\times \unicode{x1D7D9}_{\{T_{x_0}\gt t\}} \right ]\\ &=\mathbb{E}\!\left [\sum _{t=0}^{T-1}\beta ^{t}\times u\left (\!W_t-\tau \left (\!W_t\right )\right )\times \unicode{x1D7D9}_{\{T_{x_0}\gt t\}} + \!\sum _{t=T}^{\infty }\beta ^{t}\times u\left (\!\frac{M_T}{\ddot{a}_{Y}^{\left (r\right )}}-\tau \left (\frac{M_T}{\ddot{a}_{Y}^{\left (r\right )}}\!\right )\right )\times \unicode{x1D7D9}_{\{T_{x_0}\gt t\}} \,\middle |\,T_{x_0}\leq T \!\right ] \\ &\quad \times \mathbb{P}\left (T_{x_0}\leq T\right )\\ &+ \mathbb{E}\!\left [\sum _{t=0}^{T-1}\beta ^{t}\times u\left (\!W_t-\tau \left (\!W_t\right )\right )\times \unicode{x1D7D9}_{\{T_{x_0}\gt t\}} + \!\sum _{t=T}^{\infty }\beta ^{t}\times u\left (\frac{M_T}{\ddot{a}_{Y}^{\left (r\right )}}-\tau \left (\frac{M_T}{\ddot{a}_{Y}^{\left (r\right )}}\right )\!\right )\times \unicode{x1D7D9}_{\{T_{x_0}\gt t\}} \,\middle |\,T_{x_0}\gt T \!\right ] \\ &\quad \times \mathbb{P}\left (T_{x_0}\gt T\right ). \end{aligned} \end{equation}
Since $\mathbb{P}\left (T_{x_0}\gt T\right )=1$
,
$\mathbb{P}\left (T_{x_0}\gt T\right )=1$
, $\mathbb{P}\left (T_{x_0}\leq T\right )=1-\mathbb{P}\left (T_{x_0}\gt T\right )=0$
, we have
$\mathbb{P}\left (T_{x_0}\leq T\right )=1-\mathbb{P}\left (T_{x_0}\gt T\right )=0$
, we have
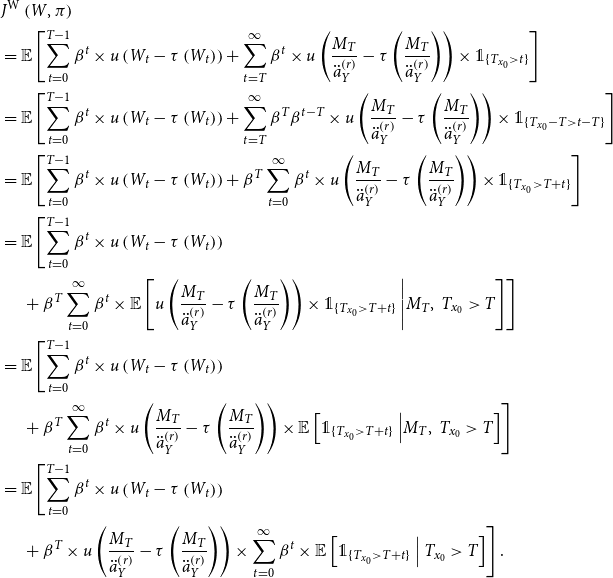 \begin{equation} \begin{aligned}&J^{\text{W}}\left (W,\pi \right )\\ &= \mathbb{E}\left [\sum _{t=0}^{T-1}\beta ^{t}\times u\left (W_t-\tau \left (W_t\right )\right ) + \sum _{t=T}^{\infty }\beta ^{t}\times u\left (\frac{M_T}{\ddot{a}_{Y}^{\left (r\right )}}-\tau \left (\frac{M_T}{\ddot{a}_{Y}^{\left (r\right )}}\right )\right )\times \unicode{x1D7D9}_{\{T_{x_0}\gt t\}} \right ]\\ &= \mathbb{E}\left [\sum _{t=0}^{T-1}\beta ^{t}\times u\left (W_t-\tau \left (W_t\right )\right )+ \sum _{t=T}^{\infty }\beta ^{T}\beta ^{t-T}\times u\left (\frac{M_T}{\ddot{a}_{Y}^{\left (r\right )}}-\tau \left (\frac{M_T}{\ddot{a}_{Y}^{\left (r\right )}}\right )\right )\times \unicode{x1D7D9}_{\{T_{x_0}-T\gt t-T\}} \right ]\\ &= \mathbb{E}\left [\sum _{t=0}^{T-1}\beta ^{t}\times u\left (W_t-\tau \left (W_t\right )\right )+ \beta ^{T}\sum _{t=0}^{\infty }\beta ^{t}\times u\left (\frac{M_T}{\ddot{a}_{Y}^{\left (r\right )}}-\tau \left (\frac{M_T}{\ddot{a}_{Y}^{\left (r\right )}}\right )\right )\times \unicode{x1D7D9}_{\{T_{x_0}\gt T+t\}} \right ]\\ &= \mathbb{E}\left [\sum _{t=0}^{T-1}\beta ^{t}\times u\left (W_t-\tau \left (W_t\right )\right )\right .\\ &\quad \left .\vphantom{\sum _{t=0}^{T-1}} + \beta ^{T}\sum _{t=0}^{\infty }\beta ^{t}\times \mathbb{E}\left [u\left (\frac{M_T}{\ddot{a}_{Y}^{\left (r\right )}}-\tau \left (\frac{M_T}{\ddot{a}_{Y}^{\left (r\right )}}\right )\right )\times \unicode{x1D7D9}_{\{T_{x_0}\gt T+t\}}\ \middle |M_T, \ T_{x_0}\gt T \right ] \right ]\\ &= \mathbb{E}\left [\sum _{t=0}^{T-1}\beta ^{t}\times u\left (W_t-\tau \left (W_t\right )\right )\right .\\ &\quad \left .\vphantom{\sum _{t=0}^{T-1}} + \beta ^{T}\sum _{t=0}^{\infty }\beta ^{t}\times u\left (\frac{M_T}{\ddot{a}_{Y}^{\left (r\right )}}-\tau \left (\frac{M_T}{\ddot{a}_{Y}^{\left (r\right )}}\right )\right )\times \mathbb{E}\left [ \unicode{x1D7D9}_{\{T_{x_0}\gt T+t\}}\ \middle |M_T, \ T_{x_0}\gt T \right ] \right ]\\ &= \mathbb{E}\left [\sum _{t=0}^{T-1}\beta ^{t}\times u\left (W_t-\tau \left (W_t\right )\right )\right .\\ &\quad \left .\vphantom{\sum _{t=0}^{T-1}} + \beta ^{T}\times u\left (\frac{M_T}{\ddot{a}_{Y}^{\left (r\right )}}-\tau \left (\frac{M_T}{\ddot{a}_{Y}^{\left (r\right )}}\right )\right )\times \sum _{t=0}^{\infty }\beta ^{t}\times \mathbb{E}\left [ \unicode{x1D7D9}_{\{T_{x_0}\gt T+t\}}\ \middle | \ T_{x_0}\gt T \right ] \right ]. \end{aligned} \end{equation}
Finally, since
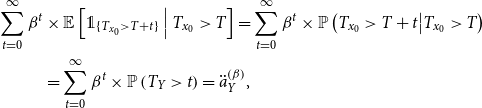 \begin{equation} \begin{aligned} \sum _{t=0}^{\infty }\beta ^{t}&\times \mathbb{E}\left [ \unicode{x1D7D9}_{\{T_{x_0}\gt T+t\}}\ \middle | \ T_{x_0}\gt T \right ] = \sum _{t=0}^{\infty }\beta ^{t}\times \mathbb{P}\left (T_{x_0}\gt T+t\middle | T_{x_0}\gt T\right )\\ &= \sum _{t=0}^{\infty }\beta ^{t}\times \mathbb{P}\left (T_Y\gt t\right ) = \ddot{a}_{Y}^{\left (\beta \right )}, \end{aligned}\end{equation}
by substituting equation (A5) into equation (A4), we obtain
 \begin{equation*} J^{\text {W}}\left (W,\pi \right )= \mathbb {E}\left [\sum _{t=0}^{T-1}\beta ^{t}\times u\left (W_t-\tau \left (W_t\right )\right ) + \beta ^{T}\times u\left (\frac {M_T}{\ddot {a}_{Y}^{\left (r\right )}}-\tau \left (\frac {M_T}{\ddot {a}_{Y}^{\left (r\right )}}\right )\right )\times \ddot {a}_{Y}^{\left (\beta \right )} \right ]. \end{equation*}
Appendix B. VFI Algorithm Details
The VFI algorithm in the Stackelberg game setting is briefly summarized in Algorithm1.
Value function iteration in Stackelberg game setting

Appendix C. Optimization and Simulation Results
Policy functions for the four cases (where S: Self-Management with Dynamic Investment, B: Self-Management with Benchmark Investment, H 1: Hire-Management with Flexible Allocation, and H 2: Hire-Management with Alpha Focus).
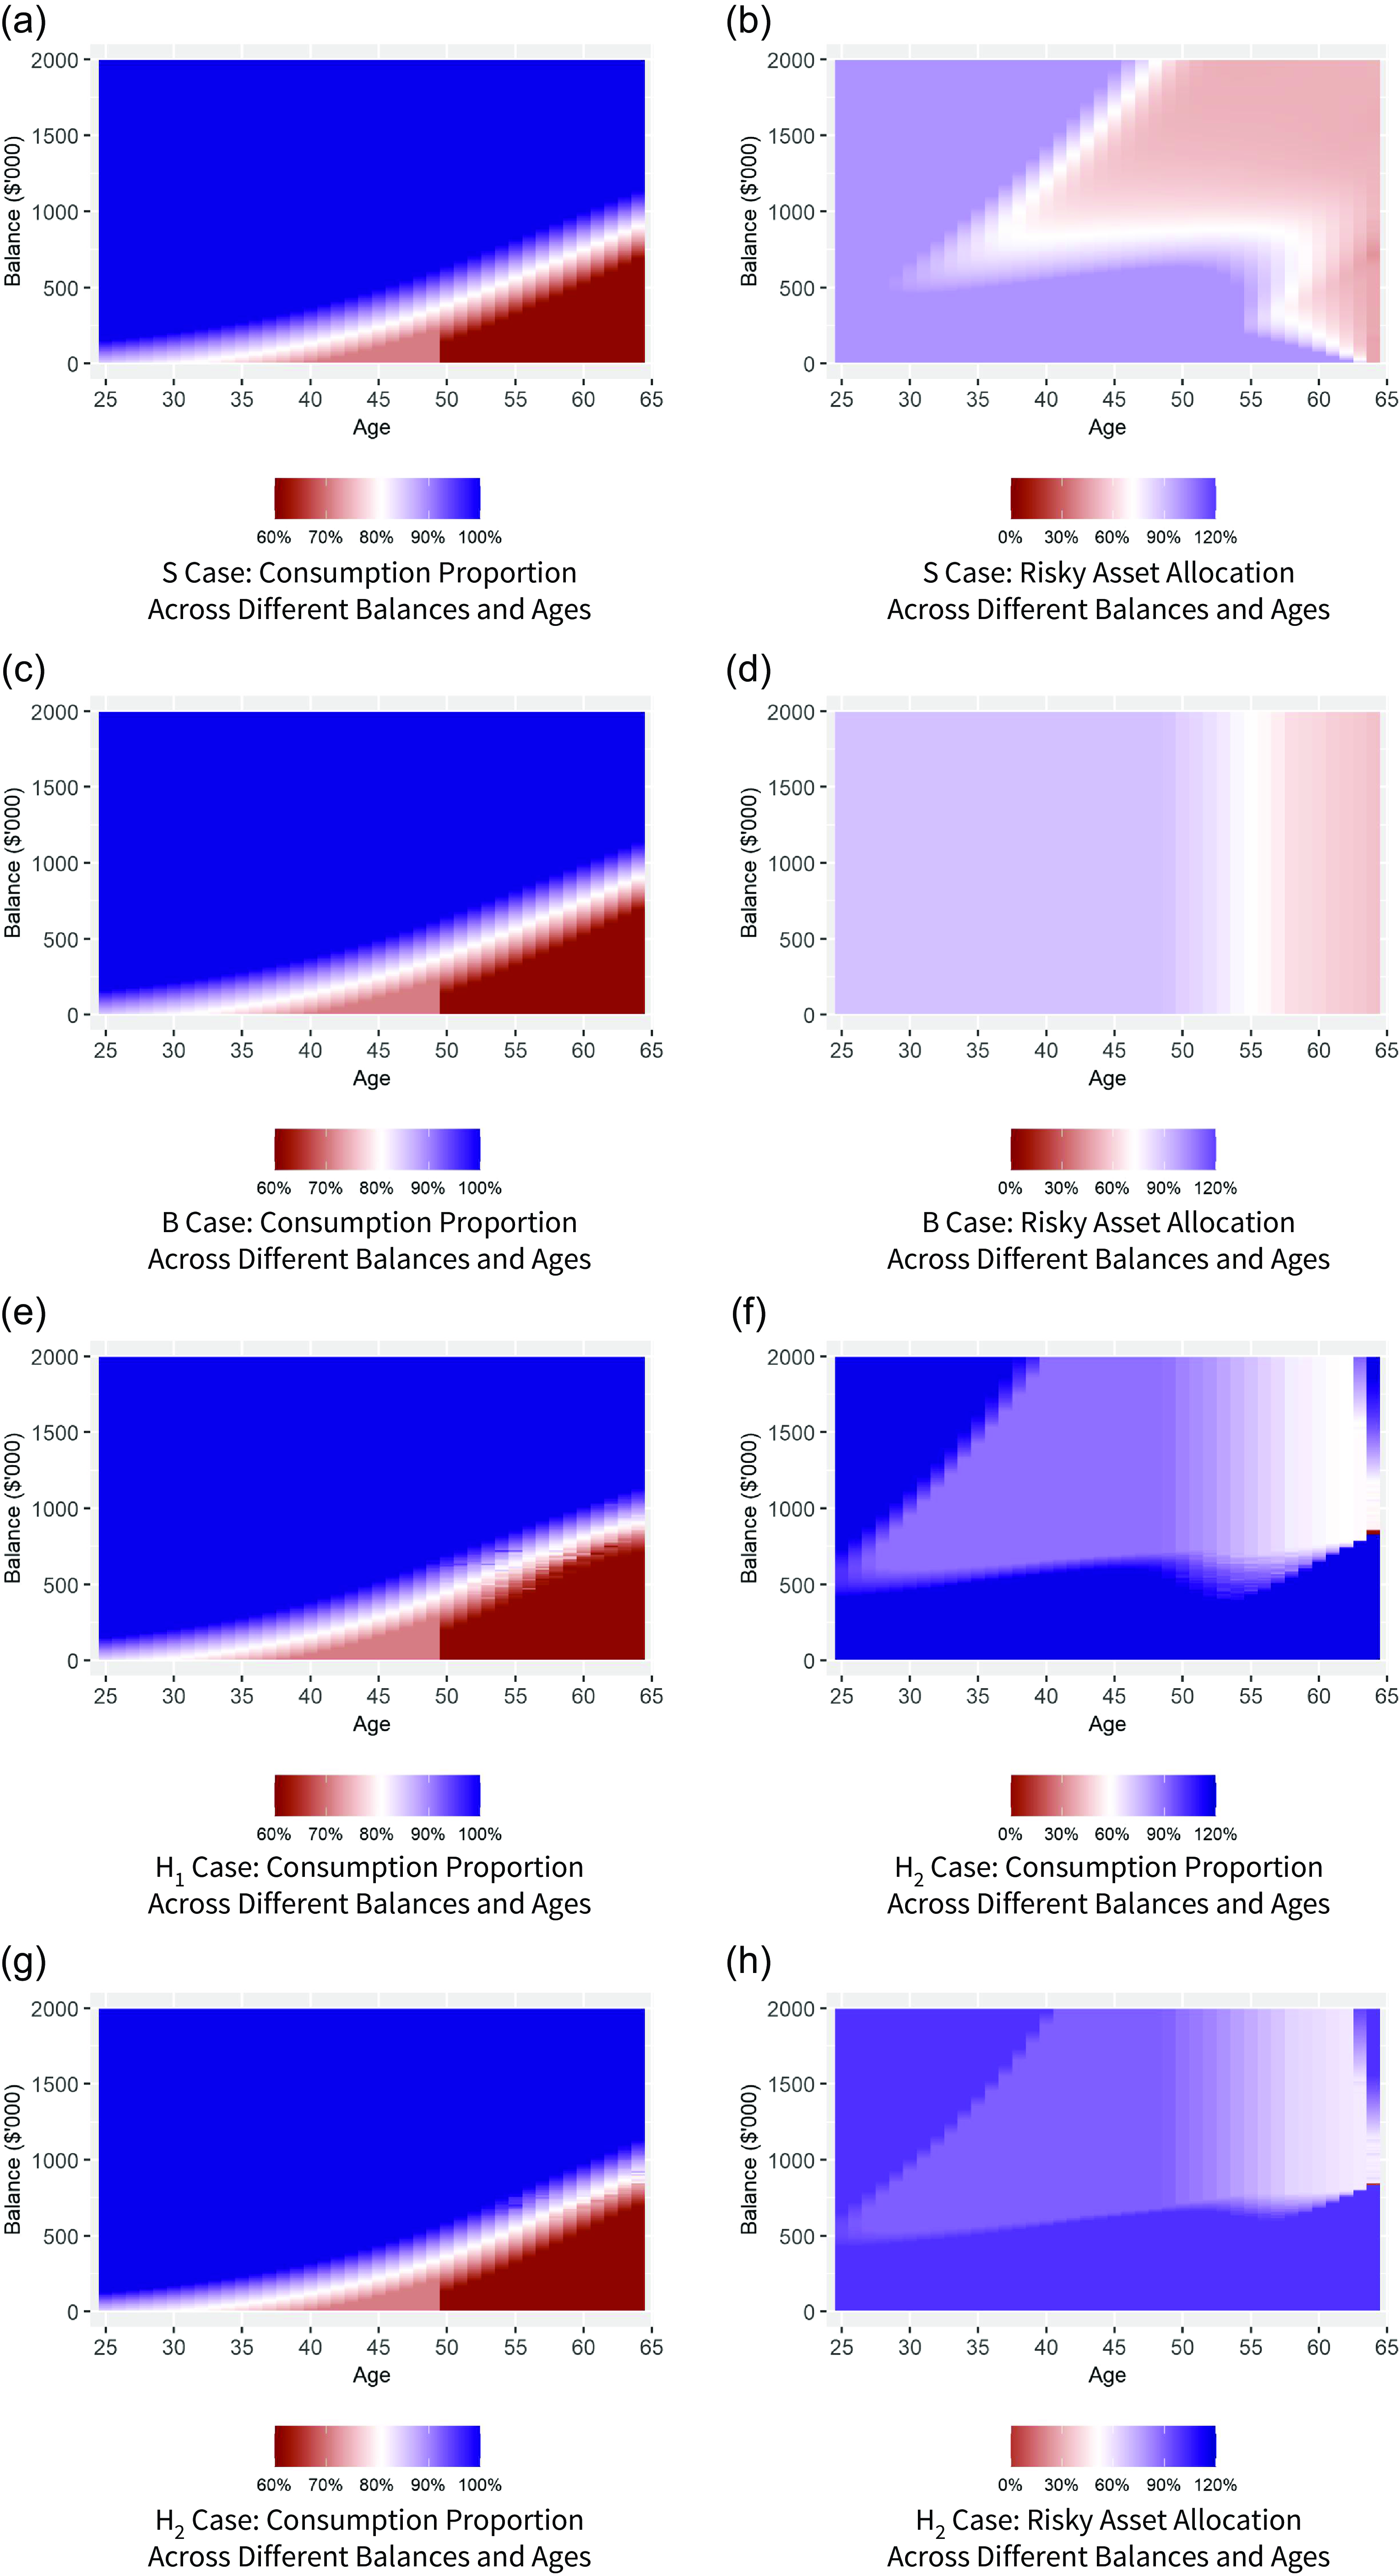
Figure C.1 shows the pre-tax consumption and risky asset allocation policy functions across all four options. Specifically, the left figures are policy functions for the proportion of pre-tax consumption over the constant yearly compensation income (i.e., consumption proportion) whereas the right figures are policy functions for the risky asset allocations. The first, second, third and fourth rows of figures stand for the S case, the B case, the H1 case and the H2 case, respectively. For each of the eight figures, the x-axis represents the worker’s age from 25 to 64 and the y-axis represents the fund balance ranging between $0 and $2 million.
From Figs. C.1a, c, e, and g, the optimal consumption patterns across the four cases exhibit high similarity. The consumption proportions range from 60% (dark red)Footnote 10 to 100% (dark blue). With a starting fund balance of $0, the worker takes around 85% of yearly income for pre-tax consumption, which declines to approximately 60% of yearly income by age 50 years which is maintained thereafter. The significant change in consumption proportion for lower balances at age 50 years is primarily due to the regulation that the contribution limit $\overline{B}_t$
increases at age 50 years. Overall, the high similarity of consumption proportion policy function between those four cases reveals that the broad pattern of worker’s consumption decision depends on age and retirement account balance, rather than investment strategies. These findings are consistent with the literature (see, e.g., Dahlquist et al., Reference Dahlquist, Setty and Vestman2018; Fischer et al., Reference Fischer, Kraft and Munk2013).
$\overline{B}_t$
increases at age 50 years. Overall, the high similarity of consumption proportion policy function between those four cases reveals that the broad pattern of worker’s consumption decision depends on age and retirement account balance, rather than investment strategies. These findings are consistent with the literature (see, e.g., Dahlquist et al., Reference Dahlquist, Setty and Vestman2018; Fischer et al., Reference Fischer, Kraft and Munk2013).
Different from the consumption decisions, Fig. C.1b, d, f, and h reveal stark differences in the risky asset allocation policy functions across those four cases. The risky asset allocations range between 0% (dark red) and 120% (dark blue). Fig. C.1b displays the dynamic asset allocation decisions under the S case with a wedge pattern visible. Looking at the figure horizontally, for a given level of starting balance ( $M_t$
), the worker’s decreasing “human capital” (i.e., the future earning potential) over time leads to reduced risky asset allocations (Bodie et al., Reference Bodie, Merton and Samuelson1992). Vertically, for a given age (e.g., age 45 years), the risky asset allocation decreases with increasing saving balance but then increases at extremely high saving balances. This is due to the combination of two effects. First, the proportion of wealth in human capital decreases as the balance increase, which also reduces worker’s interest in taking more risky investments. Second, the boundary condition for consumption caps the worker’s maximum consumption (i.e., the yearly income
$M_t$
), the worker’s decreasing “human capital” (i.e., the future earning potential) over time leads to reduced risky asset allocations (Bodie et al., Reference Bodie, Merton and Samuelson1992). Vertically, for a given age (e.g., age 45 years), the risky asset allocation decreases with increasing saving balance but then increases at extremely high saving balances. This is due to the combination of two effects. First, the proportion of wealth in human capital decreases as the balance increase, which also reduces worker’s interest in taking more risky investments. Second, the boundary condition for consumption caps the worker’s maximum consumption (i.e., the yearly income $e$
), promoting riskier investment (Butt & Khemka, Reference Butt and Khemka2015). In addition, purchasing a life annuity at the beginning of the retirement can exert protection effects on individuals during retirement (Friedman & Warshawsky, Reference Friedman and Warshawsky1990), explaining the dramatic drop in the risky asset allocation at ages near retirement. These results are in accordance with the findings of Bodie et al. (Reference Bodie, Merton and Samuelson1992) and Butt & Khemka (Reference Butt and Khemka2015). For the B case, Fig. C.1d confirms that the deterministic age-based risky investments follow the life cycle strategy shown in Fig. 1. Regardless of fund balance fluctuations, the risky asset allocations decrease gradually as the worker ages.
$e$
), promoting riskier investment (Butt & Khemka, Reference Butt and Khemka2015). In addition, purchasing a life annuity at the beginning of the retirement can exert protection effects on individuals during retirement (Friedman & Warshawsky, Reference Friedman and Warshawsky1990), explaining the dramatic drop in the risky asset allocation at ages near retirement. These results are in accordance with the findings of Bodie et al. (Reference Bodie, Merton and Samuelson1992) and Butt & Khemka (Reference Butt and Khemka2015). For the B case, Fig. C.1d confirms that the deterministic age-based risky investments follow the life cycle strategy shown in Fig. 1. Regardless of fund balance fluctuations, the risky asset allocations decrease gradually as the worker ages.
In terms of the hire-management cases (i.e., $\text{H}_1$
and
$\text{H}_1$
and $\text{H}_2$
), recall that the manager’s investment decisions are determined with reference to two objectives: maximizing the chance of beating the benchmark return (from a target date fund) and maximizing the probability of exceeding the worker’s post-retirement annual post-tax consumption target, which implies a targeted terminal fund balance. As revealed from the manager’s objective function, the interim target dominates at younger ages, whereas the terminal target becomes relatively more important in the years leading up to retirement. Fig. C.1f indicates that the passive fund manager prefers to fully invest in the risky asset (i.e., adhere to the upper bound of 116%) at earlier ages, accompanied with a wedge pattern existing at around
$\text{H}_2$
), recall that the manager’s investment decisions are determined with reference to two objectives: maximizing the chance of beating the benchmark return (from a target date fund) and maximizing the probability of exceeding the worker’s post-retirement annual post-tax consumption target, which implies a targeted terminal fund balance. As revealed from the manager’s objective function, the interim target dominates at younger ages, whereas the terminal target becomes relatively more important in the years leading up to retirement. Fig. C.1f indicates that the passive fund manager prefers to fully invest in the risky asset (i.e., adhere to the upper bound of 116%) at earlier ages, accompanied with a wedge pattern existing at around $\$500,000$
balances and above. This can be attributed to the combination of two impacts. First, since a higher risky asset allocation can translate to a higher expected return, the interim target encourages the manager to take more aggressive investments. Second, for the fund balances approaching the critical figure
$\$500,000$
balances and above. This can be attributed to the combination of two impacts. First, since a higher risky asset allocation can translate to a higher expected return, the interim target encourages the manager to take more aggressive investments. Second, for the fund balances approaching the critical figure $\$ 857,868.51$
(which leads to
$\$ 857,868.51$
(which leads to $\frac{M_{T}}{\ddot{a}_{Y}^{\left (r\right )}}-\tau \left (\frac{M_{T}}{\ddot{a}_{Y}^{\left (r\right )}}\right )=B$
), the investment manager prefers to adopt a more conservative investment strategy to secure the terminal target. After inception of age 25 years, the growing importance of the terminal target prompts the manager to reduce investments in risky assets for a wider range of fund balances. At lower balances, both targets agree on the maximum possible allocation to chase a higher expected return and catch up with the terminal target. However, at exceptionally high balances, the diminished motivation for aggressive investment and the potential influence of securing terminal target contribute to the manager’s decision to undertake the risky asset allocation slightly higher than the benchmark. Further, it is interesting to observe that at a given age, the range of fund balances for which the manager decides to reduce risky asset allocation becomes narrower when the worker is closer to retirement age. This is because the uncertainty of whether the terminal target is attained decreases significantly as the worker approaches retirement age.
$\frac{M_{T}}{\ddot{a}_{Y}^{\left (r\right )}}-\tau \left (\frac{M_{T}}{\ddot{a}_{Y}^{\left (r\right )}}\right )=B$
), the investment manager prefers to adopt a more conservative investment strategy to secure the terminal target. After inception of age 25 years, the growing importance of the terminal target prompts the manager to reduce investments in risky assets for a wider range of fund balances. At lower balances, both targets agree on the maximum possible allocation to chase a higher expected return and catch up with the terminal target. However, at exceptionally high balances, the diminished motivation for aggressive investment and the potential influence of securing terminal target contribute to the manager’s decision to undertake the risky asset allocation slightly higher than the benchmark. Further, it is interesting to observe that at a given age, the range of fund balances for which the manager decides to reduce risky asset allocation becomes narrower when the worker is closer to retirement age. This is because the uncertainty of whether the terminal target is attained decreases significantly as the worker approaches retirement age.
In addition, despite the differences in the upper allocation boundary, the high similarity between Fig. C.1f and h reveals that changes in the expected risk premium (or alpha) have a limited impact on the risky asset allocation decision pattern in the fund delegations. However, comparing those two figures, it is noticeable that the advantageous expected risk premium and reduced risk exposure (reflected by a lower upper allocation boundary) tend to moderately delay the manager’s decision to decrease risky investment.
Median outcomes of 10,000 simulations for the four cases (where S: Self-Management with Dynamic Investment, B: Self-Management with Benchmark Investment, H 1: Hire-Management with Flexible Allocation, and H 2: Hire-Management with Alpha Focus).

Figure C.2 depicts the median outcomes of simulations across four cases: the blue double-dashed line represents S, the blue solid line represents B, the red dotted-dashed line represents H1, and the red dotted line represents H2. Figure C.2a shows the evolution of median fund balances under these cases. Notably, due to outstanding fund performances, the hire-management cases consistently outperform the self-management cases in median fund balance. Primarily benefiting from the highest risky asset allocation between ages 25 and 50 (as indicated in Fig. C.2b), the H1 case’s median fund balance increases rapidly at earlier ages, maintaining its advantage over the self-management cases until retirement. This suggests that the H1 case, with its wider risky investment constraints, achieves superior risk-adjusted return performance despite agency risk. In contrast to the H1 case, the H2 case, with better expected risky returns and reduced risk exposure, encourages higher consumption due to perceived stability and potential gains in the investment fund (Michaelides and Zhang Reference Michaelides and Zhang2017). The H2 case, characterised by higher consumption and lower allocations to risky investments, results in a slightly lower median fund balance at earlier ages compared to H1. However, the H2 case, consistently driven by advantageous expected risk premiums and despite lower fund contributions, achieves even better risk-adjusted return performance, resulting in a higher median fund balance than the other three cases at ages closer to retirement. Then, when getting closer to retirement, to ensure attainment of the target, there is an evident deviation from the maximum allowable risky asset allocation in the hire-management cases. Furthermore, compared to the B case, the dynamic nature of asset investment in the H1, H2, and S cases facilitates greater savings fund accumulation, aligning with Khemka, Steffensen, and Warren Reference Khemka, Steffensen and Warren2021.
Fig. C.2c and d in the lower panel of Fig. C.2 shows the median outcomes of pre-tax consumption and post-tax consumption, respectively. Again, all four cases share similar broad consumption patterns, and the consumption proportion policy functions primarily vary over different ages and fund balances. Hence, with substantially larger fund balances at later ages under the hire-management cases, the worker’s corresponding consumption amounts are relatively higher than those in the self-management cases. Moreover, Fig. C.2a and c imply that, due to relatively higher pre-tax consumption and a higher terminal balance, the $\text{H}_2$
case enjoys the highest CECs and, consequently, the highest extra management fee compared with the other three cases. In addition, because of the progressive income taxation, the post-tax consumption amounts are lower than the pre-tax consumption amounts, but their decision patterns are very similar. Overall, those results evaluated in Fig. C.2 confirm our findings in Section 3.1.
$\text{H}_2$
case enjoys the highest CECs and, consequently, the highest extra management fee compared with the other three cases. In addition, because of the progressive income taxation, the post-tax consumption amounts are lower than the pre-tax consumption amounts, but their decision patterns are very similar. Overall, those results evaluated in Fig. C.2 confirm our findings in Section 3.1.
Appendix D. Supplementary Sensitivity Analysis
In this section, we carry out supplementary sensitivity tests to see how CEC outcomes vary with changes in other primary model parameters. The statistics are summarized in Table D.1. Similar to Table 7, we present only CEC results and the percentage difference compared to the baseline in this table. The initial results are displayed in Table D.1’s top row, succeeded by the key results from sensitivity tests. If a sensitivity test is marked as blank, it signifies its irrelevance to the specific case. The following subsections will delve into each test in detail, drawing upon the results presented in the table.
D.1. Yearly compensation income
We test both $55,000 and $85,000 yearly compensation incomes, compared to the baseline parameter value of $70,000. We find that, for higher compensation income, the CEC results increase by around 21% across those cases. This is because more compensation incomes enables the attainment of more consumption and savings over the accumulation phase. This trend is consistent with lower CEC results when the value of compensation income is set to be higher. The impact is slightly nonlinear because of the upper constraint on the saving fund contributions as well as the progressive income tax computations.
D.2. CRRA utility parameter
For utility preference parameter $\rho$
, we test values of
$\rho$
, we test values of $\rho =3$
and
$\rho =3$
and $\rho =5$
and make comparisons with the baseline value
$\rho =5$
and make comparisons with the baseline value $\rho =4$
. For the higher relative risk aversion, the worker tends to have lower propensity to take risks in the investment and more incentives to reduce current consumption to protect themselves against poor outcomes. The opposite occurs when the worker becomes less risk-averse. Additionally, unlike the S case, the investment strategies under
$\rho =4$
. For the higher relative risk aversion, the worker tends to have lower propensity to take risks in the investment and more incentives to reduce current consumption to protect themselves against poor outcomes. The opposite occurs when the worker becomes less risk-averse. Additionally, unlike the S case, the investment strategies under $\text{H}_1$
,
$\text{H}_1$
, $\text{H}_2$
, and B are not determined by the worker’s risk aversion. Hence, the changes in CEC are influenced by the worker’s alternations in consumption patterns.
$\text{H}_2$
, and B are not determined by the worker’s risk aversion. Hence, the changes in CEC are influenced by the worker’s alternations in consumption patterns.
Supplementary sensitivity test results for average CEC
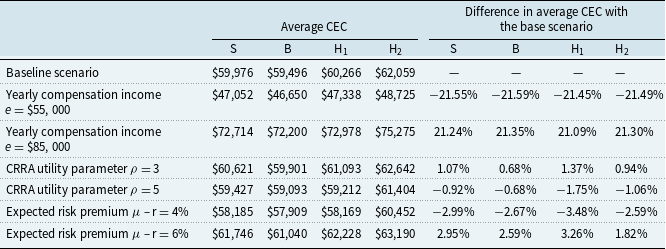
Table shows the supplementary sensitivity test results on average CEC and the related percentage difference compared with the base scenario for self-management with dynamic investment (S), self-management with benchmark investment (B), hire-management with flexible allocation (H1), and hire-management with alpha focus (H2), respectively. In this table, we present sensitivity results for yearly compensation income, CRRA utility parameter, and expected risk premium.
D.3. Expected risk premium
We evaluate the CEC results by varying the expected risk premium by $\pm 1\%$
from the baseline of 5%. Referring back to Table D.1, increasing (decreasing) the expected risk premium causes an approximately 2–3% increase (decrease) in CEC results over those cases. This indicates that a favorable risky asset return distribution can boost the accumulation of saving fund, thus leading to better retirement saving outcomes. It is worth noting that the CEC results in the
$\pm 1\%$
from the baseline of 5%. Referring back to Table D.1, increasing (decreasing) the expected risk premium causes an approximately 2–3% increase (decrease) in CEC results over those cases. This indicates that a favorable risky asset return distribution can boost the accumulation of saving fund, thus leading to better retirement saving outcomes. It is worth noting that the CEC results in the $\text{H}_1$
case exhibit significantly more variation compared to the other three cases. This variation is attributed to the fund manager’s investment objective function being more closely tied to the risk premium of the risky asset and the wider investment allocation constraints allowing for greater exposure to risky investments. In addition, the smaller variation in the
$\text{H}_1$
case exhibit significantly more variation compared to the other three cases. This variation is attributed to the fund manager’s investment objective function being more closely tied to the risk premium of the risky asset and the wider investment allocation constraints allowing for greater exposure to risky investments. In addition, the smaller variation in the $H_2$
results indicates that sensitivity to percentage changes is less pronounced at higher baseline risky returns, leading to a smaller relative effect on the CEC outcome.
$H_2$
results indicates that sensitivity to percentage changes is less pronounced at higher baseline risky returns, leading to a smaller relative effect on the CEC outcome.


 Open access