




1. Introduction
In Latin America and the Caribbean (LAC), the circular economy (CE) is gaining momentum as a strategic response to the social and environmental weaknesses of the traditional linear economic model. High-level political attention and new national policies have emerged, reflecting a shared regional vision emphasising resilience, inclusivity, and sustainable development. The transition to circularity is seen as especially urgent after the COVID-19 pandemic exposed vulnerabilities in global supply chains and natural resource depletion throughout the region. Adoption of Industry 4.0 technologies is recognised as essential to making circular business models profitable and environmentally viable, but investment in research and development remains low compared to global averages (Chatham House, 2020, 14). For a just and sustainable transition, emphasis is placed on social innovation, equitable benefit distribution, transparent governance, and the incorporation of circular principles in priority sectors such as mining, waste management, and the bioeconomy (Chatham House, 2020, 26). Progress depends on financing and practical cooperation across national borders and active engagement by governments, businesses, and civil society (Ellen MacArthur Foundation, 2021, 43; UNEP, 2023, 91; World Economic Forum, 2014).
The CE has emerged as a crucial strategy for addressing environmental and economic challenges in LAC, with quality infrastructure (QI) posited as a foundational driver to support a sustainable and reliable transition. Although the concept of CE has become more clearly defined over recent decades and is now widely seen as an umbrella framework (Blomsma & Brennan, Reference Blomsma and Brennan2017), there remain significant challenges regarding its practical scope, understanding, and implementation – particularly for small- and medium-sized enterprises in the region. Importantly, CE adopts a regenerative perspective, seeking a balanced and optimised use of resources to deliver positive social, economic, and environmental outcomes.
The transition towards a CE is increasingly recognised as essential for achieving the region’s sustainability goals; however, it depends fundamentally on trust among economic, social, and political actors in claims of circularity. Society must be confident that products, materials, and processes genuinely adhere to circular principles. A major threat to this trust is the phenomenon of ‘circular washing’ (Sustainability Directory, 2025), where circular practices are misrepresented or exaggerated. In response, QI services – including standardised measurements, certifications, laboratory testing, accreditation, and inspection – play a vital role in ensuring trust and traceability and provide objective, reliable evidence. By verifying and validating claims, QI services ensure that only truly circular products, materials, and activities are recognised and rewarded, thus safeguarding both the credibility of the transition and the systemic benefits it promises.
In this context, the quality, safety, and environmental soundness of goods, services, and processes are necessary for the effective functioning of domestic markets, and their international recognition is essential to enable access to foreign markets. This is a fundamental element in promoting and sustaining economic development, as well as environmental and social well-being. This is achieved through metrology, standardisation, accreditation, conformity assessment, and market surveillance (UNIDO, 2017).
QI is operationalised through National Quality Systems (NQS), which play a crucial role in the transition to CE by providing an institutional framework that encourages competitiveness in enterprises and establishes regulatory frameworks for the quality of products and services that protect people and ecosystems.
NQS are made up of standardisation, metrology, and accreditation organisations, each working as elements of a living system. They guarantee technical competence, impartiality and independence to establish themselves as competent service providers for the private sector and facilitate free trade (Harmes-Liedtke, Reference Harmes-Liedtke, Freimuth, Kaiser and Schädler2024a; Harmes-Liedtke and Stamm, Reference Harmes-Liedtke and Stamm2021).
One of the greatest challenges of the CE is to ensure that its application is consolidated over time, moving from a trend to an economic system capable of creating value through the flows of existing resources. This can be achieved by providing harmonised terminology, confidence in measurements, traceability of information, and more competitive products, among other benefits.
While the need to articulate these two systems is clear, it is a challenge due to the novelty and dynamism of CE and the difficulties in generating innovations in QI systems, which tend to be oriented towards traditional or consolidated activities (Harmes-Liedtke et al., Reference Harmes-Liedtke2024b). This process and need for articulation do not result from a sequence of linearly planned technical procedures, but rather from a social process in which it is necessary to develop knowledge management, interaction, and cooperation between its parts to achieve results.
This research proposes to investigate the processes of articulation between QI and CE systems, and particularly the role played by social dynamics in these processes at the level of cooperation networks. The data presented are based on the experiences of the project ‘Quality Infrastructure for the Circular Economy in Latin America and the Caribbean’ (QI4CE) between 2020 and 2024.
This research project examines the relationship between QI and the CE in LAC. It focuses on the role of social dynamics in cooperation networks and uses data from the QI4CE project (2020–2024).
Three hypotheses are tested:
H1: Initially, interactions and cooperation between QI and CE systems were limited in the countries under study.
H2: Intensive participation in the regional cooperation project activities builds larger, more diverse organisational networks that improve innovative performance.
H3: Organisations with stronger capabilities in territorial coordination and transnational networking achieve better innovation outcomes.
These hypotheses will guide the analysis, with a more detailed discussion provided in later chapters.
As Kirchherr et al. (Reference Kirchherr, Reike and Hekkert2017) argue, the CE can be described as an economic system based on business models that replace the concept of end-of-life with the reduction, reuse, recycling, and recovery of materials in production, distribution, and consumption processes. It operates at the micro level (products, companies, and consumers), the meso level (eco-industrial parks), and the macro level (city, region, nation, and beyond), with the aim of achieving sustainable development, which implies creating environmental quality, economic prosperity, and social equity for the benefit of current and future generations. Through the compilation, codification, and analysis of 114 definitions of the CE, the authors identified that the economic dimension is recognised as a fundamental aspect and is reiterated in the definitions analysed.
ISO 59004:2024 is the international standard on CE terminology and part of the ISO 59000 family of standards, which provides practical guidance for implementing the CE in organisations regardless of their size, geographical location, or sector (Harmes-Liedtke and Canelas-Santiesteban, Reference Harmes-Liedtke and Canelas-Santiesteban2024; International Organization for Standardization, 2024) ISO 59004:2024 defines the CE as ‘an economic system that uses a systemic approach to maintain a circular flow of resources by recovering, retaining, or adding to their value, while contributing to sustainable development’. The standard provides a universal lexicon, foundational principles, and detailed guidance for organisations to transition from a linear, take-make-dispose model towards the sustainable management and renewal of natural resources in pursuit of the United Nations Agenda 2030 for Sustainable Development.
ISO 59004:2024 emphasises six interlinked principles:
• Systems thinking (long-term, lifecycle perspective)
• Value creation (efficient resource use)
• Value sharing (collaboration across value networks)
• Resource stewardship (managing resource flows by closing, slowing, or narrowing loops)
• Resource traceability (ensuring information is shared transparently)
• Ecosystem resilience (regenerating ecosystems and biodiversity).
In summary, ISO 59004:2024 positions the CE as a holistic system focused on sustainable value, inclusivity, and resilience, guiding organisations to move beyond conventional practices to circular and regenerative approaches.
The study ‘Quality Infrastructure for the Circular Economy in Latin America and the Caribbean’ (Canelas-Santiesteban et al., Reference Canelas-Santiesteban, Harmes-Liedtke, Valqui, Flores-Campos, Lugo, Liewald and Rivadeneira2022) identifies six specific needs presented by the CE in the region to which QI can contribute through its various services (Fig. 1). Gonçalves et al. (Reference Gonçalves, Göthner and Rovira2014) argue that sectors such as consumer and environmental protection, food safety, drinking water, efficient energy use, commercial transactions, and technological innovation all depend on measurements, standards, and technical regulations. According to the author, these elements are essential for supporting industry and providing the scientific backing needed to ensure trust in areas like fraud protection for weight, volume, quality, and products.
Circular economy needs that can be supported by quality infrastructure services through standardisation, metrology, accreditation, and conformity assessment.

Figure 1 Long description
The diagram is circular and divided into sections, each representing different aspects of the circular economy. The top section highlights the definition of the circular economy and its levels of implementation, including informed and aware citizens. The right section focuses on production, emphasizing good practices for circular production, new business models and accessible markets for new materials, products and services. The bottom section addresses consumption, covering topics like regulatory frameworks, stakeholder involvement and reliable methodologies for measuring circularity. The left section discusses infrastructure needs, including scientific and applied research, innovation management, digital transformation and safety and performance requirements. Each section is connected, illustrating the interdependence of these elements in supporting the circular economy.
Today, the contribution of QI and the services it offers, such as measurements, technical standards, testing, calibrations, market surveillance, and certifications, play an increasingly important role in the design of public policies, national CE strategies, and strategic project management.
For this reason, the Quality Infrastructure Council of the Americas (QICA) has made various efforts to coordinate both systems, including a strategic roadmap (UNIDO, 2017) in which, as a regional organisation, it seeks to promote collaborative actions between national organisations associated with sustainable development initiatives.
The study is based on three research hypotheses: The first hypothesis (H1) proposes that, between the CE and QI in the countries studied, there was a low level of interaction and cooperation at the beginning of the process.
However, there was a need to develop and capitalise on further experiences regarding the benefits and impact that QI services can offer to innovative developments for circularity, including documentation on the use of standards, products subject to certification, and their interaction. This is where the creation of networks becomes relevant to promote coordination and encourage cooperation in the development of innovations.
The importance of strengthening social processes for sustainable development and innovation has been highlighted by various studies. A series of studies highlights, for example, the importance of cooperation between users and stakeholders for the co-creation of new products and services. This collaboration from the outset promotes mutual learning and is key to ensuring the adoption and impact of new developments (Abhari et al., Reference Abhari, Davidson and Xiao2020; Gerli et al., Reference Gerli, Chiodo and Bengo2020; Kohlgrüber et al., Reference Kohlgrüber, Maldonado-Mariscal and Schröder2021; Lettice & Parekh, Reference Lettice and Parekh2010; Marschall, Reference Marschall2018).
Other research highlights that for this cooperation to be possible, it is important that certain cultural conditions exist or are developed, such as mutual trust or shared common norms (Gupta et al., Reference Gupta, Kumar and Karam2020; Meijer & Thaens, Reference Meijer and Thaens2018; Oeij et al., Reference Oeij, Van der Torre, Vaas and Dhondt2019; Pel et al., Reference Pel, Haxeltine, Avelino, Dumitru, Kemp, Bauler, Kunze, Dorland, Wittmayer and Jørgensen2020; Tverskoi et al., Reference Tverskoi, Babu and Gavrilets2022). Other studies also emphasise the role of agents (public and private) who have the skills to lead coordination and cooperation processes (Battisti, Reference Battisti2019; Morais-Da-Silva et al., Reference Morais-Da-Silva, Segatto, Justen, Bezerra-De-Sousa and De-Carli2021; Vezina et al., Reference Vezina, Selma and Malo2019; Xie et al., Reference Xie, Liu and Chen2023).
Finally, and given its importance for this research, numerous studies highlight the structural role of networks in mobilising resources and knowledge and facilitating the above-mentioned aspects to be functional to innovation (Alfaraz & Tully, Reference Alfaraz and Tully2024; Marques and Manzanares, Reference Marques and Manzanares2022; Tsai & Ghoshal, Reference Tsai and Ghoshal1998; Van Wijk et al., Reference Van Wijk, Zietsma, Dorado, De Bakker and Martí2018; Young, Reference Young2011; Zhou et al., Reference Zhou, Yu, Chen, Snell and Adams2025).
Building on these findings, the second hypothesis (H2) posits that greater intensity of participation in activities organised by cooperation projects will lead to an increase in both the size and heterogeneity of organisational networks. This expansion and diversification are expected to foster improved innovative performance, as a more varied network structure enables organisations to access diverse knowledge and collaboration opportunities, thereby stimulating the development of new solutions and services.
Our third hypothesis (H3) states that the ability to lead coordination processes at the national level, along with the capacity to establish transnational linkages, is essential for achieving meaningful innovation outcomes. Because innovation is driven by social dynamics, existing research indicates that the benefits of collaborative efforts may become concentrated within a limited set of organisations or individuals. Thus, H3 suggests that those actors most effective in facilitating territorial coordination and developing cross-border networks are positioned to generate the greatest impact in advancing innovative practices.
2. Methodology
2.1. Data sources
The empirical basis of this study is the process carried out by the regional project called QI4CE implemented by the Physikalisch-Technische Bundesanstalt (PTB) in coordination with the Organisation of American States (OAS), regional QI organisations such as COPANT, IAAC, and SIM, and national institutes, and co-financed by the German Federal Ministry for Economic Cooperation and Development (BMZ).Footnote 1
The QI4CE project, implemented between 2020 and 2024, involved the participation of 150 organisations linked to QI and 650 companies and organisations in the field of CE or that support it (governments, universities, etc.). Its objective was to promote cooperation between regional QI organisations and their national members in the field of CE to strengthen their technical skills and raise awareness among CE stakeholders of the benefits of QI.
During the implementation period of the regional project, various awareness-raising and training activities (training courses, workshops, and events) were carried out, but methodologies focusing on innovation and collaboration were also used, such as CALIDENA,Footnote 2 CABUREK,Footnote 3 as well as the QI4CE Fund initiative to promote regional cooperation.
The QI4CE project focused on three sectors: plastics, agri-food, and construction, which resulted in the development of QI services in line with the market needs of each country. These were promoted and developed by national QI organisations in coordination with actors and organisations working on CE issues.
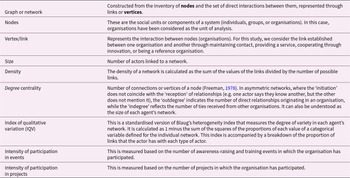
With the aim of recording, visualising, and analysing the structure of the emerging network between QI and CE organisations, social network analysis (SNA) was chosen as the monitoring tool for the QI4CE project. SNA was conducted annually and provided empirical evidence on the evolution of collaboration networks between QI and CE, as well as on the effects of project activities evidenced by changes in the size and nature of links during the project’s implementation period. Key concepts and SNA metrics used in the study are detailed in Table 2.
Number of organisations and organisational types in the universe and the sample analysed (2021–2023)

Table 1 Long description
The table compares the number and types of organisations in the universe, sample, and networks from 2021 to 2023. Total organisations in the universe increased significantly from 154 in 2021 to 806 in 2023. QI organisations, which include standardisation and accreditation bodies, decreased in percentage across all categories, notably from 38.96% in the universe in 2021 to 18.86% in 2023. EC organisations, such as companies and business associations, showed an upward trend, particularly in the universe, rising from 27.27% in 2021 to 44.04% in 2023. Support organisations, including governments and universities, also increased in percentage, especially in the networks, from 42.27% in 2021 to 42.90% in 2023. The data suggests a shift towards more EC and support organisations over time, with a notable decrease in QI organisations' representation.
Source: Own elaboration, 2024.
Concepts and metrics used for social network analysis

Table 2 Long description
The table provides a detailed overview of concepts and metrics used in social network analysis, focusing on networks constructed from nodes and links. Nodes represent social units like organizations, while links indicate interactions such as contact or cooperation. Key metrics include network size, density, and degree centrality, which measures the number of connections a node has. The Qualitative Variation Index assesses network diversity, and participation intensity is gauged by event and project involvement. These metrics help analyze the structure and dynamics of organizational networks, highlighting the complexity and variety of interactions.
Source: Own elaboration.
The survey to build the networks and collect data related to their innovative performance was conducted over 3 years (2021–2023), using a questionnaire addressed to all QI4CE project participants. The survey, conducted using LimeSurvey included questions about the characteristics of the organisations, the links between them, and the innovation processes developed. This study uses a longitudinal SNA. The number of participating organisations increased over the 3-year period, according to their participation in project activities or mentions as relevant stakeholders by representatives of the surveyed organisations. The continuity of organisational participation over time was recorded. The analysis examines the evolution and overall structural changes of the cooperation network, focusing on tie dynamics, such as strengthening, weakening, or forming new connections within the same network.
Any organisation with at least one representative who had attended an activity, either in person or virtually, organised by the regional project was considered a project participant.
As a result of the surveys, Table 1 allows us to observe the composition of the project participants during the 3 years surveyed, the size of the sample surveyed, and the size of the network of institutions reached based on the mentions made by the respondents. In this way, we can observe the evolution of participation in the project and the composition of the samples surveyed each year. On the other hand, although these surveys include a significant representation of QI organisations, the identified networks are similar in size and composition to the universe of each year.
2.2. Research method
SNA was selected as the primary research method because it effectively captures the social dynamics of interaction, cooperation, and knowledge management, which are essential for articulating quality infrastructure (QI) and CE systems. Traditional linear approaches are unable to address these dynamics adequately. This choice is also consistent with the study’s hypotheses regarding network evolution, since SNA reveals relational structures, stakeholder centrality, and innovation pathways within collaborative settings. Examples of such settings can be seen in the QI4CE project, which involved 150 QI organisations and 650 CE stakeholders across LAC.
SNA is a set of tools that allow the analysis of the network of links between social agents (individuals, organisations, etc.) (Barabasi, Reference Barabási2016; Haythornthwaite, Reference Haythornthwaite1996; Sanz-Menéndez, Reference Sanz-Menéndez2003). In recent decades, it has gained recognition for its ability to visualise and analyse social relationship structures, establishing itself as a robust tool based on mathematical, statistical, and computational approaches (Wasserman & Faust, Reference Wasserman and Faust1999).
Its potential for studying processes, such as those considered here, can be seen in recent literature. For example, a set of studies uses SNA to map actors and detect flows of resources and knowledge in innovation and sustainable development processes to identify bottlenecks, key actors, and opportunities to improve the effectiveness of networks, optimise the flow of knowledge, and drive innovation (Chen et al., Reference Chen, Fu, Wang, Tsai and Su2018; Cross et al, Reference Cross, Parker, Prusak and Borgatti2001; Gubbins & Dooley, Reference Gubbins and Dooley2014; Guerrero-Ocampo & Díaz-Puente, Reference Guerrero-Ocampo and Díaz-Puente2023; Kolleck, Reference Kolleck2013; Leenders & Dolfsma, Reference Leenders and Dolfsma2016; Liu et al., Reference Liu, Chen, Zhang and Liu2021; Niang et al., Reference Niang, Torre and Bourdin2022; Van der Valk & Gijsbers, Reference Van der Valk and Gijsbers2010). Other research analyses how networks between different types of organisations (companies, universities, government agencies) influence the degree of innovation in production systems (Alberti et al., Reference Alberti, Belfanti and Giusti2021; Dahesh et al., Reference Dahesh, Tabarsa, Zandieh and Hamidizadeh2020; Giuliani & Pietrobelli, Reference Giuliani and Pietrobelli2011; Shi & Xiao, Reference Shi and Xiao2024). Some studies also identify the limitations of network phenomena, which can exacerbate pre-existing inequalities and concentrate benefits among key players (Giuliani et al., Reference Giuliani, Balland and Matta2019; Hermans et al., Reference Hermans, Sartas, van Schagen, van Asten and Schut2017; M. Li et al., Reference Li, Xiao, Cheng, Xie, Liu and Xu2019; Morrison, Reference Morrison2008; Woods et al., Reference Woods, Galbraith and Hewitt-Dundas2019).
SNA allows the ‘map’ of connections between agents to be reconstructed through a graph resulting from the inventory of social units or components of a system, called nodes, and the set of direct interactions between them represented through links or vertices, allowing the relationship between units to be visualised.
In this case, QI nodes included metrology institutes, accreditation bodies, conformity assessment bodies (CABs), and standardisation institutes, as well as independent professionals and regional organisations that carry out activities in support of QI bodies. The CE nodes include organisations and/or independent professionals linked to the CE, whether they are companies, support institutions (SIs), or regional bodies.
The forms of interaction (vertices) were classified by their part in Contact Networks (which actors know each other and have interacted in the last year); Services (which actors have provided and/or received QI services in the last year); and Innovation (which actors have worked together in the last year to adapt or develop new services).
Specific software programs were used to apply the SNA, in particular UCINET (Borgatti et al., Reference Borgatti, Everett and Freeman2002) and Gephi (Bastian et al., Reference Bastian, Heymann and Jacomy2009).
Based on the metrics mentioned above, which have served as the basis for SNA, this study also contributes on several levels to the literature on QI and CE, as it proposes an empirical study of the links between both subsystems on an international scale.
In practice, SNA was applied to empirical data from 2021 to 2023 to map the evolution of QI–CE networks in the plastics, agri-food, and construction sectors. This was achieved using metrics such as centrality, density, and tie growth.
The QI has been approached as a field of study relatively recently. For this reason, various authors point to gaps in research in this area, both in terms of its focus, which often omits the systemic nature of QI and its scope, which is mostly national or subnational.Footnote 4 Added to these limitations are the lack of a general conceptual model and the limited availability of data (Blind et al., Reference Blind, Neuhäusler and Schubert2026). Among the works that seek to map or analyse QI, theoretical or normative descriptions predominate (Gutiérrez Ocegueda & Gutiérrez Aceves, Reference Gutiérrez Ocegueda and Gutiérrez Aceves2024; Rab, Yadav, Jaiswal, et al., Reference Rab, Yadav, Jaiswal, Haleem and Aswal2021; Rab et al., Reference Rab, Yadav, Haleem, Jaiswal and Aswal2021) the use of traditional outcome indicators (Carvalho Dos Reis & Ludovico de Almeida, Reference Carvalho Dos Reis and Ludovico de Almeida2021; Reis and Almeida, Reference Reis and Almeida2021; Rab & Brown, Reference Rab and Brown2023; Trajković et al., Reference Trajković, Ruso, Rakić and Filipović2025). Although most of these authors emphasise the value of networks and cooperative links, they do not apply specific methodologies to study them (Blind, Reference Blind2024; Blind et al., Reference Blind, Mangelsdorf and Pohlisch2018; Kellermann, Reference Kellermann2019; Rab, Yadav, Jaiswal, et al., Reference Rab, Yadav, Jaiswal, Haleem and Aswal2021).
The field of CE offers a broader view in terms of the number of studies. However, while some include network analyses like the one proposed here, they tend to remain limited by the same constraints mentioned earlier, especially their narrow focus on local or national experiences (Bostancı & Tanyer, Reference Bostancı and Tanyer2025; Chatterjee et al., Reference Chatterjee, Minsk, Triebe, Hapuwatte, Kietzer, Kittali-Weidner, Morris and Mathur2024; Ghinoi et al., Reference Ghinoi, Silvestri and Steiner2020; Liao et al., Reference Liao, Wu, Liu and Zhang2023; Pusz et al., Reference Pusz, Jonas and Deutz2024).
3. Results
3.1. Evolution of networks between QI and CE
The survey conducted allows us to construct three networks, among which the one related to cooperation to generate QI innovations for the development of the CE stands out. The application of the SNA allows us to identify a growth in the size of these networks during the period studied.
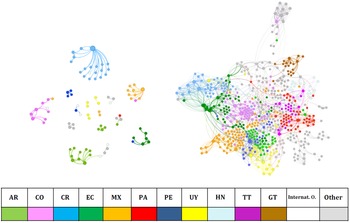
Figure 2 shows precisely this growth and the transition from a structure characterised by a sort of archipelago of isolated national networks concentrated in a few key organisations to an integrated network through multiple transnational relationships.
Evolution of quality infrastructure and circular economy innovation networks between 2021 and 2023.

Figure 2 Long description
A network diagram illustrating connections between multiple nodes, organized into clusters. The nodes are connected by lines, indicating relationships or interactions. The diagram is divided into two main sections: the left side with smaller, isolated clusters and the right side with a larger, interconnected network. Below the diagram, a color-coded legend identifies regions: AR, CO, CR, EC, MX, PA, PE, UY, HN, TT, GT, Internat. O. and Other, each represented by a distinct color.
Table 3 allows this growth to be quantified in absolute terms, which is notable in the case of the ‘Innovation Network’, which exceeds 600%. Meanwhile, contact and service provision networks increased by 153% and 106%, respectively. As proposed in H1, Figure 2 and the data in Table 3 show that at the start of the project, interactions and cooperation between CI and CE actors were scarce. In the case of collaboration to develop innovations, it is observed that, in 2021, only a fragmented set of links existed within some countries, led by a few organisations.
Levels of interaction and cooperation in 2021 and 2023

Table 3 Long description
The table compares the size and growth of three networks—Contacts, Services, and Innovation—between 2021 and 2023. The Innovation network experienced the most significant growth, increasing by 602% from 91 to 639. Contacts grew by 153%, from 186 to 470, while Services increased by 108%, from 115 to 240. The data highlights a substantial expansion in the Innovation network compared to the other two, indicating a possible shift in focus or resources. These figures suggest varying levels of interaction and cooperation across different networks over the two years.
Source: Prepared internally, 2024.
Table 4 shows the average centrality and growth of networks in the three main organisational types analysed. QI organisations had greater growth and centrality compared to CE organisations and SIs.
Centrality and growth of networks

Table 4 Long description
The table measures centrality and growth in contact, service, and innovation networks for CE, QI, and Support Institutions in 2023. Support Institutions exhibit the highest centrality scores and number of new ties across all networks, with centrality scores of 5.7, 2.6, and 7.8, and new ties of 4.1, 1.5, and 6.5, respectively. CE organisations have lower centrality and new ties, with scores ranging from 0.4 to 2.1. QI organisations show slightly higher values than CE, but significantly lower than Support Institutions. The data suggests Support Institutions are more integrated and expanding faster in these networks.
Source: Prepared internally, 2024.
Table 5 shows that growth is higher among organisations that participated in the QI4CE LAC project. Organisations that have participated in project activities triple their average centrality scores compared to other organisations, in all cases and with statistically significant differences (as inferred from the analysis of variance performed).
Growth in centrality and number of new ties

Table 5 Long description
The table compares centrality and the number of new ties in contact, service, and innovation networks between participants and non-participants. Participants had higher centrality scores and more new ties in all networks. In the contact network, participants had a centrality of 3.4 and 2.5 new ties, while non-participants had 1.3 centrality and 0.7 new ties. In the service network, participants scored 1.8 in centrality and 1.1 new ties, compared to non-participants' 0.5 centrality and 0.3 new ties. In the innovation network, participants had a centrality of 4.5 and 3.9 new ties, whereas non-participants had 1.6 centrality and 1.14 new ties. All differences were statistically significant with p-values less than 0.001, indicating strong evidence of the impact of participation on network growth.
* Note: p-values (ANOVA).
3.2. Effects on innovations
Although the growth of networks in general and cooperation networks for generating innovations in particular has already been observed, the results obtained by organisations in terms of developing new services for the CE are analysed below.
The results of the survey at the end of the regional project indicate that 68% of the organisations that responded to the survey generated some innovation during the period under review. Table 6 shows the percentage of organisations that made progress in the development of each type of service.
Progress of organisations in different types of services

Table 6 Long description
The table measures the progress of different types of services across various organizations, including accreditation bodies, standard bodies, businesses, and government entities. Training services lead with 30 new initiatives, followed by the adoption and development of international standards with 27. Reference material services show the highest standard deviation at 81, indicating variability in progress. Calibration services and reference material services both have 14 new initiatives, but calibration services have a higher standard deviation of 72 compared to 81 for reference materials. The data suggests that while some services like training and standard adoption are widely initiated, others like reference materials show more variability in progress. The types of organizations involved vary, with some services like training involving a broader range of organizations, including government and metrology bodies.
Source: Own elaboration, 2024.
Note: AB: accreditation body; SB: standard body; CAB: conformity assessment body; M: metrology; B: business; G: government.
The main innovations were present in the different components of the QI: standardisation, metrology, accreditation, and conformity assessment.
In general, and according to the SNA analysis, there is also a close link between these types of services and the organisational profile. In addition to companies and governments (which participate in most cases), accreditation and standardisation bodies are mainly involved in the establishment of committees and the adoption and development of standards and accreditations; metrology institutions are involved in the development of calibration services, proficiency testing, and laboratories, while CABs are involved in certification and inspections.
For example, in the Quality Infrastructure Fund for the Circular Economy in Latin America and the Caribbean (2022–2024), an initiative that was part of the regional QI4CE project, QI services were developed in the field of standardisation through the adaptation of standards to measure the recyclability potential of packaging, driven by binational initiatives, in this case, the National Institute of Quality of Peru (INACAL) and the Colombian Institute of Technical Standards and Certification (ICONTEC) through Peruvian Technical Standard NTP 222.104:2024, Colombian Technical Standard NTC 6695:2023, and Colombian Technical Standard NTC 6722:2023.
These technical standards were developed in response to the needs of industry in Peru and Colombia and are currently available for application in plastic value chains.
There is sectoral evidence (in plastics, tyres, circular supply chains, ICT services, and urban infrastructure) showing that CE is limited by gaps in standards and certification, which raises the need to innovate in QI services (Coenen et al., Reference Coenen, Visscher and Volker2023; Fehrer et al., Reference Fehrer, Kemper and Baker2023; Nguyen et al., Reference Nguyen, Akbari, Quang, McDonald, Hoang, Yap and George2023; Nogueira et al., Reference Nogueira, Ashton, Teixeira, Lyon and Pereira2020; Škare et al., Reference Škare, Gavurova and Rigelský2024). However, the literature rarely states this need explicitly as ‘innovation in QI services’ but rather presents it as new standards, labels, digital platforms, or governance frameworks.
However, to test the link between the social process developed by promoting cooperation between QI and the CE and its effects in terms of innovation, various tests of association between network metrics, organisational typologies, and these results have been applied. These analyses lead to the following conclusions:
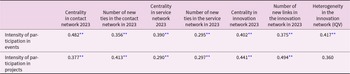
- There is a clear and significant correlation between the intensity of participation in the activities proposed by the project and centrality in the networks (i.e. the size of each organisation’s network), particularly in terms of collaboration to develop innovations. Something similar can be said about the increase in the heterogeneity of the composition of these networks, integrating different types of organisations (based on the index of qualitative variation [IQV]). This can be seen in Table 7, where it can also be seen that the growth in the size of the network is linked to this participation.
Table 7.Intensity of participation in events and projects

Table 7 Long description
The table measures the correlation between the intensity of participation in events and projects and various network metrics in 2023. Key data points include significant positive correlations between participation intensity and centrality in contact, service, and innovation networks, with the highest correlation of .494** for new links in the innovation network related to project participation. Comparatively, event participation shows a slightly lower correlation with new ties in the innovation network at .375**. The heterogeneity in the innovation network also correlates positively with participation intensity, with values of .417** for events and .360 for projects. These findings suggest that increased participation is associated with greater network integration and diversity, particularly in innovation contexts. Significant correlations are marked at the 0.01 and 0.05 levels, indicating strong statistical relationships.
Source: Own elaboration, 2024.
** Note: Pearson correlation. Significant values (sig 0.01).
- On the other hand, the link between the development of innovations by QI for the CE (based on the number of adapted or new types of services) has been analysed, verifying that there is a significant link with the size and growth of each institution’s network of contacts (Table 8).
Table 8.Significance of correlations
Table 8 Long description
The table measures the correlation between the development of services for circular economy (CE) by quality improvement (QI) organisations and their centrality and number of new ties in the contact network for 2023. The correlation with centrality is .389, indicating a moderate positive relationship, while the correlation with the number of new ties is .346, also showing a moderate positive relationship. Both correlations are statistically significant at the 0.05 level. These findings suggest that organisations developing services for CE tend to have higher centrality and form more new ties within their contact networks. However, the correlations are not strong, indicating other factors may also play a significant role.
Source: Own elaboration, 2024.
Note. Pearson correlation


Both findings support H2, demonstrating that the intensity of participation in activities promoted by cooperation projects allows us to predict an increase in the size and heterogeneity of networks, which, in turn, improve the innovative performance of organisations.
Table 8 presents an analysis of the relationship between organisational network metrics and the development of innovations for the CE during the QI4CE project period. The study constructed multiple networks (contact, service, innovation), wherein each organisation’s position – measured through degree centrality, number of new ties, and network heterogeneity – was calculated from structured survey data of QI4CE participants across 3 years. The SNA quantified the number and diversity of organisational connections using centrality metrics and the IQV for network heterogeneity.
To further test the hypothesis that network size and engagement predict innovation outcomes (H2), the authors used Pearson’s correlation coefficients to analyse the association between network metrics (e.g. centrality, new ties) and the development of new or adapted services for the CE. Statistically significant correlations (at conventional p-value thresholds) indicated that larger, more active networks enhance innovative performance among QI organisations in LAC.
However, as mentioned in H3, the results reveal a particular pattern in the way that position in networks is linked to the capacity to generate innovations. To this end, the organisations (of any type) with the largest contact and innovation networks in each country in the sample analysed were identified. Based on this, we studied whether there was an association between this position of prominence or leadership, their results in terms of innovation, and the composition of their networks, particularly their heterogeneity and degree of internationalisation.
Table 9 shows that there is indeed a link between the results obtained on new services and organisations’ capacity to lead coordination processes at the territorial level (in this case, national) and to generate transnational links.
Capacity of leading organisations

Table 9 Long description
The table compares national leading organisations with other organisations across five metrics related to network centrality and innovation. National leading organisations exhibit significantly higher average centrality in both the contact network (9.25) and the innovation network (15.11) compared to other organisations (3.3 and 4.7, respectively). They also develop a greater variety of services (7.2) and show higher heterogeneity in the innovation network (IQV of 0.78) than other organisations (5 and 0.53, respectively). Additionally, national leading organisations have more transnational links (11.9) compared to other organisations (3.9). All differences are statistically significant, with p-values less than 0.05, indicating strong evidence against the null hypothesis of no difference between the groups.
* Note: p-values (ANOVA).
4. Conclusions
The SNA carried out in LAC during the period 2020–2024, which aimed to generate coordination between QI and CE systems in the QI4CE project, has provided valuable evidence on how collaborative networks can strengthen the development of innovations that contribute to the transition to a CE in LAC. Through systematic mapping and analysis of the relationships between key organisations in the fields of QI and the CE, the study reveals how structured collaboration can catalyse innovation, knowledge sharing, and the development of new services essential for sustainable transformation.
The results of the SNA within this study provide robust evidence in support of all three hypotheses concerning the dynamics of collaboration between quality improvement (QI) and circular economy (CE) systems.
H1, which posits that there are initially limited interactions and cooperation between QI and CE systems in the countries under study, is confirmed by baseline SNA metrics showing fragmented national networks with low density and connectivity in 2021. This reflects the initial inertia of NQS that are oriented towards traditional activities.
H2, which posits that intensive participation in cooperative activities builds larger and more diverse organisational networks, thereby enhancing innovative performance, is strongly validated. This is evidenced by fivefold network growth between 2021 and 2023, increased organisational type heterogeneity (Table 1), and significant positive correlations between participation intensity (e.g. events and projects; Table 7) and innovations in metrology, standardisation, and conformity assessment services (Tables 6 and 8).
H3, which posits that organisations with superior territorial coordination and transnational networking capabilities achieve superior innovation outcomes, is substantiated by centrality measures (Tables 4–5). These measures highlight regional connectors such as QICA as pivotal hubs that forge cross-border ties, overcome homophily-driven closure, and drive service innovations, particularly among capacity-constrained actors.
This evolution from fragmentation to integration highlights the value of SNA in revealing dynamic relational structures, despite limitations such as response rates in data collection. Policymakers and QI organisations should prioritise data-driven investments in regional connectors and inclusive mechanisms to sustain these gains and outperform traditional metrics by capturing long-term network effects beyond the scope of typical project timelines.
As previously noted, there are few studies that address the interaction between QI and CE, so it is hoped that these findings will contribute to increasing such studies and, in the future, enable comparisons between similar processes. However, despite their achievements, the study acknowledges certain limitations. Data collection faced the usual challenges of network research, such as the difficulty of obtaining higher response rates or measuring the relevance of the innovations developed. However, the use of SNA provided a more nuanced and dynamic understanding of the evolution of QI and CE networks, complementing traditional evaluation methods and enabling the formulation of evidence-based strategies.
The SNA indicators can also be used to identify the necessary cooperation between different groups of stakeholders at an early stage. Measuring the degree of networking at various levels enables us to determine whether QI’s services are being accepted by the CE’s target user group. This approach is superior to traditional metrics, such as the number of services created and used, because the effects of these tend to become apparent in the long term – often beyond the usual project duration of 3–4 years.
Although the application of SNA in the context of the CE has expanded significantly in recent years (Liao et al., Reference Liao, Wu, Liu and Zhang2023; Khitous et al., Reference Khitous, Strozzi, Urbinati and Alberti2020), research specifically examining the relationship between QI and CE stakeholder networks remains limited. Comparative studies applying SNA to investigate similar multi-sectoral, transnational collaboration mechanisms, such as the Hubs for Circularity framework documented by Tleuken et al. (Reference Tleuken, Rogetzer, Fraccassia and Yazan2025), would strengthen the theoretical foundation and enable the validation of patterns in network dynamics across different geographical and institutional contexts. A systematic review of SNA studies applied to CE transitions worldwide would advance knowledge and provide methodological benchmarks, as well as identify whether the network evolution patterns observed in the QI4CE project are region-specific or reflect broader CE governance principles applicable across diverse policy environments.
In summary, fostering collaborative networks through structured, data-driven interventions significantly accelerates the transition to a CE. For policymakers, international development organisations, and QI organisations in the region, investing in inclusive and integrated regional collaboration mechanisms is essential to drive sustainable and impactful circular transitions.
Acknowledgements
The authors would like to express their gratitude to the German National Metrology Institute, Physikalisch-Technische Bundesanstalt (PTB) and to the representatives of the Quality Infrastructure Council of the Americas (QICA) for providing and authorising the use of the data on which this study is based. The content and conclusions of this paper were presented at the World Resources Forum (WRF), in scientific session 1J ‘Advancing circularity in the built environment’, held on 2 September 2025 in Geneva, Switzerland. We thank PTB for its support for participation in the WRF and the Scientific Panel for the stimulating and thoughtful discussions that contributed to the development of this document. We thank Ann-Sara Ramkissoon for her comments and review of the text.
Author contributions
The idea for this article came from U.H.-L., who also designed the research and contributed to the text. A.M. applied social network analysis techniques, evaluated the literature, and wrote the sections on methodology and data analysis, as well as creating the corresponding graphs and tables. M.M. wrote the initial draft. E.C. contributed to the methodology and explained the connection between QI and EC. All authors read and approved the final manuscript.
Funding statement
The empirical data for the studies were collected as part of the project Quality Infrastructure for the Circular Economy in Latin America and the Caribbean (QI4CE), funded by the German Federal Ministry for Economic Cooperation and Development (BMZ) and carried out by PTB during the period 2020–2024, and authorised its publication. The authors participated in the complementary research. The authors have not received any additional financial support for the preparation of this publication.
Competing interests
None.
Research transparency and reproducibility
The data underlying this study are derived from the QI4CE project surveys conducted by PTB. Access to the raw data is subject to the data governance policies of PTB. Requests for data access may be directed to the corresponding author.









 Open access

