


1. Introduction
Translating design information into engineering specifications remains a significant challenge for engineers and product developers (Reference Ismatullaev and KimIsmatullaev, 2024). As Reference Ulrich and EppingerUlrich and Eppinger (2020) highlight, the process of collecting user needs and translating them into precise requirements and specifications is both time-consuming and critical, any misalignment in this process can significantly affect the final product’s success. According to NASA (2022, 2023), technical requirements are unique, quantitative, and measurable statements expressed as “shall” statements that transform baselined stakeholder expectations into requirements for defining a design solution; they specify the design, performance, operational parameters, and constraints of equipment and systems to ensure clear, unambiguous, complete, and verifiable technical definitions essential for successful engineering design and system development.
To effectively translate customer needs into precise product specifications, a variety of structured methods and tools have been developed to support the systematic gathering, interpretation, and organization of design information across user-centered, technical, and business dimensions. Quality Function Deployment (QFD) is a well-established, systematic method developed in Japan during the 1960s to translate customer requirements (commonly called the “voice of the customer”) into technical specifications that guide product development across multiple stages including product planning, design, process planning, and production planning. Central to QFD is the House of Quality (HoQ), a matrix tool used to prioritize and relate customer needs (“Whats”) to engineering characteristics (“Hows”) to ensure product designs meet or exceed user expectations (Reference Chahadi, Wäldele and BirkhoferChahadi, 2007; Reference Santoso, Rau, Choirun, Aprilianto, Lestari, A’Yuniah and KusumaningtyasSantoso, 2024).
In new product development, QFD effectively bridges the gap between market demands and engineering design decisions, helping teams make informed trade-offs and prioritize features to optimize customer satisfaction and product quality. Enhancements to QFD include hybrid approaches combining it with techniques like Analytic Hierarchy Process (AHP) to improve prioritization accuracy under complex decision criteria (Reference Huang, Zhang, Yang, Gu, Li and WangShengqing et al., 2022; Reference de Oliveira, dos Santos, de Almeida and Costade Oliveira, 2020).
Recent research has explored integrating Artificial Intelligence and Large Language Models (LLMs) into the QFD process. Reference Nutzmann, Sauer, Voss and BozkurtNutzmann et al. (2024) demonstrated the utility of ChatGPT in guiding QFD activities by assisting in generating innovative product concepts, identifying customer needs, and translating these into engineering characteristics during design education, opening new avenues for AI-augmented QFD applications. Additionally, Reference Lim, Flageat and CullyLim et al. (2024) proposed an approach leveraging LLMs for quality-diversity optimization, aligning with QFD’s goal of generating diverse, high-quality design solutions. Beyond these advances, researchers have also explored complementary methodological enhancements, including pairing QFD with AHP to calculate relative importance weights, applying fuzzy QFD to handle uncertainty, and integrating TRIZ to resolve technical contradictions. For example, the hybrid AHP–QFD–TRIZ–AIGC framework proposed by Reference Zhu and XiangZhu and Xiang (2025) quantifies customer and sustainability requirements via AHP and QFD, applies TRIZ to resolve contradictions, and uses generative AI to produce eco-efficient concept solutions. This integration of AI/LLMs with QFD promises to streamline the requirements extraction process, enhance creativity, and support decision-making in product development, representing an emerging intersection in design research. Traditional approaches to translating customer needs into engineering requirements are time-consuming, subjective, and challenging for engineering students to master effectively (Reference BertoniBertoni, 2019). The progression from conceptual product pitch to a comprehensive and actionable set of technological specifications is often plagued by semantic gaps, missing dependencies, and inconsistent interpretations that threaten project viability. While Quality Function Deployment (QFD) traditionally structures this translation, our study investigates how different levels of AI assistance—none, conversational LLM support, or LLM embedded within QFD, shape the requirements elicitation process for novice engineers.
We pose two research questions:
RQ1: How does LLM assistance influence engineers’ perceived task difficulty when translating a product pitch into technical requirements compared to the manual approach without any LLM use?
RQ2: How does LLM assistance affect the quality and technical specificity of the resulting requirement sets compared with a no-LLM baseline?
To address these questions, we introduce a methodological framework that functions both as a learning experiment for engineering students and as a research design for systematically examining how different AI configurations support early-stage engineering design. Empirically, we compare three conditions: no LLM, LLM only, and LLM combined with a QFD-based interface in terms of perceived task difficulty, quality of resulted requirements, and the structure of the resulting requirement sets. Conceptually, we provide an initial, evidence-based view of where LLMs and LLM–QFD hybrids add value and where they introduce new frictions in requirements elicitation, and we offer a replicable teaching and research protocol for studying human – AI collaboration in early design tasks.
2. Theoretical background
2.1. Large language models in requirements engineering and design
LLMs have demonstrated impressive capabilities in natural language understanding and generation. In requirements engineering, they are being explored for tasks such as requirements elicitation, summarisation, classification and validation. Reference Zadenoori, Dąbrowski, Alhoshan, Zhao and FerrariZadenoori et al. (2025) reviewed over 70 studies and found that most use GPT based models for elicitation and validation rather than defect detection or classification, often relying on zero shot prompting with limited evaluation on real world data. Reference Norheim, Rebentisch, Xiao, Draeger, Kerbrat and de WeckNorheim et al. (2024) highlight the scarcity of large, high quality requirements datasets, inconsistent annotations and poorly defined use cases. Without domain specific fine tuning, LLMs risk hallucinations and may struggle with technical terminology. Reference Alhoshan, Ferrari and ZhaoAlhoshan et al. (2025) conduct one of the first experimental studies on generative LLMs for requirements classification; they conclude that prompt design and model architecture significantly influence performance and that dataset characteristics affect results.
Within engineering design, LLMs offer opportunities across different phases. Reference Chiarello, Barandoni, Majda Škec and FantoniChiarello et al. (2024) classify LLM tasks as generating ideas and concepts, measuring semantic similarity or sentiment, and translating between languages or representations. Their analysis of 15,000 design papers shows that the field is still nascent; there is a need to link LLM functions to specific design activities and to address explainability and ethical concerns. Reference Chen, Song, Ding, Sun, Childs and ZuoChen L. et al. (2024) show how LLMs can augment the TRIZ methodology by generating inventive solutions using prompt engineering and step by step reasoning, reducing the expertise required to apply TRIZ. These studies illustrate the promise of LLMs but also underscore the necessity of rigorous evaluation.
2.2. Human - AI collaboration and cognitive effects
Research on human–AI collaboration investigates how generative AI influences users’ creativity, cognitive load and sense of ownership during co-creation tasks. Reference Maier, Schneider and FeuerriegelMaier et al. (2025) compared different interaction modes in an ideation experiment with large language models (LLMs). In a model-led mode where the LLM rewrote participants’ ideas, the AI significantly increased idea quality but reduced idea diversity and participants’ sense of ownership. Conversely, a question-driven mode in which the AI responded to participants’ prompts improved idea quality while preserving diversity and perceived ownership. These findings suggest that reflective, human-led interactions may balance AI support with user agency.
Physiological studies show that AI assistance can modulate cognitive workload. Reference Jiang, Wu and LeungJiang et al. (2025) used EEG measures and the NASA-TLX scale to compare solo problem solving with GPT-4-assisted reasoning. They found that AI assistance reduced frontal theta power (a neural marker of cognitive load) and increased P300 amplitude (reflecting attentional engagement), while participants reported lower mental workload and frustration. These results indicate that conversational LLMs can act as cognitive scaffolds, freeing mental resources for higher-level reasoning but requiring careful interface design to maintain trust.
Design-centric research offers similar insights. In a mixed-methods study, Reference LiuLiu (2025) asked designers to ideate with and without generative AI tools. The AI-assisted condition resulted in 22.4% lower NASA-TLX workload scores and nearly twice as many distinct concepts per minute compared with conventional tools. Participants attributed the increased ideation to the AI’s “provocative unpredictability,” which introduced unexpected directions and stimulated lateral thinking. However, some designers expressed ambivalence about authorship and control, highlighting the need for transparent interactions and mechanisms that preserve user agency. Reference Ahmad, Arora, Abdelrazek, Grundy, Vasa, Kaindl, Mannion and MaciaszekAhmad et al. (2024) demonstrated that AI supported requirements elicitation tools can assist analysts in identifying and structuring requirements across multiple real-world projects, while still requiring human verification and contextual interpretation.
These studies show that LLMs can reduce cognitive load, enhance ideation and serve as collaborative partners, but they also underscore the importance of designing interfaces that support critical reflection, maintaining diversity and safeguarding users’ sense of ownership. For requirements engineering and early-stage design, this implies implementing AI as a thought partner rather than an oracle, encouraging users to actively engage with AI suggestions and retain control over decision making.
3. Experimental design
The methodological framework presented in Figure 1 outlines a structured process through which engineering students translate a product pitch into technological (functional) requirements. This process involves three methodological approaches, described in detail in Section 3.1.
Methodological framework

The study involved 36 engineering master’s students from the University of Ljubljana, 20 of these were local and 16 Erasmus students from various EU countries, including 30 males and 6 females, who were distributed across three experimental conditions: No_LLM (n = 13, 36.1 %), LLM (n = 12, 33.3 %), and LLM_QFD (n = 11, 30.6 %). The sample demonstrated moderate to high digital technology proficiency (M = 3.72, SD = 0.78, median = 4.00 on a 5-point scale). Regarding AI assistance usage, 66.7% of students reported using AI assistance on a weekly basis, and 41.7% specifically used them weekly for engineering-related tasks. All students had previously completed the Design Techniques course, where they learned and practiced the process of gathering user needs and translating them into requirements and specifications following the steps outlined by Reference Ulrich and EppingerUlrich and Eppinger (2020). This ensured a shared baseline of knowledge before the experiment took place.
3.1. Experimental procedure
Students were given a product pitch deck with a brief conceptual presentation of a product idea (Figure 2). The business idea was presented following Guy Kawasaki’s 10-slide format for start-up decks. The slides outlined the problem, proposed solution, value proposition, basic business model, and key features of a smart pet collar for dogs (Reference KawasakiKawasaki, 2021). This pitch provided the information from which technical and functional requirements had to be derived.
Extraction from the product pitch material

The primary task for students was to extract functional requirements, identifying what the product had to do to achieve its intended function. Students analysed the pitch to determine the necessary technical characteristics or performance criteria that supported the product’s objectives.
To evaluate the impact of different requirement extraction approaches, students were divided into three distinct groups, each employing a unique methodology:
-
• Group 1 – No-LLM (Manual Approach): Students manually extracted and structured requirements using their engineering expertise and conventional design practices. While AI tools were excluded, students could consult online resources as needed. By ‘conventional design practices’, we refer to the process taught in the Design Techniques course, which follows Reference Ulrich and EppingerUlrich and Eppinger’s (2020) flow: extracting customer needs, clustering them, interpreting them as functional requirements, and writing measurable requirement statements. Students in this group created needs-requirements mappings manually without formal QFD matrices. They used structured notes, and ad-hoc prioritization based on engineering judgment. Thus, although no prescribed methodology like QFD was imposed, participants still followed a recognized engineering reasoning workflow.
-
• Group 2 – LLM (AI-Assisted Approach): Students leveraged a Large Language Model (LLM), such as ChatGPT, to assist in interpreting the product pitch and generating structured requirements. The model served as a collaborative tool to enhance understanding and organization.
-
• Group 3 – LLM-QFD (Hybrid Structured Approach): Students integrated large LLM assistance into the Quality Function Deployment (QFD) process, a structured method used to translate customer needs into measurable technical specifications. They were instructed to formulate a prompt that applied the principles of the House of Quality, enabling the AI assistant to support requirement identification and prioritization. This hybrid approach facilitated a more systematic alignment between perceived user needs and technical parameters.
Across all groups, students were required to produce a list of at least ten functional requirements and rank each on a five-point importance scale (1 = least important, 5 = most important). Rankings differed by group: the no-LLM group ranked requirements manually based on perceived relevance and user needs, the LLM group used AI-assisted ranking, and the LLM-QFD group used AI assistance informed by QFD-derived weightings. Students were asked to present their results in a table format. Both the results table and conversation log (where applicable) were submitted via an upload button at the end of the Microsoft Forms questionnaire.
3.2. Data collection and analysis
At the conclusion of the study, students were asked to complete a feedback questionnaire designed to evaluate several aspects of their experience. This included evaluation of the process, particularly the difficulty of the method employed, along with their perceived satisfaction with the results achieved. After that, Welch’s one-way ANOVA was conducted to examine differences among the three groups, accounting for unequal variances. Additionally, students reflected on their experience with or without LLM support. They were asked to list three challenges and three positive aspects of the task in their response, and their answers were analysed using thematic analysis
All lists of delivered requirements, prioritized by importance, were evaluated by two experts using the following criteria: (1) overall quality rated on a five-point scale based on feasibility and concreteness of requirements, (2) the number of mechanical requirements (directly linked to physical aspects of product realization), (3) the number of technical requirements (related to software or mechanical aspects), (4) the number of non-technical requirements (related to ease of use, aesthetics, etc.), (5) the total number of requirements, (6) distribution across importance levels, and (7) average importance score. Each expert provided an individual assessment, and their evaluations were then cross-checked to identify, analyse, and resolve significant differences before being averaged to produce a single consolidated grade.
4. Results
4.1. Statistically significant differences
The Welch’s one-way ANOVA revealed significant differences among the three experimental groups (No_LLM, LLM, LLM_QFD) across several key variables related to the requirement engineering process and participants’ attitudes (Figure 3).
First, difficulty in determining requirements varied significantly across groups, F(2, 22.1) = 6.82, p = .005. Participants in the No_LLM group reported the highest difficulty (M = 2.85, SD = 0.69), significantly greater than those in the LLM_QFD group (M = 1.91, SD = 0.54, p = .021). The LLM group showed intermediate levels of difficulty (M = 2.42, SD = 1.08), though differences with other groups were not statistically significant.
This pattern of performance was mirrored in the quality of requirements, which also differed significantly among groups, F(2, 22.2) = 4.30, p = .027. The No_LLM group produced significantly lower-quality requirements (M = 3.38, SD = 1.12) compared to both LLM-assisted groups. Post-hoc comparisons confirmed significant improvements in quality for the LLM group (M = 4.33, SD = 0.65, p = .025) and the LLM_QFD group (M = 4.45, SD = 0.69, p = .013), with no significant difference between the two (p = .939).
Some students who prepared the requirements lists manually produced very general statements that lacked a clear narrative of what the product should achieve. This resulted in lower mean quality assessments (Figure 3). In contrast, students who used LLMs delivered more clearly directed and technically focused requirements.
Interestingly, these performance outcomes were accompanied by differences in attitudes toward AI, F(2, 22.2) = 3.97, p= .034. Participants in the LLM group expressed the most positive attitude (M = 4.33, SD = 0.65), significantly higher than those in the LLM_QFD group (M = 3.55, SD = 0.69, p = .034). The No_LLM group reported a moderate attitude (M = 3.85, SD = 0.80), suggesting that direct interaction with AI tools may foster more favourable perceptions.
Descriptive statistics across key categories and groups

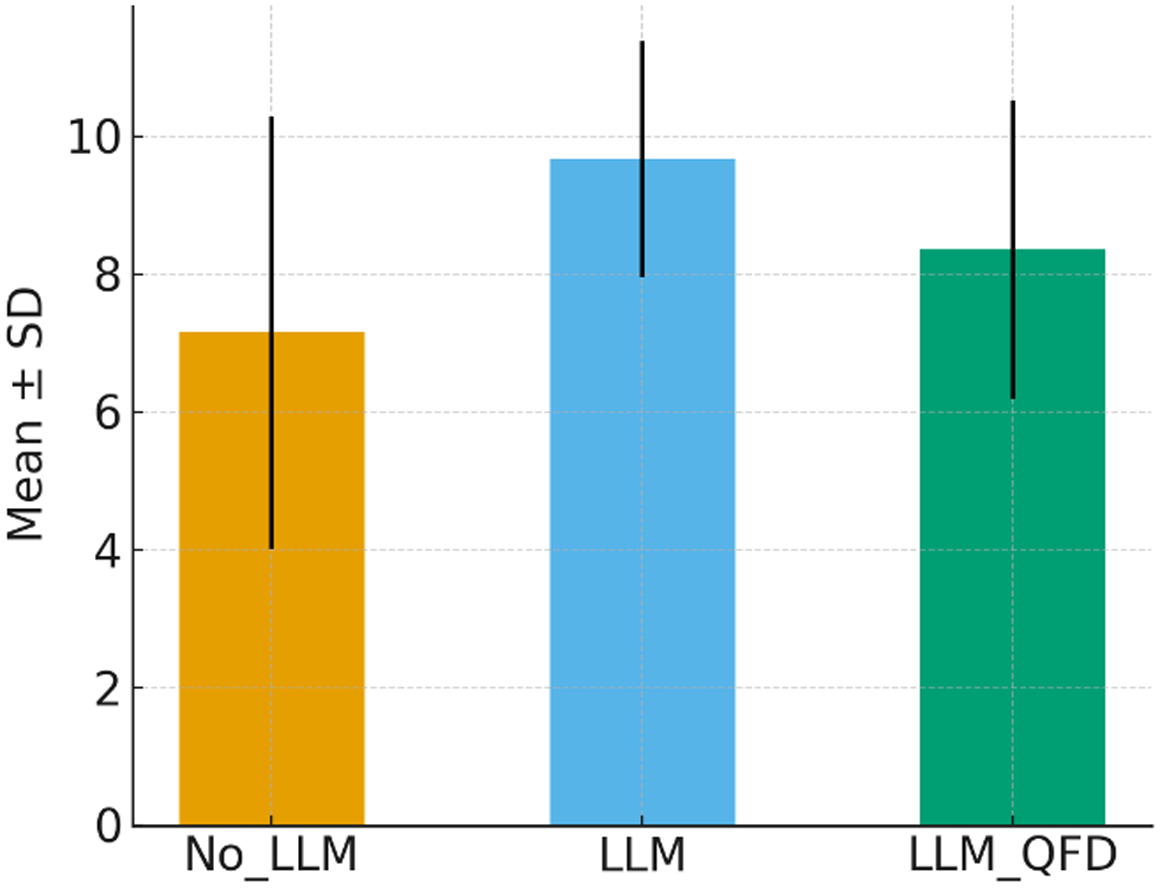
Finally, the number of technical requirements (Figure 4) approached statistical significance, F(2, 22.1) = 3.43, p = .051. The LLM group generated the highest number of technical requirements (M = 9.67, SD = 1.72), significantly more than the No_LLM group (M = 7.15, SD = 3.13, p = .039), while the LLM_QFD group fell in between (M = 8.36, SD = 2.16).
Overall satisfaction with requirement determination tasks was moderate (M = 3.72, SD= 0.70), with participants expressing cautious optimism tempered by concerns regarding accuracy verification, over-reliance, and potential loss of critical thinking skills. Satisfaction with the task outcome was comparable across all three groups, with No_LLM (M = 3.69, SD = 0.75), LLM (M = 3.67, SD = 0.78), and LLM_QFD (M = 3.82, SD = 0.60), showing no statistically significant differences, although the LLM_QFD group exhibited a slightly higher mean.
Number of delivered technical requirements

In line with RQ1, the AI-assisted conditions report lower perceived task difficulty than the no-LLM baseline, with the LLM-QFD configuration showing the lowest difficulty. In line with RQ2, AI assistance is associated with higher quality requirement sets and a greater tendency toward more technical formulations than manual extraction, though the magnitude and pattern differ across the two AI conditions.
4.2. Thematic analysis of participant experiences
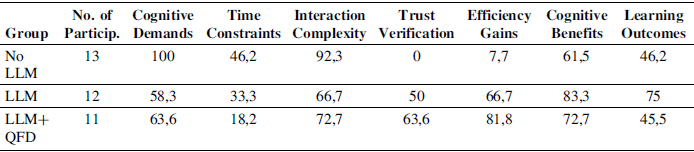
The analysis examined participant reflections on challenges and positive experiences encountered during task completion across three experimental conditions: No LLM (no AI assistance), LLM (AI-assisted), and LLM_QFD (AI-assisted with Quality Function Deployment methodology). Following systematic coding and iterative theme refinement, the analysis identified four primary challenge themes and three positive experience themes that characterize participants’ experiences with technology-mediated, autonomous task completion. Thematic analysis of open-ended responses (N = 36) revealed distinct experiential patterns across experimental conditions. The results were systematically categorized into seven sub-themes (Table 1) reflecting both challenges and positive experiences (cognitive demands, time constraints, interaction complexity, trust and verification issues, efficiency gains, cognitive benefits, learning outcomes). Each participant’s response was binary coded (1=theme present, 0=theme absent) for each theme, and frequencies were calculated as the count of participants mentioning each theme per condition.
Results of thematic analysis

According to participants’ responses on the questionnaire (Table 2), those without AI assistance (No_LLM) reported high cognitive demands (100.0%) and time pressure (46.2%), noting difficulties in interpreting the task and independently generating requirements (92.3% interaction complexity). In contrast, participants using AI (LLM) described reduced mental load (58.3% cognitive demands) but faced new challenges related to the complexity of AI interaction (66.7%), such as formulating effective prompts, interpreting outputs, and verifying their accuracy (50.0% trust and verification). In the most structured AI-supported condition (LLM-QFD), participants’ challenges shifted toward issues of trust, data reliability (63.6%), and technical integration (72.7% interaction complexity) (e.g., file uploads and system limitations). Regarding positive experiences, No_LLM participants valued creative thinking and self-derived learning (61.5% cognitive benefits, 46.2% learning outcomes), while LLM users emphasized efficiency gains (66.7%) and structured reasoning supported by the AI (83.3% cognitive benefits, 75.0% learning outcomes). The LLM-QFD group highlighted speed, automation (81.8% efficiency gains), and critical reflection on AI reliability as key topics (63.6% trust and verification, 72.7% cognitive benefits).
Overall, as an AI involvement increased, participants’ focus moved from creative problem-solving toward managing and evaluating AI performance. These results suggest a progressive shift in cognitive engagement from individual creation to collaborative reasoning to system oversight, reflecting evolving forms of human–AI partnership in design-oriented tasks.
Percentage of participants reporting each challenge or positive theme across conditions [%]

5. Discussion
This study showed that both AI assisted conditions (LLM and LLM-QFD) produced higher quality requirement lists and reduced perceived difficulty compared with manual extraction. The LLM only group generated the most technical requirements and expressed the most positive attitudes toward AI, while the hybrid LLM-QFD condition yielded similar quality but more ambivalent attitudes. These patterns are consistent with work by Reference DinuDinu (2025), who found that engineering students using AI tools achieved higher grades and reported greater satisfaction and lower difficulty than those using traditional methods. They also echo Reference Maier, Schneider and FeuerriegelMaier et al. (2025), whose co-creation experiments showed that reflective, human led AI interactions support quality outcomes while preserving users’ sense of ownership.
Our thematic analysis suggests that AI shifts the cognitive burden from generating and organising requirements to interpreting and verifying AI outputs. Manual participants reported high mental effort and time pressure, whereas AI-assisted participants valued efficiency and structured thinking but highlighted new challenges in prompt formulation, interface complexity, and trust. Similar trade-offs have been reported in AI-supported note-taking: Reference Chen, Ruan, Ju, Yap and WangChen X. et al. (2025) found that automated AI systems reduce extraneous cognitive load but can undermine engagement and ownership, while intermediate assistance fosters understanding and active involvement. Physiological evidence from Reference Jiang, Wu and LeungJiang et al. (2025) further supports the notion that conversational LLMs act as cognitive scaffolds by reducing frontal theta power (a proxy for mental workload) and increasing attention-related P300 amplitude during problem-solving tasks.
The lack of a clear advantage for the LLM-QFD hybrid condition may reflect the added operational friction of using a structured tool. While QFD excels at translating customer needs into technical specifications, integrating it with AI appears to impose additional steps such as uploading files, navigating matrices, verifying AI outputs—that may offset its potential benefits in a time-constrained task. These results underscore the importance of interaction design: systems that preserve user agency and allow for iterative, conversational refinement may engender more positive attitudes and comparable performance, as noted by Reference Maier, Schneider and FeuerriegelMaier et al. (2025). They also align with recommendations from TRIZ-GPT research that emphasise step-by-step reasoning and transparent evaluation when integrating LLMs into established design methodologies (Reference Chen, Song, Ding, Sun, Childs and ZuoChen L. et al., 2024). However, these improvements must be interpreted in light of the participants’ limited engineering experience. Because the participants of our study were students rather than trained requirements engineers, it is likely that the LLMs compensated for gaps in domain knowledge and vocabulary rather than genuinely enhancing expert-level reasoning. In other words, the observed gains reflect what novice designers struggle with most formulating measurable, technically grounded statements tasks that LLMs are particularly good at automating. In addition, the study is constrained by a small sample drawn from a single university, which further limits the generalisability of the findings. The experiment involved a single product pitch and relied on a generic LLM without domain-specific fine-tuning; prior work notes that prompt design and dataset characteristics can heavily influence performance (Reference Norheim, Rebentisch, Xiao, Draeger, Kerbrat and de WeckNorheim et al., 2024). We evaluated quality via expert judgment rather than objective metrics and did not collect physiological measures of cognitive load. Moreover, recent reviews highlight that LLMs remain black boxes with biases, privacy risks and unstable performance on out-of-distribution data (Reference Peykani, Ramezanlou, Tanasescu and GhanidelPeykani et al., 2025). Future research should replicate this study with larger and more diverse samples, explore different domains and LLM configurations, and investigate interfaces that balance guidance with user control. Building publicly available, annotated requirements datasets would also facilitate more rigorous benchmarking and address the data scarcity identified by Reference Norheim, Rebentisch, Xiao, Draeger, Kerbrat and de WeckNorheim et al. (2024).
6. Conclusion
This study examined how different forms of AI assistance influence the extraction of technical requirements from an early-stage product pitch. Across three conditions—manual extraction, LLM assistance, and an LLM QFD hybrid—AI assistance consistently reduced perceived task difficulty and supported the generation of more complete and technically specific requirement sets. These findings suggest that LLMs can serve as effective scaffolds for novice engineers, helping them articulate more structured and actionable requirements.
Beyond performance outcomes, the study also reveals how AI alters the cognitive character of the task: from individual ideation in the manual condition, to collaborative sense making with an LLM, to system level oversight in the LLM QFD configuration. This shift has practical implications for engineering education, where AI tools may be most beneficial when integrated in ways that preserve user agency and encourage critical verification.
Overall, the results highlight both the potential and the limits of AI assisted requirement extraction. While LLMs can improve quality and reduce workload, structured hybrids like QFD guided prompting introduce additional operational steps that must be carefully designed to avoid friction. Future work should therefore examine these approaches with experienced practitioners, a broader range of design problems, and domain adapted models to assess how AI support functions when users already possess mature requirements engineering expertise.
Acknowledgement
This research and its activities were supported by the Slovenian Research and Innovation Agency (ARIS) under the research program P2-0425: Decentralized solutions for the digitalization of industry and smart cities and communities; within the framework of the GREENTECH project, co-financed by the European Union – NextGenerationEU; and partly by the GenAID – Erasmus+ project contract number 2025-1-AT01-KA220-HED-000365381.




 Open access

