


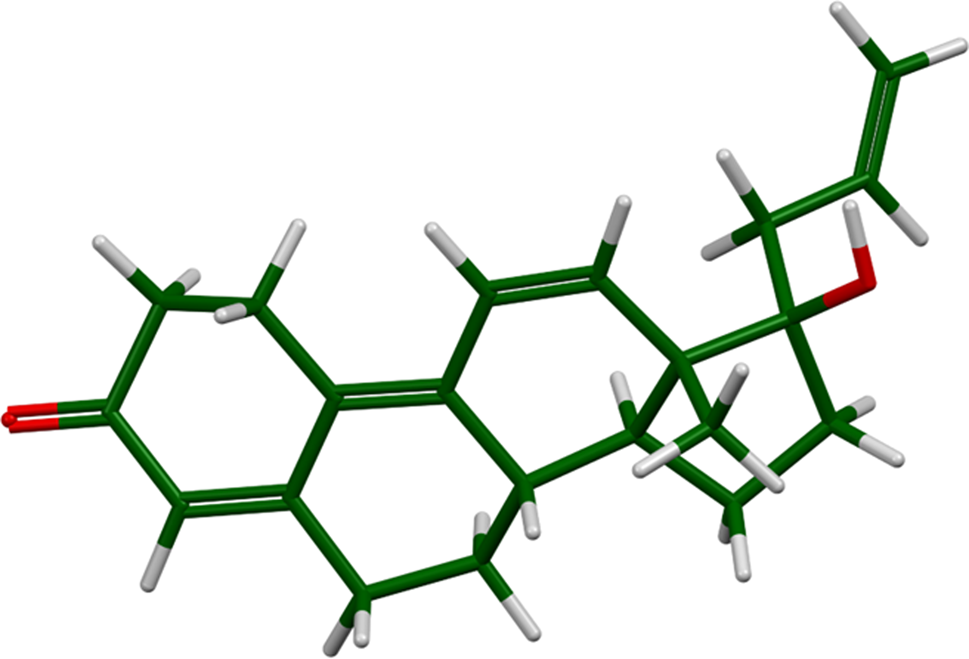
Altrenogest (Figure 1; sold under the brand names Swinemate, Altren, and Regumate) is a steroidal progestin that is widely used in veterinary medicine to suppress estrus (female sexual activity) in mammals. The systematic name (CAS Registry Number 850-52-2) is (8S,13S,14S,17R)-17-hydroxy-13-methyl-17-prop-2-enyl-1,2,6,7,8,14,15,16-octahydrocyclopenta[a]phenanthren-3-one. This work was carried out as part of a project to determine the crystal structures of large-volume commercial pharmaceuticals, and include high-quality powder diffraction data for them in the Powder Diffraction File (Gates-Rector and Blanton, Reference Gates-Rector and Blanton2019).
The molecular structure of altrenogest.
The synchrotron pattern (measured at 11-BM at APS using a wavelength of 0.458 208 Å) of a commercial reagent (purchased from TargetMol, lot #113704) was indexed on a primitive orthorhombic unit cell having a = 7.285 45, b = 10.608 36, c = 22.293 64 Å, V = 1723.0 Å3, and Z = 4 using JADE Pro 8.1 (MDI, 2021). The suggested space group was P212121 (#19). The structure was solved by Monte Carlo simulated annealing techniques as implemented in EXPO2014 (Altomare et al., Reference Altomare, Cuocci, Giacovazzo, Moliterni, Rizzi, Corriero and Falcicchio2013), with a success rate of ~30%; 30% of the trials yielded an essentially identical correct structure. The structure was refined using GSAS-II (Toby and Von Dreele, Reference Toby and Von Dreele2013) and optimized using VASP (Kresse and Furthmüller, Reference Kresse and Furthmüller1996). After refinement, a repeated reduced cell search in the Cambridge Structural Database (Groom et al., Reference Groom, Bruno, Lightfoot and Ward2016) yielded a very recent private communication to the CSD (Cui, Reference Cui2021; Refcode OPOGIM) of the structure of altrenogest at 113 K.
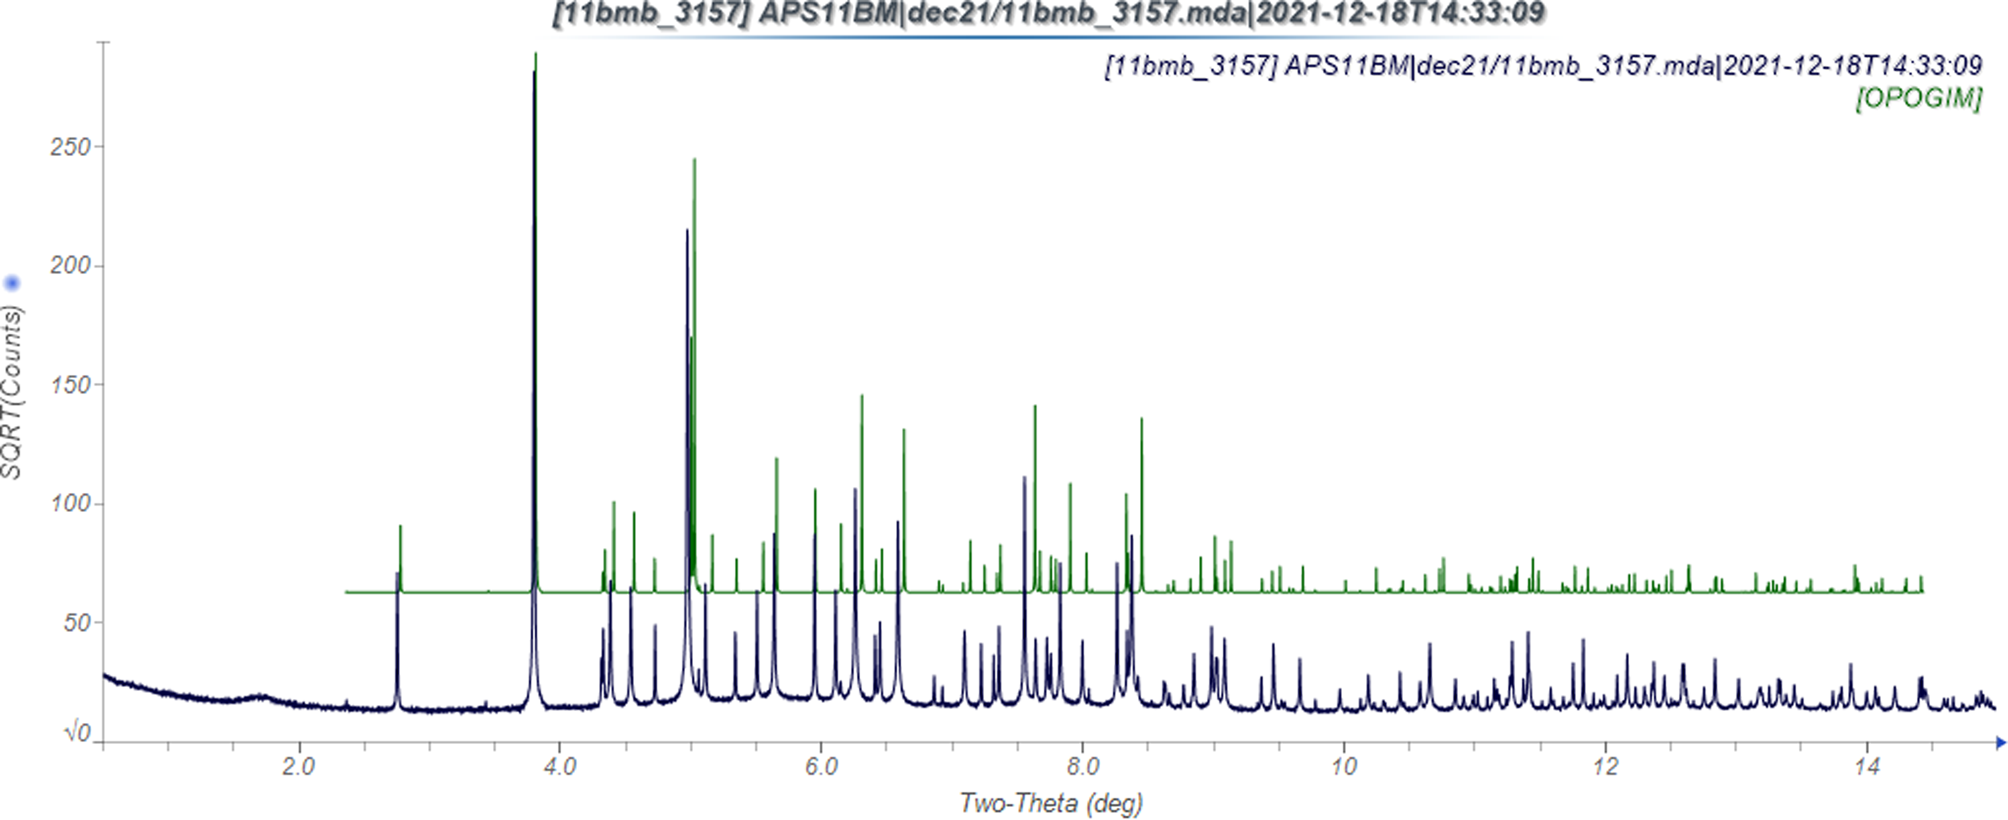
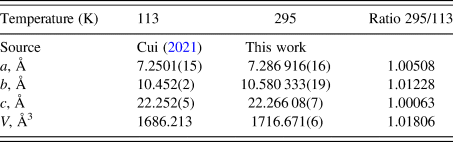
The powder pattern of altrenogest calculated from the 113 K structure of OPOGIM exhibits significant peak shifts, compared with the pattern measured at ambient conditions (Figure 2). The thermal expansion is anisotropic (Table I). It is largest in the b-direction, along which the molecules are stacked. The smallest expansion is along the c-axis, which represents end-to-end contacts. There is one traditional hydrogen bond (Table II) between the hydroxyl group O1–H41 and the carbonyl group O2. These link the molecules into chains parallel to the c-axis with a graph set C1,1(12) (Etter, Reference Etter1990; Bernstein et al., Reference Bernstein, Davis, Shimoni and Chang1995; Shields et al., Reference Shields, Raithby, Allen and Motherwell2000). Two C–H⋯O and one C–H⋯C hydrogen bonds also contribute to the lattice energy.
The observed synchrotron X-ray powder pattern of altrenogest at 295 K (black), compared with that calculated from the single crystal structure at 113 K (green). Note that the y-axis is the square root of the intensity, to highlight the weaker peaks.
Lattice parameters of altrenogest (space group P212121).
Hydrogen bonds (CRYSTAL17; Dovesi et al., Reference Dovesi, Erba, Orlando, Zicovich-Wilson, Civalleri, Maschio, Rerat, Casassa, Baima, Salustro and Kirtman2018) in altrenogest.

I. DEPOSITED DATA
The Crystallographic Information Framework (CIF) files containing the results of the Rietveld refinement (including the raw data) and the DFT geometry optimization were deposited with the ICDD. The data can be requested at info@icdd.com.
ACKNOWLEDGEMENTS
The use of the Advanced Photon Source at Argonne National Laboratory was supported by the U.S. Department of Energy, Office of Science, Office of Basic Energy Sciences, under Contract No. DE-AC02-06CH11357. This work was partially supported by the International Centre for Diffraction Data. We thank Lynn Ribaud and Saul Lapidus for their assistance in the data collection.
CONFLICT OF INTEREST
The authors have no conflicts of interest to declare.


 Open access