


Introduction
The land-terminating part of the Greenland ice sheet (GrIS) is by far larger than the marine-terminating part – yet has so far received much less attention. Studies that deal with Greenland's land-terminating glaciers have mainly focused on the southern and central West coast (Weidick, Reference Weidick1968; Sole and others, Reference Sole, Payne, Bamber, Nienow and Krabill2008; Tedstone and others, Reference Tedstone2015; Carrivick and others, Reference Carrivick, Yde, Knudsen and Kronborg2018; Lesnek and Briner, Reference Lesnek and Briner2018; Koziol and Arnold, Reference Koziol and Arnold2018; Davison and others, Reference Davison, Sole, Livingstone, Cowton and Nienow2019), while fewer studies exist for North Greenland (Goldthwait, Reference Goldthwait1971; Osterberg and others, Reference Osterberg2015; Farnsworth and others, Reference Farnsworth2018). Additionally, most of the glaciers and ice caps (GIC) surrounding the GrIS are land-terminating. The GIC amount to ~5% of the total ice covered area of Greenland (Rastner and others, Reference Rastner2012; Citterio and Ahlstrøm, Reference Citterio and Ahlstrøm2013), were an important contributor to sea level rise in the past (Jacob and others, Reference Jacob, Wahr, Pfeffer and Swenson2012; Bolch and others, Reference Bolch2013; Box and others, Reference Box2018; Zemp and others, Reference Zemp2019) and are expected to continue to be so in future decades (Machguth and others, Reference Machguth2013; Huss and Hock, Reference Huss and Hock2015; Meredith and others, Reference Meredith and Pörtner2019).
The ice-sheet margins in both Greenland and Antarctica have experienced widespread thinning in recent decades (Pritchard and others, Reference Pritchard, Arthern, Vaughan and Edwards2009; Howat and Eddy, Reference Howat and Eddy2011; Kjeldsen and others, Reference Kjeldsen2015) and generally, marine-terminating tongues thin at higher rates than land-terminating ones (Sole and others, Reference Sole, Payne, Bamber, Nienow and Krabill2008; Felikson and others, Reference Felikson2017). Some field studies, however, have shown stability or a temporary advance of land-terminating GIC in both Antarctica (Fitzsimons and Colhoun, Reference Fitzsimons and Colhoun1995; Fountain and others, Reference Fountain, Neumann, Glenn and Chinn2004a; Swanger and others, Reference Swanger, Lamp, Winckler, Schaefer and Marchant2017) and Greenland (Davies and Krinsley, Reference Davies and Krinsley1962; Goldthwait, Reference Goldthwait1971; Dawes and van As, Reference Dawes and van As2010; Farnsworth and others, Reference Farnsworth2018). A comprehensive dataset of length change observations in Greenland (Weidick, Reference Weidick1968; Leclercq and others, Reference Leclercq2012) allows for a centennial perspective on glacier fluctuations: generally, retreat dominated since the end of the Little Ice Age with the highest decadal retreat rates in the 1930s. The database focusses on Southwest and West Greenland. For North Greenland, Davies and Krinsley (Reference Davies and Krinsley1962) found a maximum glacier extent for several glaciers in Northwest Greenland between 1920 and 1930; Goldthwait (Reference Goldthwait1961) found organic material at the Red Rock (RR) ice cliff ~30 m back of the cliff and 41 m under ice cover at that time, which they dated to be ~200 years old. This can be taken as evidence of net ice margin advance on a centennial scale; however, it does not reveal information on possible fluctuations or changing advance rates. To our knowledge, there is no direct evidence of high-resolution centennial glacier changes in Northwest Greenland.
The general hypothesis that recent warming could have increased the viscosity of ice and therefore resulted in an advance, has been put forward (Goldthwait, Reference Goldthwait1971; Fountain and others, Reference Fountain, Neumann, Glenn and Chinn2004a) and for Greenland an increase in accumulation on ice caps has equally been proposed (Davies and Krinsley, Reference Davies and Krinsley1962; Dawes and van As, Reference Dawes and van As2010), although observations are generally scarce for both local climate and ice dynamics. Larger scale observations suggest a dynamic slowdown of the land-terminating sector with an increase in meltwater production due to hydrodynamic coupling (Tedstone and others, Reference Tedstone2015).
On the larger spatial scale, Davies and Krinsley (Reference Davies and Krinsley1962) found more of the GIC in North Greenland to be stationary rather than retreating in contrast to a retreating GrIS. The observation of an ice margin stationarity or advance from geodetic measurements is supported with exposure studies carried out decades later, finding evidence for ice margin advances during the late Holocene (Farnsworth and others, Reference Farnsworth2018). On a longer time-scale, the process of advancing glaciers is relevant for studies as the Greenland ice margin underwent a series of advance and retreat cycles during the Pleistocene (Larsen and others, Reference Larsen2018; Knutz and others, Reference Knutz2019). Revisiting a study area in Northwest Greenland where an advance was reported during the 1950s and 1960s, we provide a detailed history of cliff morphology changes as a basis for further studies investigating the drivers for this behaviour.
The historical context
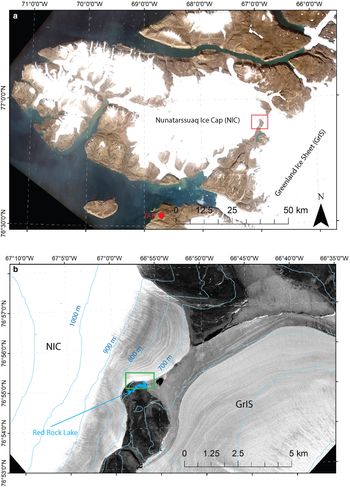
During the expansion of Thule Air Base (TAB) in Northwest Greenland and the operation of Camp Century (Colgan and others, Reference Colgan2016), a number of studies focused on the land-terminating ice margin in the vicinity of the air base (Hooke, Reference Hooke1970) and in a region ~60 km to the northeast where a local ice cap with the unofficial (Bjørk and others, Reference Bjørk, Kruse and Michaelsen2015) but widely used name Nunatarssuaq Ice Cap (NIC) and the GrIS meet (Goldthwait, Reference Goldthwait1956, Reference Goldthwait1961, Reference Goldthwait1971) (Fig. 1). The area directly adjacent to GrIS was named Red Rock (RR) after its apparent colour and the stretch with a near-vertical cliff, the RR ice cliff. Their main motivation was of military and engineering nature, the access to the ice sheet with heavy loads being a central issue.
(a) The study area in Northwest Greenland with the NIC, the GrIS and TAB marked. The background image is a Landsat8 scene from 22 August 2017 (LC80310052017234LGN00). (b) Close-up indicated by the red square in (a). The green square in (b) shows the area of the RR ice cliff, and RR Lake is marked and shown in blue.

During several consequent field expeditions in 1955, 1956 and 1965, each lasting for between a few weeks and several months, a number of scientists around Richard P. Goldthwait investigated the terrestrial ice margin with geodetic, glaciological and meteorological methods resulting in a number of reports and articles that we collected for this study from various sources (Goldthwait, Reference Goldthwait1956, Reference Goldthwait1960, Reference Goldthwait1961, Reference Goldthwait1971; Hilty, Reference Hilty1956; Jury, Reference Jury1957; Landauer, Reference Landauer1958; White, Reference White1958; Nobles, Reference Nobles1960, Reference Nobles1964). Detailed maps of the vertical ice margin, observations of its development over a period of a decade and stake and ice temperature measurements at a number of locations are documented in these publications. The stretch of the ice cliff they describe was composed of a clean ice part in the upper 5–25 m of the cliff on top of a part of debris-containing amber ice in the lower 5 m of the cliff (Goldthwait, Reference Goldthwait1960). Their main findings are that (i) during the decade 1955–1965, the land-terminating ice cliff was advancing at a rate of 0.2 m a−1 and concurrently thinning at 0.6 m a−1 (Goldthwait, Reference Goldthwait1971), (ii) the ice was cold at a temperature of between −12 and −16 °C at 6 m depth and dry based (Hilty, Reference Hilty1956) and (iii) they suggest an annual cycle of cliff morphology changes: an oversteepening during winter due to the absence of surface or frontal ablation is followed by early summer ice warming that triggers dry calving, melt and sublimation and yields a vertical cliff by the end of the summer (Goldthwait, Reference Goldthwait1960). To our knowledge, research activities at this field site ceased in 1965, a time in history where US activities in this part of Greenland reduced following a change in political interest (Nielsen and Nielsen, Reference Nielsen, Nielsen, Doel, Harper and Heymann2016; Colgan and others, Reference Colgan2016).
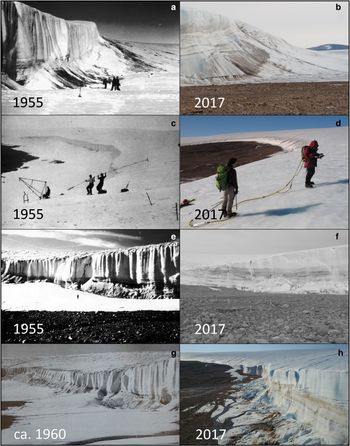
An intriguing property of the ice around the RR is a darker band of ice (Fig. 1b and Figs 2e–h). This has been mentioned already in the early reports (Goldthwait, Reference Goldthwait1956), referred to as ‘amber ice’ and was attributed to shear entrainment and multiple folding of the ice subsequently (cf. Evans, Reference Evans1989). The main interest in the Goldthwait literature however, seems energy balance related and they find indeed higher melt rates at the darker amber bands. Chinn (Reference Chinn1989) investigated similar features in the Antarctic Dry Valleys and attribute those to debris entrainment and hence postulate a local origin. A pioneering work on various locations around the Greenland ice margin summarised by Reeh and others (Reference Reeh, Oerter, Letréguilly, Miller and Hubberten1991, Reference Reeh, Oerter and Thomsen2002) confirms a pre-Holocene origin of the amber band and successfully relates it to deep ice core isotope records of the bottom of the ice sheet. Their conclusion is hence, that it is advected ice originating in palaeo-accumulation zones of the GrIS.
Photographs from the campaigns in the 1950s and 1960s: (a, c, e) Hilty (Reference Hilty1956); (g) Fristrup (Reference Fristrup1963) and from the approximate locations in 2017 (b, d, f, h). Note the fact that the amber part covers a larger fraction of the cliff face in 2017 than in the 1950s and 1960s.

Data and methods
For change detection at the ice margins we use historical data and various remote-sensing products (see Table 1). Only high-resolution products are relevant for the analysis of cliff changes since changes are small and otherwise masked by noise. This makes image resolution of 10 m or lower not usable for this study. We base our change detection on five points in time (1955, 1965, 1985, 2012 and 2017, see Table 1 for details on source, acquisition date, accuracy and resolution).
Overview of the data used in this study including the acquisition date, image resolution, the DEMs' resolution and wherever performed, the co-registration results

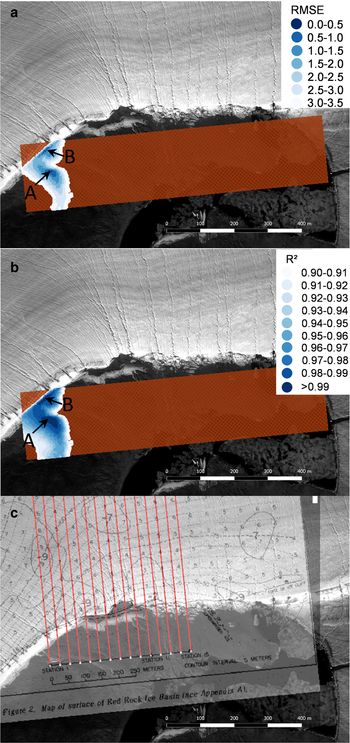
In order to quantify changes in the period 1955–1965, the team around R. Goldthwait established a 420 m long survey line from which 15 profiles, each ~30 m apart were surveyed across the cliff face. Most of the results they present relate to changes referring to this survey line and for cliff front changes they rely on profiles 5–15 (Goldthwait, Reference Goldthwait1971, Fig. 5). Figure 2 in Goldthwait (Reference Goldthwait1971) (‘F2GW1971’ henceforth in order to avoid confusion with figures presented in this study) shows the survey line's position relative to the cliff in 1965. While this allows for locating the position of the survey line approximately, we are not able to use F2GW1971 alone in order to determine changes in cliff position for later years due to the ice margin's changing nature. Unfortunately, both absolute coordinates and stable features, which could be identified in past and recent maps, are missing. Hence, to quantify changes between 1955 and 2017, we need to georeference the past maps using their meta-information and a regression analysis comparing ice-free areas between the time periods. The north arrow (pointing towards true north) in the upper right corner of F2GW1971 however, lets us determine the west/east orientation of the map (5.6° turn anticlockwise). In Appendix B, Table B1, Goldthwait (Reference Goldthwait1971) also provides elevation values of the survey line (base stakes 1–15 relative to stake 1) which are in line with the qualitative description of the survey line of Jury (Reference Jury1957). We derive potential survey lines on the Pleiades 2017 DEM to reconstruct the 1956 survey line. Therefore, we created an artificial grid of points each 1 m apart that has a west/east orientation fitting the information we have from F2GW1971 with a length of 900 m and a width of 200 m. We chose the extent in a way that we would cover all plausible positions of survey lines with respect to the definite natural limits of the RR Lake; the red box in Figure 3a corresponds to the extent of plausible solutions. We then run through the set of potential survey lines, each base stake 30 m apart and derive elevations relative to the position of base stake 1 from the Pléiades 2017 DEM. For each potential survey line, we determine the coefficient of determination (R 2) and the RMSE between the elevation of the survey line presented in F2GW1971 and the potential survey line derived from the 2017 Pléiades DEM. We emphasise that all potential survey lines that were considered are on ice-free terrain during the time period in question. Figure 3a, b show results for RMSE and R 2, respectively, and Figure 4 indicates the relative elevation of the two best-fitting reconstructed profiles together with the reference line from F2GW1971 with base stake 1 as datum. Two results show similar and both near-perfect fit with slightly higher R 2 values for case A. Apart from case A showing a better fit, the derived advance/retreat history is also more plausible when georeferencing F2GW1971 aligning with case A as case B would require unrealistically large advance rates (4 m a−1 over two decades) followed by strong retreat rates, which does not fit to observed climate fluctuations nor thickness changes (see ‘Results’ section). Hence, we orthorectify F2GW1971 to case A of the potential survey line (Fig. 3c). Figure 3c shows the position of the survey line as we determined it using F2GW1971 (half-transparent) and the 15 perpendicular profiles. Since F2GW1971 displays the position of the ice margin in 1965, we take this as the reference and determine the absolute position of the margin in 1956 by applying the relative cliff position changes between 1956 and 1965 as described by Goldthwait (Reference Goldthwait1971). In this report, only changes east of profile 5 are described, likely due to the fact that the cliff morphology to the west is not that clearly developed, and hence the advance or retreat rate could not be clearly determined. For the same reason, we refer to the average of profiles 6–15 when we determine average rates of change. Furthermore we are able to reconstruct a DEM by digitising the 1965 contours and applying the thickness changes from F2GW1971, we can then reconstruct the 1956 DEM. By georeferencing this figure we were therefore able to directly compare the results from the Goldthwait campaigns with more recent remote-sensing products.
(a) RMSE, (b) R 2 and (c) the orthorectified Figure 2 from Goldthwait (Reference Goldthwait1971) overlaid over the Pléiades orthoimage with the determined survey line (white dots) and the perpendicular profiles (red). The two best-fitting reconstructions of the location of base stake 1 of the survey line from 1956 are denoted by A and B.

The relative elevation of the survey line as given in Table B1 in Goldthwait (Reference Goldthwait1971) with 100 referring to the elevation of stake 1 as the datum and the two best-fitting options A and B (both R 2 > 0.99 and RMSE < 0.5 m) derived from the Pléiades DEM.

The 1985 DEM (Korsgaard and others, Reference Korsgaard2016) shows a high degree of interpolation just around the cliff edge. This is the reason why we do not calculate or display thickness changes at the cliff edge there. Fortunately, the original 2 m orthoimages are also provided by Korsgaard and others (Reference Korsgaard2016) and with confidence we use the relevant one (‘g150_1985_utm19.jp2’) in order to determine the position of the 1985 cliff edge after georeferencing it to the Pléiades orthoimage.
For deriving front position and thickness change from the remote-sensing sources after 1985, a 2-D co-registration procedure following Nuth and Kääb (Reference Nuth and Kääb2011) was performed and the 1985 and the 2012 DEM aligned to the Pléiades DEM of 2017. The Pléiades DEM is of high quality and derived using the AMES stereo pipeline (Shean and others, Reference Shean2016). The value of this high-resolution imagery has earlier been shown in detail in glaciological studies (Berthier and others, Reference Berthier2014; Prinz and others, Reference Prinz, Heller, Ladner, Nicholson and Kaser2018). The horizontal shift introduced by the co-registration of the 1985 and 2012 DEMs, respectively, is shown in Table 1 and amounts to <7 m in one direction. In order to derive thickness changes, we apply a vertical correction to both the AeroDEM and the ArcticDEM. This was done by calculating the mean difference with the Pléiades DEM at bare ground south of the cliff front for each profile of the survey line. This difference was used to bias-correct the 1985 and 2012 DEMs. Deviations remained below 3.5 m (Table 1). For the DEM-derived mean thickness changes at the cliff top, we used the co-registered and bias-corrected top of the ice cliffs at locations not impacted by the advance of the cliff front (on average at 735 m a.s.l.) and computed the average thickness change over profiles 6–15 across the survey line. In order to discuss spatial gradients between the NIC and the GrIS we apply the same co-registration corrections to the entire DEM.
Cliff thickness as well as the thickness of the amber ice part for 1956 were derived by digitising Fig. 26 in Goldthwait (Reference Goldthwait1960). We compare this with the thickness of the cliff from the Pléiades DEM and determine the thickness of the amber part in 2017 from the UAV-derived orthophoto which was acquired for the cliff front.
The UAV-based image data were processed using the commercial software Agisoft Photoscan Professional (v. 1.2.3 2735) based on the structure-from-motion principles. General steps of the processing were: (1) computation of the sparse point cloud in order to find the relative camera position and orientation for each photo, (2) location of markers in the individual images to set up the coordinate system and refine alignment optimisation, (3) bundle adjustment and camera calibration, (4) creation of a dense point cloud and computation of the DEM by rasterisation of the dense point cloud which eventually led to a (5) georeferenced orthophoto of the front of the cliff for which the height of the amber part relative to the cliff bottom could be determined. Since we take both cliff position and thickness changes relative to 2017 from the Pléiades DEM, we use the UAV-based DEM merely for quantification of the thickness of the amber part of the cliff, which is why the co-registration with the other remote-sensing products is not necessary.
During the 2017 field campaign, GPR data were acquired in situ with a Malå GPR and a 100 MHz rough terrain antenna acquiring grid lines of ~30 km in total. We use Reflex software in order to derive the ice thickness across the profiles and interpolate the results to a 10 m grid. We estimate an overall accuracy of 10 m, including a positional error.
Long-term homogenised meteorological data exist from TAB since 1947. An access to air temperature data was obtained from Cappelen and others (Reference Cappelen, Vinther, Kern-hansen, Vaarby and Viskum2018). For precipitation, we used bias-corrected and homogenised data from Wong and others (Reference Wong2015). A bias-correction was applied for the missing recent years (Bales and others, Reference Bales2009) for which the raw data were provided by J. Cappelen (personal communication).
Results
Figure 5 shows the surface morphology changes of profiles 5–15 from 1955 to 2017. It is apparent that cliff position changes along the profiles are stronger at the eastern side (higher profile numbers) than at the western side (lower profile numbers) of the cliff front. While profiles 5–8 for instance show a very stable cliff position during the six decades studied, stronger changes occur from profile 10 upwards. Results show that the minor advance between 1955 and 1965 already described by Goldthwait (Reference Goldthwait1971) continued and increased in magnitude until 1985, whereafter all profiles (except for profile 5) show a retreat until 2012. Between 2012 and 2017, a minor advance at the eastern part of the survey line occurred. Profiles with flatter bedrock, with an overdeepening behind the cliff front and with larger ice thicknesses closer to the lake level reveal both higher advance and retreat rates. In terms of thickness changes distinct and continuous thinning has taken place between 1955 and 1965. Profiles 5–9 (Fig. 5) show only a very slight additional thinning until 1985. Thereafter through 2012 and until 2017 the thinning continued at all profile lines. Overall, at profiles 5–13 a net retreat of the cliff position occurred between 1955 and 2017 while profiles 14 and 15 remained at the same position as they were six decades ago.
Profiles 5–15 of the RR ice cliff front as shown in Figure 3c. The cliff position of 1985 is taken from the orthoimage, hence the elevation is set to 30 m arbitrarily and should only indicate the location, not the height. For profiles 5–9 in the upper part of the profile, the quality flag of the DEM is high enough in order to interpret cliff morphology. Five time-steps between 1955 and 2017 of the surface are shown. In addition, the measured bedrock (BR GPR) as well as the interpolated stretches (BR interp) and the elevation of the lake level are shown.

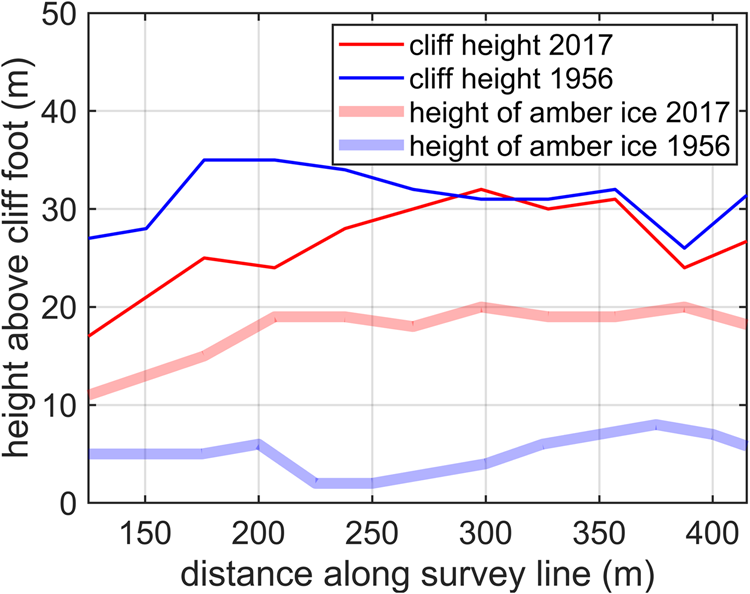
Figure 6 gives a frontal representation of the cliff height comparing 1956 and 2017 on the basis of Goldthwait (Reference Goldthwait1960, Reference Goldthwait1971), the Pléiades DEM for cliff height and the UAV orthoimage for the height of amber ice in 2017, respectively. Amber ice refers to the distinct darker band of debris near the bottom of the cliff. While the comparison of the cliff height for both points in time shows the general thinning, it is striking that both absolute and relative thickness of the amber part have increased significantly. While in 1956 the amber part was on the order of 5 m and in all profiles below 10 m, we notice a thickening to between 15 and 20 m in 2017. This is independently confirmed by photographic evidence (Fig. 2).
Ice cliff height above bottom and the height of amber ice for 1956 (Goldthwait, Reference Goldthwait1960) and 2017 (Pléiades DEM; UAV survey).
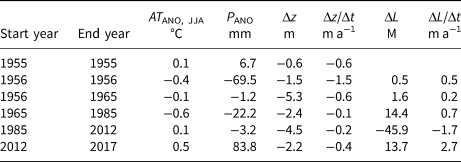
In order to facilitate comparison, in the following we average over profiles 5–15 and derive the rates of change for both thickness and front position changes (Table 2, Fig. 7a). While the periods 1955–1985 and 2012–2017 show a general average advance, the period 1985–2012 shows a significant retreat. The largest average advance rates occurred in the most recent period 2012–2017 with more than 2.5 m a−1 on average, which is mainly caused by the easternmost part of the cliff. Thinning occurred throughout the entire time period although at different rates. Strong thinning rates occurred in the first decade of the study period and ever since the thinning rates increased on average within the period 2012–2017 showing a thickness change of −0.4 m a−1.
(a) Rates of cliff position and rates of thickness change for the respective time periods; (b) summer air temperature anomaly (T ANO, JJA) and (c) annual precipitation anomaly (P ANO) for TAB, respectively. Both (b) and (c) refer to 1981–2010 (average T JJA for 1981–2010 is 4.3 °C; average P is 181 mm). The black line in (b) and (c) gives a 5 year moving average and the yellow line the averages of the anomalies for the same periods for which the geometric changes are known.
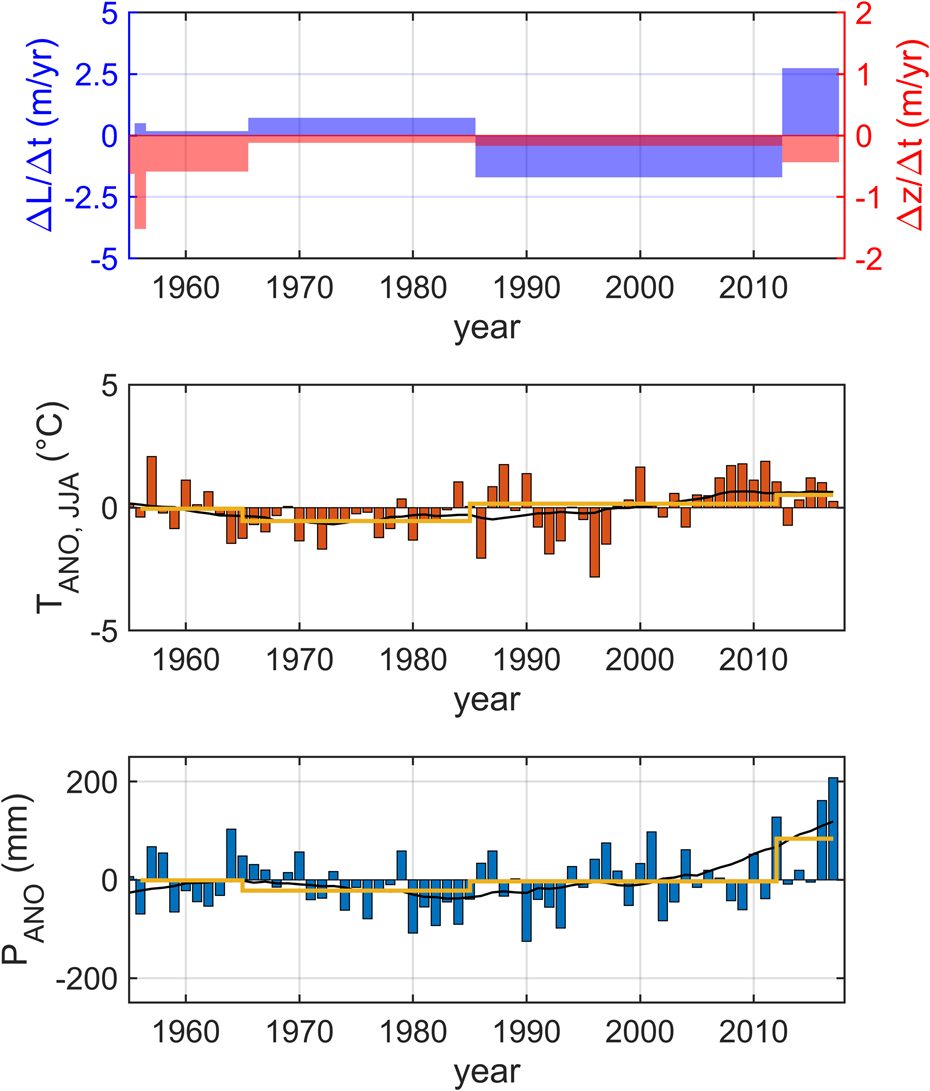
Period average of summer air temperature anomaly AT ANO (°C) for TAB, precipitation anomaly P ANO (mm) for TAB, ice thickness changes Δz (m), rate of ice thickness change Δz/Δt (m a−1), front position change ΔL (m) and rate of front position change ΔL/Δt for the respective time periods
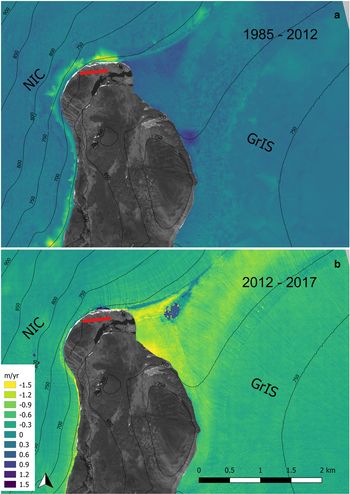
DEM differencing allows putting the results into a larger broader spatial perspective. Figure 8 shows the rate of surface elevation change for the two periods 1985–2012 and 2012–2017, where DEMs for a larger domain are available. It is evident that close to the cliff edge, there is a blue rim, i.e. an apparent thickening between 1985 and 2012. As discussed above, this coincides with an unreliable portion of the 1985 DEMs (Korsgaard and others, Reference Korsgaard2016) and given the advance rates until 1985 that we derived from the orthoimages this does not appear realistic. Between 2012 and 2017, a minor stretch of the cliff advanced and the remainder of the edge is stagnant or retreated. During our field campaign we encountered organic material being pushed up along the cliff front, particularly in its central/eastern portion which allows for an independent indication of a stationary or slightly advancing cliff front. What is also notable in Figure 8 is that the lower parts of the GrIS thin at a stronger rate than NIC. This coincides with a spatial gradient in horizontal displacement, as recent Sentinel-derived velocity maps (Nagler and others, Reference Nagler, Rott, Hetzenecker, Wuite and Potin2015) depict slightly higher flow velocities at NIC compared to GrIS, indicating dynamic downwasting at the GrIS.
Rate of surface elevation change between (a) 1985 and 2012 and (b) 2012–2017 in m a−1. Note both panels relate to the same colour bar, which depicts negative values in red and indicates surface elevation loss. The yellow rim around the cliff margin coincides with the area that has low reliability values in Korsgaard and others (Reference Korsgaard2016). The same colour code is applied for both time periods. The survey line is marked in red (cf. Fig. 3c).

Discussion
Both the cliff front position and thickness underwent some variations over the last six decades. It thus seems prudent to relate the observed changes to atmospheric drivers. TAB's long-term climate monitoring is comparably close to the study site, where similar anomalies may be expected, despite the different elevation of TAB (close to sea level) and RR (in ~700 m a.s.l.). While the elevation difference likely mainly manifests in a temperature offset as temperature anomalies are generally spatially correlated over large distances, we expect a systematically reduced precipitation at RR due to a larger distance to the ocean as a humidity source which is only partly balanced by a vertical precipitation gradient (Wong and others, Reference Wong2015). Table 2 and Figure 7b and c show that before 2012 the overall anomalies in summer air temperatures (T ANO, JJA) and annual precipitation P ANO relate to the anomalies in geometry changes. The period 1965–1985 for instance shows that both an advance and the lowest thinning rates coincide with the period of most negative values of T JJA, ANO and P ANO. Dry and cool periods hence favour advance by reducing ablation. In very recent years the strongest positive T JJA, ANO however coincide both with a positive P ANO and a strong thinning with a concurrent advance. While the strong thinning can be explained by the positive air temperature anomalies favouring ice melt, the advance seems to be of the reversed response compared to earlier periods. Fountain and others (Reference Fountain, Neumann, Glenn and Chinn2004b) discuss the potential of increased deformation through ice softening as a result of long-term warming. In light of this, it would be of very high relevance to repeat the ice temperature measurements that exist and are particularly well documented (Hilty, Reference Hilty1956), especially since after this study, we are able to rather accurately reproduce the original measurement sites. It would be of great interest to use this unique high-temporally resolved dataset in order to challenge ice flow on a very high spatial resolution.
The temporal resolution and direct historically derived glacial history of our study is unique, however, we are only able to resolve glacier changes on a multi-year scale. Given potentially very long dynamic response times we may observe a geometry changes (i) occurring on different time scales and/or (ii) driven by climate fluctuations from before our period of available data. Again, ice flow modelling could help resolving this further and this study is a precondition towards that.
The relative and absolute increase of debris loaded amber ice at the cliff front is an intriguing component of our observations. We speculate that the origin of the amber ice near the foot of the cliff is likely to be connected to a dark band exposed at the GrIS at ~700 m and below (see also Fig. 1b). The fact that the transition from amber to bright ice is higher up in the exposed cliff front in 2017 compared to historical data can potentially point to the inclination of the amber part upstream and entrainment of debris from below, which is suggested by previous studies in similar environments (Chinn, Reference Chinn1989; Fitzsimons and others, Reference Fitzsimons2008). More detailed GPR surveys, modelling studies or ice coring may be able to answer the origin and fate of this debris band and potentially bear potential for relevant palaeo-climatic inverse modelling approaches. A different connection could be a general debris-laden ice layer near the bedrock–ice interface that has been observed among others in the Camp Century Ice Core, which is ~150 km further inland (Herron and Langway, Reference Herron and Langway1979) and has earlier been deemed plausible as an advected source by Reeh and others (Reference Reeh, Oerter and Thomsen2002).
Conclusions
In times of strong glacier area and volume decrease around the world, we found unique archival evidence combined with recent remote sensing and field data showing very moderate changes at the margin of a local ice cap in Northwest Greenland. After decades of minor advance with decadal mean advance rates of up to 0.7 m a−1 until 1985, a phase of margin retreat followed until 2012 that then turned into an advance again. Thinning occurred throughout the entire period at different rates (−1.5 to −0.1 m a−1) with significant accelerated thinning since 2012. A qualitative comparison to air temperature and precipitation anomalies gives independent indication on drivers for the observed changes: while negative air temperature anomalies coincide with moderate thinning rates, the reverse is seen in recent years. Differences between local conditions at the NIC and the GrIS indicate stronger downwasting at the GrIS and a dynamic component balancing parts of the climatic ice surface lowering assuming otherwise similar meteorological conditions. Our study indicates several possibilities for future research: accurate positioning which was achieved in this study would allow for a re-assessment of archival ice temperature data and a comparison with modern data, which is planned to be collected in future campaigns. This could shed light on unique multi-decadal changes in strain rates and ice deformation and can, furthermore, be used to better understand the palaeo-perspective of the measured geometric and morphometric changes. Through that, improved understanding of land-terminating ice margins that respond slowly to climate change could be achieved.
Acknowledgements
The authors acknowledge the Government of Greenland for support of the reconnaissance expedition in 2017 through the Tipps og Lottomidler Pulje C. Additionally, W. Colgan from GEUS is acknowledged for providing GPR equipment and Asiaq, Greenland Survey, for logistical support. JFS would like to acknowledge support from the European Research Council (ERC) under the European Union's Horizon 2020 research and innovation program (grant number 676819). The Pléiades stereo-pair used in this study was provided by the Pléiades Glacier Observatory initiative of the French Space Agency (CNES). Graz University is acknowledged for support of publication costs. The authors thank A. Bjørk, one anonymous reviewer and H. Jiskoot for constructive feedback on the paper.


 Open access