


1. Introduction
The Rhine–Meuse delta has multiple branches, the main ones extending to the North Sea and secondary ones draining into a central lagoon. Most of these channels have a natural origin, but during the last millennia humans increasingly used and adapted the river networks. The time of Roman occupation, beginning c. 12 BC under army commander Drusus, is considered the period with the oldest humanly organised waterworks in the delta. The Romans created a shipping network through the construction of canals (Willems, Reference Willems1981/1984, 55 ff., 387 ff.; De Kort & Raczynski-Henk, Reference de Kort and Rackzynski-Henk2014) and by influencing the hydrology of the natural delta channels by groyne construction (Vollgraff, Reference Vollgraff1938, Reference Vollgraff1939; Schönfeld, Reference Schönfeld1940a, Reference Schönfeld1940b; Willems, Reference Willems1981/1984, 52 ff); further adaptations included the construction of harbours and other facilities to load and unload cargo (Graafstal, Reference Graafstal2002; Blackman, Reference Blackman and Oleson2008; Morhange et al., Reference Morhange, Marriner, Bony, Flaux, Giaime, Kouka and Franconi2017; Mirschenz, Reference Mirschenz and Eger2018). The construction of such efficient transport networks and the associated trade opportunities contributed to the successful consolidation of the vast Roman Empire (Ruffing, Reference Ruffing and Eger2018, 8). Whilst transportation overland was still important, testified by a network of well-maintained roads (Chevallier & Field, Reference Chevallier and Field1976; Rathmann, Reference Rathmann2004; Klee, Reference Klee2010, 65 ff., 107ff.; Van Lanen, Reference van Lanen2017; Van Lanen & Pierik, Reference van Lanen and Pierik2017), much larger cargoes, both goods and people, could be transported by water (Bechert & Willems, Reference Bechert and Willems1995, 24; Eck, Reference Eck and Ohlig2007, 111; Grewe, Reference Grewe and Oleson2008, 333; Jansma et al., Reference Jansma, van Lanen and Pierik2017). Such advantages led the Romans to construct shipping networks made up of canals, natural river channels and sea lanes across the Empire; e.g. several canals were built in and around the Po delta (northern Italy), creating a network that covered a large area immediately behind the coast (Medas, Reference Medas, Bonifacio and Caniato2013, Reference Medas, Cantoni and Capurso2017).
The first Roman canal(s) in the Rhine–Meuse delta, engineered under the leadership of Drusus between 12 and 9 BC, is/are mentioned by two classical authors: Tacitus (in works produced c. 110 AD) and Suetonius (c. 120 AD). Tacitus describes how in 16 AD Germanicus sailed into the Drusus Canal (fossam, cui Drusianae nomen) with his ships containing legions and allies (Tacitus, Annales II, 8). Following a prosperous journey over lakes and the ocean, he reached the river Ems (Fig. 2). Suetonius reports that Drusus was the first of the Roman commanders to sail the ocean (North Sea) and had canals dug at the other side of the Rhine. These canals were an unprecedented and significant feat of engineering (fossas novi et immensi operis); more than 50 years after Drusus, they were still called Drusus Canals (Drusinae) (Suetonius, Vita divi Claudii I, 2–4). It is striking that the plural ‘canals’ is used here. The classical references indicate that the canal(s) played a role in the Roman attempts to subjugate North Germania and created a navigable connection between the Rhine delta and the Wadden Sea, from where the ships with troops could sail up the North German rivers (the Ems, Weser and Elbe). The use of the new connection avoided the risks of sailing on inhospitable high seas and the logistical problems of transhipment of river- to sea-going vessels and vice versa.
The location of the Drusus Canal(s) has been an issue that has vexed researchers for more than four centuries. For a long time, the route of the river IJssel in the east of the Rhine delta (Fig. 1) was the prime candidate to project Drusus’ canal works along. In the second half of the 16th century, historians and cartographers were convinced that the upper reach of the IJssel (Boven-IJssel in Fig. 1) was the site and the end result of Drusus’ canal digging mentioned in the classic texts. Later, many more hypotheses about the location of the canal(s) of Drusus have been put forward, which are now the subject of inventory and further evaluation (and the broader topic of the PhD thesis project of the first author). An important point here is that for a considerable time researchers thought that towards the end of prehistory the Oude IJssel (Old IJssel) from Doesburg continued northward (Van de Meene, Reference van de Meene1979; Teunissen, Reference Teunissen1980 and underlying references). New insights into the natural development of the lower reaches of the IJssel (Beneden-IJssel in Fig. 1) have revealed that this Rhine branch is evidently younger than hitherto considered (Makaske et al., Reference Makaske, Maas and van Smeerdijk2008, 333) and that it originated in the early Middle Ages (or possibly in the late Roman period) by a natural breakthrough between Doesburg and Deventer (Cohen et al., Reference Cohen, Stouthamer, Hoek, Berendsen and Kempen2009, 103). The implication of this is that when Drusus arrived in this region, the (Oude) IJssel from Doesburg ran south of the Veluwe to the west merging with the Rhine system at Arnhem (Fig. 2, compare Fig. 1)
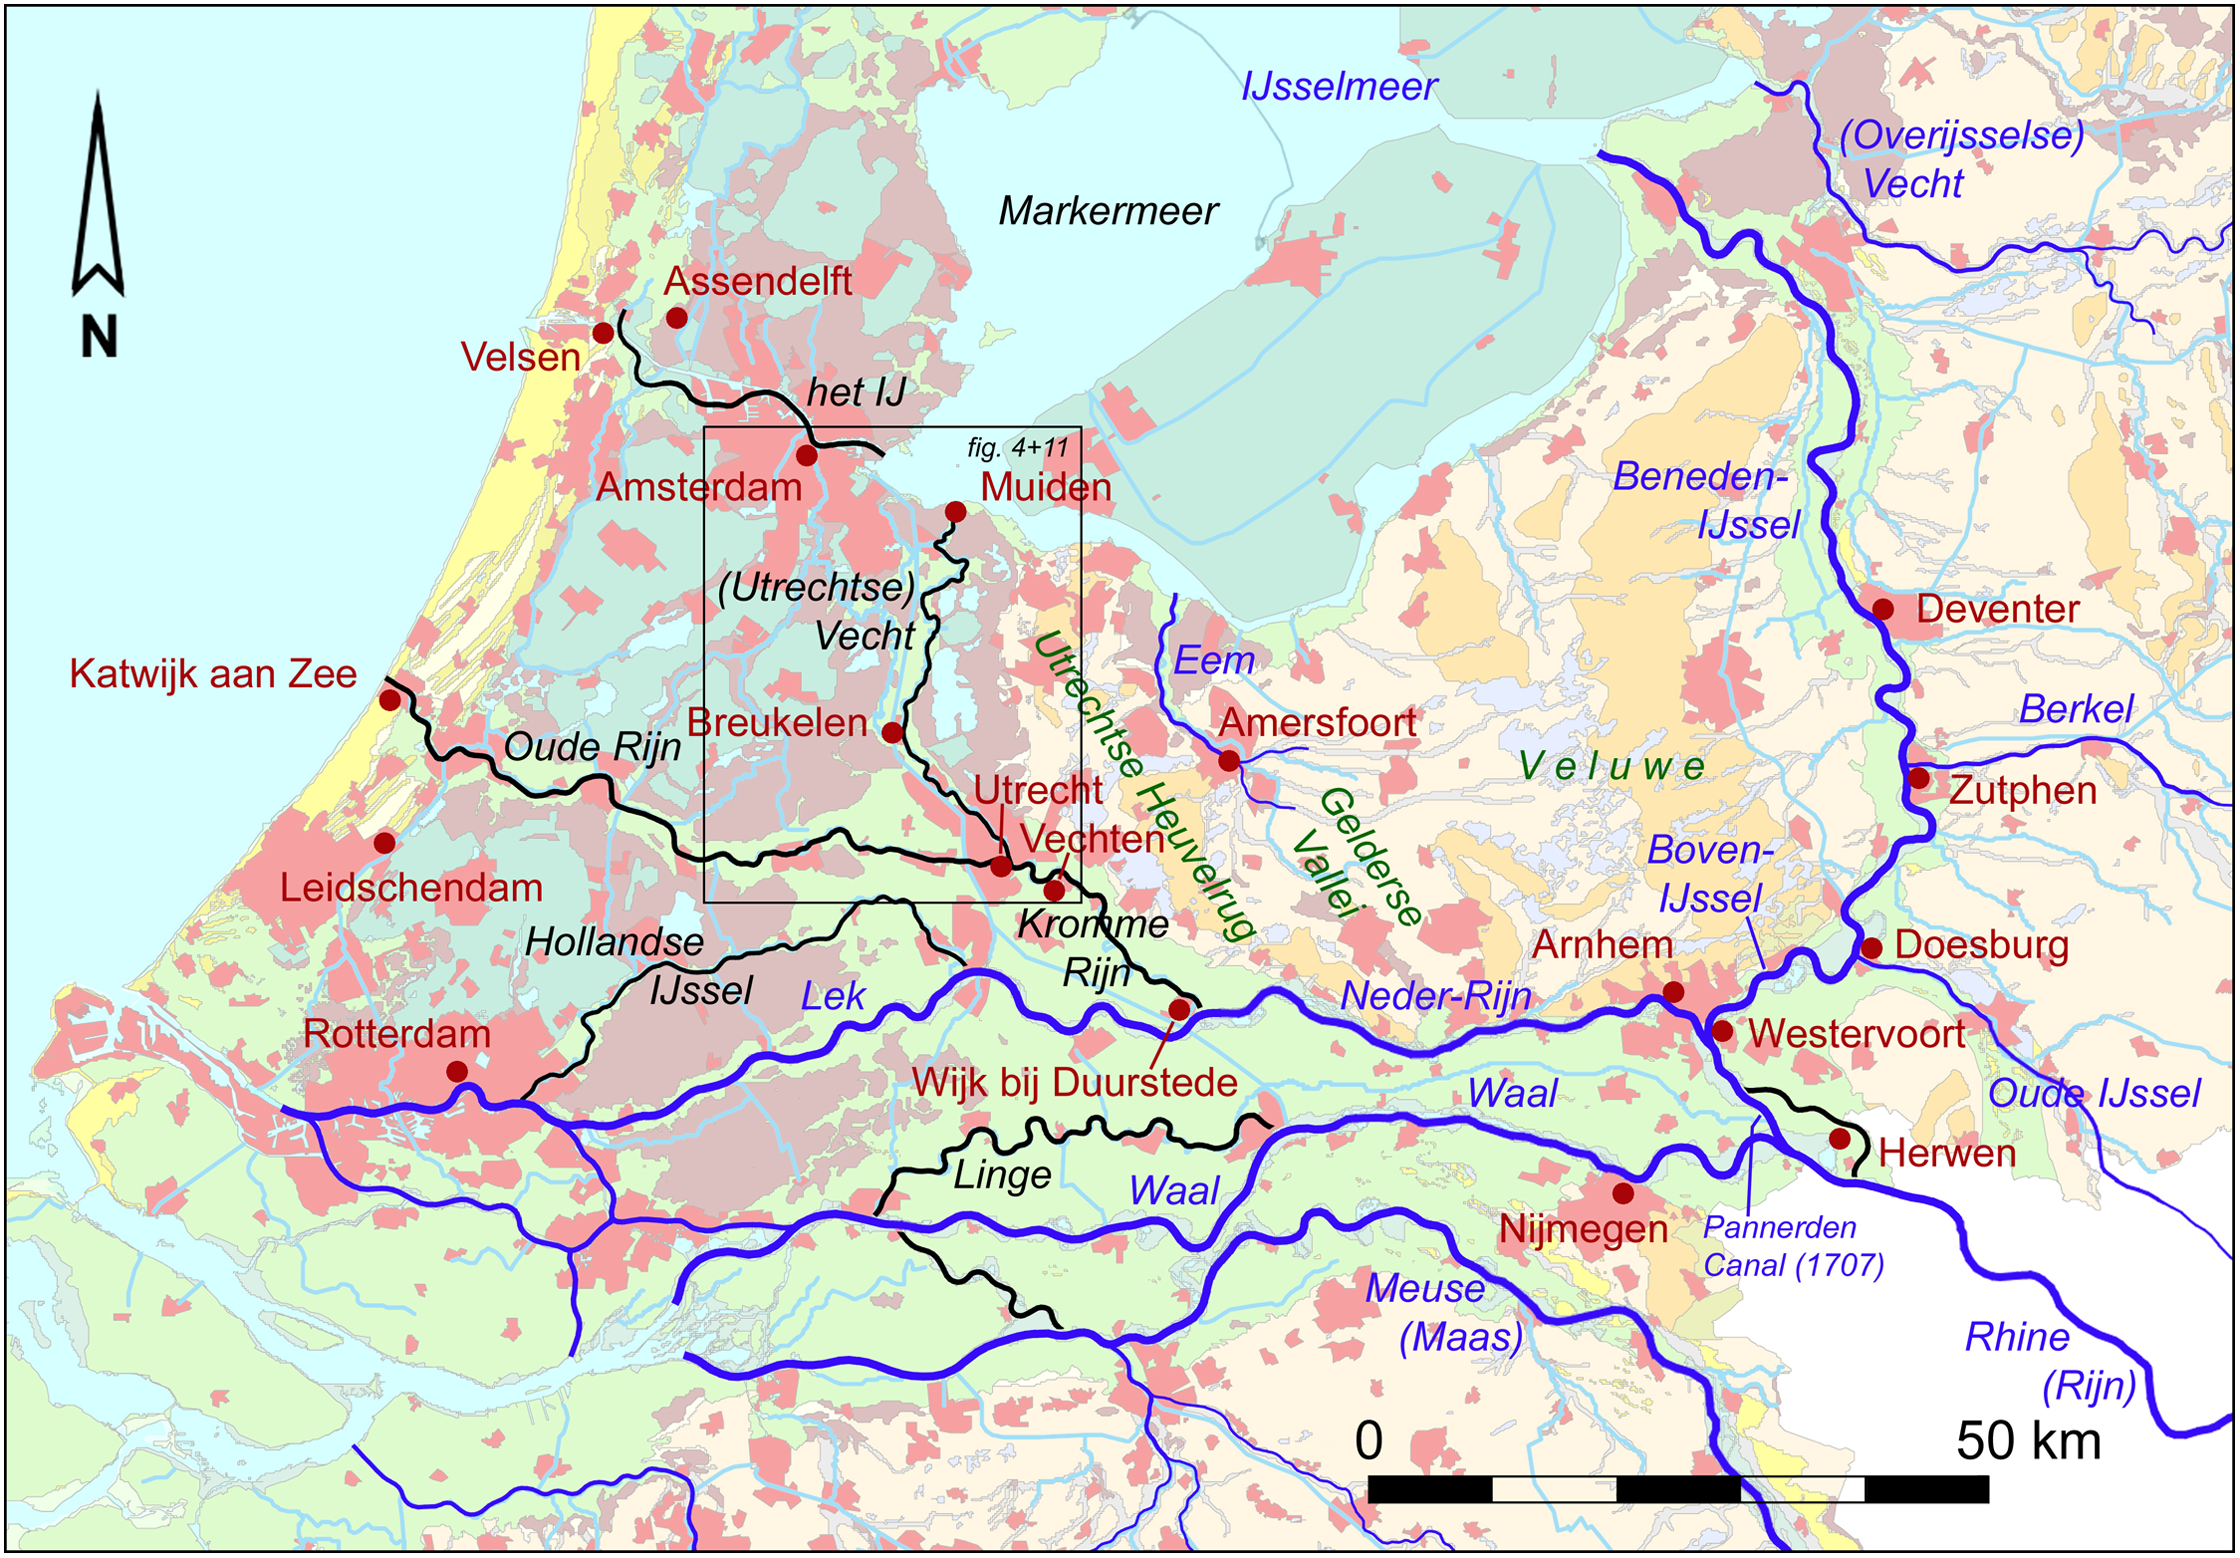
The Rhine–Meuse delta in the Netherlands, with annotation of the places and rivers mentioned in the text. The current active river branches are shown in dark blue. The branches that only drain water locally are shown in black. Map background: Vos & de Vries (Reference Vos and de Vries2013) (v 2.0), situation 2000 AD.
Remaining options for the navigation route to the north, created under the direction of Drusus. Possible channels are shown in red. Local improvements may have been made in the Rhine section (purple). River network is from early Roman period. Inset: contemporary NW European river network with routes of the fleet trips of Drusus, Tiberius and Germanicus between 12 BC and 16 AD. Palaeogeographical map background: Vos & de Vries (Reference Vos and de Vries2013) (v 2.0), situation iron age, c. 500 BC.

Despite the multiple hypotheses put forward, the presence of not a single metre of a Canal of Drusus has yet been corroborated. This stands in sharp contrast to what is known about another Roman canal mentioned by classic sources, constructed under Governor Corbulo in the very west of the delta. Corbulo’s Canal (c. 50 AD) was constructed parallel to the beach barrier complex of South-Holland; since 1989, archaeological evidence for the feature has been identified in dozens of places along a stretch of about 13 km (De Kort & Rackzynski-Henk, Reference de Kort and Rackzynski-Henk2014; Polak et al., Reference Polak, Bödecker, Berger, Zandstra and Leene2019; Hessing & Schrijvers, Reference Hessing and Schrijvers2021). This difference might be explained by the fact that in South-Holland much archaeological research was carried out, in response to intensive building activities. A more fundamental explanation may be that the positions of these two waterways within the landscape were basically different. Whereas Corbulo’s canal was constructed between two roughly equivalent points at the Roman Rhine and the Helinium (Fig. 2), most hypotheses for the Drusus canals assume that they became part of a river network, similar to the Pannerdensch Kanaal in 1707 (Fig. 1; Van de Ven, Reference van de Ven2007) and the 16th-century hypothesis of the Boven-IJssel as the Drusus Canal.
In the case of the Drusus Canal(s) post-depositional processes (mainly erosion by widening, deepening and lateral migration) may have resulted in the remains becoming not or hardly recognisable in the subsurface, whereas in the case of the Corbulo Canal, such processes (mainly sedimentation) will not have had a major impact. In ideal cases, when remains of an original canal construction have not been eroded, evidence for revetments and digging (created cut surfaces) are usually found. When little or no in situ remains are likely to have been preserved, research will have to focus on indirect indications: e.g. the morphology and depositional chronology of a river section. Furthermore, in the case of the Drusus Canal(s), until this study, no targeted fieldwork had been undertaken, simply because it has been like looking for a needle in a haystack. However, progress in physical geographical and geoarchaeological research in the Rhine–Meuse delta (e.g. Makaske et al., Reference Makaske, Maas and van Smeerdijk2008; Bos et al., Reference Bos, Feiken, Bunnik and Schokker2009; Cohen et al., Reference Cohen, Stouthamer, Hoek, Berendsen and Kempen2009; Erkens, Reference Erkens2009; Van Dinter, Reference van Dinter2013) and the coastal area (Vos, Reference Vos2015) has been used to reassess and partly eliminate the hypotheses about the Drusus Canal(s), from which the Vecht emerged as the most probable Drusus route.
In this study, we first describe the implications of the new palaeogeographical and archaeological insights for our knowledge of the location and function of the Drusus Canal(s), resulting in a new working hypothesis (Section 2). Second, we present the methods and results of our fieldwork (Sections 3 and 4). Finally, we assess whether there are concrete indications of active human intervention by the Romans in the area of the Utrechtse Vecht (Sections 5 and 6).
2. Investigating the Drusus Canals using a geoarcheological perspective
2.1. The focus on the Vecht river
Not withstanding the many hypotheses described in earlier literature, in the actual state of research on the location of the Drusus Canal(s), only three variants remain (denoted as options R1 to R3 below). Each of these would fit well with the new palaeogeographical insights and the location ‘at the opposite side of the Rhine’ mentioned by Suetonius. Figure 2 plots the three remaining possible canal routes of Drusus, they are:
Option R1, a route making use of the Utrechtse Vecht. This hypothesis was raised by Van Asch van Wijk (Reference van Asch van Wijck1846) and strengthened by the discovery of the castellum (auxiliary fort) near Vechten at the end of the 19th century. This branch of the Rhine is part of the Angstel-Vecht system, a deltaic branch of the Rhine, which evolved by an avulsion of the Rhine near Vechten and Utrecht, between 1000 and 800 BC (Törnqvist, Reference Törnqvist1993, 149; Bos et al., Reference Bos, Feiken, Bunnik and Schokker2009, 368; Van Dinter et al., Reference van Dinter, Cohen, Hoek, Stouthamer, Jansma and Middelkoop2017).
Option R2, a route through the Gelderse Vallei (Fig. 2), a lowland area between the ice-pushed ridges of the Veluwe and the Utrechtse Heuvelrug. The southern part of the valley was originally a peat bog, the central part consisting mainly of cover sands, the northern part peat land again. The area was dissected by some local streams, congregating into the northward draining Eem river. A smaller counterpart stream drained southward towards the Rhine.
Option R3, the valley of the (current) Beneden-IJssel, that lies between the Veluwe ice-pushed ridge at the west side and an area with cover sands and a locally ice-pushed ridge at the east side. In prehistoric times up to early middle ages, streams from these areas carried most of their water to the north (Dortherbeek/Hunnepe, Duurse Beek and Fliert near Deventer; Spek et al., Reference Spek, Zeiler and Raap1996), but some drained south (Berkel and Voorsterbeek near Zutphen) to the Oude IJssel, which in turn, flowed into the Rhine near Arnhem (Fig. 2). Cohen et al. (Reference Cohen, Stouthamer, Hoek, Berendsen and Kempen2009, 104) suggest that it is possible that Drusus has dug a canal through the drainage divide, but to date no traces of such a connection have been found. Traces of such a canal might be eroded by the strongly meandering Beneden-IJssel.
Each of these three options has arguments pro and contra, which are the subject of evaluation (PhD thesis project of the first author). Because of the scope of this study, we will limit ourselves here to a few arguments. Option R1 would have been a (canal) improvement of a natural route, while R2 and R3 would have involved digging across a drainage divide to make a connection between two brook systems, implicating problems with water levels. A practical advantage of option R1 compared to option R3 could have been that it was possible to create a freely flowing waterway, assuming a relationship between the Dam (moles) and the Canal(s) of Drusus, both serving the aim to provide a waterborne transport route (Verhagen et al., Reference Verhagen, Kluiving, Anker, van Leeuwen and Prins2017, 461–463; Fig. 2). From a (military) functional point of view, this is favoured over a combination of the Drusus Dam and an IJssel connection (R3). In the latter case, the extra water should have back-flooded areas between Westervoort and Doesburg to reach the possible artificial connection across the drainage divide (somewhere between Doesburg and Deventer), connecting the separate brook systems in the IJssel valley. This could have been achieved ‘whether by digging an artificial connection or by creating some kind of portage’, while ‘a difference in water level could be overcome by the construction of a lock, possibly in the form of temporary dams or weirs’ (Polak & Kooistra, Reference Polak and Kooistra2013, 403–404). This option is still a possible one, but we regard it as less probable. Also the Gelderse Vallei connection (R2) would have needed a portage or a lock. In this area, the palaeogeography of the subsoil is still completely intact, while there is no indication that there has been a through-going watercourse (natural or artificial) from the Rhine delta branch. By this, option R2 has got hardly any support among researchers.
Focusing on the Vecht (R1) option as the most plausible candidate, there are some aspects to be considered in order to research and understand the role of the Vecht connection within the river network better:
-
(1) There is the fairly widespread view that the Vecht was navigated by the Romans (see among others Willems, Reference Willems1981/1984, 58; Kok, Reference Kok2007, 54; Manten, Reference Manten2007; Vos et al., Reference Vos, de Koning and van Eerden2015, 320). In other studies, the supposed routes of the fleet campaigns of Drusus, Tiberius and Germanicus are drawn on maps via the river Vecht (Lendering & Bosman, Reference Lendering and Bosman2010, 69, 81, 105; Kehne, Reference Kehne, Burmeister and Ortisi2018, 46–49). Willems (Reference Willems1981/1984, 58) and Manten (Reference Manten2007, 63) even take the position that the Drusus’ Canal(s) had been constructed in the area of the IJssel, but that the Romans had also used the Vecht as a navigation route. A fundamental question is whether the Vecht could be navigated by the Romans because of canal construction in its reaches or parallel to canal construction somewhere else. Anyhow, from an operational military point of view, the early castella at Vechten and Velsen presuppose a navigable route along the Vecht.
-
(2) Some studies in recent decades have discussed the possibility of human intervention (in Roman and later times) by altering the course of parts of the Vecht, without reaching solid conclusions (Van de Meene et al., Reference van de Meene, van Meerkerk and van der Staay1988, 62; Weerts et al., Reference Weerts, Cleveringa and Gouw2002, 70; Van der Velde et al., Reference van der Velde, Bloo, van Beurden, Brinkhuizen, van Dijk, van Dinter, Esser, Schreijer and Spanjer2003, 9; Kok, Reference Kok2007, 54; Manten, Reference Manten2007) (see also in the discussion section).
-
(3) Among Roman historians, there are several descriptions of a channel branch on the right side of the Rhine delta. According to Pomponius Mela, writing c. 50 AD, this branch flowed through a large lake called Flevum and then into the sea (Mela, De situ orbis, III, 24). According to Pliny (23–79 AD), there were three Rhine branches: the Helinium, the Rhine and a northern branch that flowed through lakes (Pliny, Naturalis Historia IV, 29). Ptolemy (87–168 AD) mentions three Rhine mouths north of Lugdunum Batavorum (Katwijk aan Zee) (Ptolemy, Geographia II, 9, 1); although there are also discrepancies in his geographical coordinates, from the mentioned order along the coast it seems likely that these must be the Oude Rijn, the Oer-IJ and the Vlie. According to Tacitus, Germanicus and his fleet entered the canal named after Drusus and sailed through lakes and the ocean to the Ems (Tacitus, Annales II, 8). The mention of lakes and the large lake (ingens lacus) Flevum corresponds more to the situation in the Vecht area with its peat-bounded lakes and the Oer-IJ than to the situation of options R2 and R3.
It is not unreasonable to suggest that the Romans were forced to create an artificial route for their flat-bottomed boats in the Angstel-Vecht area, since the river water ran through peat-bounded lakes (see Section 2.2), which in their proximal parts were filled by clastic sediments with a network of small distributaries, while the fluvial activity of the Angstel-Vecht system was strongly reduced during the last few centuries BC (Bos et al., Reference Bos, Feiken, Bunnik and Schokker2009, 368). It is possible that with some human intervention this branch of the river could have been reopened. Hence, we formulate the hypothesis that the Vecht is the most likely location of the ‘Drusus Canal(s)’. In this study, a geoarchaeological programme of new field research and associated analyses was undertaken in this area of the river Vecht to test our hypothesis.
2.2. Geomorphology of the Angstel and Vecht system
The system of the Angstel and Vecht is located west of the Utrechtse Heuvelrug, the latter area pushed up during the Saalian glaciation. The associated fluvioglacial sandur deposits (Formation of Drente) form the deeper substrate (several m) of the study area, while their top decreases towards the west (Fig. 3). The channel belt cuts through both the Holocene peat and the underlying Pleistocene sand (Weerts et al., Reference Weerts, Cleveringa and Gouw2002; Bos et al., Reference Bos, Feiken, Bunnik and Schokker2009; Bos, Reference Bos2010). The natural levee and flood basin deposits of the Angstel and Vecht overlie the peat sequence. Bos et al. (Reference Bos, Feiken, Bunnik and Schokker2009, 359) have provided a detailed insight into the various river channels, including their migration and crevasse splay development within this system (Fig. 4).
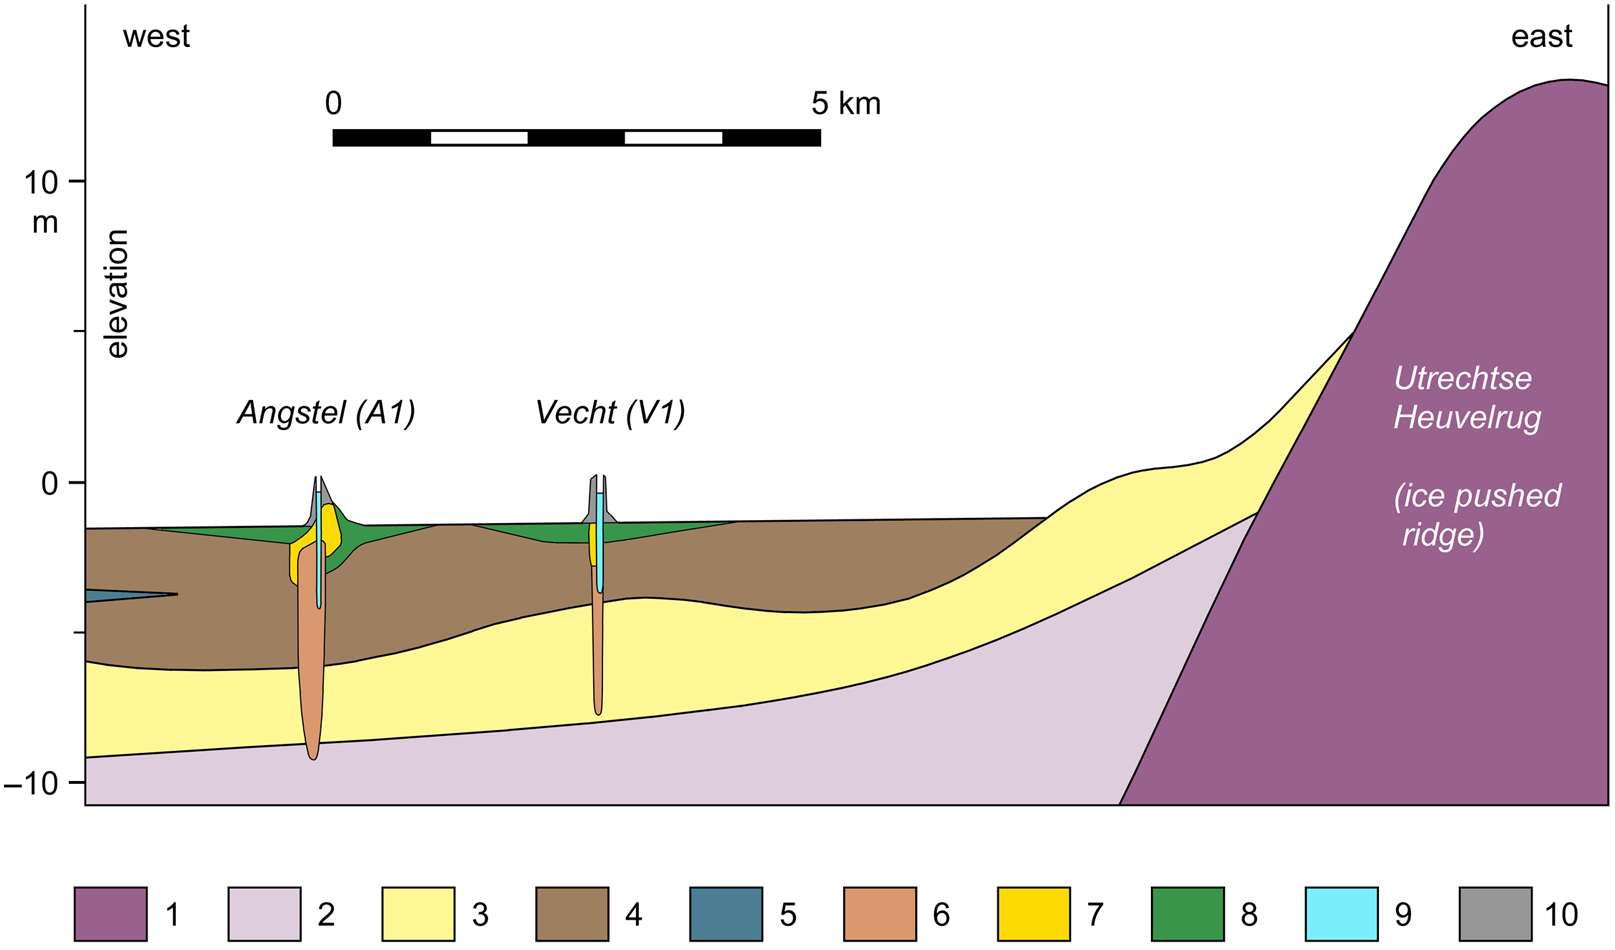
Geological cross-section through the Angstel and Vecht system and adjacent ice-pushed ridge of the Utrechtse Heuvelrug. Transect line is shown in Fig. 4. Legend: 1 = glaciotectonised Early and Middle Pleistocene; 2 = glacio-fluvial outwash sands; 3 = Late Pleistocene cover sands; 4 = Holocene peat (Nieuwkoop Formation); 5 = backbarrier tidal clays (Naaldwijk Formation); 6 = deltaic river channel deposits; 7 = natural levee deposits; 8 = flood basin deposits; 9 = water; 10 = anthropogenic deposits (dike/raising). After: Bos et al. (Reference Bos, Feiken, Bunnik and Schokker2009), Figs. 3, 6C and 6D.
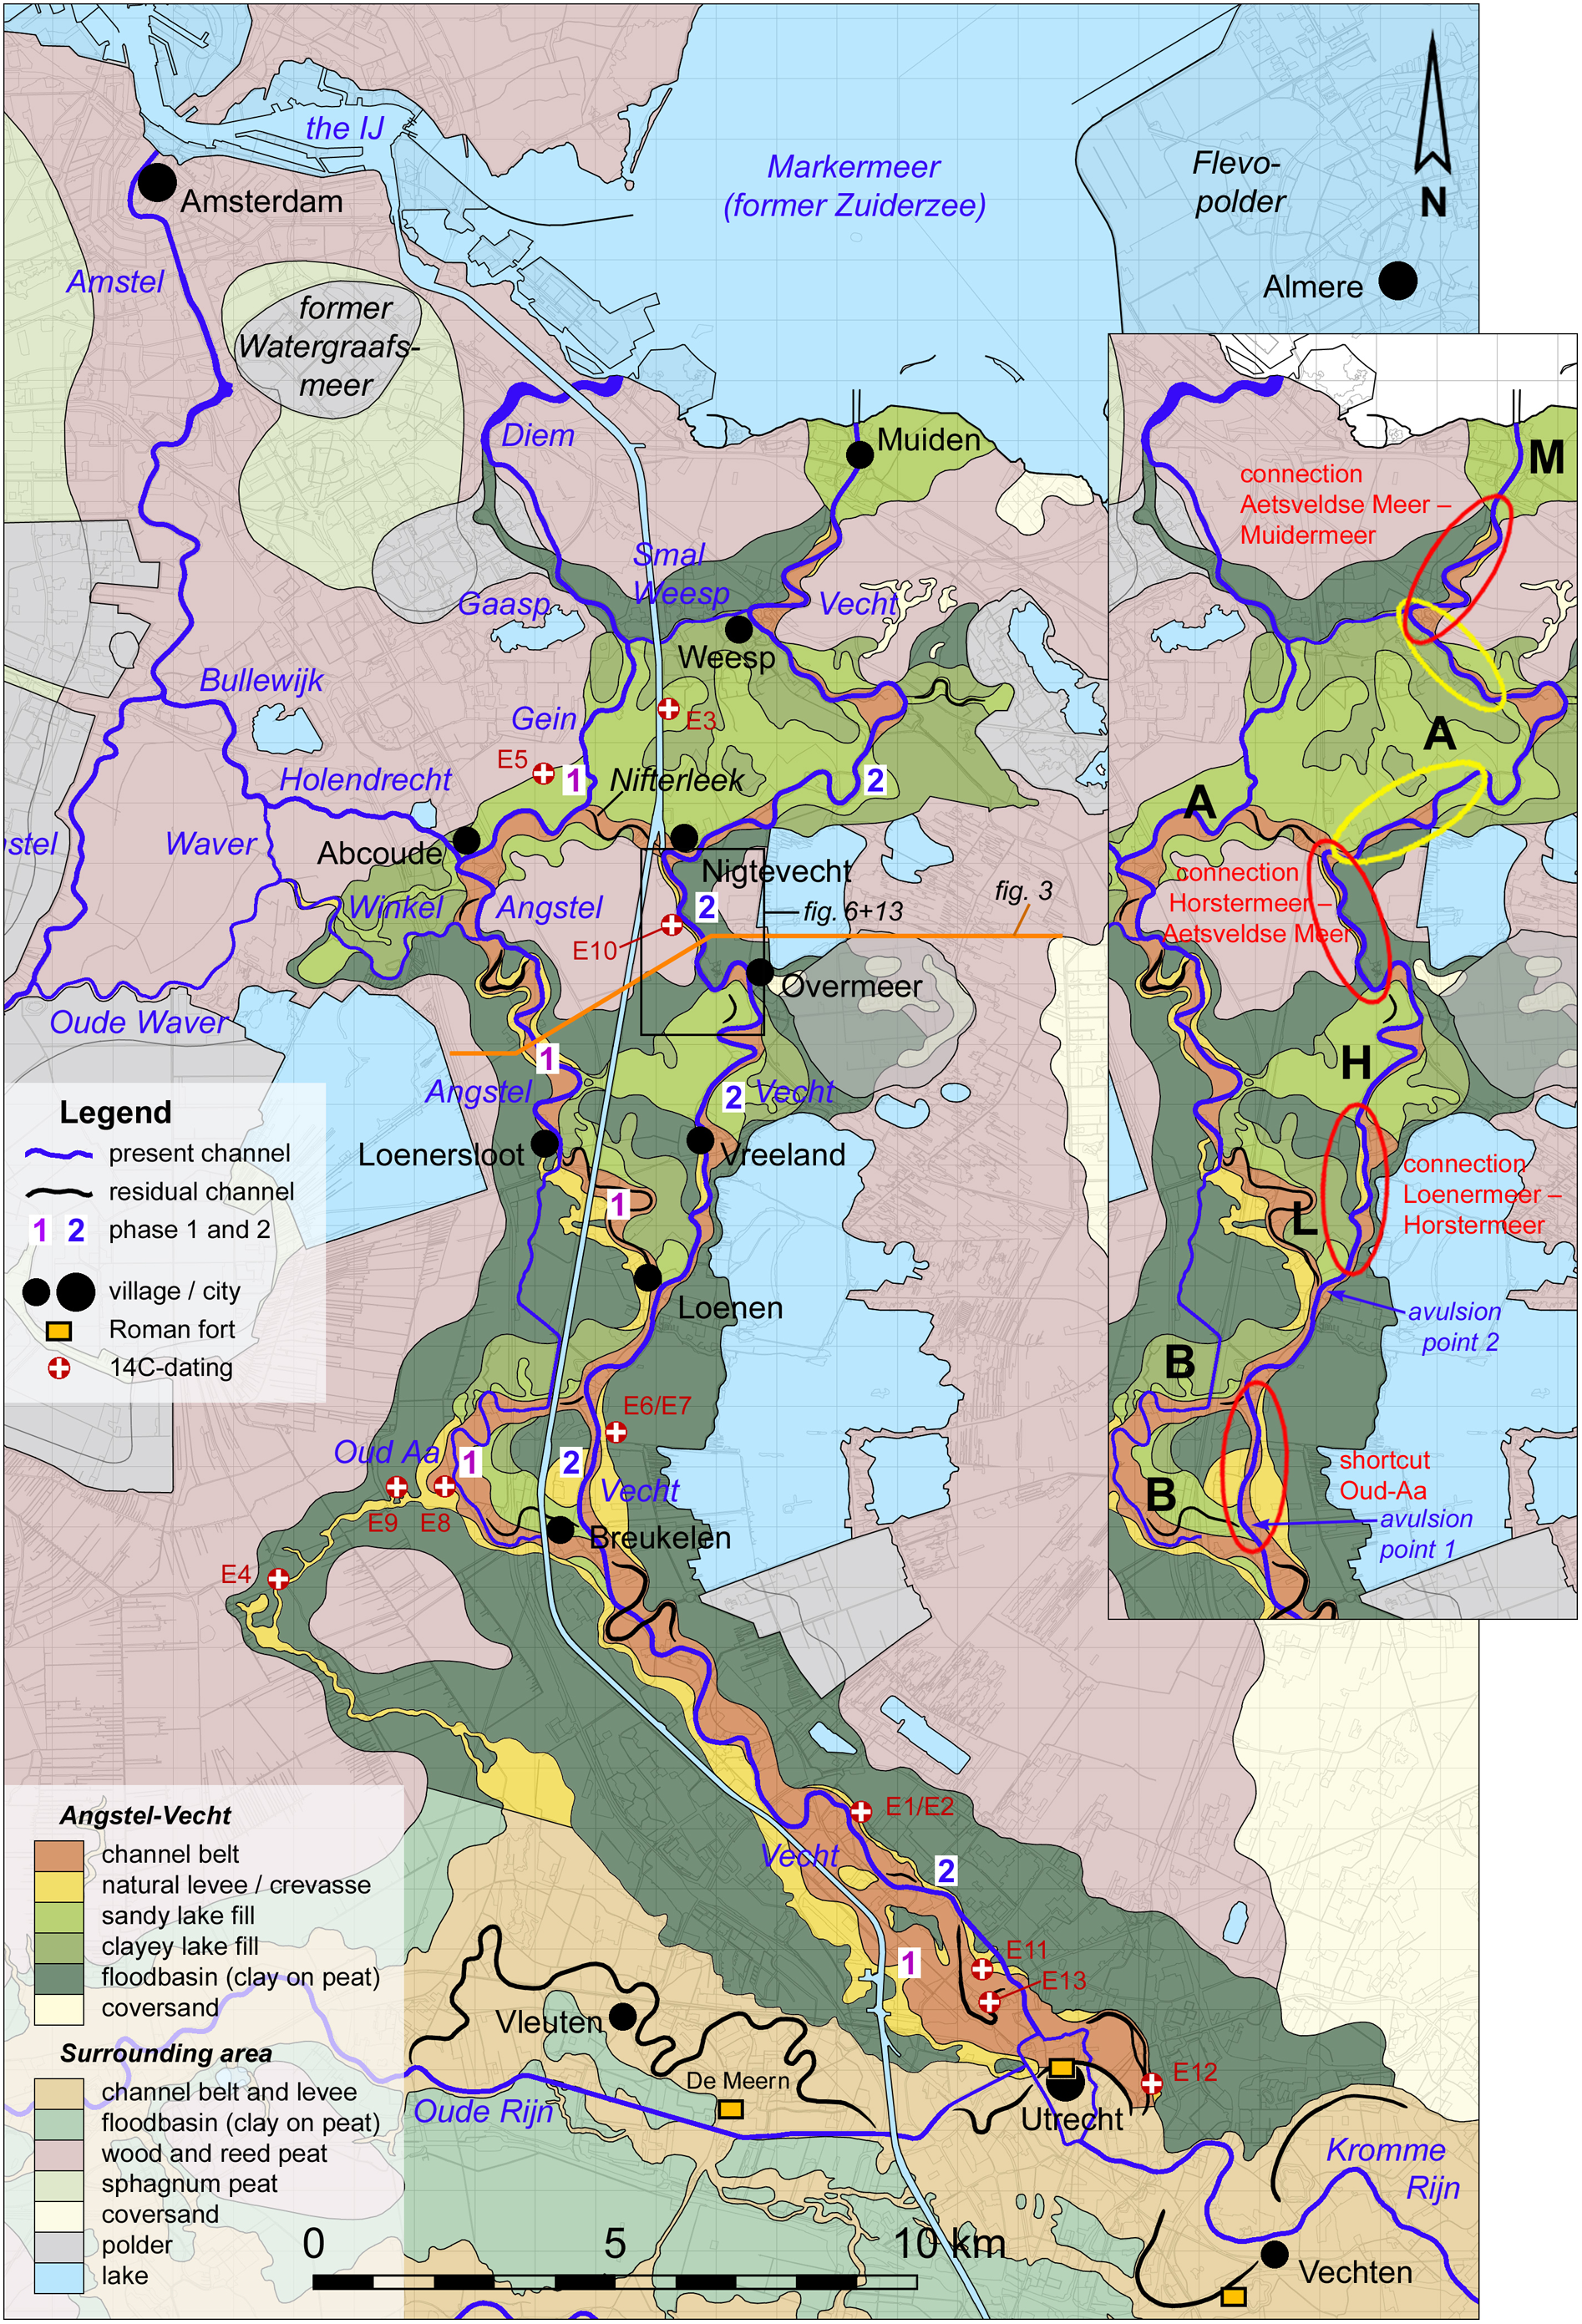
Overview of the Angstel and Vecht system, developed as an avulsion of the Rhine, as well as the peat rivers. Legenda: 1 = phase 1, discharge via Oud-Aa and Angstel; 2 = phase 2, discharge entirely via the present Vecht. The rectangle near Nigtevecht and Overmeer shows the study area (field research). The orange line shows the position of the cross-section of Fig. 3. Map inset: possibly artificial connections that have developed into river channels. Red ovals = connections between former peat-bounded lakes (sandy and clayey lake fills at B = Breukelense Meer, L = Loenermeer, H = Horstermeer, A = Aetsveldse Meer, M = Muidermeer). Yellow ovals = possibly constructed fairway (lane) or canal within the in late prehistory still water-bearing part of the Aetsveldse Meer. The two avulsion points conform Bos et al. (Reference Bos, Feiken, Bunnik and Schokker2009) are indicated in blue. Map background Angstel–Vecht: Bos et al. (Reference Bos, Feiken, Bunnik and Schokker2009, 359). Map of other areas: conforms to geomorphological map of the Netherlands and Van Dinter (Reference van Dinter2017).
The Vecht and its older sister branch, the Angstel, are part of the Rhine–Meuse delta, which in the Holocene has an extensive history of channel movements, with meander formation, cut offs and channel avulsions (Berendsen & Stouthamer, Reference Berendsen and Stouthamer2001). The Angstel–Vecht system is positioned at the edge of the active delta. The avulsion which created the Angstel (first phase of the Angstel and Vecht system; Fig. 4, nr. 1), occurred along the prehistoric Rhine near Vechten/Utrecht (Fig. 1), and is dated to c. 900–700 BC (Table 1, E1 and E2; Törnqvist, Reference Törnqvist1993, 149) and c. 1100–900 BC (Table 1, E4, E7 and E9; Bos et al., Reference Bos, Feiken, Bunnik and Schokker2009, 365). In the second phase, the water discharge had largely shifted to a new course, the Vecht. The onset of this phase has been dated 413–197 BC and 740–233 BC (Table 1, E6 and E10; Bos et al., Reference Bos, Feiken, Bunnik and Schokker2009, 368). These dates are TPQ (terminus post quem) dates, which leaves room for an onset up to some time later.
Results of the AMS 14C dating of samples from the bedload and channel-fill facies of the Vecht and from the top of the peat below the levee deposits. E-nrs. represent earlier published results (last column). N-nrs. show results of the current study. All laboratorium ages were recalibrated using the OxCal v4.4.4 calibration curve (Bronk Ramsey, Reference Bronk Ramsey2021).

At the bifurcation point of the Rhine and Angstel, the Angstel phase channels have been partly reworked by younger ones during the Roman period and Middle Ages or may be hidden beneath them (Van Dinter et al., Reference van Dinter, Cohen, Hoek, Stouthamer, Jansma and Middelkoop2017, Fig. 6). The Angstel channel created a connection with the northern coastal area, consisting of beach barriers, estuaries with tidal creeks and a coastal plain with a perimarine zone comprising an extensive peat vegetation. Before the avulsion, rainwater and groundwater flow from the ice-pushed ridge drained via local streams (like the Amstel, Holendrecht and Gein/Gaasp) into the Oer-IJ estuary and the central Netherlands area of lagoonal lakes. The new river channel annexed one of these local peat rivers, creating a connection with the Oer-IJ and the lagoonal lakes (Fig. 2). This area, the development of which has become better known by various studies, also received water from the Rhine from then onwards (Vos et al., Reference Vos, de Koning and van Eerden2015, 310; Kluiving & Borger, Reference Kluiving and Borger2015, 290; De Bont, Reference de Bont2015, 354; De Gans, Reference de Gans2015, 362; Kranendonk et al., Reference Kranendonk, Kluiving and Troelstra2015, 348ff).
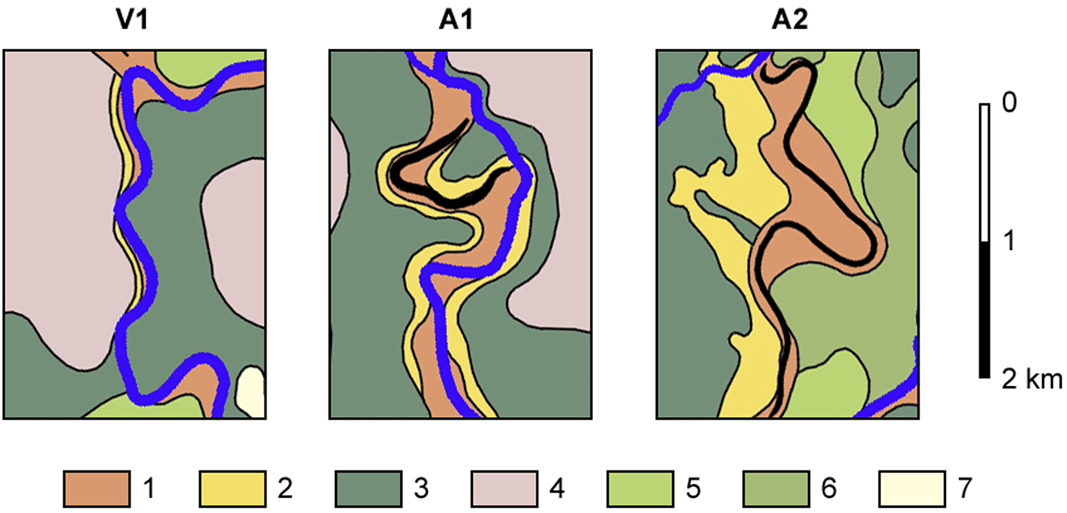
Three map images of local rivers in the Angstel–Vecht area (for comparison). V1 = section of the Vecht between Overmeer and Nigtevecht; A1 = section of the Angstel between Loenersloot and Abcoude; A2 = section of (a residual channel of) the Angstel between Loenen and Loenersloot in the former Loenermeer. For cross-sections of V1 and A1 see Fig. 3. Legend: 1 = river belt; 2 = natural levee deposits and crevasses (mostly on peat); 3 = flood basin deposits on peat; 4 = peat; 5 = sandy lake fills; 6 = clayey lake fills; 7 = coversands. Source: Bos et al. (Reference Bos, Feiken, Bunnik and Schokker2009, 359).
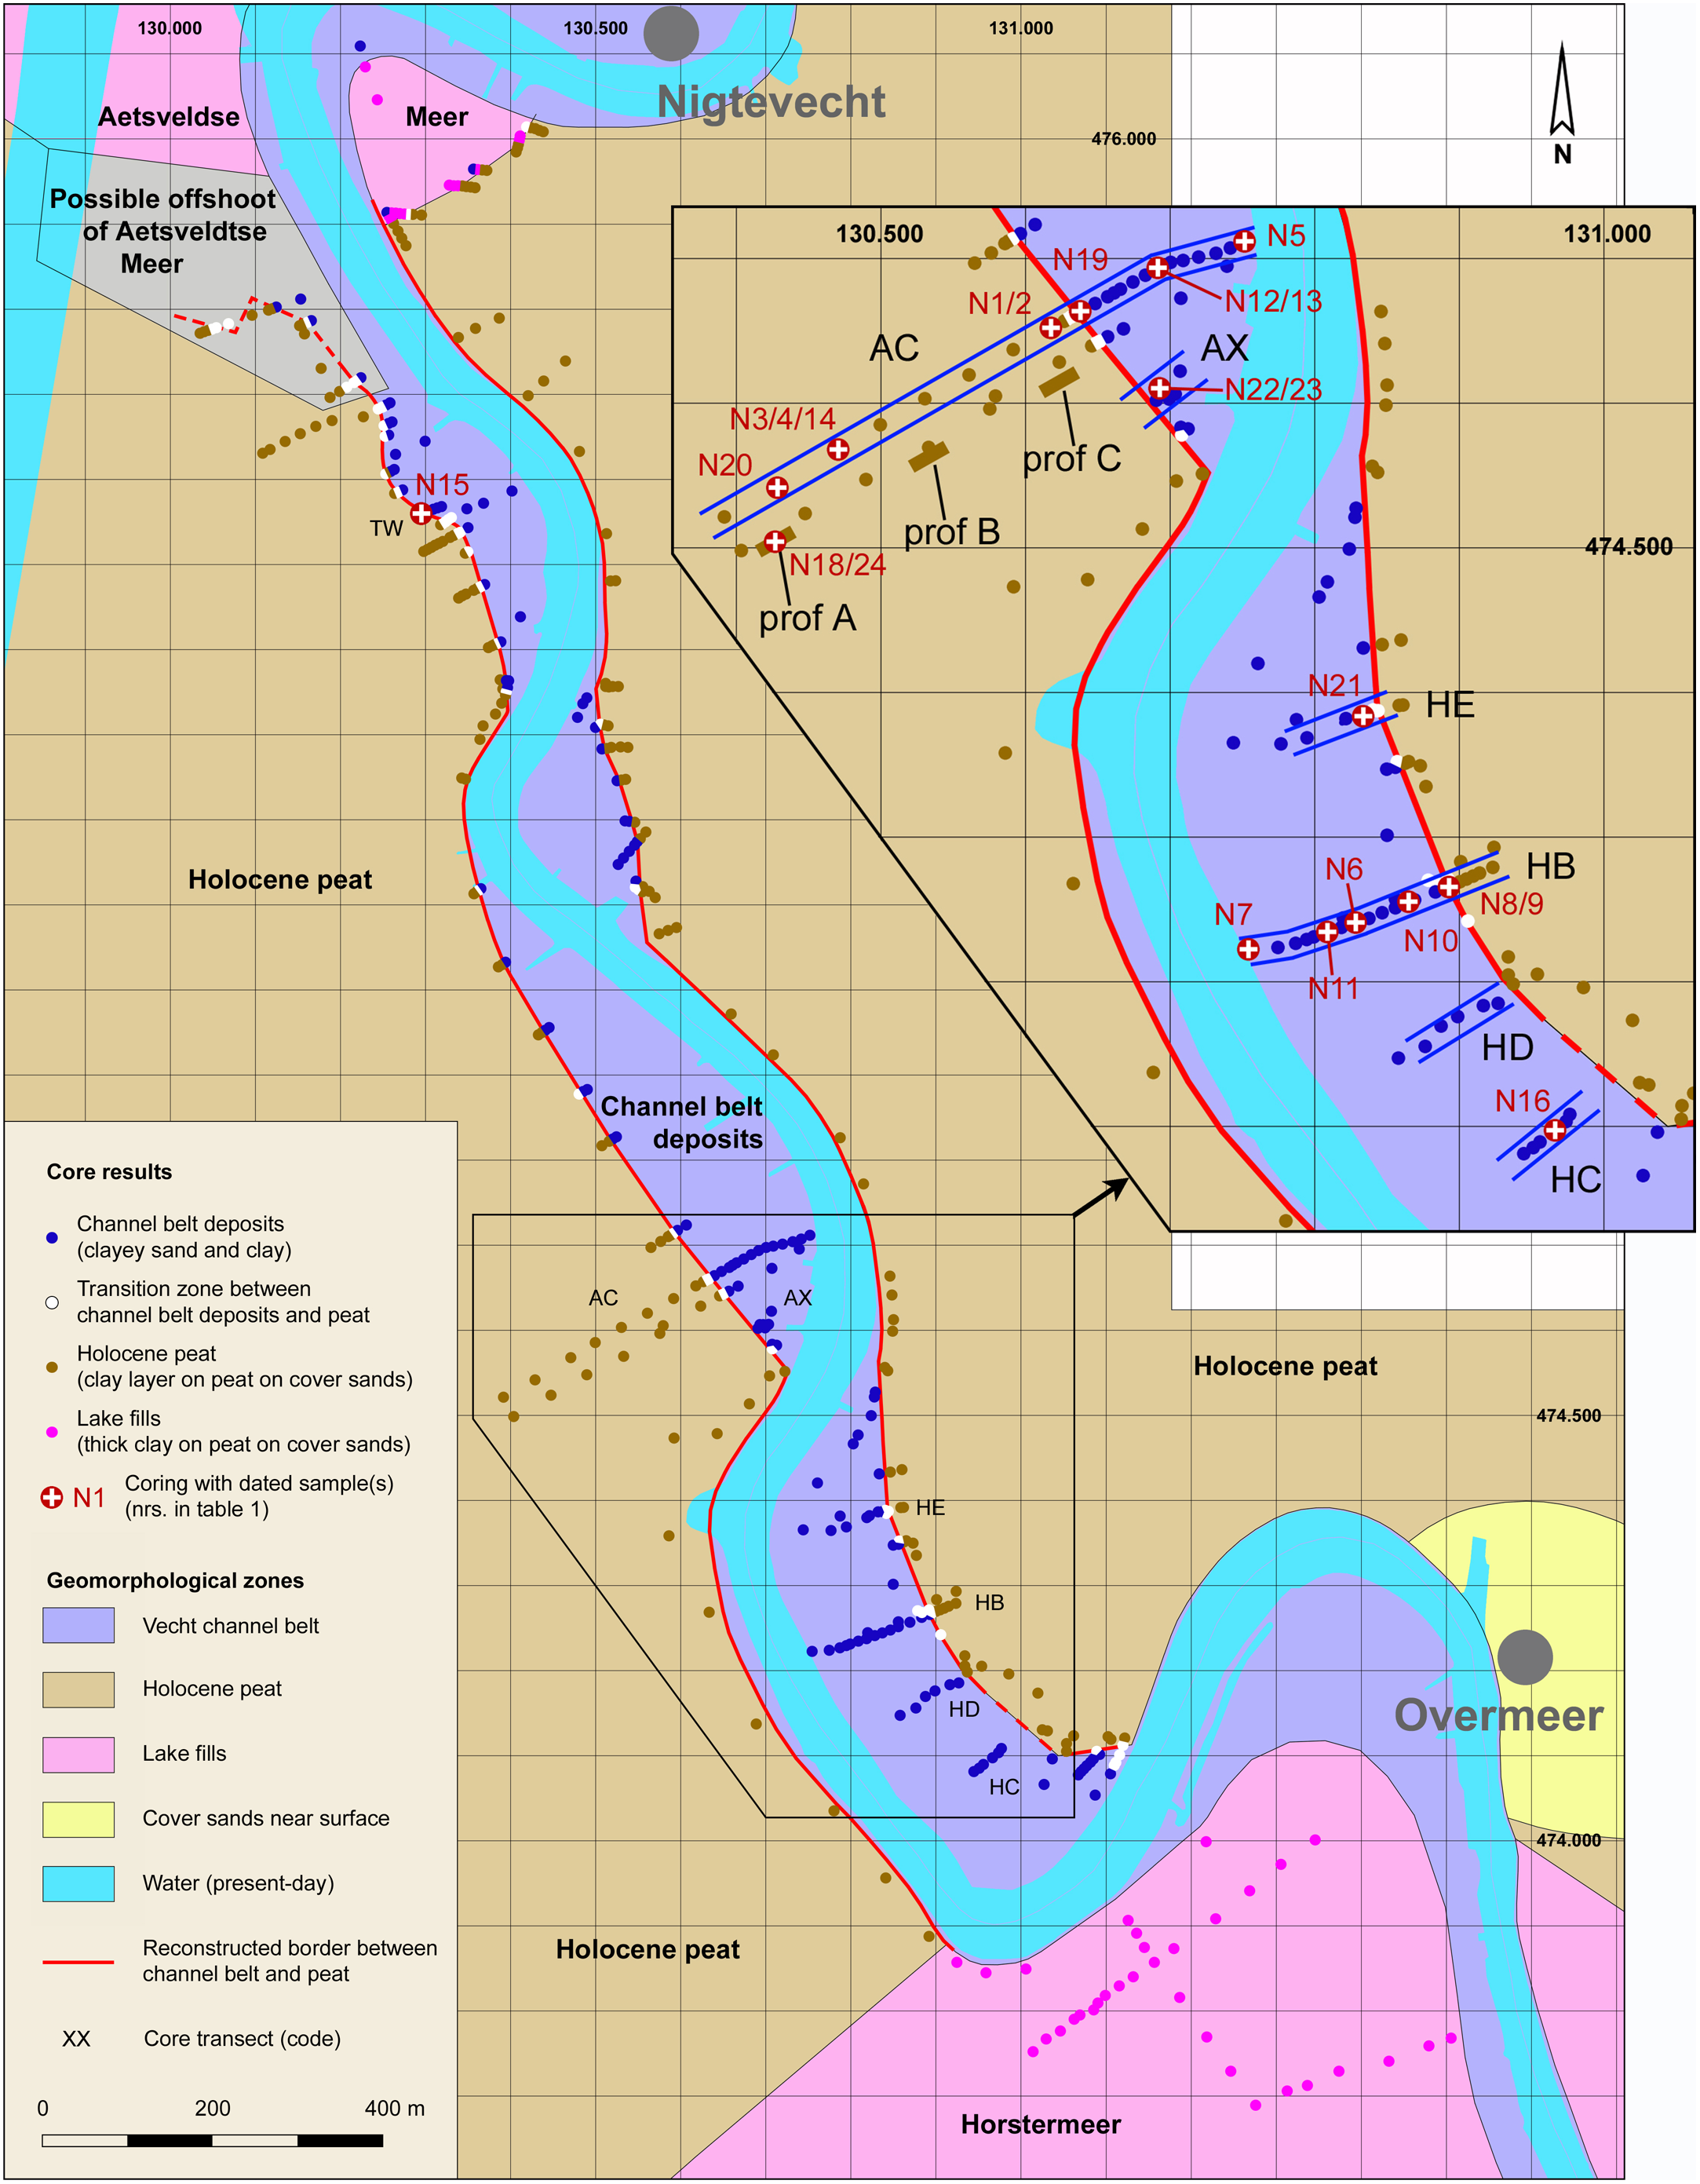
Geomorphology of the reach of the river Vecht between the former Horstermeer and Aetsveldse Meer. The red line is the established boundary between the channel belt deposits and the intact Holland peat. Map inset: auger core transects from which samples have been dated using the 14C method. Prof A to C are the test pits which were used to record stratigraphic profiles (see section 4.2.1).
Palaeogeographical reconstruction of the Oer-IJ estuary has shown that it evolved together with the Angstel and Vecht channel belt system (Vos, Reference Vos and Kok2008). Its emergence as a branch of the Rhine delta may have stimulated the development of the Oer-IJ by increased discharges, which may have enlarged the tidal inlet and main stream of the Oer-IJ (Vos et al., Reference Vos, de Koning and van Eerden2015, 319). After several centuries as a fully functioning channel belt, the discharge of the system decreased. Around 200 BC, this also may have contributed to the gradual closure of the mouth of the Oer-IJ (Bos et al., Reference Bos, Feiken, Bunnik and Schokker2009, 371), by which the natural drainage of the Oer-IJ was forced in the opposite direction and stalled in the Flevo Lake. The ponding water in the Flevo lake then began to drain northwards to the Wadden Sea; in turn, this may have initiated the opening of a connection between the northern part of the Flevo Lake and the Wadden Sea (Vos et al., Reference Vos, de Koning and van Eerden2015, 320; Van Popta et al., Reference van Popta, Cohen, Vos and Spek2020, 38).
Nevertheless, it is plausible that the Romans still managed to keep open a short navigable connection between the Oer-IJ and the sea (Borger & Kluiving, Reference Borger, Kluiving, Kluiving, Kootker and Hermans2017, 48). The construction of castellum Velsen 1, which had a large harbour with piers (Bosman, Reference Bosman and Gudea1999, Reference Bosman2016, 30), and then Velsen 2, built in the most important period of actions against the Chaucians operating at sea (Bosman et al., Reference Bosman, Bosman and de Weerd1998; Bosman, Reference Bosman2016, 69 ff.), make it plausible that there was such a connection between the castellum and the sea; however, it is theoretically possible that ships navigated from the castellum to the southern North Sea via the Vlie (Vos, Reference Vos2015, 327).
The Flevo Lake was positioned around the location of the current Markermeer and was called Flevum by the Romans (Pliny, Naturalis Historia IV, 29; Mela, De Chorographia III, 24). Around 755 AD it is mentioned as ‘Almere’ and ‘stagnum’, meaning that tidal currents had (still) little or no influence there at that time (Levison, Reference Levison1905; Rau, Reference Rau1968).
A notable phenomenon in the Angstel–Vecht–OerIJ–Flevum river area (Fig. 4) is formed by smaller peat-bounded lakes. Their establishment, dated to between 4700 and 3500 cal. yr. BP, has been related to seepage from the ice-pushed ridges and subsequent erosion of the peat by wind-generated waves (Bos et al., Reference Bos, Feiken, Bunnik and Schokker2009, 365 and 370). When the separating peatland was breached by flood waters, river channel and lake sections got connected and sedimentation was initiated, leading to gradual infilling of the lake with clastic materials (clays, sands) and eventual establishment of a traversing channel section (Bos, Reference Bos2010). The discharge of river water from the Rhine delta via this system no longer played a significant role after the damming of the Kromme Rijn near Wijk bij Duurstede (Fig. 1) in 1122 AD (Dekker, Reference Dekker1980), which has been confirmed by 14C dating (Van Dinter et al., Reference van Dinter, Cohen, Hoek, Stouthamer, Jansma and Middelkoop2017, 31).
The channels of the Angstel and Vecht stages of system development are two different ones over most of the study area. North of Breukelen they are rarely amalgamated, thereby allowing two phases in the system to be easily distinguished (Weerts et al., Reference Weerts, Cleveringa and Gouw2002, 67). South of Breukelen the two phases can be distinguished at a point only about 3 km northwest of the centre of Utrecht (Fig. 4; Van Dinter et al., Reference van Dinter, Cohen, Hoek, Stouthamer, Jansma and Middelkoop2017, appendix, 53). In the first phase (up from 1000/800 BC), the water flowed from Breukelen via the Oud-Aa (in the Breukelense Meer; ‘meer’ = lake) to the Loenermeer and then via the Angstel to the Aetsveldse Meer (1 in Fig. 4). As a result of the supply of sediment from the Rhine, the Breukelense Meer and the Loenermeer soon silted up (Bos et al., Reference Bos, Feiken, Bunnik and Schokker2009, 366). Sedimentation in the Aetsveldse Meer developed from the southwest (mouth of the Angstel) to the northeast (outlet at Weesp), forming a branched system of (constantly rejuvenating) crevasse splays in the deposits of the lake (Weerts et al., Reference Weerts, Cleveringa and Gouw2002, 69; Bos et al., Reference Bos, Feiken, Bunnik and Schokker2009, 368; Bos, Reference Bos2010, 5).
In the second phase, the main body of the water flowed via new tracts of channel near Breukelen and from Loenen through the Horstermeer and Aetsveldse Meer to Muiden, thus creating the present-day Vecht (2 in Fig. 4). Compared to the Angstel, this course is an alternative route between Utrecht and the Flevum/Oer-IJ receiving waterbodies. It has been established by a series of shortcuts between phase-1 channels and peat-bounded lakes (Lake Horstermeer, Aetsveldse Meer; Fig. 4). Bos et al. (Reference Bos, Feiken, Bunnik and Schokker2009, 368) mapped and dated two shortcuts and describe them as local avulsions that were naturally triggered. One avulsion originated at the east side of Breukelen, creating a bypass of the Oud-Aa around 413–197 BC (Table 1/Fig. 4, E6). The other avulsion originated near Loenen around 740–233 BC (Table 1/Fig. 4, E10). Note that these are TPQ dates. The two local avulsions need not have occurred simultaneously (Bos et al., Reference Bos, Feiken, Bunnik and Schokker2009, 368). A TAQ dating result is known from the silting-up Angstel near Breukelen (12–327 AD; Table 1/Fig. 4, E8).
Transect profile AC illustrating core stratigraphy and 14C dated sample results (calibrated at 2 sigma). Hpd = the partially degraded top of the Holocene peat (see also discussion in section 5.1).

Transect profile HB with core stratigraphy and 14C dated sample results (calibrated at 2 sigma). On the right-hand side, the peat has been extracted to a depth of more than 2 meters below ground level, after which the pit has been filled with clay. For legend see Fig. 7.

a: Annotated photo of wall profile of test pit B. b: column image of the three profile recordings of test pits A, B and C with two dated samples (calibrated at 2 sigma) in profile A (for locations of test pits see Fig. 6). c: column image of cores 292 and 293 (in transect AC, see Fig. 7) with four dated samples. Three lithological units are distinguished, from bottom to top: peat, humic clay (= degraded peat) and clay. The thickness of the layer of degraded peat is indicated in red. Groundwater table near the test pits is 2.15 m below sea level. For lithographical legends, see Fig. 7. For data of sample nrs. see Table 1.

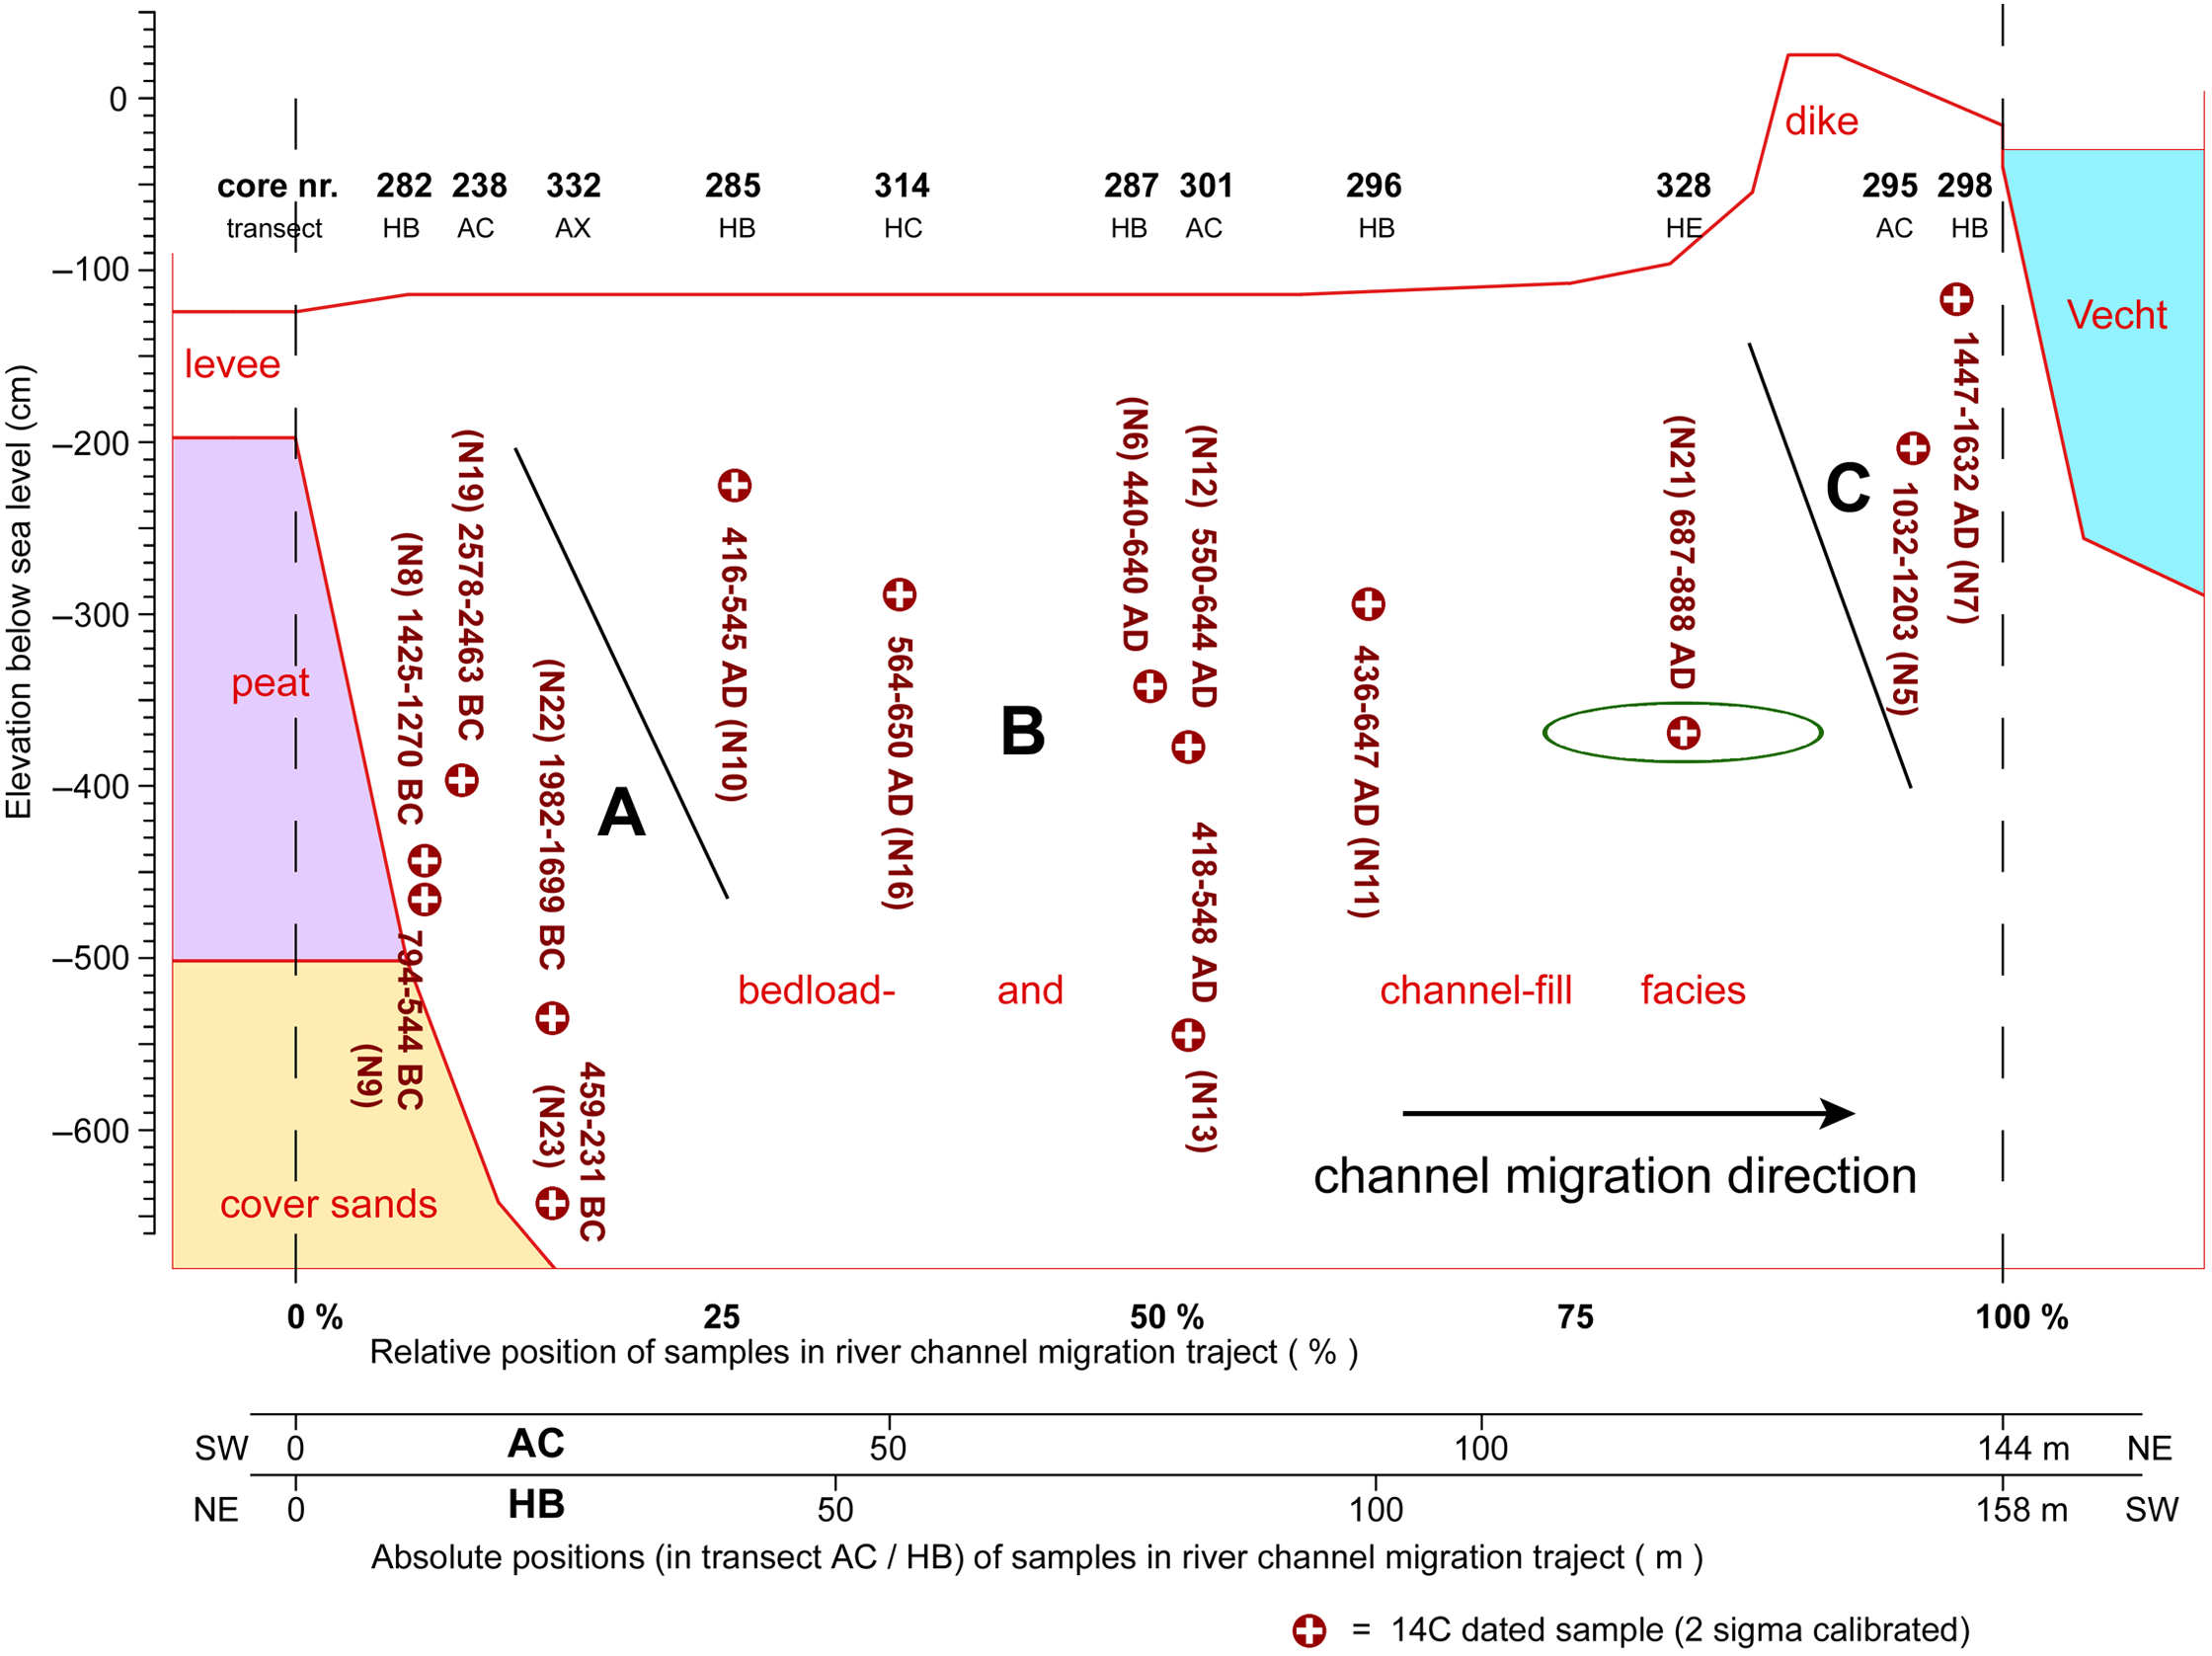
Schematic cross-section, showing transversal migration course of the river Vecht in its reach between the former Horstermeer and Aetsveldse Meer. In the trajectory, we distinguish between chronostratigraphical units A, B and C. The trajectory of the transects AC and HB from the red coloured peat border (Fig. 6) up to the current river course has been presented in percentages and combined, with date(s) being displayed in its procentual position. The highest point of the boundary between intact peat and channel fill is taken as zero. The boundary between land and water at the river Vecht is taken as a 100%.
2.3. Choice of study location and approach
Using the geomorphology (Section 2.2) as a basis, we refocus on the Drusus Canal hypothesis option R1. In the light of the mention of the Canal(s) of Drusus in the classical literature, the aim of our study is to identify potential canal subsections present in the Vecht branch. Among the shortcuts in the area of the peat-bounded lakes (see Fig. 4, inset), the 2-km long one between Overmeer and Nigtevecht (H-A) has the narrowest channel belt width, no recognisable meander cut-offs and the most linear planform. On the onset of this Vecht river reach, we distinguish two possibilities: (a) this section began its life as a canal dug in the time of Drusus (12–9 BC); (b) this section had a natural origin, probably at an earlier moment in the last few centuries BC, conform the TPQ dates of Bos et al. (Reference Bos, Feiken, Bunnik and Schokker2009, 368). However, the amount of dating available at present in this area is still limited and in need of further research. Because the Vecht onset mainly can be determined by dating the top of the peat immediately below the natural levee deposits, also the possibility of degradation of the top of the peat has to be taken into account, which was a relevant factor in some earlier studies in similar areas (Makaske et al., Reference Makaske, Maas and van Smeerdijk2008; Stouthamer et al., Reference Stouthamer, Berendsen, Peeters and Bouman2008; Pierik et al., Reference Pierik, Stouthamer, Schuring and Cohen2018, Fig. 4C). Usually, the degradation is the result of the oxidation of organic materials, but sometimes anaerobic bacteria can also cause decomposition (Hoogland et al., Reference Hoogland, Roelandse, de La Loma González, Waterloo, Mooij, Verhagen and Velstra2020, 750). The degradation can have various causes, such as events immediately preceding the covering by the clay, (Roman) canal digging and resulting drainage, medieval peatland reclamation with the digging of ditches and lowering of groundwater levels prior to modern agriculture.
The possibility of human intervention along the course of the river in the Angstel–Vecht system has already been put forward without reaching conclusions (Section 2.1). A possible method of canal construction is that the Romans created a more easterly route by connecting several peat-bounded lakes, partially filled with clastic materials (Fig. 4, inset, connections depicted as red ovals). Locally, it is possible that crevasse splays were already active, but which had not developed into complete avulsions and which were used by the Romans in their canal construction. This leads us to hypothesise that the relatively younger short-cut channels between a number of peat lakes in the Angstel–Vecht system downstream of Breukelen are the result of human intervention by the Romans who dug one or more canals, which subsequently evolved into a river channel.
The Vecht section between Overmeer (exit Horstermeer) and Nigtevecht (entry Aetsveldse Meer) shows a striking planform (Fig. 4, H-A), which despite the meander loops, creates the impression of a relatively straight landform (Fig. 5, V1). The channel belt profile of this 2 km long river section is particularly narrow (Fig. 3), with a short lateral migration path of the meander loops (Bos et al., Reference Bos, Feiken, Bunnik and Schokker2009). It has a channel belt width of approximately 150 m, in contrast to the profiles elsewhere in the Angstel–Vecht system (Fig. 5, A1 and A2) which show widths ranging from 250 to 1100 m.
Based on these considerations, it was decided to carry out field research on the reach of the Vecht between Overmeer and Nigtevecht (= study area). To test our working hypothesis, we used two approaches. The first approach focused on the geomorphology and sedimentology and the need to understand the detailed morphology and sediment architecture of the selected reach of the Vecht. The second approach was focused on obtaining a more detailed chronology. There are three points of entry to investigate this. The first is that from the moment of (possible) canal construction, this structure starts to show river behaviour and begins to migrate laterally. The timing of the initial phase of migration should be around the moment of construction/origination or some time after that. The second point is that from the commencement of the phase 2 Vecht river, its banks which generally consist of a peat sequence, are covered by clay sediments creating natural levees and in response to this the peat growth can end. The third point is that (after some time) settlements can develop on the natural levees along the river. The oldest phase of site habitation provides a TAQ (terminus ante quem) date for the emergence of phase 2.
3. Methods
The programme of coring resulted in lithological profiles along 62 short transects (Fig. 6). Once the boundary between intact peat and the channel deposits had been sufficiently mapped out, the most suitable locations were determined for coring along two longer and four medium length transects, in order to investigate the chronology of meander migration. The main transects (AC and HB) were positioned at places where it was estimated that the erosion boundary (Fig. 6, red line) could date from relatively shortly after the assumed canal construction. Coring to date the top of the peat was carried out in the parts of the long transects which lay within the zone of the preserved peat. In total, the combined coring studies led to the drilling of 439 hand-auger cores between November 2015 and October 2018.
Coring was performed using a 7-cm Edelman hand auger (screw-type) and a 3-cm gouge auger. The cores generally reached depths of between 4 and 5 m below ground level, while the distance between individual cores along the transects varied between 5 and 25 m. Along longer transects, a mutual distance between successive cores of 10 m was maintained across the channel fill, whilst in the surrounding peat areas a minimum distance of 50 m was used. The spatial coordinates of the drill holes were recorded using a hand-held GPS (Garmin eTrex Vista HCx), with a spatial deviation of about 3 m. Core descriptions were recorded in the Deborah program (release 3), developed by RAAP Archaeological Consultancy, the Netherlands (www.raap.nl).
In order to gain a better insight into the stratigraphy of sediments and possible disturbance by anthropogenic activities such as ploughing, profile descriptions were recorded in small test pits, each 1 m deep at three localities (Fig. 6). Profile descriptions were harmonised with the core descriptions recorded in Deborah. Samples for dating were taken here by hammering-in steel boxes.
Field description of the core lithologies is based on the NEN 5104 method (Nederlands Normalisatie-instituut, Reference Normalisatie-instituut1989), which distinguishes: depth, colour, texture, CaCO3 content, sedimentary structures, the presence of inclusions (organic matter, shells, gravel, anthropogenic materials) and oxidation/reduction phenomena. Grain size of sand was determined with a field reference. Calcium content was determined on all samples using a 10% HCl solution.
In total, 415 sediment samples with the potential to contain organic material suitable for 14C dating were taken during fieldwork. Presence of older organic material, which may have been redeposited, is referred to as reworked. In the case of a watercourse like the Vecht, migrating within an existing peat area, the possibility of recycling of organic materials must be taken into account. Only primary organic material is suitable for dating (referred to as local). Identifying whether organic materials were local or reworked was performed through palaeobotanical analysis by BIAX (Zaanstad, the Netherlands) prior to 14C dating, with the aim of selecting as far as possible only primary remains (i.e. locally grown). The most suitable samples for 14C dating were selected as described in supplementary appendix A (available online appendix in Supplementary material), while the results of the selection steps of all samples are presented in supplementary appendix B (available online appendix in Supplementary material). After analysis of the 415 samples taken, organic remains were selected from 24 samples for dating. The 14C radiocarbon dating was undertaken using Accelerator Mass Spectrometry Analysis (AMS) and performed by Beta Analytic Inc. (Miami, Florida). To avoid deviations in dating results, samples were pre-treated to remove calcium carbonate and mobile humic acids. All radiocarbon ages reported in this paper, both our own results and the results of others described earlier, were recalibrated in 2021 using the OxCal v4.4.4 calibration curve (Bronk Ramsey, Reference Bronk Ramsey2021). Recalibrated ages are presented at 1 and 2 sigma probability in Table 1. Ages mentioned in text are all presented at 2 sigma probability.
In order to get an insight into the presence and ages of settlements on the natural levees of the Angstel–Vecht system and possible earlier human activities in the peatland, an inventory of archaeological finds and sites has been compiled for the three periods of prehistory and the Roman Age. Since the start of the Roman period is the crucial time boundary for our working hypothesis, an inventory of medieval and younger finds was not considered useful for this research. The method and table of results of this inventory can be found in supplementary appendix C (available online appendix in Supplementary material).
4. Results
4.1. Substrate
This section describes the detailed mapping of the researched area using core transects depicted in Fig. 6. Results show core positions through the intact peat, channel belt and infilled peat lakes. Transects AC and HB show the stratigraphy and the results of 14C dating (Figs. 7 and 8). Four lithological units are recognised:
*Cover sand : Moderately silty, moderately fine to extremely fine non-calcareous sand. At the transition with the overlying peat, the sand is moderately humic.
*Coastal plain margin peat : Sequence of Holocene wood peat, 2–5 m below sea level. It has a low mineral content at the bottom and is clayey in its upper part. At the top, directly under the clay of the natural levee deposits, a sub-unit Hpd (= Holocene peat degraded) is distinguished (Fig. 7). This unit has a varying composition of layers of clayey peat, peaty clay and humic clay, which can be seen as more or less decomposed peat. The profiles of the test pits revealed a clear unit structure and undisturbed stratigraphy (Figs. 6, 9A/B). The implication of this is that unit Hpd is not the result of mechanical disturbance by anthropogenic activities up from medieval land reclamation, such as deforestation, ploughing and digging of ditches. The latter are easily recognisable when being present. The recognition of unit Hpd is also based on the dating results and therefore it is described further in Section 4.2.1. Locally, the upper part of the peat has been removed by extraction and has been replaced by clay, which contains small fragments of brick/rubble, probably post-medieval in date (Fig. 8, NE part). This latter unit is considered artificial.
*Natural levee deposits : Strongly silty to moderately sandy (at the top), poorly to moderately humic clay, overlying the peat sequence.
*Bedload and channel belt deposits : Frequently alternating sand and clay layers. The sand layers consist of moderately to strongly silty moderately fine to very fine sand, interpreted as reworked cover sand, redeposited during periods of high fluvial activity. The clay layers of strongly silty to strongly sandy clay, generally inorganic, locally poorly humic with fine plant remains, provide evidence of low energy water conditions. Thin sub-layers are frequently present, which means that a sand layer may include many thin clay layers or vice versa. Locally, a thin peat layer is also present. The underlying layer of primary cover sand is hard to distinguish from the redeposited sands.
The Vecht channel belt in the research area could be identified by a unit of sand/clay layers of several metre thick (Fig. 6, blue dots), hence by the absence of peat in the core (with core depths of 4–5 m below surface). Further away from the channel belt, the top of the intact peat was reached at depths of 0.4–0.8 m below the surface (Fig. 6, brown dots). At the border of these two terrain units, the (remaining) top of the peat was identified from 0.9 to 5.2 m below the surface (Fig. 6, white dots). The distinction between these border situations and the filling of the former peat-bounded lakes was based on an analysis of the elevation of the top of the remaining peat in the multiple cores (n = 432; supplementary appendix D (available online appendix in Supplementary material)). In the former lakes, the lower part of the peat sequence has remained intact (confirming descriptions by Bos et al., Reference Bos, Feiken, Bunnik and Schokker2009).
Only primary meanders are present, that is, the active channel has gradually migrated to its current position and no abandoned meander remains are found. The channel belt shows a relatively straight boundary on the opposite side of each curved boundary which represents a primary meander (Fig. 6). Assuming later meander migration in the activity of the channel belt, these relatively straight edges are interpreted as the oldest sides of the meander belt and the zones to target for investigations whether the channel had a natural (avulsion through peat) or human dug (Drusus canal) origin.
The western boundary near transect AC (Fig. 6) is relatively straight, but on closer inspection not perfectly straight. It has a slightly curved shape, potentially the result of a migration to the left (west) in an initial short period. By the longitudinal component of the river migration, this meander loop has moved about 500 m to the northwest, thus causing this bank to be eroded (approximately in the middle of Fig. 6). The longitudinal migration component was stronger than the transverse component. The latter might be caused by the high erosion resistance of the peat, which can cause sharp bends and straight channels in peatlands (Candel, Reference Candel2020, ch. 6.4).
4.2. Radiocarbon dating results
After analysis of the 415 samples taken, organic remains were selected from 24 of them for 14C dating. Dating results are presented which help to determine the end of peat growth and periods of meander migration. The overview of the results is shown in Table 1, including the results of previous studies described in this paper.
4.2.1. End of the peat growth by burial beneath bank sediments
Beyond the Vecht channel belt fills the Holocene peat is present, which has a degraded upper profile (Section 4.1, unit Hpd). On top of the peat in profile B, a 20-cm thick layer of relatively dark humic clay was observed (Fig. 9A). Botanical analysis of this layer yielded some unidentifiable wood fragments, but otherwise no recognisable organic remains. The top of the peat was dated to 818–760 BC (Table 1, sample N18) and to 902–803 BC (Table 1, sample N20). A younger age of 356–57 BC was obtained for sample N14 (Table 1). At these three locations (see Fig. 6), the top of the peat was covered by a dark humic clay layer with a thickness of 21, 19 and 8 cm, respectively (Fig. 9). Therefore it appears that a greater thickness of the layer of humic clay corresponds to an older age of the top of the remaining, underlying peat.
Therefore, the layer of relatively dark humic clay on top of the preserved peat (Fig. 9A) should be interpreted as a former layer of clayey peat, in which plant materials have been completely mineralised, so that only the enclosed clay remains. The same applies to the dark layer of humic clay above the peat in cores 292 and 293. The various dating results show that the degradation of (the top of) the peat has progressed further in the test pits than in core 292. This can be explained by the location of the test pits close to a drainage ditch with slightly lowered water levels, so that the degrading effect is apparently greater than in transect AC, which was located about 30 m away from the ditch. Core 292 also shows some peaty clay layers between the preserved peat layers, that will have been present prior to peat degradation.
It can be deduced that there was continuous peat growth at least until 800/900 BC (Fig. 9B, profile A, N18; Fig. 9C, core 293, N20). The clay influx in the top of the peat as well as the dark humic clay layer covering it, are interpreted as overbank/floodbasin deposits of the river Angstel. This sediment was deposited on top of the peat, after the Angstel was formed around 900 BC. Our ages for Angstel onset confirm earlier dates in similar contexts (Törnqvist, Reference Törnqvist1993, 149; Bos et al., Reference Bos, Feiken, Bunnik and Schokker2009, 366, 368), while the dating results are closest to those of Törnqvist (see Fig. 12).
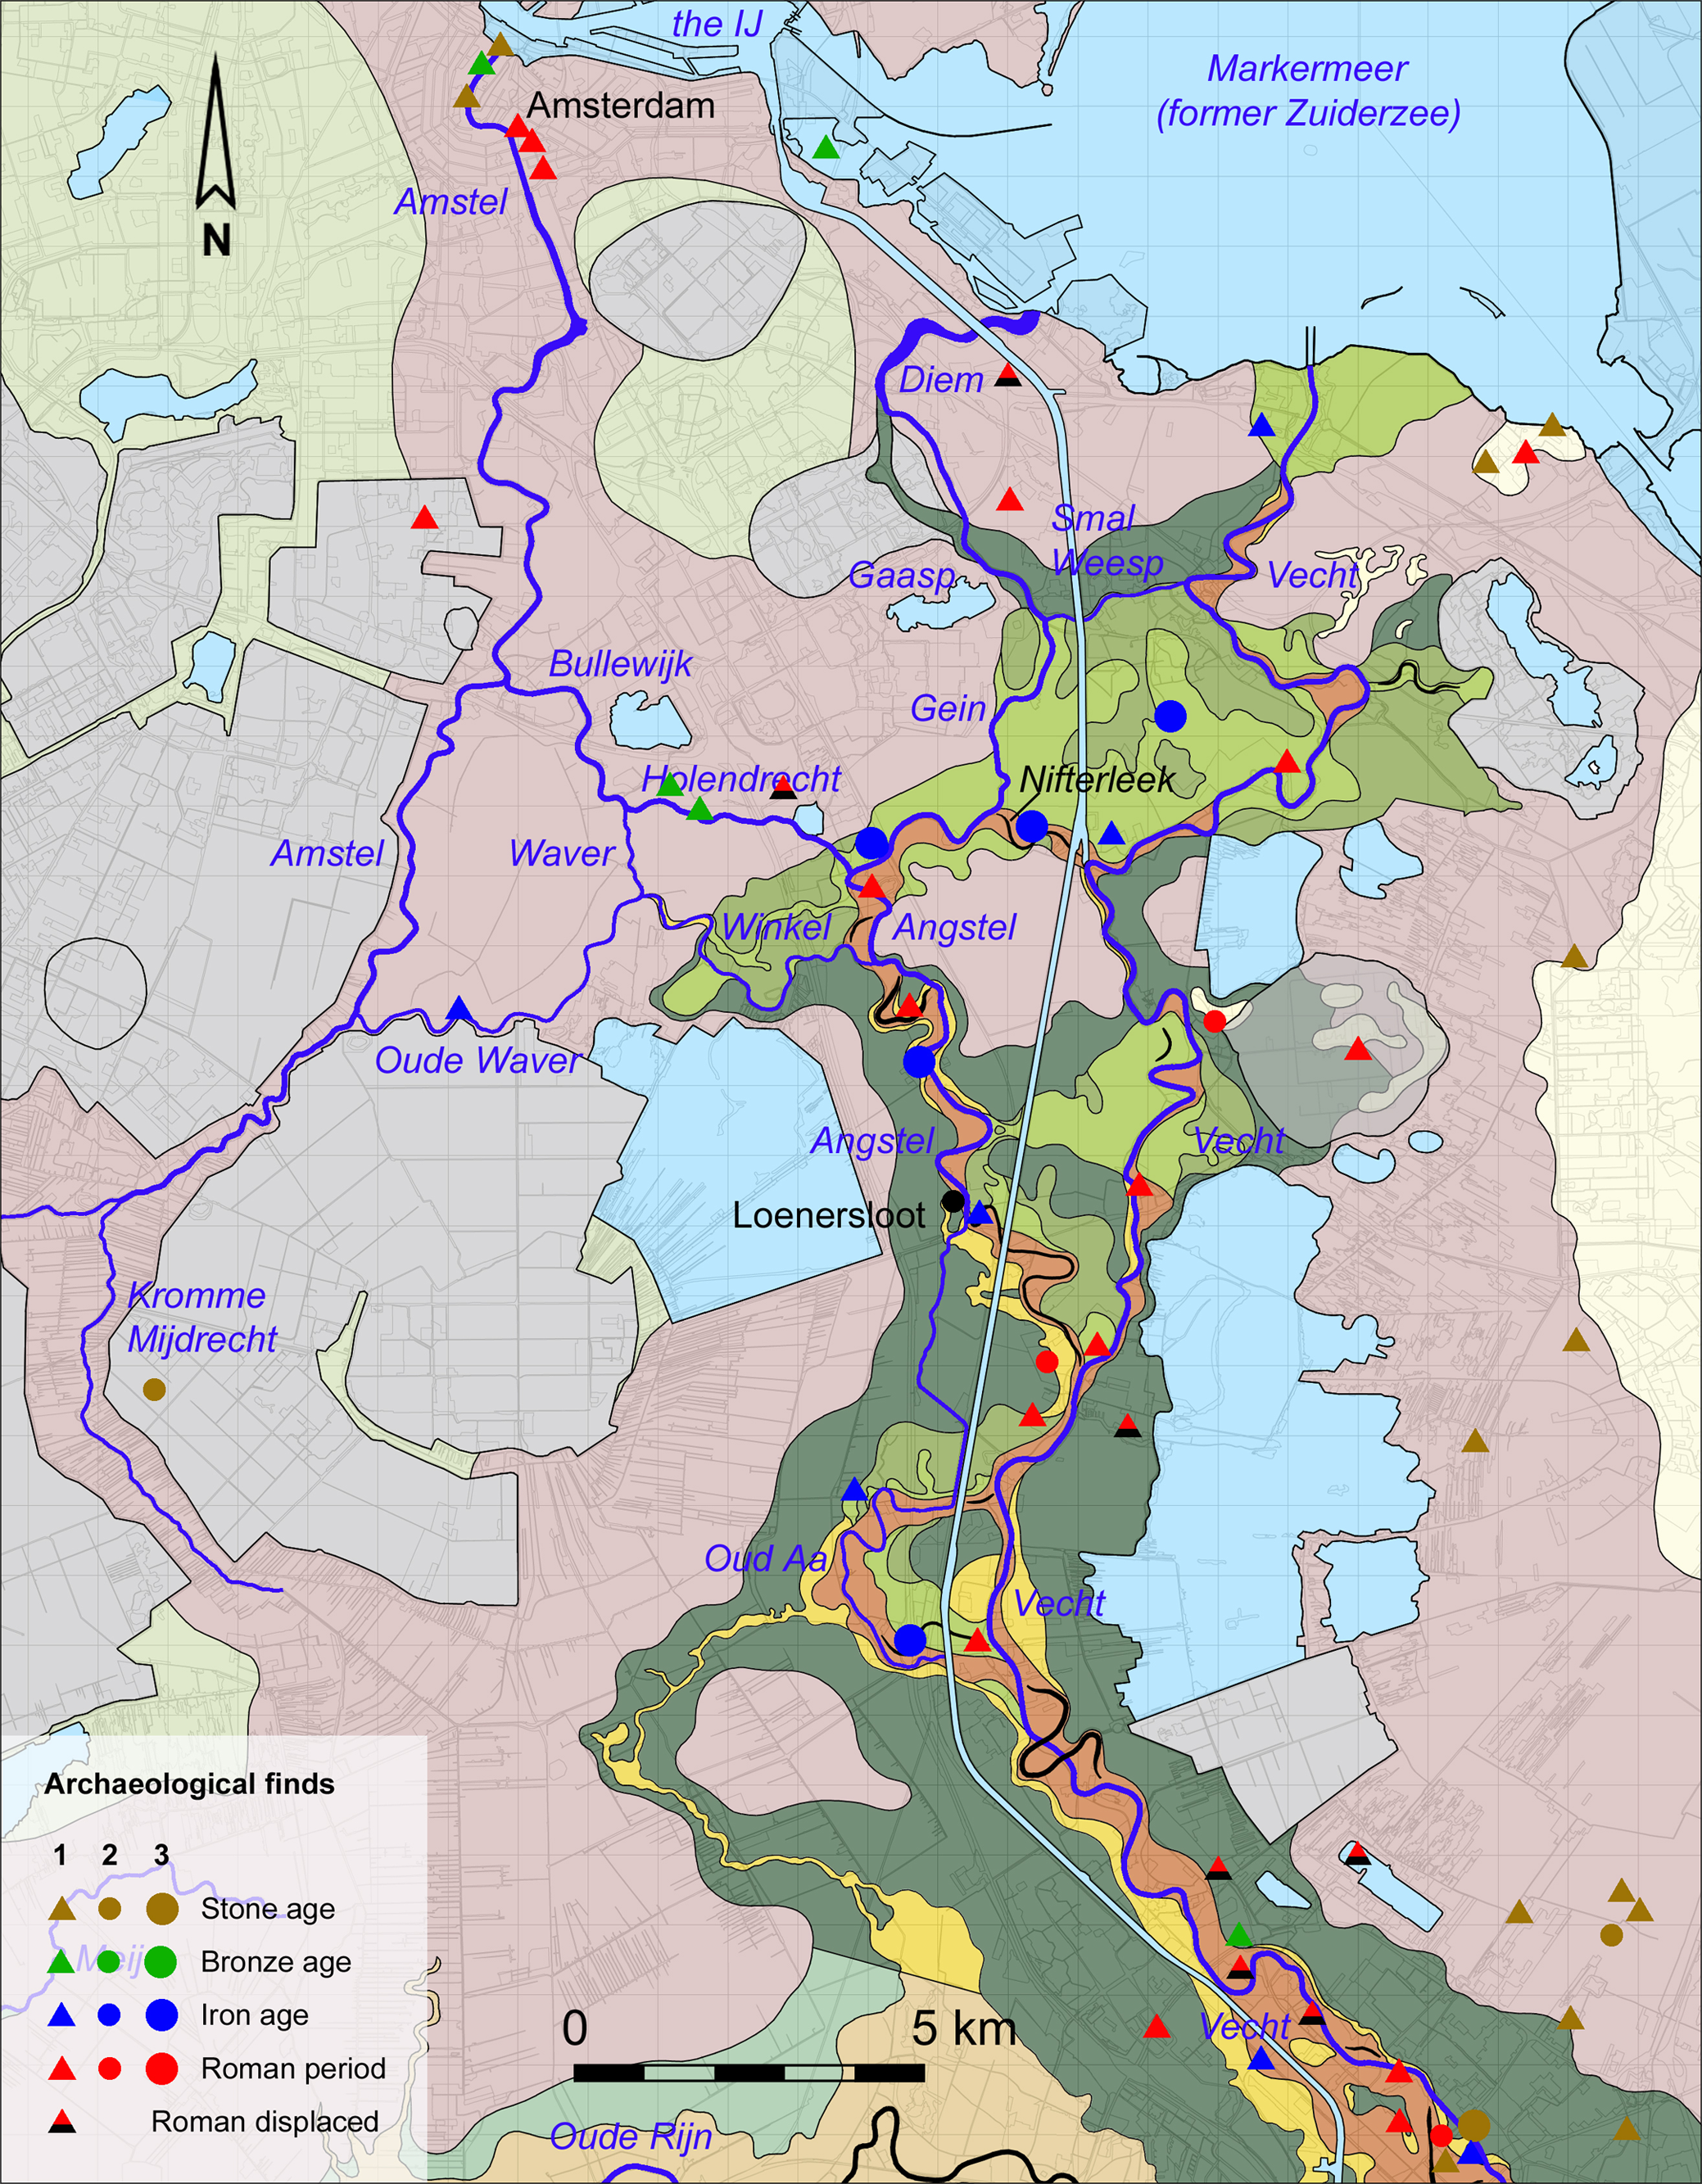
Overview of archaeological sites in the Angstel and Vecht system. All find locations within the range of this map are listed, with the exception of the Oude Rijn channel belt in the far south of the map. 1 = isolated find; 2 = possible settlement (up to 10 finds); 3 = settlement (10 or more finds). Red triangles with a black base refer to finds that were presumably brought in from elsewhere during civil works. For legends of geomorphological zones see Fig. 4. Map background Angstel–Vecht: Bos et al. (Reference Bos, Feiken, Bunnik and Schokker2009, 359). Map of other areas: conforms to geomorphological map of the Netherlands and Van Dinter (Reference van Dinter2017).
Ages of the most relevant geomorphological, historical and archaeological events in the Angstel–Vecht area. Legend: 1 = calibrated 14C age of earlier results, with 1 and 2 sigma probability; 2 = idem, results of this study; 3 = time period composed of several ages; 4 = habitation period, based on archaeological data (sources: supplementary Appendix C and Bos et al. Reference Bos, Feiken, Bunnik and Schokker2009, 370); 5 = historical event, mentioned in text. All radiocarbon ages mentioned in this study were recalibrated using the OxCal v4.4.4 calibration curve (Bronk Ramsey, Reference Bronk Ramsey2021).

In the study area, about 3 km away from the Angstel, sedimentation was limited and peat growth did not stop completely, confirmed by the three dates on peat between 800 and 100 BC obtained from core 292 (Fig. 7 and 9C). Here the dating results show that the top of the peat remained partly intact. An exception to this is the layer that was noted as clayey peat, of which botanical analysis revealed that it contained abundant wood fragments (core 235, N1; Figs. 6 and 7). This sample was 14C dated to 239–327 AD. Given its spatial context, this sample is interpreted as a riparian phenomenon, possibly floating woody material deposited on the bank of the river. The main picture from dating results is that a clay influx occurs up from around 900 BC (in line with earlier studies) and that peat growth continues at least until second century BC, but potentially longer because our dates are TPQ dates.
4.2.2. Migration period of the meanders
The coherent trends in radiocarbon dates in each of the main transects of the investigated reach of the Vecht reveals the direction and chronology of migration: in transect AC the migration took place from southwest to northeast (Fig. 7) and in transect HB from northeast to southwest (Fig. 8). Dates from the smaller transects (AX, HC and HE) fit into this reconstruction. This indicates that the river channel along the full length of the studied reach had a broadly synchronous single main phase of migration (Fig. 10) and that all successive phases of meander migration were broadly similar. This is supportive of the idea of a channel that began life as a linear axis, and developed meanders later. The bedload and channel fill deposits can be divided into three chronostratigraphical units (A–C): an oldest unit with an erosive character (A), a middle unit comprising extensive channel aggradation after active migration (B) and the youngest unit indicating that migration had almost stopped (C; Fig. 10).
Unit A. The widely varying dates for this initial phase of river migration are older than the known age of Vecht onset (based on the end of peat growth, Section 4.2.1). Moreover, in each of the cores 282 and 332, two samples were dated, the upper sample being older than the lower sample (Fig. 10). This inverted chronology indicates that there is reworked organic material in the samples. Unit A thus characterises an erosive phase of fluvial activity, which on the basis of the youngest date (core 332, lower sample) is younger than c. 400 BC. This sample will include reworked material and therefore provides a TPQ date, with a possible time gap of several centuries.
Unit B. A substantial part of the migration trajectory (about 50%) yielded dates from a relatively short period, the fifth to seventh centuries AD. The dated material was possibly partly reworked as well, so the ages may represent a maximal age. Given relatively similar ages of multiple dates, however, we believe that these dates represent channel activity quite accurately. These dates show sedimentation in the inner bend. Due to ongoing meander migration, it is not possible to pinpoint exactly the position of the channels’ outer bend edge (migration front). Therefore, reconstruction of the exact channel width over time is not directly possible. It may be possible that the channel remained similar in cross-sectional wet area, while it migrated relatively fast. Alternatively, the active channel was originally wider and narrowed during the migration. In this process, the inner bend filled in relatively fast, while the outer bend migrated at a slower pace (diminishing cross-sectional wet area). Considering its small discharge today, the present-day width of 50–60 m is considered a minimal width for medieval period, while the (minimum) channel belt width of 100 m (Fig. 6) represents the maximum original channel width. Taking into account some narrowing of the Vecht river after abandonment (Fig. 10, N5 and N7), we estimate its width during early medieval migration to have been between 70 and 90 m at maximum. This leaves only small room (about 20 m) for diminishing width of the migrating river in unit B. We therefore think that Unit B was formed under relatively fast migration predominantely, while narrowing must have been very modest.
By the sixth century AD (or possibly somewhat later), the active river likely already experienced 60% of its total migration (Fig. 10). Sample N21 (transect HE, core 328, Fig. 6, cf. Fig. 13) is on the basis of the dating result considered to be within the longitudinal component of river migration and is therefore positioned approximately into the reconstruction of river migration (oval symbol in Fig. 10). The breakthrough of the IJssel in the early Middle Ages in the area between Doesburg and Deventer may have led to a further reduction of water supply to the Neder-Rijn, Kromme Rijn and Vecht (Makaske et al., Reference Makaske, Maas and van Smeerdijk2008; Cohen et al., Reference Cohen, Stouthamer, Hoek, Berendsen and Kempen2009). Van Dinter et al. (Reference van Dinter, Cohen, Hoek, Stouthamer, Jansma and Middelkoop2017, 30) reconstruct that the Vecht continued approximately equal discharge in this period, because discharge of the Oude Rijn reduced more quickly than that of the Kromme Rijn (see also Section 5.2).
Geomorphology of the investigated reach of the Vecht with the location of a potential Roman canal, which is also the axis of the successive medieval meanders between former Horstermeer and Aetsveldse Meer. The arrows indicate the migration direction of the river and meander loops. The red dashed line is the estimated position of the river around 5th–6th century AD. See also Fig. 6. In the former Horstermeer, the map shows a LiDAR image with a corresponding residual channel.

Unit C. In the second millennium AD, meander migration was minimal. The two dates from unit C probably indicate accretion of land in the border part of the river that has decreased in significance. The virtual cessation of river migration can be linked to the closure of the Kromme Rijn at Wijk bij Duurstede in 1122 AD (Dekker, Reference Dekker1980). Various authors accept this year as the break point after which the Kromme Rijn, Oude Rijn and Vecht carried only local water (Berendsen & Stouthamer, Reference Berendsen and Stouthamer2001; Cohen et al., Reference Cohen, Stouthamer, Pierik and Geurts2012; Van Dinter et al., Reference van Dinter, Cohen, Hoek, Stouthamer, Jansma and Middelkoop2017, 31).
4.3. Analysis of archaeological sites
The results of the inventory of archaeological settlements and isolated finds are shown in Fig. 11. The most spectacular find is the Roman tombstone of Loenersloot, which has probably been transported into the area from elsewhere (Kok, Reference Kok2008, 43). Most of Mesolithic/Neolithic find locations are situated in the eastern part of the inventoried area, on top of the cover sands below the relatively thin peat layers. Further west, such finds may be hidden below thick peat sequences, as demonstrable near the river Kromme Mijdrecht (Fig. 11). Furthermore, finds from the Bell Beaker period which reflect habitation in the vicinity are known from the Rokin in Amsterdam, found ex situ more than 10 m below surface in a tidal-filled channel (Kranendonk et al., Reference Kranendonk, Kluiving and Troelstra2015).
The spatial relationship of human activity, including settlement, to channel systems can be established on the basis of finds from the Iron Age onwards. Iron Age find spots are located mainly in the first phase of this river branch towards the west (Oud Aa/Angstel). Out of five clear settlements, four are located on the fluvial ridge and one on a crevasse splay in Aetsveldse Meer. The latter one covers a strip of ground more than 500 m long and yielded many different types of finds from the middle to late Iron Age. The discovery of three dugout canoes suggests that people moved through the area by boat. In one such dugout canoe, found at Nigtevecht in 1987, pottery sherds typologically datable to c. 600 BC were found, showing similarities with pottery from Assendelft (north of the Oer-IJ). Also the stylistic characteristics of pottery found in the Breukelerwaard point to contact with the Oer-IJ area (Kok, Reference Kok2008, 42).
The biggest difference in the eastern second phase (Vecht) corridor (with the studied reach) compared to the Angstel phase is the complete absence of Iron Age finds along this reach of the Vecht. No Iron Age find spots are known here and in contrast Roman period finds are represented more often, especially between Breukelen and Nigtevecht, although only two of the eight find spots suggest a settlement. Isolated finds from the Roman period for the most part consist of coins found by metal detection. As a consequence, finds from the Roman period may be over-represented in the data. Moreover, after the Middle Ages significant amounts of soil from Utrecht were imported into the Angstel–Vecht area for several purposes (Stouthamer et al., Reference Stouthamer, Berendsen, Peeters and Bouman2008, 23; Kok, Reference Kok2008, 44). Finds of Roman coins that are assumed to originate from elsewhere are marked in Fig. 11. The relative period distribution of the Roman finds is shown in Table 2 and, taking into account that it mainly concerns coins, it seems to fit within the pattern known from the river area, although the number of finds in the river area is much greater. Because of the limited Roman find material in the Angstel–Vecht area, there should be attached less significance for dating the onset of the Vecht to the Roman finds in the studied reach than to the lack of finds from the Iron Age.
Number of Roman finds by period in the study area of Angstel and Vecht (Fig. 11).

5. Discussion
In this section, we will address the question of the character of possible Roman interventions and test our hypothesis, based on the results of 14C dating within the context of our detailed mapping. We will also discuss the development of the investigated river reach in a broader context, within the Angstel and Vecht channel belt, the natural system of the Rhine–Meuse delta and the Oer-IJ/Vlie estuaries. Understanding this wider landscape context provides insights into how the Romans may have operated in these areas.
5.1. Chronological control
What additional insights do the newly acquired chronological data, augmented by previous information, provide us with regarding the palaeogeographical development of the studied part of the Vecht river system? The dates of the most relevant events are plotted together in Fig. 12. Our dating results for the Angstel (phase 1) confirm those of Törnqvist and Bos et al. (Section 4.2.1.). In the erosive first stage of Vecht river (phase 2) activity, a general TPQ age has been determined. The youngest sample of reworked material from this erosive chronostratigraphical unit A of the channel fill deposits (Fig. 10, core 332) provides a TPQ date of 459–231 BC (Table 1, N23). Our results of migration stage B, dated to the fifth to seventh century AD (Fig. 10), and final stage C of the Vecht river activity confirm the relative high early medieval discharge of the Vecht river (compared to the Oude Rijn) suggested by Van Dinter et al. (Reference van Dinter, Cohen, Hoek, Stouthamer, Jansma and Middelkoop2017, 26, 30) and their dating of the final stage of this river, caused by the damming of the Kromme Rijn at Wijk bij Duurstede in 1122 (Fig. 12).
When did peat growth cease completely near the studied Vecht reach (phase 2), in response to the formation of levee deposits by this river? Our dating of the youngest preserved peat at Nigtevecht (Fig. 12, N14, 356–57 BC) differs significantly from the dating by Bos et al. (Reference Bos, Feiken, Bunnik and Schokker2009, 368) at Nigtevecht (E10, 740–233 BC; the statistical overlap is only 4%). With regard to the origin of the Vecht (phase 2), our date added to those of Bos et al. pushed the TPQ date for the onset of Vecht activity from (approximately) 500–200 BC to 350–100 BC. Above the youngest peat (Fig. 9, core 292, N14, 356–57 BC), there is still 8 cm of decomposed clayey peat, while in profile A there is 21 cm of decomposed clayey peat overlying the top of preserved peat, which is from around 800 BC. The new result from our study is the degradation of the peat, as inferred from the dating results and observed lithology, which reinforces the TPQ character of the dating results of Bos et al. and our study, with a possibly longer time gap. In the studied reach, there are good indications that peat growth continued until the arrival of the Romans, possibly even longer. With respect to the Loenen avulsion (whether natural or man-made, see Section 2.2/Fig. 4), it is worth noting that between the avulsion point and the study area, sediments were firstly deposited in the Horstermeer before they could be spread over the peat as natural levee deposits along the studied reach of the Vecht (Bos et al., Reference Bos, Feiken, Bunnik and Schokker2009, 368). Our data did not provide sufficient information about possible separate episodes of avulsions (whether or not natural) near Breukelen and Loenen.
Dating results of unit B (Fig. 10) indicate that by 400 AD the Vecht river existed and was actively depositing Rhine-clay across the peatland (Fig. 6/Fig. 13). The sample with abundant wood fragments (Fig. 7, core 235; Table 1, N1), 14C dated to 213–361 AD and interpreted as floating woody material deposited on the levee by the river Vecht, is an indication that levee formation was already going on in the third/fourth century AD. Also relevant is a dating from the Oud-Aa channel fill after it was abandoned as a part of the Angstel phase 1 (Table 1, E8, 12–327 AD). With this, there is some limited room (400 to max. 500 years) of past peat formation now lost in the peat-degradation hiatus.
The results of the inventory of archaeological find locations show that along the Vecht (phase 2) there are no Iron Age remains, but there are some of Roman date. This is in great contrast to the Angstel (phase 1), where five clear Iron Age settlements are present (section 4.3). The spatial distribution of finds along the Vecht in the Roman period is more in line with the general picture of the area several tens of kilometres north of the Roman limes, which suggests that during the first and second centuries AD there were only sparse native settlements in this area. The finds suggest potential occupation on the natural levees of the Vecht at Overmeer during the Roman period (second century AD), but the limited amount of finds indicates that this interpretation must be treated with caution. More significance for dating the onset of the Vecht should be attached to the lack of finds from the Iron Age.
It appears that the initiation of this reach of the Vecht lies between c. 200 BC and c. 250 AD. These dates do not discount its potential origin as a Roman canal built by Drusus but do not provide sufficient evidence either. Considering the decomposition of the top of the peat, the chronological limits together with geomorphological, archaeological and historical arguments make the possibility of canal construction in the Roman period more likely.
5.2. Channel geometry and its evolution
The mapping shows a narrow channel belt (c. 150 m wide) with a meander shape with low sinuosity, through which within the borders of the channel belt one straight axis extending 2 km in length can be drawn for the purpose of analysis (Fig. 13). The western boundary between channel deposits and preserved peat (near transect AC) has a slightly curved shape, interpreted here as a migration to the left (west) during an initial short period. Alternatively, it could be that a hypothetical Roman canal was not constructed in a perfectly straight line. Other lowland Roman canals – the c. 30-km long Corbulo Canal (De Kort & Rackzynski-Henk, Reference de Kort and Rackzynski-Henk2014, 56; Polak et al., Reference Polak, Bödecker, Berger, Zandstra and Leene2019; Hessing & Schrijvers, Reference Hessing and Schrijvers2021; Fig. 2) and the Fossa Augusta, Fossa Flavia and Fossa Claudia, which covered together a distance of c. 150 km in the Po delta in Italy (Uggeri, Reference Uggeri1997; Laurence, Reference Laurence1999, 117; Medas, Reference Medas, Bonifacio and Caniato2013, Reference Medas, Cantoni and Capurso2017) – also consist of rather straight sections that were connected with slight bends, although also was made use of existing tidal channels or lagoonal lakes. The Canal of Corbulo was dug through the peat directly behind a beach barrier, so that the morphology of the edge of this landform has influenced the shape of the canal, resulting in straight sections connected with slight bends. Assuming Drusus canals in the Vecht area, they were dug to help military campaigns in an offensive period as a series of short-cuts to make transportation of troops and supplies easier. This differs from, for example, the longer canals of Corbulo and in the Po delta, which were established to address long-term infrastructure needs such as the transportation of goods between different areas.
‘Identification of the construction phase of a (Roman) canal can be difficult, depending on the post-depositional processes that affect the state of preservation of the canal’ (Salomon et al., Reference Salomon, Purdue, Goiran and Berger2014, 3). During our investigation, we could not identify any direct evidence of a canal, such as revetments or created cut surfaces, known from Roman canals which usually have a width of 12–15 m (De Kort & Raczynski-Henk, Reference de Kort and Rackzynski-Henk2014, Table 1). The channel belt boundary identified in transects AC and AX (Fig. 13) could date from a relatively short timeframe after the assumed canal construction. Based on our oldest age results of channel belt sedimentation (Fig. 10, unit B), we know that the initiation of this reach of the river or canal must in any case be before approximately 400 AD. However, the initial period of two-way widening (to 50–70 m) and vertical deepening of the channel before starting to migrate, and the sample N1 (Fig. 7, core 235; 213–361 AD) taken within the levee deposits, are indications that levee formation was already going on in the third/fourth century AD (Section 5.1).
The narrow width of the Vecht channel belt between Overmeer and Nigtevecht is mainly related to the limited impact (low sinuosity) of the river’s meandering activity (Bos et al., Reference Bos, Feiken, Bunnik and Schokker2009, 361-D, ch. 5.3.3). Meander activity is much lower in peaty areas (due to the higher erosion resistance) than where a river flows through a clay- and sand-filled lake (Berendsen & Stouthamer, Reference Berendsen and Stouthamer2001; Bridge, Reference Bridge2003; Makaske & Weerts, Reference Makaske and Weerts2005; Candel, Reference Candel2020). It could be questioned whether this reach of the Vecht is a ‘straight river’, which is defined as a slightly winding river with low sinuosity due to a high erosion resistance of the encasing substrate (Berendsen, Reference Berendsen2005, 272). Mostly the centre line through the successive windings has at least a slightly curved shape, but in the studied reach of the Vecht the initial stage was very straight, also for peaty rivers, so we think it is an exceptional one (Fig. 13). Note that, based on the migration of the meanders, it can be estimated that the distance from the axis to the outer bends of the meanders, which is approximately 130 m (6.5%) today, was only approximately 70 m (3.5%) around the fifth to sixth century AD (Fig. 13). In a natural situation, the main structure (centre line through the meander loops) usually has a (slightly) curved shape, for example, perimarine crevasses along the Rhine (Van Dinter, Reference van Dinter2013), but in the case of V1 it seems to be a really straight line, which raises the hypothesis of canal construction (Fig. 5, V1; cf. Fig.13).
Apart from the notable channel belt geometry and the difficulties in dating the origin of the investigated reach of the Vecht, the question is what the landscape looked like through which the canal was dug. A small peat river navigable for canoes might have existed here, similar to examples described by Candel (Reference Candel2020 and underlying references), hardly depositing inorganic sediments over the peat, but this is not that likely. The western side of Horstermeer and Aetsveldse Meer where the Angstel established its course earlier, would have accommodated such streams, whereas the more eastern side appears a stream-less fen-peatland through which runoff was more diffuse (Van Loon, Reference van Loon2010). If such diffuse courses existed, the Romans could have converted them into a navigable route for flat-bottomed boats, but why would they have aimed for it? Why didn’t they use the Angstel river a bit further west? Because that was blocked/closed off? At the time of arrival of Drusus, if the Angstel river could only be used by canoes and not by Roman flat-bottomed boats, some kind of human intervention was necessary.
To discuss the hypothesis of a dug canal, it is also relevant to consider the expenditure of time and resources. Digging a new route through a peat-forming fenland might have taken less effort than dredging and keeping open winding older river courses. The latter were prone to infilling, with problems in digging like heavy vegetation and slumping of clayey shores by seepage, being less stable then peaty shores. This is a plausible assumption for general human use of wetland landscapes and may have been one of the reasons for creating a new (more eastern) and navigable route in addition to the Oud-Aa and Angstel river course. This also fits in with the abandonment of the crevasse splays and the Nifterleek in the Aetsveldse Meer and the timing of abandonment of the Oud-Aa (Section 5.1, Fig. 12). Another example in which a canal was dug through peat next to a natural course is the Corbulo Canal (Hessing, Reference Hessing and Hessing1990, 342; Jansen, Reference Jansen2011, 22; De Kort, Reference de Kort2013, 235).
The discharge of the Vecht near Nigtevecht in the Roman and early medieval period can be estimated as analogous to the estimates for the Kromme Rijn, Oude Rijn and Vecht near Utrecht (Van Dinter et al., Reference van Dinter, Cohen, Hoek, Stouthamer, Jansma and Middelkoop2017, 25 ff.). A reconstruction of the discharge of these three rivers has been derived from channel geometry, that is, cross-sectional wet area of these rivers near Utrecht, assuming an equal energy slope for these rivers near Utrecht.
For proper estimation and comparison, it is necessary to use the available data of the dimensions of the active Vecht channel. The present-day Vecht open river near Nigtevecht still has a width of 50–60 m, while the river cannot have been wider than 100 m, the minimum width of the channel belt (Fig. 13). Taking into account some narrowing of the Vecht river before and after abandonment (Section 4.2.2), we estimate its original width (in case of a possible dug canal: after maximum two-side widening, deepening and having started meandering) to have been between 70 and 90 m at maximum. Based on Fig. 10, we estimate its depth (measured from the top of the peat, Fig. 10) to be about 4 m, which gives a cross-sectional wet area of about 200 m2. This is higher than Van Dinter’s estimate near Utrecht (100 m2). A plausible explanation for the difference is that in the peatland area near Nigtevecht the gradiënt (energy slope) will be lower than in a river delta area like near Utrecht, resulting in a lower ratio of the discharge versus the cross-sectional wet area.
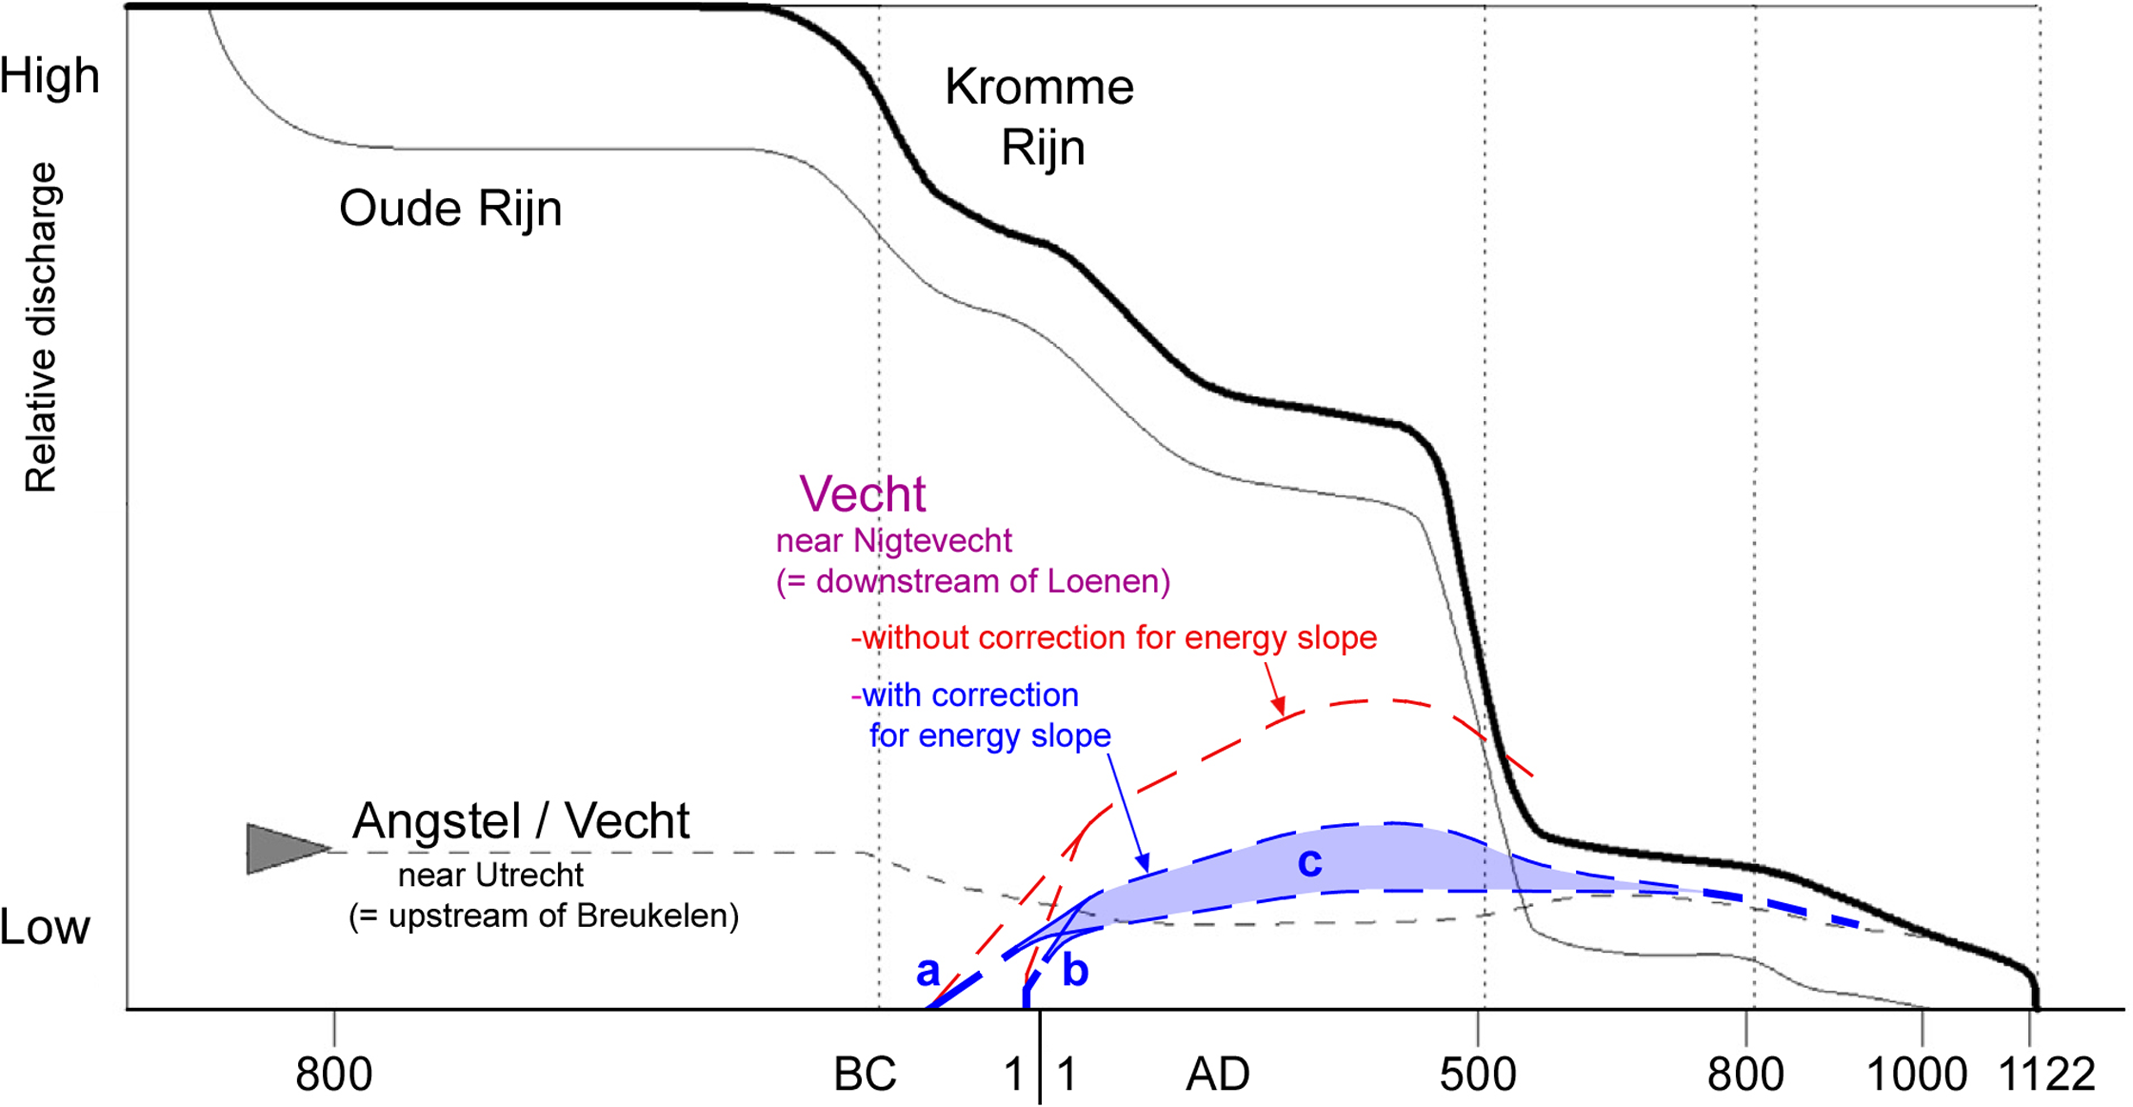
Reconstruction of discharge near Utrecht through time, from the beginning of the Angstel avulsion to the damming of the Kromme Rijn by Van Dinter et al. (Reference van Dinter, Cohen, Hoek, Stouthamer, Jansma and Middelkoop2017, 28), is shown in Fig. 14. Using our estimate near Nigtevecht (section 4.2.2) and taking into account the lower energy slope, we supplemented this with an approximate reconstruction of the discharge of the Vecht near Nigtevecht (Fig. 14). The red curve shows the result when using the same energy slope as near Utrecht, as a maximal discharge. Given the fact that this discharge is higher than that of the Kromme Rijn (its feeding channel) just after 500 AD, this is likely an overestimation. The blue curve, based on a lower energy slope in the area near Nigtevecht, fits better with the available data. The blue reconstruction, with only slightly diminishing Vecht discharge up from fifth century AD (based on dates from unit B; Fig. 10), supports the suggestion by Van Dinter et al. (Reference van Dinter, Cohen, Hoek, Stouthamer, Jansma and Middelkoop2017, 30) that in this period a larger share of the water from the Kromme Rijn was discharged via the Vecht than via the Oude Rijn. Alternatively, given that our unit B dates are TPQ ages, it cannot be excluded that the meander migration took place some centuries later. In that case, it might be correlated with an increased meandering of the Vecht near Utrecht in the second half of the 10th century and the 11th century, described by Van Dinter et al. (Reference van Dinter, Cohen, Hoek, Stouthamer, Jansma and Middelkoop2017, 27), although they present no enhanced discharge in their reconstruction (Fig. 14). We also reconstructed the initial stage (of the Vecht phase 2) having two possible origins (a = natural or b = human-induced). In case of a natural origin, we expect the initiation to have taken somewhat more time, and therefore Vecht activity starts earlier in our reconstruction.
Estimated discharge proportions based on cross-sectional wet area of Kromme Rijn, Oude Rijn and Angstel/Vecht near Utrecht (black) and near Nigtevecht (red/blue) as a function of time. The blue graphic has been corrected for the lower energy slope in this area. a = variant on the basis of a natural origin of the phase 2 channel belt; b = variant on the basis of an artificial intervention by the Romans; c = estimate with uncertainty range of maximum discharge. Source: Van Dinter et al. (Reference van Dinter, Cohen, Hoek, Stouthamer, Jansma and Middelkoop2017), Fig. 10 (black), supplemented with the results of this study (red/blue).
5.3. The Romans and the Vecht
The starting point for our research was the Vecht as the best candidate of multiple hypotheses for the location of the Drusus Canal(s). Amongst modern authors, there was already a widely shared opinion that the Vecht was already navigated by the Romans (see introduction). But this needs not necessarily to be explained as the Romans navigating the Vecht as a natural river. The Vecht may as well have been navigated by the Romans because of canal construction in its reaches. It is striking that none of the previous authors has made a direct association with the Canals of Drusus. Some authors even took the position that the Drusus’ Canal(s) had been constructed in the area of the IJssel, but that the Romans had also used the Vecht as a navigation route (Willems, Reference Willems1981/1984, 58; Manten, Reference Manten2007, 63). This raises the question as to whether the Romans used more than one shipping route to the north, a suggestion that might be understood from the use of the plural ‘fossae’ by Suetonius (Vita divi Claudii I, 2–4). However, the Romans needed only one shipping route, so why would they make big efforts to construct a second one?
It seems more plausible to explain the plural as a series of canals connected in succession in the area of the Vecht and maybe the Flevo Lake and the Vlie; together, they may have formed a single navigable route, e.g. in the places indicated with red ovals in Fig. 4. Among these R1 canals, there also can have been a shortcut in the area of the Flevo Lake and the Vlie (Huisman, Reference Huisman1995, 191; see Fig. 2). The entire navigable route could have been created by Drusus with a series of passages and short-cuts of river bends from Vechten to the great lakes and the land of the Frisians (Halbertsma, Reference Halbertsma1982, 46).
Finally, there must have been an easily navigable river to the north, because in the middle of the first century AD, several classical authors mention a right branch of the Rhine that flowed through the Flevo Lake; before that time, only the Rhine and the Waal were mentioned as river branches (Section 2.1). Ptolemy (87–168? AD) even mentions three Rhine mouths north of the Helinium (Meuse–-Waal estuary) and Lugdunum Batavorum (Katwijk aan Zee), of which the most northern is explicitly called Flevum (Vlie). (Ptolemy, Geographia II, 9, 12).
The descriptions by the classical authors fit well with a series of canals. Through the input of extra water from the Rhine, they would have developed into a naturalised, freely flowing channel connection between the Rhine and (eventually) the Wadden Sea; the energy of the river meant that it did not have to be kept open by other means such as dredging. A sufficient influx of river water into the Vecht depended primarily on the character of the bifurcation of the Oude Rijn and Angstel/Vecht channel belts (Fig. 2/4). Whether or not the Romans also made channel adjustments at this bifurcation to ensure sufficient water inflow into the Vecht (e.g. shortcutting bends or constructing a groyne, like at Herwen, Fig. 2), is hard to determine, as old river phases have been eroded by or may be hidden below younger ones (see Van Dinter et al., Reference van Dinter, Cohen, Hoek, Stouthamer, Jansma and Middelkoop2017, ch. 4.1.1.).
The castellum of Vechten, named Fectio, founded c. 5 BC (Zandstra & Polak, Reference Zandstra and Polak2012, 243, 249; Polak, Reference Polak, Nickel, Röder and Scholz2014, 75, 93) has been assumed to have been built near the bifurcation of the Rhine and Vecht (Polak & Wynia, Reference Polak and Wynia1991; Bechert & Willems, Reference Bechert and Willems1995, 81; Van der Tuuk & Cruysheer, Reference van der Tuuk and Cruysheer2014, 106). It had a military logistical function in the fleet expeditions of Tiberius and Germanicus to northern Germany (Zandstra & Polak, Reference Zandstra and Polak2012; Polak, Reference Polak, Nickel, Röder and Scholz2014). Van Dinter (Reference van Dinter2013, 20) reconstructs the bifurcation point of the Rhine and Vecht during the early first century AD in the city of Utrecht, presumably adjacent to the Roman fort (Traiectum) at Utrecht. This castellum was built c. 40 AD (Broer & De Bruijn, Reference Broer and de Bruijn1997; Zandstra & Polak, Reference Zandstra and Polak2012; Polak & Kooistra, Reference Polak and Kooistra2013; Polak, Reference Polak, Nickel, Röder and Scholz2014). At that time, the strategic route via the Vecht to the north had become less important to the Romans and their efforts were focused on guarding the Rhine limes as a river transport corridor and supplying Britannia via the Oude Rijn (Graafstal, Reference Graafstal, Hodgson, Bidwell and Schachtmann2009, 186; Breeze et al., Reference Breeze, Jilek, Graafstal, Willems and Bödecker2018, 67). The older castellum of Vechten was situated at the outer side of the Oudwulvenbroek meander (Fig. 4), which was abandoned in the early Roman period as the result of a meander cut-off c. 1.5 km upstream of the castellum (Van Dinter et al., Reference van Dinter, Cohen, Hoek, Stouthamer, Jansma and Middelkoop2017, appendix, 42; Van Dinter et al., Reference van Dinter2013, 20 and underlying references). But what if this was not the result of natural processes, but of an intervention by the Romans (the first of a series of successive cut-off canals by the Romans, including the studied Vecht reach near Nigtevecht), and if the cut-off point is the place where, according to Tacitus, Germanicus entered a canal named after his father Drusus?
Since, according to Suetonius, Drusus had dug canals at the northern side of the Rhine, it is almost obvious that he (also) made adjustments to the system of the Angstel and Vecht. Although Suetonius speaks about an enormous work (immensi operis), Drusus may have achieved this by digging a number of relatively short canals, so that in a short time he established a navigable connection to the Wadden Sea. A second Roman waterway via the Beneden-IJssel area is not plausible, because locks would have been required there and the Romans only needed one waterway towards the north. The Dam and the Canals of Drusus can be considered to be parts of one coherent design. This makes it an excellent example of Roman shipping infrastructure, which must have been devised at a high central political level, like the projects which undoubtedly were undertaken elsewhere in the Roman Empire. If the focus of further investigations, such projects can yield important information if undertaken using a combined geoarchaeological and historical approach.
This study has revealed the potential course of a canal system dug by Drusus, which demands further interdisciplinary geoarchaeological research. Elements of this research can be:
-
* refining the dating results of Vecht development and end of peat growth by investigation in long profile trenches at suitable locations, especially where top of the peat may be better preserved (under dikes and former buildings);
-
* continued study to refine dating of the abandonment of the Oud-Aa near Breukelen;
-
* research with a morphological approach at other possible Roman canal locations in the Vecht area (e.g. near the cut-off point northeast of the castellum of Vechten).
6. Conclusions
This study has undertaken a detailed geoarchaeological investigation of the reach of the Utrechtse Vecht between Overmeer and Nigtevecht, which has a strikingly straight shape. The working hypothesis of this investigation was that the Romans created a navigable route of canals for flat-bottomed boats in this area by connecting a number of peat-bounded lakes in the Angstel–-Vecht, which subsequently developed into a naturalised river course. The detailed mapping of the studied Vecht channel between Overmeer and Nigtevecht shows an overall very straight main channel planform over a length of 2 km with very low sinuosity. The results indicate that the successive meanders of the studied reach of the Vecht channel formed quite steadily in the same way during the same time period. This is supportive of the idea of a channel that began along a straight axis, but became meandering later.
Our top of the peat dates and the inferred first clay influx in the peat confirm the onset of the phase 1 Angstel around 900 BC. Our dating of the younger Vecht branch onset (phase 2) does not contradict earlier dating results by Bos et al. (Reference Bos, Feiken, Bunnik and Schokker2009), although our dating results are slightly younger. However, in our study visual inspection in test pits has revealed peat degradation, that must be taken into account when interpreting chronologies. By this we know that the end dates of peat growth (both for the earlier and our datings) tend to be interpreted as older than they actually are, so that Roman age becomes more probable. We also confirmed that the abandonment of the Angstel–Vecht system took place around 1100 AD.
Three chronostratigraphic units of river development with migration are distinguished in the channel deposits by dating organic remains from the channel belt: an active and erosive first unit, starting some shorter or longer time after about 200 BC; a second unit with extensive channel fill deposition after and during active river migration from about 400–900 AD; a final unit associated with the damming of the Kromme Rijn in 1122 AD (and fossilisation). Dates from fills of the Oud-Aa (phase 1) channel and woody material deposited on the levee of the Vecht indicate that river activity must have started well before 250 AD. Based on our dating evidence and that of previous studies, the onset of the Vecht river (the Loenen–Nigtevecht–Muiden branch) may lie between 200 BC and 250 AD, which makes a Roman age more likely. Combined with our results on the initial straight shape of the studied reach Overmeer–Nigtevecht, this gives more room (time) for the possibility of canal digging activities at the time of Drusus. This study has therefore made the potential course of a series of canals dug by Drusus in this area more likely. Confirming this course demands further interdisciplinary research.
Supplementary material
To view supplementary material for this article, please visit https://doi.org/10.1017/njg.2022.2
Acknowledgements
This study was part of the PhD project of the first author on Roman waterworks in the Rhine–Meuse delta. The authors are grateful to Feike Miedema, Jurgen de Kramer and Eckhart Heunks for their cooperation in the fieldwork, to Nico Willemse and Laura Boukje Stelwagen (RAAP, NL) for their help with the core profile presentation, to Anton Cruysheer and Stijn Heeren for their help to collect data of archaeological finds and to Henk van Haaster (Biax) for the botanical analysis of the samples. We especially want to thank Kim Cohen (Utrecht University) for his valuable feedback on interpretation and wording of our palaeogeographical results. Furthermore, we are grateful to Kees Kasse (VU University), Peter Vos (TNO) and Jasper Candel (Wageningen University) for discussions on different aspects of this study. Andy Howard (Landscape Research & Management, UK) is thanked for reviewing the English grammar of this paper. Our thanks are also due to Rien Polak, Kim Cohen and one anonymous reviewer that have improved the quality of our paper. We are grateful to the province of Gelderland and the VU University Amsterdam for making this study possible. Last but not least, we want to thank Nico Roymans for his stimulating feedback on the analyses, interpretations and conclusions of this study.


 Open access