


Introduction
The welfare of dogs undergoing veterinary care has primarily focused on achieving a basic standard of care that includes redress of physical pain. Through this lens, signs of fear, anxiety and general distress have often been normalised — and even expected — as part of routine care. Instead, such signs should be viewed as animal welfare concerns, affecting both behavioural preferences regarding how to be handled and mental well-being (Broom Reference Broom2016; Mellor Reference Mellor2016).
Fear is defined as an emotional and motivational state provoked by specific stimuli, resulting in withdrawal, active avoidance, and/or defensive behaviours (Steimer Reference Steimer2002; Overall Reference Overall2013a). Furthermore, fear can result in physiological and behavioural indicators of response to stressors and/or distress. Fearful responses may begin as soon as dogs walk into a clinic. In one study, conducted at a veterinary hospital in Germany, fewer than half of the dogs entered the clinic calmly (n = 62/135) and 13.3% (n = 18/135) had to be dragged or carried into the building (Döring et al. Reference Döring, Roscher, Scheipl, Küchenhoff and Erhard2009). Another study found that when walking into a veterinary clinic, 60% (n = 279/462) of dogs showed apprehensive postures and 18% (n = 81/462) showed signs of fear-related aggression (Stanford Reference Stanford1981). Two-thirds of dogs in a veterinary waiting room (n = 30/45) spent more than 20% of the time exhibiting at least one sign of stress, and 53% (n = 24/45) exhibited four or more signs of stress; the most common signs being nose licking, panting, lowered ears, and crying/vocalisation (Mariti et al. Reference Mariti, Raspanti, Zilocchi, Carlone and Gazzano2015). Elevated physiological stress markers in dogs, including serum cortisol and heart rate, have been found in dogs constrained to sit in some waiting-room environments (Perego et al. Reference Perego, Proverbio and Spada2014). Other aspects of veterinary visits, including walking onto a scale, physical examination, and being placed onto an examination table, have shown to increase signs of distress — including trembling, tail-tucking, and avoidance/escape behaviours — in canine patients (Hernander Reference Hernander2008; Döring et al. Reference Döring, Roscher, Scheipl, Küchenhoff and Erhard2009; Mariti et al. Reference Mariti, Pierantoni, Sighieri and Gazzano2017; Stellato et al. Reference Stellato, Hoffman, Gowland, Dewey, Widowski and Niel2019a).
The pervasive level of fear currently experienced by patients during veterinary visits has both immediate welfare concerns, long-term implications and consequences. Each negative event an animal experiences at the veterinary clinic conditions them for future negative responses to similar events, causing subsequent visits to become more difficult and time-consuming for patient, owner, and staff members alike (Döring et al. Reference Döring, Roscher, Scheipl, Küchenhoff and Erhard2009; Stellato et al. Reference Stellato, Flint, Dewey, Widowski and Niel2021). Dogs < 2 years old that visited the practice frequently were more fearful than older dogs that visited infrequently (Döring et al. Reference Döring, Roscher, Scheipl, Küchenhoff and Erhard2009), suggesting that exposure to experiences they perceive as fearful are salient and that repeated exposure to veterinary practices and associated procedures may sensitise the patient (Domjan Reference Domjan and Domjan2015). Such outcomes are behaviourally and emotionally problematic for our patients, and costly to the veterinary team in terms of time, staff costs, stress and burn-out (Steffey et al. Reference Steffey, Griffon, Risselada, Scharf, Buote, Zamprogno and Winter2023).
In many species, including dogs, fear can impair immune function and reproductive abilities, increase the risk of contracting infectious diseases, delay healing, and have a negative effect on lifespan (Moberg Reference Moberg, Mench and Moberg2000; Dhabhar Reference Dhabhar2009; Dreschel Reference Dreschel2010; Gouin & Kiecolt-Glaser Reference J-P and Kiecolt-Glaser2011; Edwards et al. Reference Edwards, Smith, McArthur and Hazel2019). Stress responses experienced during veterinary visits negatively affect the animal, pet owner and veterinary staff in a variety of manifestations. Outcomes may include decreased frequency of veterinary care, negative effects of stress on the patient’s long-term health, impaired ability to assess, accurately diagnose, and treat health concerns (e.g. high heart rate or tense abdomen, which could be due to disease processes or a stress response) (Beerda et al. Reference Beerda, Schilder, van Hooff and de Vries1997; Schubert et al. Reference Schubert, Lambertz, Nelesen, Bardwell, J-B and Dimsdale2009). Furthermore, the physical and logistic struggle involved in providing basic care carries an increased risk of injury to the veterinary team when the patient experiences stress, and stress experienced by the pet — and by extension the owner — has been cited as a contributing factor for delaying veterinary care (Volk et al. Reference Volk, Felsted, Thomas and Siren2011; Overall Reference Overall2013b; Edwards et al. Reference Edwards, Smith, McArthur and Hazel2019; Stellato et al. Reference Stellato, Flint, Dewey, Widowski and Niel2021). Overall, this negatively affects treatment outcomes and the standard of care for both interventional and preventative veterinary care.
There is now an increased acknowledgment and awareness of the persistence of stress and fear in veterinary patients (e.g. www.fearfreepets.com). Recognition has grown in the veterinary community for the importance of low stress handling in the veterinary hospital and clinic (Overall Reference Overall2013b, Reference Overall2019; Lloyd Reference Lloyd2017; Mandese et al. Reference Mandese, Griffin, Reynolds, Blew, Deriberprey and Estrada2021; Riemer et al. Reference Riemer, Heritier, Windschnurer, Pratsch, Arhant and Affenzeller2021). Some research has shown that dogs with positive experiences while at the veterinary clinic have been found to show fewer behavioural indicators of fear, such as trembling, tail tucking, and avoidance behaviours, than those with negative experiences (Döring et al. Reference Döring, Roscher, Scheipl, Küchenhoff and Erhard2009), and researchers have begun to investigate the influence of collaborative care on dog fear levels during veterinary examination (Stellato et al. Reference Stellato, Jajou, Dewey, Widowski and Niel2019b). Early veterinary visits set the foundation for subsequent interactions and can have lasting effects on the persistence of fearful behaviours — including panting, yawning, lip-licking — in patients into adulthood (Godbout & Frank Reference Godbout and Frank2011). There have been many recommendations regarding low stress handling, such as reducing restraint during procedures (blood draw, exam) (Overall Reference Overall2013b; Lloyd Reference Lloyd2017; Riemer et al. Reference Riemer, Heritier, Windschnurer, Pratsch, Arhant and Affenzeller2021) or using a blue bathmat and treats when weighing (Overall Reference Overall2013b; Lloyd Reference Lloyd2017; Edwards et al. Reference Edwards, Smith, McArthur and Hazel2019) and applying EMLA (2.5% lidocaine/2.5% prilocaine) cream prior to venipuncture (Overall Reference Overall2013b; van Oostrom & Knowles Reference van Oostrom and Knowles2018; Oliveira et al. Reference Oliveira, Soares, Moreira, Silva, Carrasco and Souza2019; Crisi et al. Reference Crisi, De Santis, Giordano, Cerasoli, Colucci, Di Tommaso and Luciani2021). However, assessment of the value of implementing these techniques within a veterinary setting and the effectiveness of these techniques in reducing canine fear and distress is limited. Hence, the aim of our study was to determine whether simple, easy, and inexpensive interventions positively affected distress in canine patients at the veterinary clinic. Rather than singling out one intervention, an examination protocol that altered most of the patterns of the standard physical exam was utilised for the intervention group, since what the dogs experience is the entire approach. Accordingly, responses were assayed for components of an overall pattern of changes, rather than to any single individual intervention.
This paper is part of a larger project where dogs were evaluated behaviourally and physiologically for their responses to the veterinary visit and intervention. The physiological differences between the control and intervention group at week 8 (visit 4) are discussed elsewhere (Squair et al. Reference Squair, Proudfoot, Montelpare and Overall2023). Here, we report on the behavioural data. Our objectives were to: (1) report on the demographic and owner-reported behavioural responses to the Working Dog Questionnaire – Pet Dog Version (WDQ-Pet) for each group of dogs to learn if dogs differ in behavioural history or exposure that could affect outcomes during veterinary exams; (2) compare the behavioural responses of dogs to veterinary clinic visits between in-person and video assessments; and (3) determine the effect of a series of interventions during the veterinary exam on behaviours that indicate fear and/or distress in dogs.
Materials and methods
Ethical approval
The animal study protocol was approved by the Animal Care Committee (ACC) and the Research Ethics Board (REB) of UPEI (Protocol 21-02; 19 May 2021). Written informed consent was obtained from all dog owners involved in the study, and they could withdraw from the study at any time.
Enrolment and inclusion criteria
Dogs whose guardians expressed an interest in their dogs’ behaviours during veterinary visits and who were interested in making such visits as happy as possible were solicited for the study via posters (Appendix 1; Supplementary material). Posters were placed in local businesses and veterinary offices within Charlottetown, Prince Edward Island, Canada and within the Atlantic Veterinary College (AVC) Veterinary Teaching Hospital (VTH) waiting room, and in the hallways of the hospital. A recruitment message was sent to AVC staff and veterinary students via the AVC dean’s office. A total of 30 dogs were screened to enrol a target of 28 participants (Table 1) based on initial power calculations of 90% with a one-tailed probability of 0.1 and zbeta = 1.28.
Signalment, treatment group (control or intervention), and study completion status of dogs (n = 30) that were screened and enrolled for participation

Study ID number reflects enrolment order (MC = male, castrated; MI = male, intact; FS = female, spayed; FI = female, intact).
Inclusion criteria specified that participating dogs had to be at least six months of age and be in good health. Requiring the dogs be six months of age guaranteed some prior veterinary experience since dogs would have their initial veterinary administered core vaccines by then and proof of rabies vaccination was required. This is also the minimum age used for all pharmacological studies that have licensed behavioural medications, including those used prophylactically for veterinary evaluation. Exclusion criteria included females that were pregnant or lactating, animals that were receiving behaviour-altering medications, and those with a history of overt aggression during veterinary examinations. The pre-enrolment WDQ-Pet screened for overt aggression, and dogs that snarled, lifted their lip, growled, snapped, or bit when handled or approached by strangers or in veterinary situations were excluded for safety reasons.
Demographics and historical behaviour
All owners completed the WDQ-Pet, a survey tool used in previous studies (Overall et al. Reference Overall, Hamilton and Chang2006, Reference Overall, Dunham, Scheifele and Sonstrom Malowski2019). The WDQ-Pet collects information on demographics (age, sex, number of homes, source, etc) and responses to a series of environmental and behavioural stimuli as noted by the owner. All categories evaluated in the WDQ-Pet are included in Table 2. The WDQ-Pet, with and without the scoring rubric, is found in Appendix 2 (see Supplementary material). The WDQ-Pet was used for two reasons. First, we used it to ensure inclusion and exclusion criteria were met. Second, the WDQ-Pet was used to assess whether, upon enrolment, the control and intervention groups differed with respect to demographic, historical, or behavioural response parameters including global (e.g. hesitancy to walk in some environments or on some substrates) and specific (e.g. separation anxiety, noise reactivity) fears and anxieties.
WDQ-Pet (Working Dog Questionnaire-Pet version) completed by owners’ prior enrolment of dogs (n = 28). Questionnaire consists of 58 categories of interest (both demographic and behavioural/environmental information)

Experimental design and exam protocol
Dogs were assigned using 20 iterations of a random number generator (Randomizer.org). Dogs were numbered from 1 to 28 as they were enrolled, and using the random number generator, were assigned by one investigator to group A or B. Assignment of control vs intervention group to coded group A or B was done by another investigator by a coin toss. Both groups were treated the same at the first visit, undergoing the control protocol. After the first visit, 14 dogs received the intervention protocol and 14 dogs continued to receive the control protocol for visits 2–4. The protocols differed when weighing the dog, during the physical exam and blood draw, and with respect to the type of homework assigned for the dog owners between visits 2, 3, and 4. For the intervention group homework consisted of practicing a collaborative physical exam for 5 min, three times per week, whereas owners in the control group were instructed to simply pet their dogs for the same duration and frequency. Table 3 summarises the key differences between each treatment group. The differences in the organisation and management of the visits and handling, including photograph illustration, for dogs in the control vs the intervention groups have been discussed in great detail in part one of this study series (Squair et al. Reference Squair, Proudfoot, Montelpare and Overall2023).
Treatment protocol summaries used for dogs (n = 28) within control (n = 14) and intervention (n = 14) groups at each of the four visits, originally published in Squair et al. (Reference Squair, Proudfoot, Montelpare and Overall2023)

All dogs were weighed using the control group protocol at visit 1. The scale at visit 1 was a plain metal scale, with no interventions (step 1 of 4). For dogs unable to get onto the bare scale, that failure was noted, and interventions were sequentially offered starting with the addition of a blue yoga mat (step 2 of 4), moving the scale with the mat from the wall (step 3 of 4), and finally adding treats (step 4 of 4). After visit 1, all dogs in the control group continued with this weighing protocol, while the intervention group had all the interventions present from the beginning. This rubric helped to assess the level of intervention needed at visit 1 for all dogs, and the level of intervention across all visits required for control dogs. The time to get all four feet on the scale so that a weight could be accurately obtained was also measured across all visits using video data.
The same room was used for every visit, and physical examination and blood draws were conducted by the same clinician (CS) at every visit. Table 4 describes the order, timing, and frequency of the standardised physical exam used for both the intervention and control groups, which has been used in other clinical studies (Godbout et al. Reference Godbout, Palestrini, Beauchamp and Frank2007; Hauser et al. Reference Hauser, Campbell, Korpivaara, Stefanovski, Quinlan and Siracusa2020; Korpivaara et al. Reference Korpivaara, Huhtinen, Aspegrén and Overall2021). During the exam in the intervention group, a blue mat was provided for the dog’s use and Lickmat® with treats (cream cheese or Kong® cheese spray) was provided during the exam and venipuncture. Other treats offered throughout included string cheese, dehydrated liver treats, or hypoallergenic treats, depending on individual preference. The blue mat and Lickimat® were sent home with the dogs in the intervention group, so the owners could practice their physical exam procedure homework.
Exam structure — including order, and timing or frequency — used for dogs (n = 28) in the intervention (n = 14) and control (n = 14) groups at each of four visits (Korpivaara et al. Reference Korpivaara, Huhtinen, Aspegrén and Overall2021). Numbers (1 through 15) are later referred to as different steps in the exam

To obtain laboratory samples, dogs in the control group underwent routine venipuncture (using either saphenous or cephalic veins) involving physically holding off a vein and whole body-restraint (i.e. holding when standing or when lying in lateral recumbence). Blood was taken with a needle and Luer-lock syringe without the application of lidocaine. Since it was difficult to find a cream that felt or smelled to us like the 2.5% lidocaine/2.5% prilocaine cream (EMLA® cream) used for the dogs in the intervention group, the fur was rubbed over the area of both saphenous and cephalic veins as exam step 3 for the control dogs to mimic the effects of applying the lidocaine cream. For dogs in the intervention group, a researcher wearing gloves applied 2.5% lidocaine/2.5% prilocaine cream by rubbing it over the area of both saphenous and cephalic veins as in exam step 3. Additionally, dogs in the intervention group had blood taken with low-to-no restraint, using a butterfly vacuette, double-ended closed system catheter that did not require that the vein be held off, and in an adaptive manner that allowed them to choose their posture while they were licking a Lickimat®. Owners were present for both the physical exam and blood draw in both groups and sat in one of the two chairs available. In the intervention group, owners were given the option to hold the Lickimat® for their pet or leave it on the mat on the floor. Owners were allowed to assist with gentle restraint (e.g. holding a collar/leash or petting the dog’s head) in both groups if they felt comfortable/wanted to assist. Photographs of physical examination set-up and restraint methods have been published elsewhere (Squair et al. Reference Squair, Proudfoot, Montelpare and Overall2023).
Following each visit the investigators offered dogs a treat (dehydrated liver, string cheese, or a hypoallergenic treat) once they were in the parking lot to determine whether the groups responded differently after their veterinary visit experience was completed (yes or no). Each of the 14 dogs in each group had four opportunities for parking lot treats. This step was added based on the findings of Lind et al. (Reference Lind, Hydbring-Sandberg, Forkman and Keeling2017) that dogs that refused treats when in the hospital, willingly took them when outside the clinical environment.
Clinical stress scores
To estimate if dogs experienced fear or distress during the visit, a series of in-person and video measures were used to assess the dogs’ behaviour at each visit. All dogs were evaluated for their behavioural response using a six-point ordinal scale: 1 = calm; 5 = profound avoidance and distress, with 0 denoting excitement without distress (see Table 5 for the scale used at different stages of the veterinary exam). Dogs were scored as they entered the veterinary hospital, walked onto the scale, crossed the threshold into the examination room, and at the beginning and the end of the examination (Table 5). The ‘entry to clinic’ score was taken as the dog crossed the threshold of entry doors with both front legs. The ‘weighing the dog’ score was taken when all four feet were on the scale and the dog stayed on long enough for a weight to be obtained. Weighing occurred on the way into the exam room for the control group, whereas for the intervention it occurred following the exam and blood draw as the dog was exiting the exam room. The ‘entering the exam room score’ was taken when the dogs’ full weight on their first paw crossed the threshold into the exam room. The ‘beginning and the end of the exam’ score was taken as the experimenter first touched the dog (beginning) and as they told the dog he or she was good (end).
Four clinic stress scales used to score behaviour of dogs (n = 28) within control (n = 14) and intervention (n = 14) groups for four specific events (entering the clinic, stepping onto the scale, entering the exam room, and at the beginning and end of the physical exam) at each of four visits (adapted from Overall Reference Overall2013b)

Whether dogs took a treat in the parking lot at the end of the visit (yes or no) was evaluated. In-person measurements and camera management were performed by KLO and/or 1–3 trained observers. Three video cameras (one Sony 4K FDR-AX43 and two Sony Handicams HDR-CX405) — two on tripods and one hand-held — were used for video analysis. One tripod camera was used to record dogs entering the hospital and when being weighed, and all three cameras were used to record the dog entering the exam room and during examination and blood draw. Figure 1 illustrates a schematic of the exam room and camera set-up. Videos were analysed by CS and a trained veterinary student.
Schematic of examination room set-up used to assess the dogs (n = 28) at each of four visits (m: meters). Cameras (cam) 1 and 2 were stationed on tripods. Camera 3 was hand-held to be able to fully assess the close up view of the dogs’ facial features.

Descriptive behaviour
In addition to the clinical stress scales, a descriptive ethogram was used to subjectively assess the behaviour of dogs at each step of the physical examination (see Table 4) during visits 1 and 4. A score ranging from 1–5 was assigned for (i) body posture, (ii) tail posture, (iii) ear posture, (iv) gaze, (v) mouth posture, (vi) activity and (vii) vocalisation for each step of the exam for visits 1 and 4 (Table 6). Two categories from the ethogram were omitted from the final analysis: pupillary changes and respiration. Pupillary changes could not be adequately visualised in most dogs to score them and, as noted in Squair et al. (Reference Squair, Proudfoot, Montelpare and Overall2023), the ambient temperature in the exam room, given that this study was done in summer and early autumn, did not allow for the use of respiration as a measure in any context. Mean stress scores were derived by summing individual scores for regions and behaviours commonly noted to be indicative of fear/stress responses during each step of the physical examination. Table 6 shows the ethogram scale used, an evaluation of a series of body parts commonly assessed for signaling anxious or fearful responses in dogs (adapted from Overall Reference Overall2013b; Korpivaara et al. Reference Korpivaara, Huhtinen, Aspegrén and Overall2021; Jokela et al. Reference Jokela, Mercier, Honeckman, Dunham and Overall2023). The ethogram scores for each of the eleven steps of the physical exam were only determined by video assessment. Two trained observers evaluated the ethogram scores of the dogs across the eleven steps of the physical examination and all scoring of all body regions: one was the investigator (CS) and another was a student, both masked to the visit number and group assignment. An overlap of 10% of the data were scored by both raters. Since Spearman’s rho, an indication of concordance in scoring, was extremely high, rs (254) = 0.94; P < 0.001, the student completed the remaining scaled ethogram scores.
Ethogram scale for evaluating body regions and behaviours commonly noted to be indicative of fear/stress responses in dogs. This scale was used for video scoring behaviour of dogs (n = 28) undergoing each step of the exam in Table 4

Time to get onto the scale to be weighed was measured from when the cue from the camera operator (if a verbal cue was not heard on video, time was calculated from when the dog entered the frame) to when all four paws were on the scale (when a successful weight could be obtained).
Behaviour during venipuncture was assessed using clinical stress scale 4 and time for the procedure in seconds. Both assessments were carried out using video analysis. Time for venipuncture was measured from when the needle first entered the skin to the needle exiting the skin following successful blood collection. Due to constraints of visibility on video, there were usable data for scores for only nine dogs in the control group and nine in the intervention group, and usable data for time measurement for ten dogs in the control group and nine in the intervention group. A priori it was specified that there would be a maximum of three sticks in two legs (three received lidocaine cream) so this time estimate is a very rough gauge of the time required for all the machinations (including giving the dog a break or getting a new syringe or needle) needed to obtain the sample.
Statistical analysis
Interval data were analysed using two-way (visit × treatment) repeated measures ANOVAs and independent samples t-tests. Ordinal data were analysed using Mann-Whitney U and Spearman rho, and nominal data were analysed using Chi-squared goodness of fit test and the Fisher exact test. The specific tests used are described for each measurement as follows.
All categories for the WDQ-Pet were compared for dogs in the control and intervention groups using parametric or non-parametric tests as appropriate. Clinical stress scores obtained from in-person observation and video assessments were compared using Spearman’s rho, a measure of concordance. In-person scoring was used to assess behaviour when dogs entered the clinic. Since there was some overlapping of the benchmarks for the rating scales, it is likely that the scoring was not truly discrete, so the ordinal data were usually treated as continuous (Norman Reference Norman2010; Sullivan & Artino Reference Sullivan and Artino2013). Scoring via video analysis was used to assess behaviour when weighed and during the physical exam and venipuncture. This was to ensure that multiple camera views could be used to see the entire dog, if needed. Video analysis was also used to measure duration when weighed, examined, and during venipuncture. Video analysis was used to determine clinic stress score for entry into the exam room, at the start and end of the physical examination, for ethogram physical exam scores, and during venipuncture. In-person scores were used when assessing dogs’ entry into the clinic.
In addition to clinic stress scores, video analysis was also used to assess how long it took for the dog to successfully be weighed. To determine whether dogs were less stressed on their fourth visit compared with visit 1 (baseline) for any procedure, we converted raw data to nominal (Yes/No: did the score for behaviour stay the same, increase, or decrease). Each dog was assigned to either one of two categories (e.g. at visit 4 was their score lower or same/higher when compared to their score at visit 1). Intervention clinical stress scores when entering the clinic (Scale 1), being weighed (Scale 2), crossing the threshold into the examination room (Scale 3), and behavioural scores at the beginning and the end of the exam (Scale 4) were compared to control scores using a Chi-squared goodness-of-fit test.
A total examination ethogram stress score was obtained by summing the scores across all categories and steps of the exam. With the ethologically benchmarked scoring system in Table 6, Mann-Whitney U tests (two-tailed) compared control vs intervention groups for each part of the physical exam during visit 1 and visit 4.
The time (s) required to complete each step (1–11) of the physical examination, (recorded and summed to reflect the total time required to examine the dog), and the total time (s) elapsed from the start to the end of the physical examination were analysed using a two-way repeated measures ANOVA (visit × treatment). This total elapsed time included the pauses and breaks between steps of the physical examination.
Control and intervention venipuncture scores were compared (between groups and across time) using independent samples t-tests. Mann-Whitney U tests (two-tailed) compared the time to obtain a blood sample across groups and visits.
Results
Demographics and historical behaviour
Of the 58 categories, only two (one demographic and one behavioural response) showed a significant difference between the groups. Despite the randomisation protocol, the control group had more females (FI + FS) than males (MI + MC) and the intervention group having more males (MI + MC) than females (FI + FS) (Fisher exact test statistic 0.0213; P < 0.05).
The time spent to react when humans were squatted quietly in front of the dogs while holding a toy or treat was the only situation where dogs from the control and intervention groups differed in responses (t[26] = –3.33; P = 0.0026). The dogs in the intervention group watched the human for at least 30 s and those in the control group watched for at least 60 s. No differences between the groups were found when the human was standing instead of squatting quietly in front of the dogs while holding a toy or treat (t[26] = –2.020; P = 0.054).
Comparison of in-person and video scores
One in-person score was missing for dog 20 at visit 1. Concordance between the in-person and video clinical stress scores when dogs entered the exam room was rs (109) = 0.406; P < 0.001. For the start of the physical exam (one in-person score was missing for dog 12 at visit 3 and dog 9 at visit 4), rs was (108) = 0.586; P < 0.001. For the end of the physical examination (one in-person score was missing for dog 5 at visit 3, and two scores – dogs 9 and 13 – were missing for the in-person assessment at visit 4), rs was (107) = 0.443; P < 0.001.
Clinical stress scores
Entry to the clinic
In-person clinical stress scores for entering the building (Table 5; Clinic stress scale 1) across visits decreased for 21.4% (3), did not change for 57.1% (8) and increased for 21.4% (3) of the dogs, respectively. Scores between visits 1 and 4 in the intervention group decreased for 28.6% (4), remained unchanged for 42.9% (6), and increased for 28.6% (4) of the dogs, respectively. A Chi-squared test showed no significant difference between the behaviour of the control vs intervention group across visits for entering the building (χ2 (1, n = 28) = 0.190; P > 0.05) (Figure 2).
Difference in visits 1 and 4 clinical stress score when dogs (n = 28) entered the building. No significant difference appreciated between intervention (n = 14) and control (n = 14) groups. Numbers above the bars are dogs in each group that fell within each category.

Weighing the dog
The distribution of dogs needing various steps for weighing, by group, is shown in Table 7. There was no difference in distribution of steps needed between groups at the first visit (χ2[1,54] = 2.571; P = 0.46).
Level of scale intervention that allowed intervention (n = 14) and control (n = 14) dogs to be weighed. No difference in distribution of scale interventions (steps) between groups at visit 1. Step 1 = bare, metal scale, flush against the wall without a lure; Step 2 = sequential addition of a blue yoga mat; Step 3 = then also moving the scale with the mat from the wall; Step 4 = adding a treat

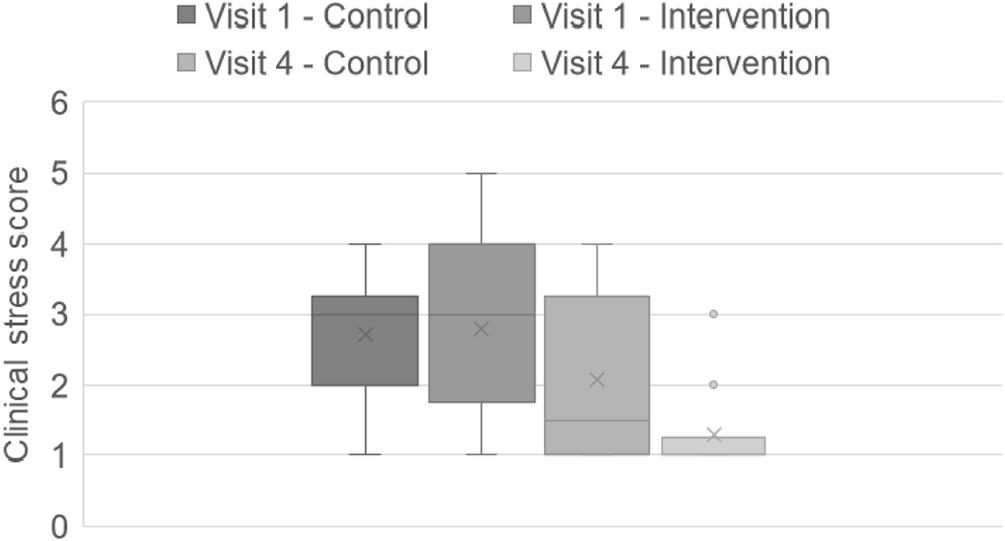
There was also no significant difference between the control and intervention group for clinical stress scores at visit 1 when weighing the dog (t-test; t[26] = –0.16; P = 0.87). Both groups decreased their clinical stress scores when being weighed between visits 1 and 4 (Control group: t[26] = –2.22; P = 0.022, one-tailed; Intervention group: t-test; t[26] = –4.58, one-tailed; P = 0.00026). However, at visit 4, dogs in the intervention group had a considerably lower score compared to those in the control (t[26] = 2.087; P = 0.023, one-tailed). The effect size for this finding was considerable (Cohen’s d = 0.79) (Figure 3[a]).
Video clinical stress scores once dogs (n = 28) were weighed on the scale at visits 1 and 4. No significant difference in scores between groups at visit 1; however, at visit 4 intervention (n = 14) scores were significantly lower compared to control (n = 14). The box and whisker plots show the means (x), the medians (lines), and the values for 75% of index scores (whiskers) for each group.
Time for all four feet to rest on the scale for an accurate weight was obtained via video footage. These times across visits did not differ between groups (t[28] = –0.60; P = 0.55). Time to successfully obtain a weight decreased in both the control and intervention groups across visits (Control group: one-tailed t-test; t[28] = –2.60; P = 0.011; Intervention group: one-tailed t-test; t[28] = –3.57; P = 0.0008). There was no difference between groups in the reduction of time it took to successfully walk onto the scale by visit 4 (t[28] = –1.74; P = 0.09) (Figure 3[b]).
Time (min) to get all four feet onto the scale to be weighed across visits and groups. Dogs (n = 28) within intervention (n = 14) and control (n = 14) groups both decreased the amount of time it took to get an accurate weight, with no significant difference between groups for overall time, and reduction in time across visits. The box and whisker plots show the means (x), the medians (lines), and the values for 75% of index scores (whiskers) for each group.

Entering the exam room
A Chi-squared test showed no significant difference between the video clinical stress scores of the control vs intervention group across visits 1 and 4 with respect to entering the exam room (χ2[1, n = 28] = 3.59; P > 0.05).
Beginning of the physical exam
A Chi-squared test showed a significant difference between the behaviour of the control vs intervention group between visits 1 and 4 with respect to the start of the physical exam (χ2[1, n = 28) = 5.60; P = 0.018) (Figure 4). At the start of the physical examination, control clinical stress scores decreased across visits for 14.3% (n = 2), did not change for 64.3% (n = 9) and increased for 21.4% (n = 3) of the dogs, respectively. In the intervention group, scores between visits 1 and 4 decreased for 57.1% (n = 8), remained unchanged for 35.7% (n = 5), and increased for 7.1% (n = 1), of the dogs, respectively. In the control group, of the nine scores that were unchanged, only two were for scores of 1 – the lowest score possible – at visit 1. The other seven unchanged scores in the control group represented a lack of improvement with time. One dog in the control group worsened with time with respect to the scoring of behaviour at the start of the physical exam. In the intervention group, of the five scores that were unchanged, all had scores of 1 (the lowest score) at visit 1.
Clinical stress score changes across visits at the start of the exam for dogs (n = 28) within intervention (n = 14) and control (n = 14) groups. Change in behaviour from visits 1 to 4 at the start of the exam is significantly different between intervention and control. Numbers above the bars represent the number of dogs in each group. * Represents the significant effect of clinical stress scores that did not change/decrease in the control group (P = 0.018).

End of the physical exam
A Chi-squared test showed a significant difference between the behaviour of the control vs intervention group between visits 1 and 4 with respect to the end of the physical exam (χ2[1, n = 28) = 7.036; P = 0.008) (Figure 5). At the end of the physical examination, the control group clinical stress scores decreased for 28.6% (n = 4), did not change for 42.9% (n = 6) and increased for 28.6% (n = 4) of the dogs, between visits 1 and 4, respectively. In the intervention group, scores between visits 1 and 4 decreased for 79.0% (n = 11), remained unchanged for 21.0% (n = 3), and increased for 0% (n = 0) of the dogs.
Clinical stress score changes across visits at the end of the exam for dogs (n = 28) within intervention (n = 14) and control (n = 14) groups. Change in behaviour from visits 1 to 4 at the end of the exam is significantly different between intervention and control. Numbers above the bars represent the number of dogs in each group. * Represents the significant effect of decreased clinical stress in the intervention group (P = 0.008).

Descriptive behaviour
No differences were found between the behaviour of dogs from each group for any step of the physical exam during visit 1. However, at visit 4, dogs in the intervention group had significantly lower ethogram behavioural scores at Step 1 of the physical exam when the dog was stroked gently from head to base of tail (P = 0.048), when manually manipulating lymph nodes (Step 5; submandibular, prescapular, popliteal) (P = 0.020), during gentle abdominal palpation (Step 6) (P = 0.024), while lifting each paw for testing placement (Step 7) (P = 0.002), when lifting the upper lips (Step 8) (P = 0.024), and during an examination of the eyes (Step 11; conjunctiva; cornea) (P = 0.018) when compared to dogs in the control group. Starting at Step 5, the majority of the physical examination, except for manipulation of the ears and ear temperature, had lower stress scores at visit 4 in the intervention group. The total ethogram stress score during the examination for dogs in the intervention group was significantly lower than that for dogs in the control group on visit 4 (P = 0.030) (see Table 8).
Behavioural scores for body regions and behaviours of dogs (n = 28) indicative of fear/stress responses during each step of the physical examination. At visit 4, intervention (n = 14) behavioural scores were significantly lower than control (n = 14) at Steps 1, 5, 6, 7, 8, and 11, in addition to a significantly lower total comprehensive stress score. Exam Stages = Sequential steps of the physical examination performed on each dog (see Table 3 for details of each step); N = number; IQR = Interquartile Range; r = effect size (Rank biserial correlation). * P < 0.05 compared to control, with exam step highlighted. P-values reported only for significant findings

Duration of time to examine the dog
For the total time to examine the dog, no significant main effects were found for visit (F[1,15] = 1.01; P = 0.33) or for treatment (F[1,15] = 3.40; P = 0.085), nor was an interaction between variables present (F[1,15] = 1.63; P = 0.22).
Total duration of time to complete physical examination
For the total time to complete the physical examination, significant main effects were found for visit (F[1,20] = 5.15; P = 0.034) and for treatment (F[1, 20] = 4.78; P = 0.041). A significant visit × treatment interaction was also present (F[1,20] = 11.53; P = 0.003) (Figure 6). Time to complete the exam was less for visit 4 than for visit 1 for dogs in the control group, but greater than visit 1 for dogs in the intervention group. When time to complete the physical examination at visit 4 was compared, dogs in the intervention group had longer exams compared to those in the control group (t[20] = –4.130, ptukey = 0.003). The difference between visits 1 and 4 was an average decrement of 30 s for control group dogs (average time of exam at visit 4 = 321 s, or roughly 5 min), and an average increase of 139.4 s (2.5 min) for intervention group dogs (average time of exam at visit 4 = 468 s, or roughly 8 min), which included pauses to adapt to the dog’s behaviour.
Time (s) to complete the physical exam. Time to complete the physical exam at visit 4 was significantly longer for dogs in the intervention group (n = 14) compared to the control (n = 14). Values represent mean (± SEM). * Denotes significant difference (P = 0.003; see text).

Venipuncture
Scores for venipuncture are graphed in Figure 7(a). As the scorer had to be able to see the needle both enter and exit the vein after the sample was obtained to determine time elapsed, some dogs were lost from our sample. The control group did not differ from the intervention group for scores at visit 1 (t[18] = 0.3133; P = 0.76). The intervention group score was not significantly different for visits 1 and 4 (t[18] = –0.16; P = 0.44, one-tailed), but the control group score significantly increased between visits 1 and 4 (t[18] = 2.29; P = 0.025, one-tailed). Accordingly, when comparing the scores for visit 4, the intervention group showed significantly lower scores than the control group (t[18] = 1.912; P = 0.037, one-tailed).
Venipuncture video behaviour scores across visits for dogs (n = 18) within intervention (n = 9) and control (n = 9) groups. No significant differences were observed between intervention and control scores at visit 1. Across visits, no significant difference in intervention scores, but control scores significantly increased. Visit 4 intervention scores were significantly lower than the control. The box and whisker plots show the means (x), medians (lines), and the values for 75% of index scores (whiskers) for each group.

There were no significant pair-wise comparisons across group or visit for time to obtain blood sample (Mann-Whitney U test: control vs intervention visit 1 (P = 0.81); control visit 1 vs 4 (P = 0.41); intervention visit 1 vs 4 (P = 0.154); control vs intervention visit 4 (P = 0.052). However, when assessing how many dogs in each group (control vs intervention) experienced a decrease in the amount of time necessary for venipuncture from visit 1 to 4, only 2/10 control dogs experienced decreased time for venipuncture, but 6/9 dogs in the intervention group did so (z = –2.057; P = 0.02) (Figure 7[b]).
Time (s) for blood to be drawn across visits for dogs (n = 19) within intervention (n = 9) and control (n = 10) groups. No significant difference across visits or group for time to obtain a blood sample; however, significantly more intervention dogs (6/9) had a reduction in time from visits 1 to 4 compared to control dogs (2/10). The box and whisker plots show the means (x), medians (lines), and the values for 75% of index scores (whiskers) for each group.

Taking a treat in the parking lot at the end of the visit
None of the dogs in the control group declined a treat on any visit (56/56 treat opportunities accepted). One dog in the intervention group declined a parking lot treat on all four visits, and one declined a treat at visit 3, only (52/56 treat opportunities accepted). There was no difference between the groups in treat acceptance (Fisher exact test; P = 0.12), despite the provisioning of treats to dogs in the intervention group at most of the major stages of the experimental process.
Discussion
Our study objectives were to compare the control and intervention group for differences in outcomes using two different handling protocols. To do this, we used both WDQ-Pet scores and the in-person and video scoring of behavioural responses, with the intent to ultimately determine the effect of targeted interventions on behaviours indicating fear and/or distress in canine patients during veterinary procedures. Numerous studies have evaluated the effect veterinary procedures and exams have on canine patients (Hernander Reference Hernander2008; Döring et al. Reference Döring, Roscher, Scheipl, Küchenhoff and Erhard2009; Mariti et al. Reference Mariti, Pierantoni, Sighieri and Gazzano2017; Stellato et al. Reference Stellato, Hoffman, Gowland, Dewey, Widowski and Niel2019a). The literature assessing the application of low-stress interventions during veterinary visits and how these may affect canine patients’ responses to veterinary care is not as robust and only subsets of collaborative care have previously been investigated in dogs. Van Oostrom and Knowles (Reference van Oostrom and Knowles2018) found that applying topical analgesia prior to venipuncture decreased stress-related behaviours including withdrawal and/or defensive movements. Stellato et al. (Reference Stellato, Jajou, Dewey, Widowski and Niel2019b) and Wess et al. (Reference Wess, Böhm, Schützinger, Riemer, Yee, Affenzeller and Arhant2022) found only mild effects of practising physical exam steps at home, but these studies used only two visits, a baseline and intervention visit. Changing behaviour takes time and these designs did not test what could happen over time with enhanced exposure and practice which is, after all, what we expose dogs to in fearful veterinary circumstances and one reason why they worsen with frequency of visits (Döring et al. Reference Döring, Roscher, Scheipl, Küchenhoff and Erhard2009; Stellato et al. Reference Stellato, Flint, Dewey, Widowski and Niel2021). Finally, dogs were more willing to approach and take treats from a veterinarian not wearing a white laboratory coat than one not doing so (Fanucchi Reference Fanucchi2022). Dogs do not experience the components of a physical exam as individual stressors. All components interact to shape the dog’s final response to veterinary care. To the authors’ knowledge, no other study has investigated the combined effect of multiple low-stress handling techniques in canine patients over time.
The WDQ-Pet questionnaire was used to assess whether dogs were randomly assigned to each group with respect to their behavioural profiles entering the study. Of the 58 demographic and behavioural categories assessed by the WDQ-Pet (the aggression and fear screens each have 53 categories of assessment that sum to a final score), 56 did not differ between the control and intervention groups. Despite an adequate randomisation protocol, dogs in the intervention group were overwhelmingly male (n = 11/14) while dogs in the control group were overwhelmingly female (n = 9/14). Rare statistical findings are, by their very nature, rare. This rare outcome prohibited the investigation of any putative effects of sex on outcomes. However, the WDQ-Pet is an extremely detailed and robust assessment tool for general behaviours of dogs across broad categories and specific behaviours in provocative categories (e.g. walking in the rain, experiencing an unpredictable loud noise), and these groups of dogs – despite the sex distribution – did not differ in their scores for aggression, fear, environmental reactivity, reactivity during training, or SAIR (Separation Anxiety Intensity Rank) or AIR (Anxiety Intensity Rank) scores, suggesting that there were no effects of sex on these historical behaviours.
For no behavioural category was there any difference between the dogs in the control and intervention group except when a human crouched in front of the dog with a treat or toy. In an assessment of 58 broad categories, it is unlikely that a difference in focus when crouched (but not standing) of 30 s (over a range of times of 0 s/does not focus, a few seconds, 10 s, 30 s, 60 s, more than 60 s) in one setting would be clinically meaningful. While few studies examine behavioural histories and patterns of dogs entering into experiments with this degree of rigor, it is safe to say that with the exception of the statistically significant but rare finding of differences in each sex by group, the two groups were well randomised and evenly distributed in terms of demographics, training history, and historical behavioural and environmental responses when entering the study.
In-person assessments of the various clinic stress level scores correlated with the scores taken from the videos with at least moderate concordance. If the veterinary team pays attention, standardises their assessment (e.g. one front paw fully in the room across the threshold) and sets the criteria amongst themselves, they will be able to gain valuable information about dogs’ responses to specific clinical stressors just using a tick-sheet. This is valuable and practical knowledge for those wishing to integrate these findings into their daily practice.
There were no differences between the control and intervention groups entering the hospital and the exam room between visits 1 and 4, and these scores were relatively low for most dogs. However, there were significant, and likely behaviourally important, differences across time for the groups for stress assessments made both at the beginning and end of the exam. Intervention dogs had lower exam clinical stress scores across visits and were more likely to decrease their scores over time at both the start and end of the exam compared to control dogs. This finding shows a clear effect of the altered physical and behavioural approach that an adaptive, collaborative examination entails. That the score at the beginning of the exam was significantly lower at visit 4 suggests that dogs in the intervention group were not anticipating an unpleasant experience. That intervention group scores were lower at the end of the exam at visit 4 suggests that dogs did not have an unpleasant experience.
Obtaining a weight may be viewed as a benign procedure; however, this human viewpoint may differ from what the dog experiences. Instead, we should consider that weighing the dog may be the first manipulation where dogs begin to exhibit behaviours associated with responses to stressors (Hernander Reference Hernander2008). Stressors are additive and the longer we can delay their appearance and the more we can lower their effects, the better for our patients (Main Reference Main2022).
Measurements of how long it took for a veterinarian to perform a task are often used as indicators of how easy it was to ostensibly accomplish the task. Stress scores, on the other hand, indicate how easy it was for the dog to experience to experience the task. Here, both groups had a reduction in the time it took to obtain an accurate weight from visits 1–4, with no difference in the time decrement by visit 4. The lack of time difference at visit 4 suggests that the adaptive, step-wise design we used for weighing dogs in the control group helped to ensure that they successfully went onto the scale. Interestingly, dogs in the control group may have needed additional interventions to be weighed across all four visits but the intervention was always at an equal or lower step level (1–4) than it was at visit 1. When assessing the initial stress scores for dogs in the intervention and control groups, no difference was found between groups when being weighed or in the number of step-wise interventions needed to get them to the point of being weighed at visit 1. When being weighed, dogs in both groups experienced a decrease in their recorded stress scores from visits 1 to 4; however, dogs in the intervention group had a high probability of a significantly lower clinical stress score at visit 4 than dogs in the control group. Furthermore, the effect size of this result is substantial. That the control group complied with being weighed and in the same time as the intervention group by visit 4, but had higher stress scores at visit 4 than those in the intervention group (Figure 4), is a cautionary warning to the veterinary staff. While time may be related to money and how rushed staff feel, it is critical to assess not just that the patient is complying, but also how the patient views the cost of that compliance. Clearly, the dogs in the intervention group experienced less stress being weighed at the last visit, although time costs to staff of weighing dogs in both groups was the same here. If dogs become more fearful across visits, the cost of procedures to the veterinary staff in the currencies of time and job satisfaction may increase. These data show that this pattern need not be the case. In fact, one dog in the intervention group who had been reluctant to be weighed at the first visit, bounded onto the scale at the last visit and when told he was done, did it again (see supplementary video in Supplementary materials).
We cannot know whether the relatively high stress scores shown by dogs in the control group at visit 4 are due to the placement of the weighing procedure prior to the physical examination or due to the overall, unrelieved stress level of the examination associated with standard handling. The combination of outcomes suggests that when the veterinary staff change their behaviours to respond to the dog’s signals and needs, everyone benefits.
Both venipuncture and physical exam assessments had a lack of continuous, interpretable video for some dogs. This was a field study and, as such, showed inherent limitations.
The assessment of time and benchmarked, ethogram stress scores during the step-wise physical examination were revealing. While dogs in the control group did not differ from those in the intervention group at visit 1, in terms of time to complete the physical examination, changes were seen by visit 4 that depended on both treatment and visit. Dogs in the control group experienced less change when comparing the total elapsed time for physical exam between visits 1 and 4, with an average decrease of 30 s in the time for the exam. In contrast, dogs in the intervention group experienced an average increase of 139 s (2.5 min) in the time for the exam across visits. Since pauses between exam steps were included in the measurement of time for the complete physical exam, it is likely this increase in time for the dogs in the intervention group reflected the adaptive nature of a truly collaborative exam.
Pairing these data with those from the benchmarked, ethogram stress assessment of the step-wise and total stress scores for the exam reveals an important pattern. While the exam may have taken longer for dogs in the intervention group, the total ethogram stress score for the combined steps of the exam for dogs in the intervention group was significantly lower than that for dogs in the control group on visit 4. Furthermore, when the individual steps of exam were analysed with respect to the ethogram stress scores, dogs in the intervention group at visit 4 had significantly lower stress scores when stroked gently from head to base of tail, when palpating lymph nodes, during gentle abdominal palpation, while lifting each paw for testing placement, when lifting the upper lips, and during an examination of the eyes (conjunctiva; cornea) compared to dogs in the control group. Starting at step 5, the majority of the steps in the physical examination had lower stress scores at visit 4 in the intervention vs the control group. This finding is somewhat surprising with respect to lifting the paws, given the results of another study (Jokela et al. Reference Jokela, Mercier, Honeckman, Dunham and Overall2023) that found picking up of feet to be provocative for a large number of dogs.
Venipuncture is a potentially aversive and stressful procedure for dogs (Chebroux et al. Reference Chebroux, Leece and Brearley2015; van Oostrom & Knowles Reference van Oostrom and Knowles2018) and, by extension, may be upsetting for their owners and the veterinary team. Generally, more than one veterinary team member is required, dogs’ veins are held off physically with a tourniquet or by hand, and the dog is physically restrained so that they cannot move. No topical anaesthetic is generally used. This description matches the methodology used here for the control group. When scores at the end of the venipuncture procedure were compared, the intervention group had significantly lower scores than the control group at visit 4, but due to a significant increase in scores for the control group between visits 1 and 4. These data may indicate that dogs in the control group became increasingly sensitised to the entire examination and venipuncture procedure, a finding that our physiology data, and specifically the stress response index evaluating heart rate, serum cortisol and neutrophil lymphocyte ratio, also suggested (Squair et al. Reference Squair, Proudfoot, Montelpare and Overall2023).
The amount of time from inserting the needle to removing it after the sample is obtained is a rough, but informative estimate of how many adjustments and steps were needed by the veterinary team to obtain the sample from the dog. While the control group experienced standard hospital procedures, there was also an effort to use no force beyond mild restraint, and instead readjust the behaviour of the researchers conducting the visit. None of these dogs experienced extreme force when handling (such as multiple people forcibly holding them down). It is interesting that, regarding time, there were no significant pair-wise comparisons across group or visit, but when number of dogs experiencing decreased venipuncture times at visit 4 was compared with visit 1, the intervention group dogs were strongly favoured. Given the small sample size, caution in interpreting this significant result is urged, but it may be a good representation of how the dogs perceived the combined exam and venipuncture strategies. Neither initial scores nor times for venipuncture differed between groups, suggesting that this result was due to the differential handling and not prior experience. Additionally, the results suggest that using the intervention approach for drawing blood is viewed more favourably by the dog, while not taking more time for the veterinary staff compared to standard methods. It is also important to remember that venipuncture was the last procedure that the dogs experienced prior to being petted, told they were good, and offered a treat. As such, it may represent a cumulative effect of the entire experience for the dog and may have taken a borderline concerned dog and pushed him or her into the realm of a greater stress and distress response.
Study limitations
There are limitations to this type of study, which include the inability to be completely blinded. While the human participants did not witness other owners’ tests, there were physical differences in the study protocol (e.g. white coats, blue mats, Lickimats®, techniques for drawing blood) which indicated assignment group and could have been informative to participants. As far as was possible great care was taken to blind researchers and limit bias. The laboratory technicians who processed the blood samples were blinded to the group status of the samples. The student who helped analyse videos was blinded to treatment and the order of the videos and had not been involved in the study. Videos were coded so that the order of the visits was not known. Additionally, the owners did not know what group they were in until the end of the study and many of them in each group were surprised when we unblinded their dog’s group for them.
This was a ‘real-world’ field study, and these can be difficult to manage since owners and patients are involved and the situation within which behaviours are being evaluated remains dynamic. The intensive nature of the evaluations means sample sizes are small, and they became smaller videos were being relied upon because, despite three cameras being available, continuous observations were not possible. This is especially true for the data on venipuncture, a very intimate procedure. While we found a significant difference between groups, the sample size is tiny and subject to errors of false attribution (Type I error). Such results would require to be replicated in larger studies to have any stand-alone meaning. However, as one part of a study that evaluated numerous aspects of the dogs’ responses to stressors, it is helpful to note that even the venipuncture measures follow the same direction of significance as the other measures. While one should worry were this not the case, it is reassuring that even the messiest measures converged into the same pattern.
Animal welfare implications and conclusion
Within veterinary medicine, signs of fear and distress have been normalised, which negatively affects the patients’ care, health, and welfare. The behaviour scores and ethogram score analysis described reveal a strong pattern of improvement in canine patients’ well-being when participating in collaborative care procedures. This data, combined with the physiological data previously published (Squair et al. Reference Squair, Proudfoot, Montelpare and Overall2023), strongly suggest that patients receiving low-stress interventions during veterinary visits have a greater reduction in stress responses over time compared to patients not experiencing those interventions. Overall, by meeting the patient’s needs, and reducing extraneous duress, there can be improvement in the welfare of dogs within the veterinary clinic setting. Furthermore, our findings have widespread implications for members of the veterinary community, revealing that simple adjustments made in handling patients, can lead to significant improvements in animals’ well-being during visits to the veterinarian. Ultimately, these changes result in providing an improved standard of care.
Supplementary material
The supplementary material for this article can be found at http://doi.org/10.1017/awf.2024.37.
Data availability statement
The data presented in this study are available on request from KLO. The data are not publicly available due to the ethical agreement with the participants that only anonymised, summary data would be publicly presented. Anyone wishing anonymised summary data can contact us.
Acknowledgements
The authors would like to thank Lickimat® for donating their product for this research study, and the student volunteers and summer research students for their assistance in the examinations and video recording. Tsukasa Iwamoto, an AVC veterinary student, helped analyse the video data when she was a summer VetSRA student with KLO’s group. We would also like to thank the dog owners and their dogs for their participation for this study.
This research was fully funded by a grant from the Sir James Dunn Animal Welfare Centre at the Atlantic Veterinary College to KLO (A615846). UPEI (including the G Murray and Hazel Scholarship and Zoetis Graduate Student Research Award), the American College of Veterinary Behaviorists (ACVB) Veterinary Behavior Symposium (VBS) (including the 2022 Fear Free Award and the 2023 RK Anderson Resident Award), and VIN provided additional support to CS through scholarships and grants.
Competing interest
None.


 Open access