





Introduction
Acute otitis media (AOM) is a leading cause for antibiotic prescriptions in children [Reference van den Broek d’Obrenan1], affecting up to 85% of children by 3 years old, with incidence peaking between 6 and 15 months [Reference Teele2]. The most frequently implicated bacterial pathobionts are Streptococcus pneumoniae, non-typeable Haemophilus influenzae, Moraxella catarrhalis, Staphylococcus aureus, and Streptococcus pyogenes [Reference Ngo3, Reference Hullegie4].
Around 15%–20% of children with AOM present with ear discharge (AOMd) [Reference Rovers5, Reference Smith6]. Dutch guidelines recommend oral amoxicillin as the first-line treatment for children in primary care with AOMd and ear pain and/or fever, with topical antibiotics considered should ear discharge persist after 1 week [7]. This latter recommendation is supported by indirect evidence from a Dutch trial demonstrating that hydrocortisone-bacitracin-colistin eardrops are more effective than oral amoxicillin-clavulanate suspension in children with acute ear discharge and ventilation tubes [Reference van Dongen8]. In contrast, the prematurely terminated Dutch PLOTS randomized trial in 58 children with AOMd, but without ventilation tubes, found faster symptom resolution, shorter duration of ear discharge, and lower mean ear pain scores with oral amoxicillin than with hydrocortisone-bacitracin-colistin eardrops [Reference Hullegie9]. However, fewer subsequent antibiotic courses and adverse events occurred in the eardrops group [Reference Hullegie9]. An English three-armed, individually randomized trial comparing ciprofloxacin eardrops, delayed amoxicillin suspension, and immediate amoxicillin suspension suggested similar symptom resolution times across groups[Reference Hay10].
Antibiotic exposure may alter the microbiome compositions of various body niches. The nasopharynx, connected to the middle ear through the Eustachian tube, may act as a reservoir for bacterial pathobionts capable of invading the middle ear in specific circumstances, resulting in AOM [Reference Pettigrew11, Reference Lieberthal12]. Antibiotic-induced disruption of the typically stable nasopharyngeal (NP) microbiome has been hypothesized to increase middle ear infection risk by promoting the colonization and/or outgrowth of pathobionts [Reference Man, de Steenhuijsen Piters and Bogaert13, Reference Thapa14]. Although often transient, NP dysbiosis – particularly reduced relative abundances (RAs) of Corynebacterium and Dolosigranulum sp. – has been associated with negative health outcomes in children, including increased viral infection risk [Reference Man, de Steenhuijsen Piters and Bogaert13, Reference Thapa14] and AOM [Reference Lappan15, Reference Folino16]. Antibiotics also affect the gut microbiota; early-life exposure is linked to reduced beneficial commensals (e.g., Bifidobacterium [Reference McDonnell17, Reference Elvers18] and Lactobacillus [Reference McDonnell17, Reference Moore and Townsend19]) and increased pathobionts (e.g., Escherichia coli) [Reference McDonnell17]. While the gut microbiome generally recovers after antibiotic treatment, even transient dysbiosis may have longer-term immunological consequences, including increased risk of developing metabolic and celiac diseases [Reference Dydensborg Sander20, Reference Wan21]. Therefore, antibiotics prescribed to target putative AOM-causative bacteria may also cause collateral damage to local microbiomes and promote induction of antibiotic resistance genes (ARGs) [Reference Hullegie4].
We sequenced middle ear fluid (MEF), NP, and faecal samples of children with AOMd enrolled in the PLOTS randomized trial comparing oral amoxicillin suspension and hydrocortisone-bacitracin-colistin eardrops [Reference Hullegie9, Reference Hullegie22]. Our aim was to evaluate and compare the impact of the eardrop and oral suspension treatments on the MEF, NP, and gut microbiome compositions at baseline, Week-2, and Month-3. We hypothesized that eardrop treatment might alter the middle ear and NP microbiomes, which are anatomically connected, but not the gut microbiome or resistome, whereas oral suspension treatment might alter all microbiomes and the gut resistome.
Methods
Study design
The PLOTS trial design and primary analysis results have been reported elsewhere, according to the CONSORT statement [Reference Hullegie9, Reference Hullegie22]. The primary manuscript reported clinical endpoints and did not include any sequencing data. This paper reports on secondary analyses of sequencing data. Between December 2017 and February 2023, children aged 6 months to 12 years presenting to their general practitioner with AOMd, and ear pain or/or fever, were eligible for trial participation. Children were randomized to either oral amoxicillin suspension (Sandoz B.V., 50 mg/kg of body weight per day, divided over three doses) or hydrocortisone-bacitracin-colistin eardrops (Daleco Pharma B.V., five drops three times daily) for 7 days. Children who received antibiotics in the 2 weeks prior to screening were excluded. The study was approved by the NedMec medical ethics committee in Utrecht, The Netherlands (NedMec protocol number 17–400/G-M).
Sample collection
MEF and NP samples were collected at baseline (prior to randomization) and at Week-2 (1 week after treatment cessation) by a trained trial physician during a home visit using a flexible applicator swab with a flocked nylon-fibre tip (ESwab, Copan Diagnostics Inc., Murrieta, CA). They were transported by the study team to the University Medical Center Utrecht (UMCU) microbiology laboratory on the day of collection or occasionally the day thereafter. Faecal samples were collected by a parent at baseline, Week-2, and Month-3, using the OMNIgene·GUT (OMR-200) system (marketed by DNA Genotek Inc., Ottawa, Canada) and mailed to the UMCU microbiology laboratory. These samples arrived in the laboratory in a median of 2 days (interquartile range: 1–5 days). Laboratory staff processed the samples on the day of receipt or the day thereafter, and stored them at −80 °C. MEF and NP samples were sequenced (16S rRNA amplicon sequencing) at the National Institute for Public Health and the Environment (RIVM, Bilthoven, the Netherlands), and faecal samples (metagenomic sequencing) at the Utrecht Sequencing Facility (USEQ, Utrecht, the Netherlands).
16S rRNA amplicon sequencing of NP and MEF samples
DNA extraction, 16S rRNA amplicon sequencing, and raw data processing of the NP and MEF samples were performed according to the protocol developed by Odendaal and colleagues [Reference Odendaal23]. DNA was extracted using the Mag Mini DNA isolation kit (ImmunoSource, Schilde, Belgium) based on a phenol-bead beating method. The V4 hypervariable region of the 16S rRNA gene was amplified using the 515F/806R primer pair [Reference Odendaal23, Reference Odendaal24], and sample libraries were sequenced on the Illumina MiSeq platform (Illumina Inc., San Diego, CA, USA) using the MiSeq reagent kit v3 (2 × 300 bp) [Reference Odendaal23, Reference Odendaal24]. The raw sequencing data were processed using the DADA2 R-package and annotated using the SILVA v138.2 reference database. The resulting amplicon sequence variant (ASV) table was manually cleaned, and ASVs were agglomerated to the genus level (further details are provided in the Methods section of Supplementary File 1).
The total 16S rRNA gene concentration in each NP and MEF sample (pg/ul) was determined via 16S rRNA qPCR using the StepOnePlus real-time PCR system (Thermo Fisher Scientific, Waltham, MA, USA) [Reference Odendaal23, Reference Odendaal24]. Bacterial taxa concentrations were estimated by multiplying the relative abundances (RAs) of each taxon in a sample by the total bacterial load concentration of that sample. The estimated concentrations (ECs) were log10-transformed.
We manually grouped NP and MEF ASVs into six bacterial groups at genus-level based on the published literature about middle ear and nasopharyngeal microbiome compositions [Reference Man, de Steenhuijsen Piters and Bogaert13, Reference De Boeck25–Reference Man27] and about common AOM pathobionts [Reference Ngo3, Reference Hullegie4]. The commensal Corynebacterium and Dolosigranulum genera were combined into a single bacterial group called symbionts. The next four bacterial groups each consisted of a well-known AOM pathobiont genus: Streptococcus, Haemophilus, Moraxella, and Turicella. The sixth bacterial group consisted of all remaining taxa, referred to as ‘other’. NP and MEF samples were tested for respiratory tract viruses using Multiplex real-time PCR assays (Allpex respiratory assays 1, 2 and 3, Seegene, Seoul, South Korea; Methods section of Supplementary File 1).
Metagenomic sequencing of faecal samples
DNA extraction was performed at the UMCU microbiology laboratory using the Agowa Mag DNA extraction kit (LGC genomics, Berlin, Germany). Sample libraries were prepared following Illumina’s DNA Nano library preparation protocol and sequenced using the Illumina NovaSeq 6000 with a 150 bp paired-end protocol at USEQ. Further experimental and quality control details are provided in the Methods section of Supplementary File 1.
Community profiling was performed with MetaPhlAn4 (v.4.0.6), using the ChocoPhlAn reference database (v.vOcCOVID2_CHOCOPhlAnSGB_202212), discarding reads not mapping to clade-specific markers. ARGs were profiled with ShortBRED, using markers identified from the ResFinder and Uniref90 databases (see the Methods section of Supplementary File 1). ShortBRED-Quantify was used to map the metagenomic reads to the markers and obtain the RA of each gene, expressed as reads per kilobase of reference sequence per million sample reads (RPKM).
Statistical analysis
All microbiome composition analyses were performed in R, version 4.4.0 (The R Foundation for Statistical Consulting, Boston, MA, USA). The RAs of the top 10 taxa in MEF and NP samples were visualized, as well as the RAs and ECs of the bacterial groups. Mean α (Shannon and Inverse Simpson) and β (Bray–Curtis distances) diversities were calculated and compared by niche type (MEF versus NP), presence or absence of virus(es), whether the samples were taken pre- versus post-COVID-19 pandemic, and by study treatment (eardrops versus oral suspension). Differences in α diversities were tested with the Kruskal–Wallis rank-sum test and β diversities using PERMANOVA with 9999 permutations. Microbiome composition changes over time were tested for NP samples only, as only four children still had MEF after completing treatment. Untargeted differential abundance analyses comparing the full microbiome data at Week-2 to baseline were conducted using ANCOM-BC2 with Benjamini–Hochberg adjustment for false discovery (FDR cut-off of 0.05). Targeted analyses comparing bacterial group ECs at Week-2 compared to baseline included paired Wilcoxon signed-rank tests in children who had both baseline and Week-2 samples taken and bivariable linear regression models including all NP samples with the EC of each bacterial group as the continuous outcome and treatment group as the determinant. Two different models were fit: (1) comparing Week-2 samples from each treatment group to all baseline samples and (2) comparing Week-2 samples from the two treatment groups combined to all baseline samples. Finally, we compared the baseline characteristics of children who responded to treatment to those who did not using Kruskal–Wallis and χ2 tests. Responders were defined as having lower Streptococcus EC at Week-2 than baseline (see the Methods section of Supplementary File 1).
For faecal samples, we visualized the top 25 most abundant taxa and compared α and β diversities between treatment groups only. ARG analyses were conducted in R v4.2.1. α (Shannon) and β (Bray–Curtis) diversities of ARGs were calculated and compared between study treatments using the Wilcoxon test and PERMANOVA with 10,000 permutations, respectively. Untargeted multivariable association analyses (MaAsLin2) were used to identify bacteria and ARGs that were differentially abundant in the treatment groups comparing Week-2 to baseline, adjusting for age, sex (fixed effects), and sample ID (random effect).
Results
Study participants and samples
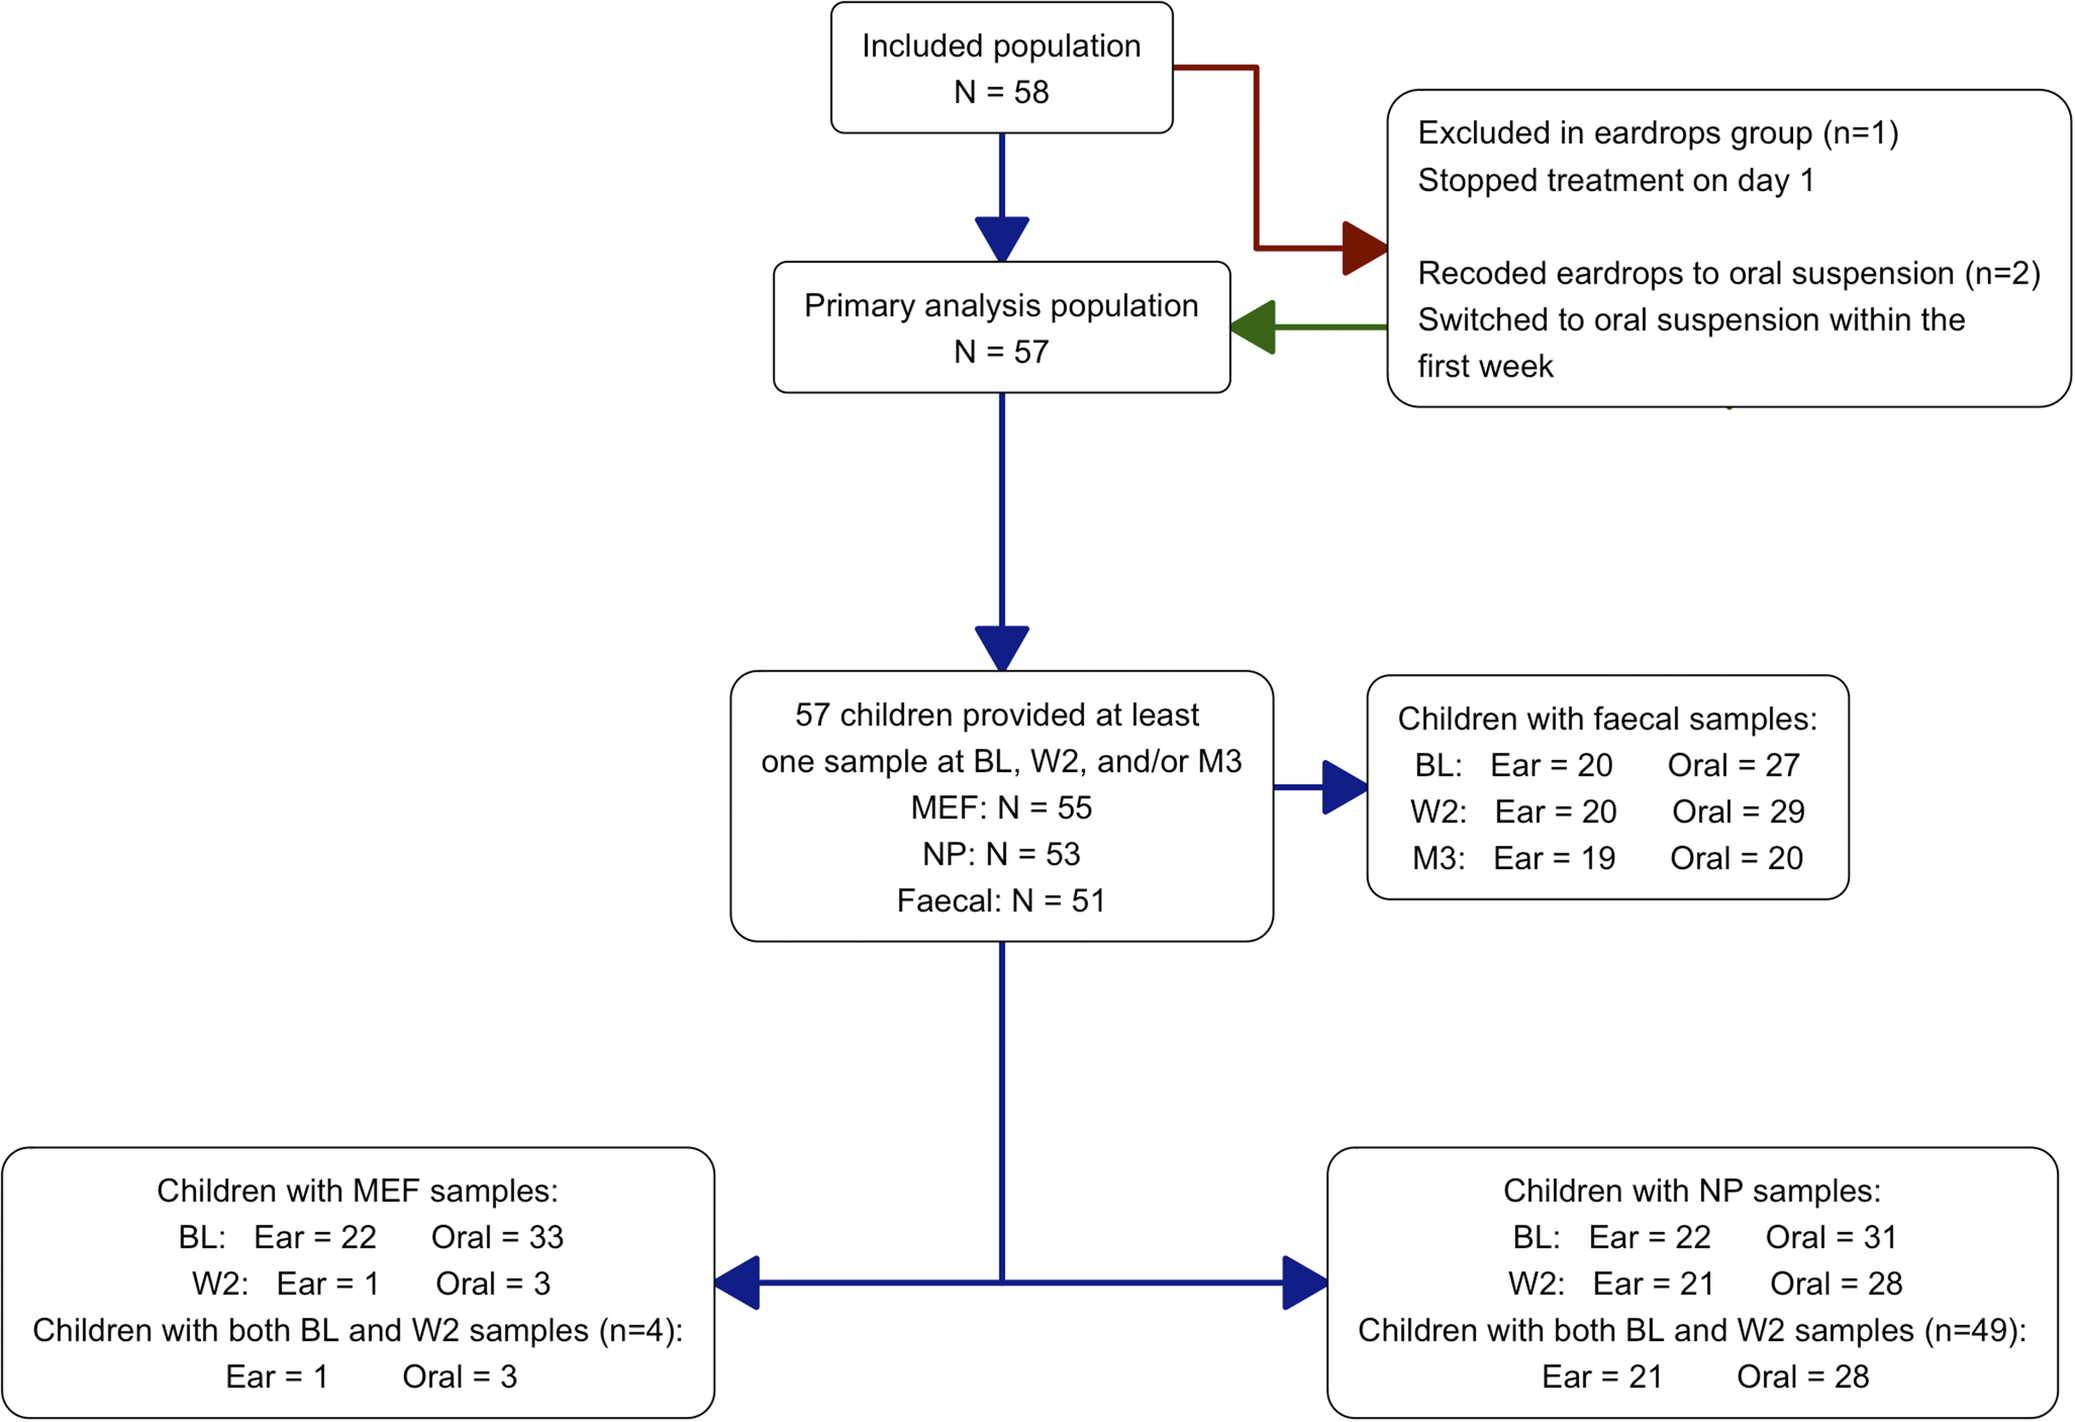
Of the 58 children who participated in the PLOTS randomized trial, 57 provided at least one MEF, NP, or faecal sample during follow-up; one participant assigned to the eardrops group withdrew from the study on the day of enrolment. MEF, NP, and faecal samples from 55 out of 57 (96.5%), 53 out of 57 (93.0%), and 50 out of 57 (87.7%) children, respectively, were suitable for analysis. The participant and sample flow is shown in Figure 1. Two participants were assigned to the eardrops group but received oral antibiotic suspension early in the trial; they were analysed as part of the oral suspension group. Only four children still had ear discharge at Week-2 (oral suspension n = 3, eardrops n = 1). Baseline characteristics were well balanced between the treatment groups (Supplementary Table S.1). The mean age of the children who provided at least one MEF, NP, or faecal sample was 37.9 months (standard deviation (SD) = 27.1) and 47.4% were male (Supplementary Table S.1a). None of the MEF or NP samples tested positive for SARS-CoV-2 at baseline or Week-2 but often tested positive for other viruses (see the Results section of Supplementary File 1).
Participant and sample flow.
Note: One child was switched from eardrops to oral treatment on day 1 because the child resisted application of the eardrops. Another child was switched from eardrops to oral treatment on day 3 because the ear pain persisted (the fever subsided).
Abbreviations: BL = baseline sampling timepoint; Ear = hydrocortisone-bacitracin-colistin eardrops; MEF = middle ear fluid; M3 = month 3 sampling timepoint; NP = nasopharynx; Oral = oral amoxicillin suspension; W2 = week 2 sampling timepoint.

Figure 1. Long description
Abbreviations: BL = baseline sampling timepoint; Ear = hydrocortisone-bacitracin-colistin eardrops; MEF = Middle ear fluid; M3 = month 3 sampling timepoint; NP=Nasopharynx; Oral = oral amoxicillin suspension; W2 = week 2 sampling timepoint. One child was switched from eardrops to oral treatment on Day 1 because the child resisted application of the eardrops. Another child was switched from eardrops to oral treatment on Day 3 because the ear pain persisted (the fever subsided).
MEF and NP microbiome compositions prior to treatment
Mean RAs of the top 10 taxa at baseline are shown in Supplementary Figure S.1a–f for the MEF and NP overall (Supplementary Figures S.1a and b), by presence or absence of any virus (Supplementary Figures S.1c and d), and by pre- or post-COVID-19 pandemic sampling (Supplementary Figures S.1e and f). Prior to treatment, Streptococcus dominated the MEF of children with AOMd (mean RA 50.0%), while the mean RAs of other genera were substantially lower: Haemophilus (12.5%), Turicella (11.4%), Staphylococcus (7.2%), Alloiococcus (5.7%), Corynebacterium (3.5%), Moraxella (3.5%), and Prevotella (1.6%) (Supplementary Figure S.1a). In the NP, the most relatively abundant genera prior to treatment were Moraxella (35.2%), Haemophilus (23.4%), Streptococcus (16.6%), Corynebacterium (10.5%), and Dolosigranulum (4.0%); Turicella and Alloiococcus were uncommon in this niche (Supplementary Figure S.1b). The interindividual variability is shown in Supplementary Figure S.2a and b. MEF and NP microbiome compositions were therefore distinct, further supported by significant differences in α diversities (Shannon index: p < 0.001, inverse Simpson index: p < 0.001; Supplementary Figure S.1g) and a significant β diversity (Bray–Curtis distances: PERMANOVA p < 0.001; Supplementary Figure S.1h). Within the same niche, however, α and β diversities did not differ by the presence or absence of at least one virus, or by pre- or post-pandemic sampling.
Impact of treatments on the MEF and NP microbiomes
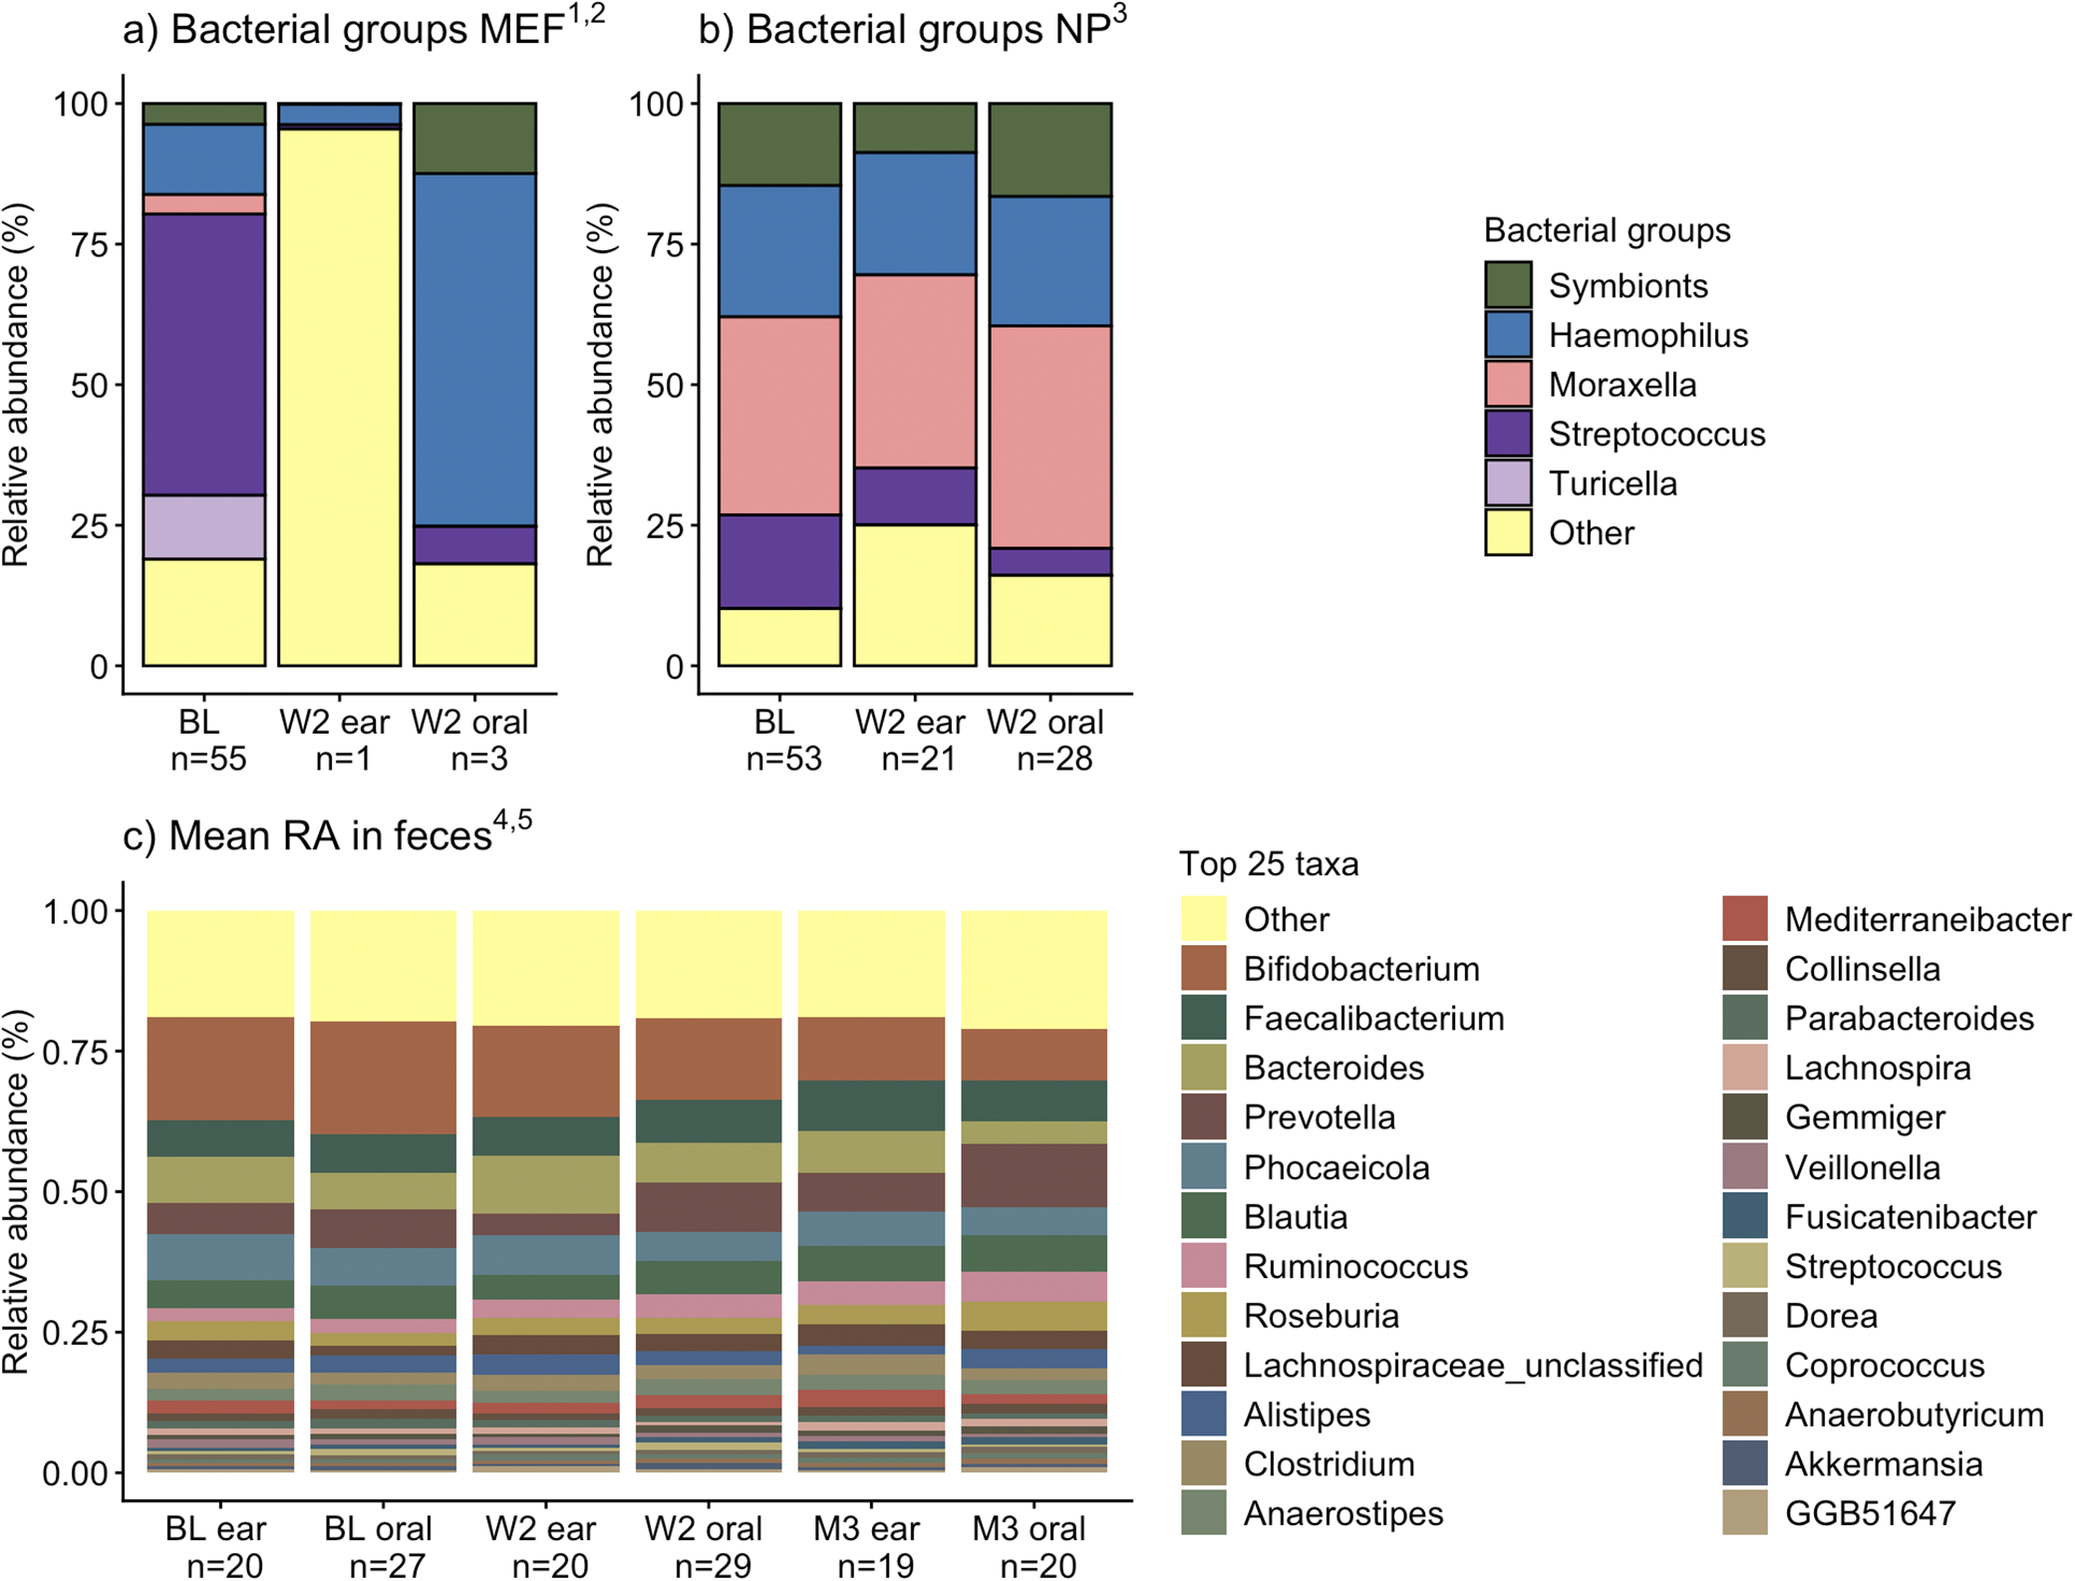
The mean RAs of bacterial groups in the MEF and NP niches at baseline and Week-2 by treatment group are shown in Figure 2a,b, and the top 10 taxa in Supplementary Figure S.2c and d. In NP samples, mean RA of Streptococcus decreased more effectively after oral suspension than eardrop treatment: 16.6% at baseline versus 4.8% (oral) and 10.1% (eardrops) at Week-2 (Figure 2b, p = 0.001). In both niches and treatment groups, mean α diversity indexes remained similar over time. The β diversity of MEF samples compared for baseline to Week-2 showed a statistically significant difference (p = 0.020), but this was not the case for NP samples (p = 0.344).
Middle ear fluid, nasopharyngeal, and gut microbiome compositions by sampling time point and treatment group in children with AOMd.
Note: (1) The single eardrop sample at Week-2 was dominated by Staphylococcus, which is classified under the “other” bacterial group. (2) α diversity did not differ significantly between baseline and Week-2 MEF samples (both treatment groups combined at each time point because there were only 5 samples in total at Week-2; inverse Simpson index, Kruskal–Wallis p = 0.729; Shannon index, Kruskal–Wallis p = 0.752), whereas β diversity did differ significantly (MDS Bray–Curtis, PERMANOVA p = 0.020). (3) α and β diversities were not significantly different between the three groups shown in this bar graph (inverse Simpson index, Kruskal–Wallis p = 0.481; Shannon index, Kruskal–Wallis p = 0.192; and MDS Bray–Curtis, PERMANOVA p = 0.344). (4) Top 25 taxa at genus level. (5) α and β diversities were not significantly different between the six groups shown in this bar graph (inverse Simpson index, Kruskal–Wallis p = 0.917; Shannon index, Kruskal–Wallis p = 0.878; and MDS Bray–Curtis, PERMANOVA p = 0.245).
Abbreviations: AOMd = acute otitis media present with ear discharge due to spontaneous perforation of the eardrum; BL = baseline sampling timepoint; Ear = hydrocortisone-bacitracin-colistin eardrops; MEF = middle ear fluid; MDS = multidimensional scaling; NP = nasopharynx; M3 = month 3 sampling timepoint; Oral = oral amoxicillin suspension; RA = relative abundance; W2 = week 2 sampling timepoint.

Figure 2. Long description
Abbreviations: AOMd = acute otitis media present with ear discharge due to spontaneous perforation of the eardrum; BL = baseline sampling timepoint; Ear = hydrocortisone-bacitracin-colistin eardrops; MEF = Middle ear fluid; MDS = Multidimensional scaling; NP=Nasopharynx; M3 = month 3 sampling timepoint; Oral = oral amoxicillin suspension; RA = Relative abundance; W2 = week 2 sampling timepoint. 1. The single eardrop sample at Week-2 was dominated by Staphylococcus, which is classified under the “other” bacterial group. 2. Alpha diversities did not differ significantly between baseline and Week-2 MEF samples (both treatment groups combined at each time point because there were only 5 samples in total at Week-2; Inverse Simpson index, Kruskal Wallis p = 0.729; Shannon index, Kruskal Wallis p = 0.752), whereas beta diversity did differ significantly (MDS Bray-Curtis, PERMANOVA p = 0.020). 3. Alpha and beta diversities were not significantly different between the three groups shown in this bar graph (Inverse Simpson index, Kruskal Wallis p = 0.481; Shannon index, Kruskal Wallis p = 0.192; and MDS Bray-Curtis, PERMANOVA p = 0.344). 4. Top 25 taxa at genus level. 5. Alpha and beta diversities were not significantly different between the six groups shown in this bar graph (Inverse Simpson index, Kruskal Wallis p = 0.917; Shannon index, Kruskal Wallis p = 0.878; and MDS Bray-Curtis, PERMANOVA p = 0.245).
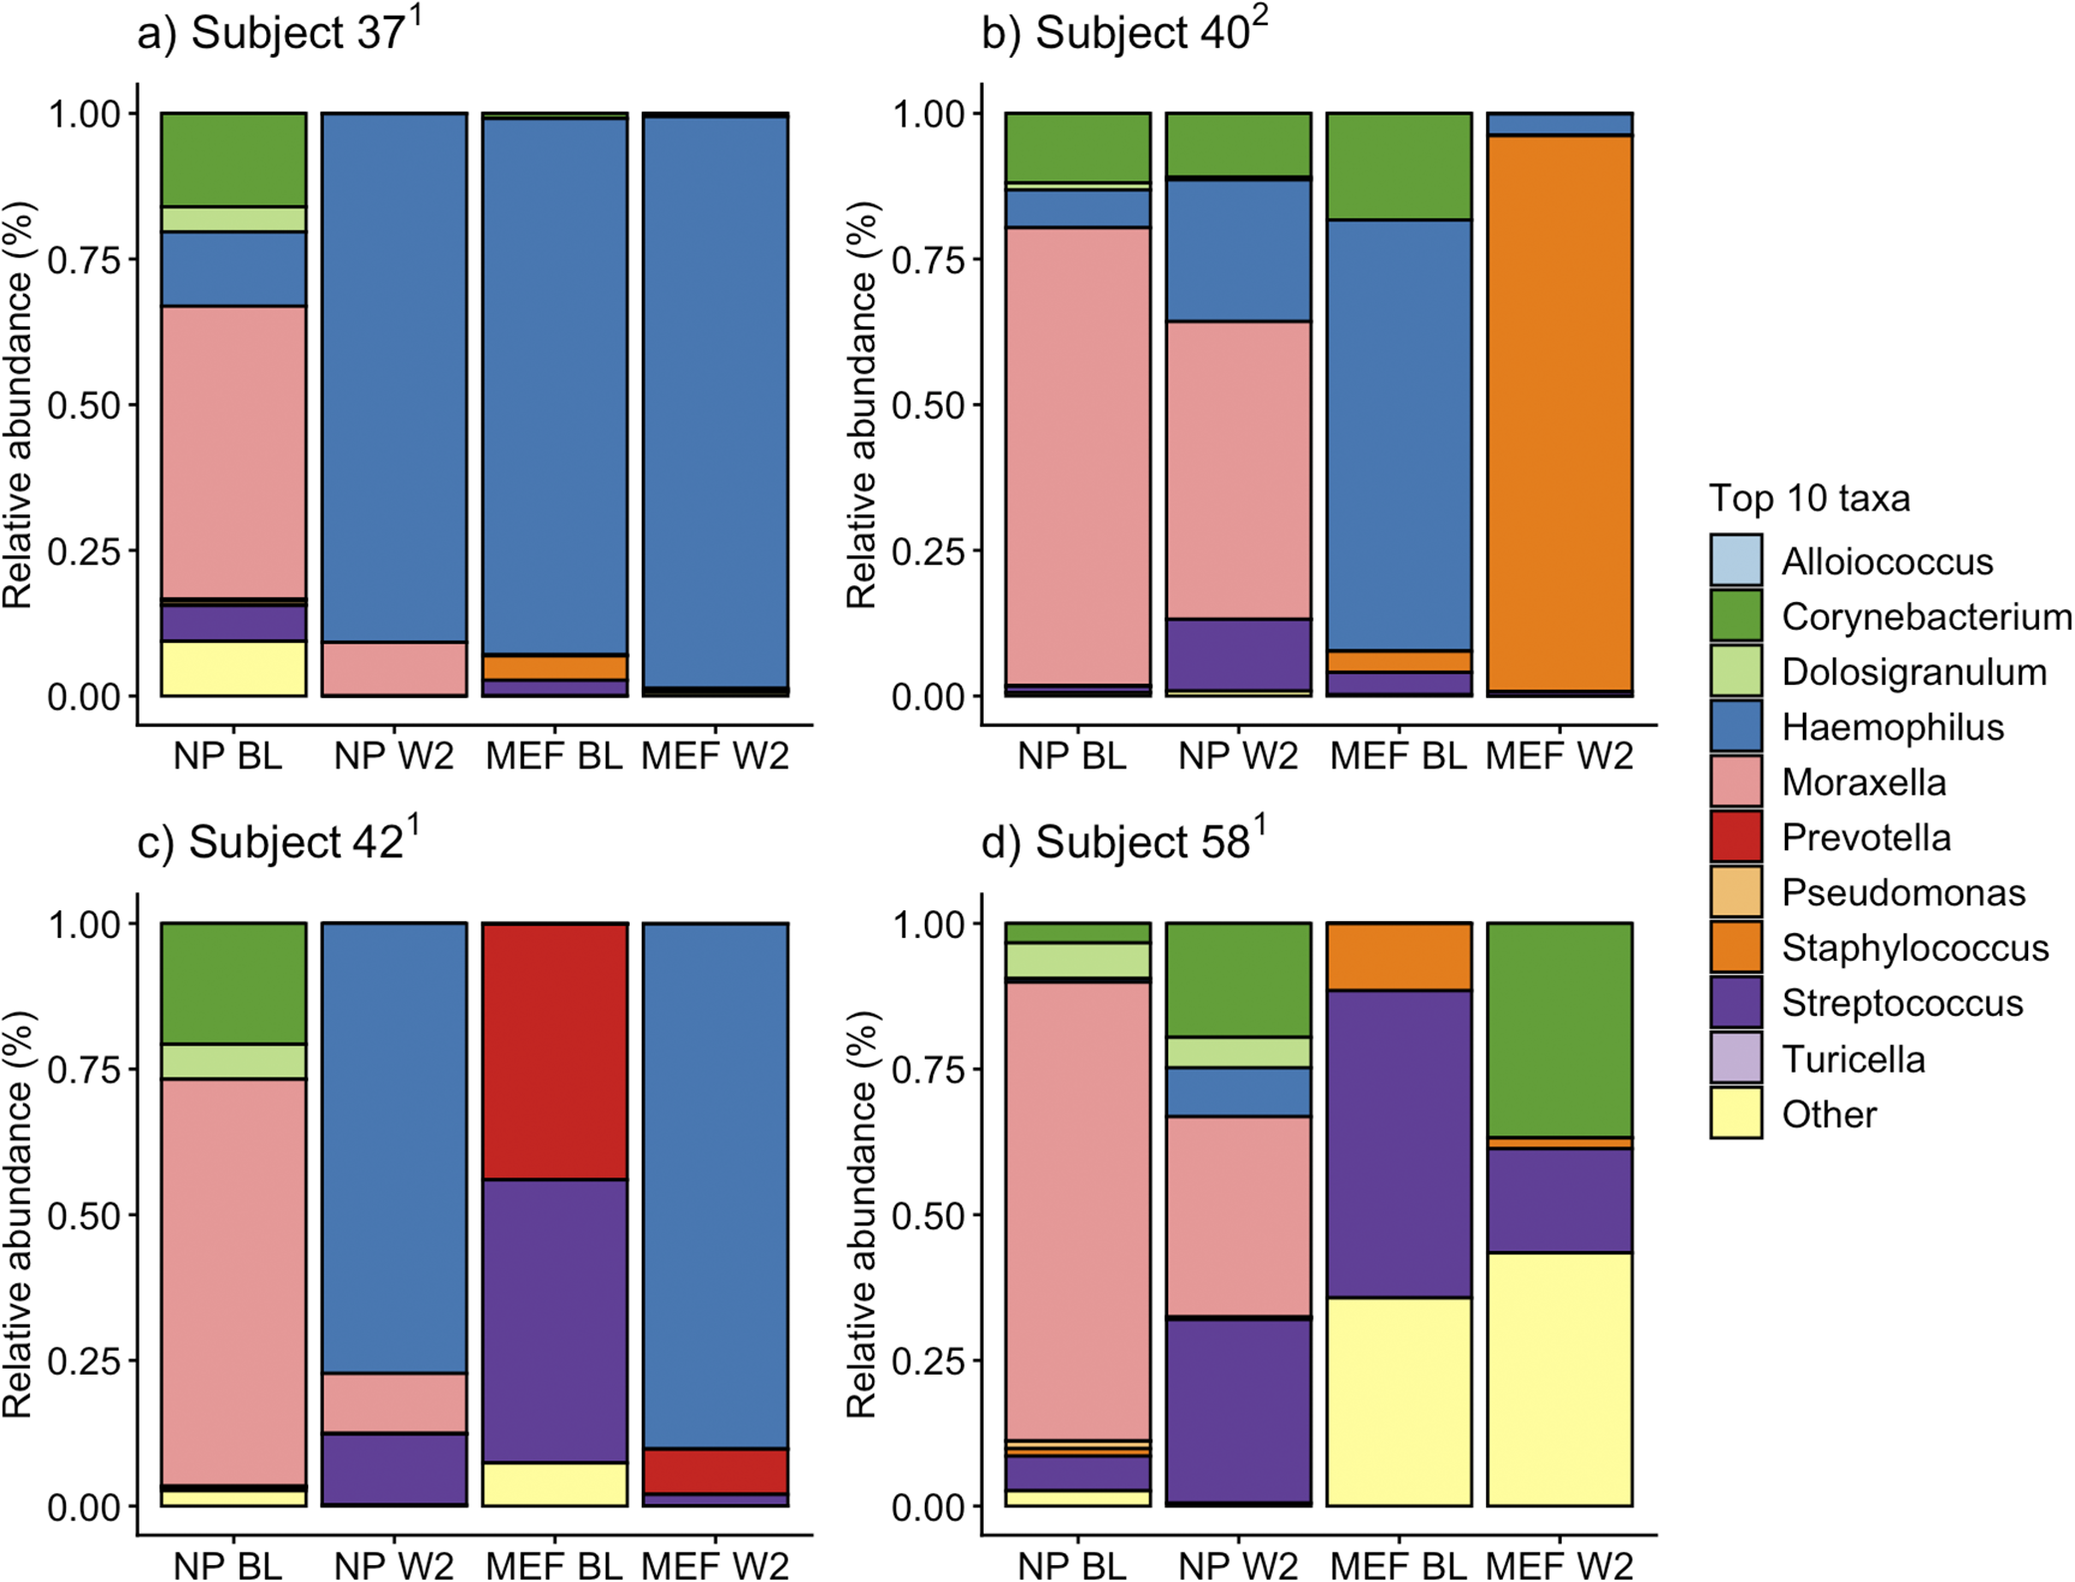
Only four children still had MEF at Week-2 (Figure 3a–d). In two of these children, Haemophilus dominated the MEF samples at baseline, and Haemophilus or Staphylococcus after treatment. The MEF of the two other children contained high RAs of Streptococcus, Prevotella, and mixed bacteria at baseline and shifted towards Haemophilus domination or mixed bacteria at Week-2. These data suggest that treatment failure may be associated with having high abundance of AOMd-causing organisms other than Streptococcus in the middle ear.
Individual MEF composition of the four children who still had ear discharge at Week-2.
Note: (1) Received oral suspension. (2) Received eardrops.
Abbreviations: BL = baseline sampling timepoint; MEF = middle ear fluid samples; NP = nasopharyngeal samples; W2 = week 2 sampling timepoint.

Figure 3. Long description
Abbreviations: BL = baseline sampling timepoint; MEF = Middle ear fluid samples; NP=Nasopharyngeal samples; W2 = week 2 sampling timepoint. 1. Received oral suspension. 2. Received eardrops.
The ANCOM-BC2 differential abundance analysis identified a decrease in the genus Streptococcus from baseline to Week-2 in the NP samples, with a significant reduction in the mean RA after oral suspension treatment (16.6% to 4.8%; p = 0.001), and a non-significant reduction after eardrop treatment (16.6% to 10.1%; p = 0.264). The family Neisseriaceae was also identified as differentially lower after oral suspension, although we considered the low mean RAs in the comparison groups as clinically insignificant (0.88% to 0.20%; p = 0.015).
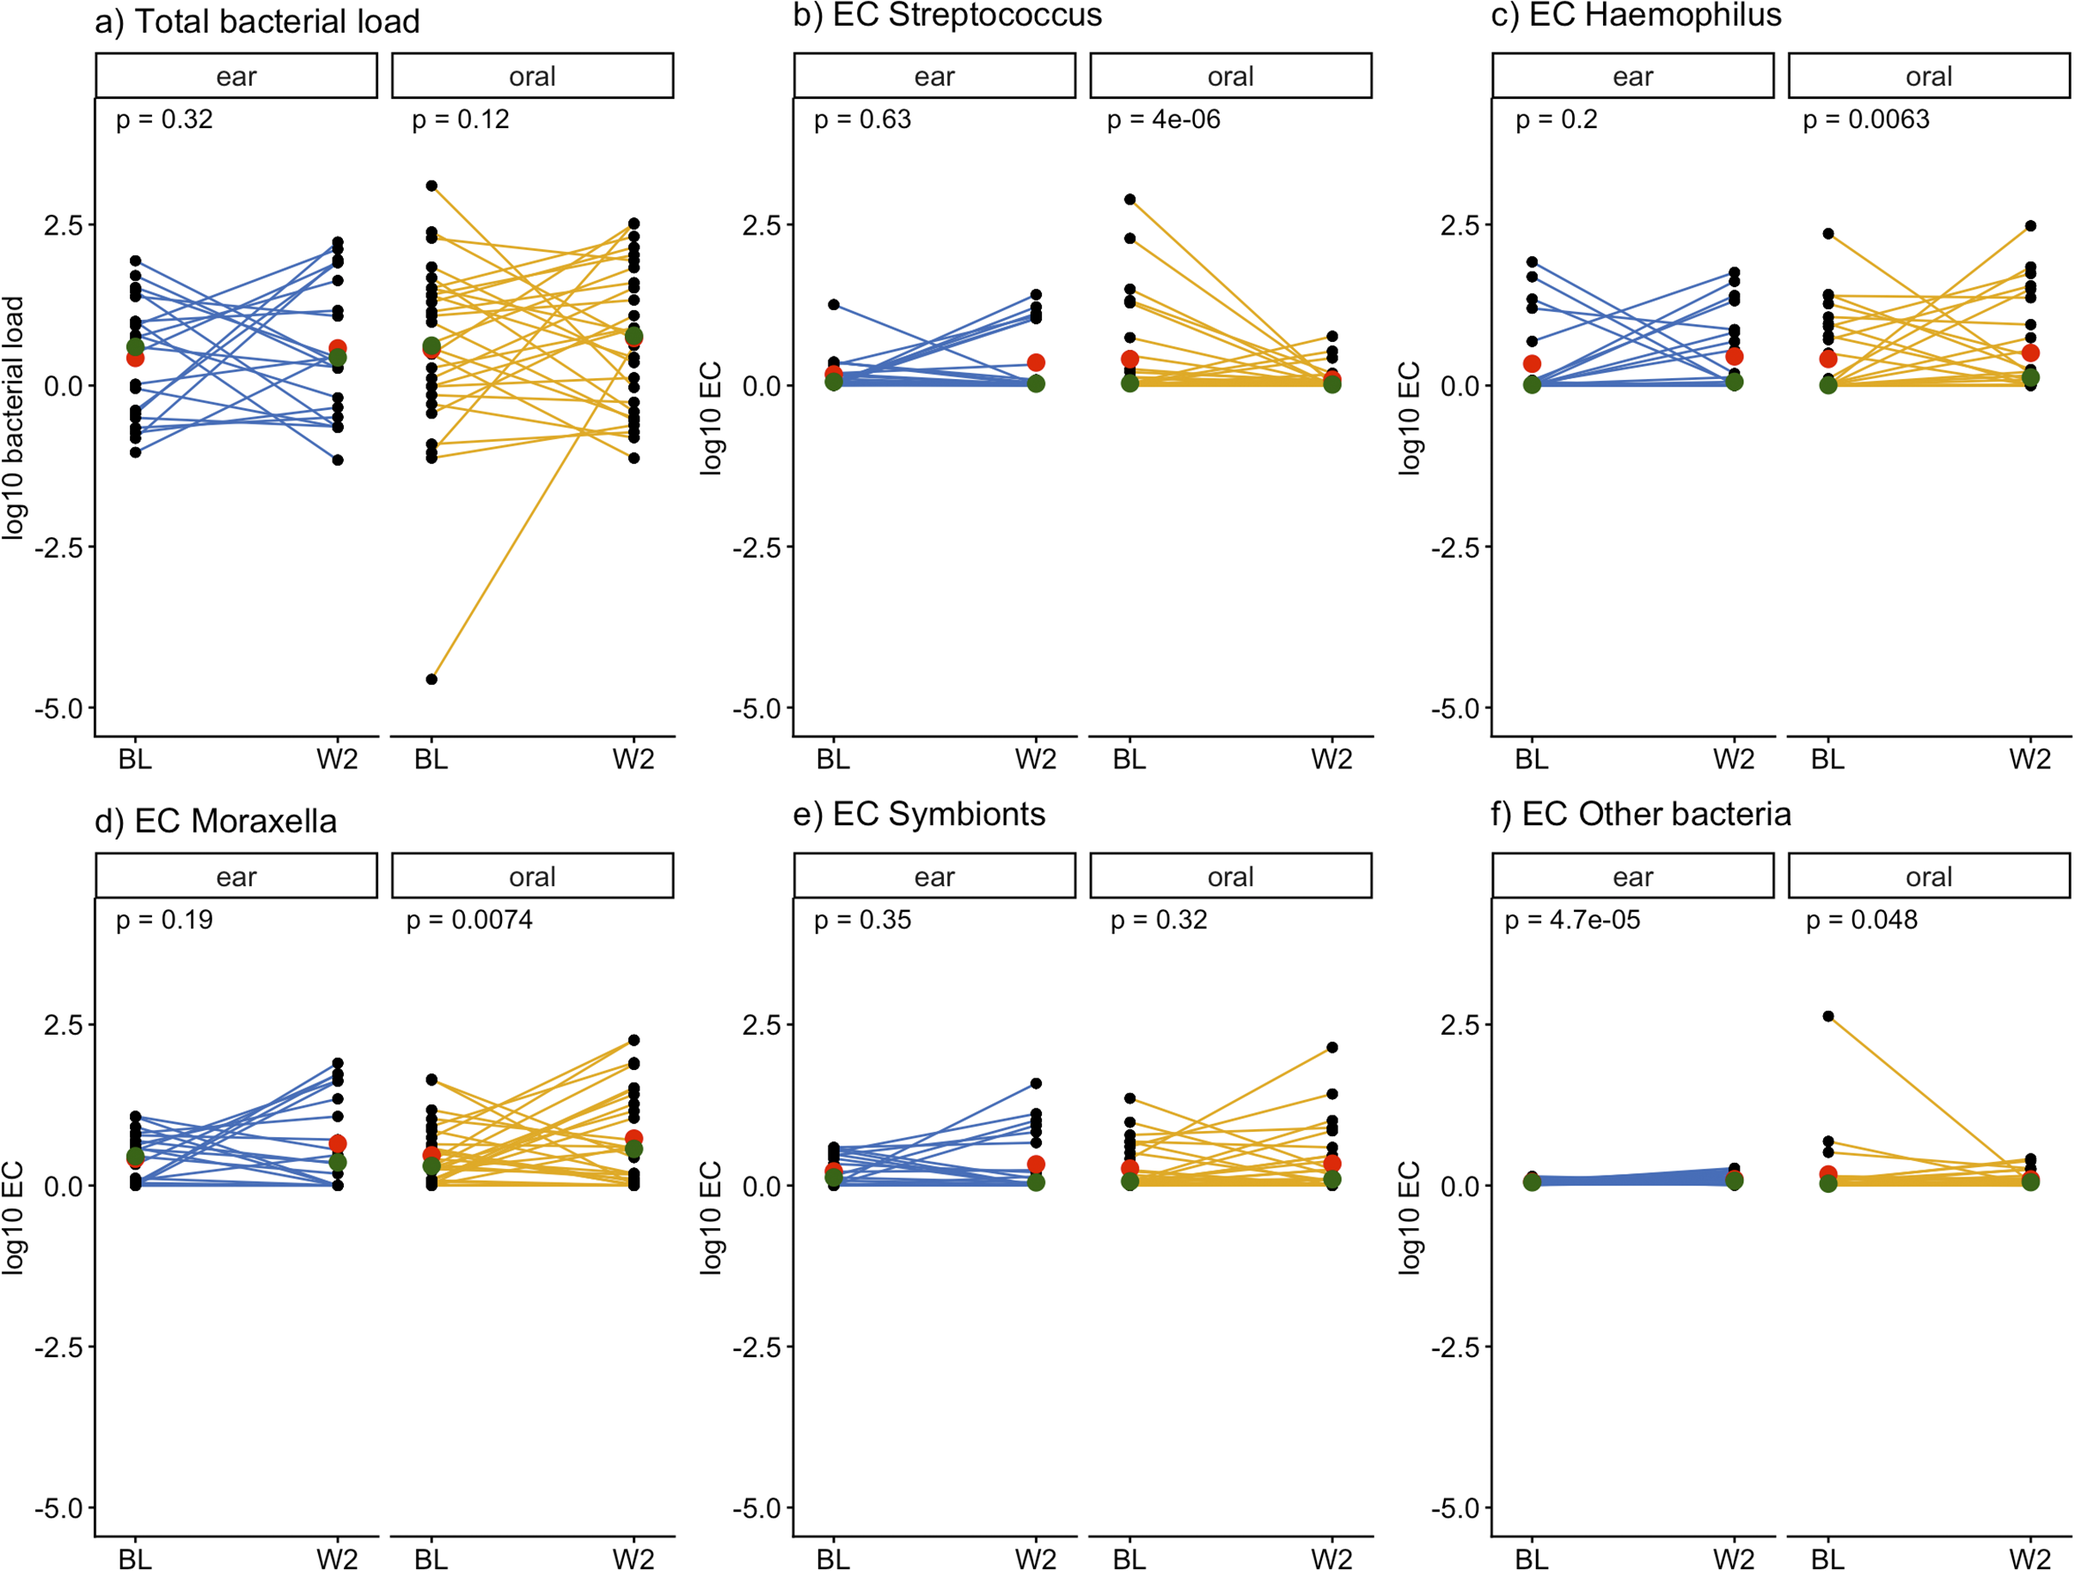
Forty-nine children with both baseline and Week-2 NP samples were included in paired analyses of total bacterial load and ECs of bacterial groups at Week-2 compared to baseline (Figure 4). The mean total NP bacterial load was not significantly different over time in both treatment groups, although interindividual variability was high (Figure 4a). Streptococcus ECs and EC changes varied greatly between individuals; however, a general trend of decreasing Streptococcus EC in samples was observed in the oral suspension group (p < 0.001; Figure 4b). The mean Haemophilus ECs and Moraxella ECs slightly increased during both treatments, reaching significance in the oral suspension group only (p = 0.006 and p = 0.007, respectively; Figure 4c,d). The mean symbionts ECs remained unchanged in both groups (Figure 4e). In summary, NP Streptococcus EC decreased to a greater extent in the oral suspension than in the eardrops group, while Haemophilus and Moraxella ECs tended to increase in that group.
Paired analyses of total bacterial load and log10 estimated concentrations of bacterial groups in nasopharyngeal samples before and after eardrop or oral suspension treatment in children with AOMd.
Note: The green dot represents the median of samples, and the red dot represents the mean. Differences in mean ECs were tested using Wilcoxon signed-rank test for paired samples. N = 49 children with both baseline and Week-2 samples; n = 21 ear and n = 28 oral antibiotics.
Abbreviations: AOMd = acute otitis media present with ear discharge due to spontaneous perforation of the eardrum; BL = baseline sampling timepoint; Ear = hydrocortisone-bacitracin-colistin eardrops; EC = log10 estimated concentration in pg/ul; Oral = oral amoxicillin; W2 = week 2 sampling timepoint.

Figure 4. Long description
Abbreviations: AOMd = acute otitis media present with ear discharge due to spontaneous perforation of the eardrum; BL = baseline sampling timepoint; Ear = hydrocortisone-bacitracin-colistin eardrops; EC = log10 estimated concentration in pg./ul; Oral = oral amoxicillin; W2 = week 2 sampling timepoint. The green dot represents the median of samples, and the red dot represents the mean. Differences in mean ECs were tested using Wilcoxon signed-rank test for paired samples. N = 49 children with both baseline and Week-2 samples; n = 21 ear and n = 28 oral antibiotics.
Bivariable linear regression models of bacterial group ECs in NP samples
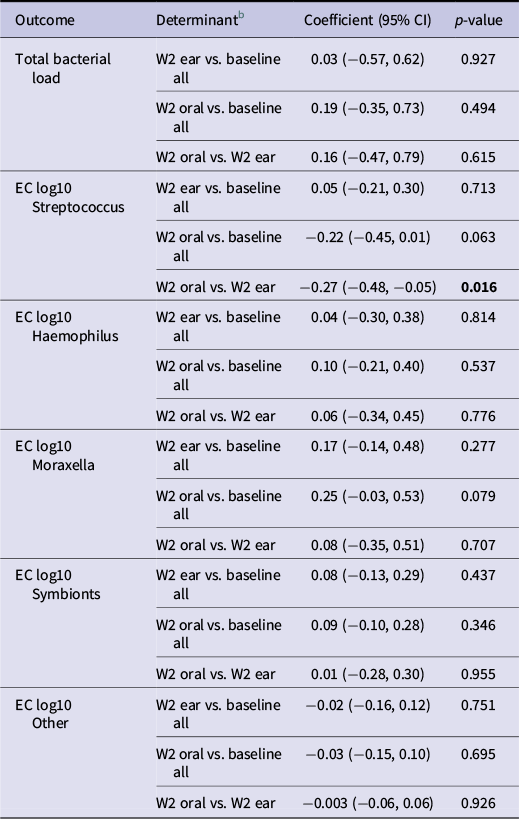
In bivariable linear regression models, total NP bacterial load was similar between time points and treatment groups (Table 1). NP Streptococcus ECs declined between baseline and Week-2 in the oral suspension group, although not statistically significantly (coefficient −0.22, 95% CI –0.45 to 0.01, p = 0.063). The NP Streptococcus EC showed a steeper decline in children who were treated with oral suspension compared to eardrops (−0.27, −0.48 to –0.05, p = 0.016). The NP Moraxella EC showed an increasing trend between baseline and Week-2 in the oral suspension group (0.25, −0.03 to 0.53, p = 0.079). The NP EC of symbionts remained stable in both groups. These results align with the results of the paired analyses described earlier.
Bivariable linear regression models with estimated concentration of one bacterial group in nasopharyngeal samples from children with AOMda as the outcome of each model

Table 1. Long description
Abbreviations: AOMd = acute otitis media present with ear discharge due to spontaneous perforation of the eardrum; CI = Confidence interval; Ear = hydrocortisone-bacitracin-colistin eardrops; EC = log10 estimated concentration in pg/ul; Oral = oral amoxicillin; W2 = week 2 sampling timepoint. 1. N = 53 children with baseline samples (BL ear = 22, BL oral = 31), and N = 49 children with samples at Week-22 (W2 ear = 21, W2 oral = 28). 2. Two regression models: (1) the Week-2 samples in each treatment group are compared to all baseline samples and (2) the Week-2 samples are compared to each other, eardrops vs. oral suspension.
a N = 53 children with baseline samples (BL ear = 22, BL oral = 31), and N = 49 children with samples at Week-22 (W2 ear = 21, W2 oral = 28).
b Two regression models: (1) the Week-2 samples in each treatment group are compared to all baseline samples and (2) the Week-2 samples are compared to each other, eardrops vs. oral suspension.
Abbreviations: AOMd = acute otitis media present with ear discharge due to spontaneous perforation of the eardrum; CI = Confidence interval; Ear = hydrocortisone-bacitracin-colistin eardrops; EC = log10 estimated concentration in pg./ul; Oral = oral amoxicillin; W2 = week 2 sampling timepoint.
NP microbiomes and clinical characteristics of treatment responders to non-responders
No differences were observed in the total NP bacterial load between responders (mean = 0.56 log10 pg/ul) and non-responders (mean = 0.65, p = 0.338) when data from both treatment groups and across sampling time points were combined. Total NP bacterial load increased between baseline and Week-2 samples among the non-responders (baseline log10 mean = −0.03 and Week-2 log10 mean = 1.32, p = 0.003), but not in the responders (p = 0.220; see the Results section of Supplementary File 1).
Impact of treatments on the gut microbiome composition and gut resistome
The gut microbiome composition was highly diverse at all time points (Figure 2c). In the baseline samples, the most abundant genera prior to treatment were Bifidobacterium (mean RA 19.3%), Phocaeicola (7.4%), Bacteroides (7.2%), Faecalibacterium (6.7%), Prevotella (6.2%), Blautia (5.5%), and Ruminococcus (2.4%). α and β diversities were not different between treatment groups and across timepoints.
A total of 117 ARGs were identified in the faecal samples with tetracycline resistance genes the most abundant class and tet(Q)_3 the most abundant ARG (Supplementary Figure S.3a; Results section of Supplementary File 1). However, MaAsLin2 analyses did not identify any ARGs to be significantly over- or underrepresented across the treatment groups. The α-diversity (Shannon) and β-diversity (Bray–Curtis) of the ARGs were similar between the treatment groups at baseline, Week-2, and Month-3 (Supplementary Figures S.3b-d), except for a significantly higher Shannon diversity in the oral group at Week-2 (p = 0.042). However, by Month-3, the Shannon diversity was similar between the treatment groups (p = 0.667). No statistically significant differences were observed in total ARG RAs between the treatment groups at baseline, Week-2, or Month-3 (Supplementary Figure S.3e).
Sensitivity analyses for NP and gut microbiomes excluding children that received additional antibiotic treatment (in any formulation) during follow-up yielded similar results (Supplementary File 2).
Discussion
We compared MEF, NP, and gut microbiome compositions of children with AOMd who were randomly assigned to oral amoxicillin suspension or hydrocortisone-bacitracin-colistin eardrops treatment groups. Prior to treatment, the MEF samples were dominated by Streptococcus, whereas the NP samples were more diverse. Ear discharge was resolved in all but four children by Week-2 (oral suspension n = 3, eardrops n = 1). In the cases with persistent ear discharge, baseline and Week-2 MEF samples were not dominated by Streptococcus but by Haemophilus or Staphylococcus, or contained mixed bacteria. In the NP samples, oral suspension led to a greater reduction in Streptococcus RA and EC compared to eardrops, but Haemophilus and Moraxella ECs increased following oral suspension treatment. This represents genuine outgrowth because the EC findings are quantitative, not relative. Neither treatment affected NP symbionts or the gut microbiome or resistome compositions.
The 10 most relatively abundant taxa in our MEF samples were (in order of decreasing mean RA) Streptococcus, Haemophilus, Turicella, Staphylococcus, Alloiococcus, Corynebacterium, Moraxella, Prevotella, Finegoldia, and Escherichia-Shigella. This is similar to other studies in children with AOMd [Reference Zimmermann28, Reference Nogues, Pérez-Losada and Preciado29]. Although the nasopharynx is often used as a proxy for the middle ear [Reference Man27, Reference van Dongen30], our results suggest substantial differences between these niches, consistent with a previous systematic review indicating that NP samples do not provide a good proxy for the middle ear [Reference van Dongen30]. However, NP samples are of interest in their own right due to the anatomical connection with the middle ear.
Corynebacterium and Dolosigranulum enrichment in the NP has been associated with reduced pathobiont colonization and may be protective against AOM [Reference Pettigrew11, Reference Yu31]. Corynebacterium and Dolosigranulum typically comprise 13%–33% [Reference Bosch32–Reference Hurst34] and 2%–15% [Reference Bosch32–Reference Oh35] of the NP microbiome, respectively, with higher RAs observed in children [Reference Hurst34, Reference Oh35]. In the PLOTS study, their combined RAs were 14.5% at baseline and 13.2% after treatment. In one study, children with higher RAs of Corynebacterium and Dolosigranulum in the NP were less likely to have AOM [Reference Pettigrew11]. Furthermore, higher RAs of Corynebacterium and Dolosigranulum was negatively associated with colonization by S. pneumoniae, H. influenzae, and M. catarrhalis [Reference Pettigrew11]. In our study, neither treatment negatively affected the nasopharyngeal Corynebacterium and Dolosigranulum abundances.
While recent systematic reviews suggest that systemic antibiotics can have lasting effects on the gut microbiome, findings are often inconsistent and data on children are limited [Reference Elvers18, Reference Zimmermann and Curtis36]. In contrast, we found no evidence that a 7-day course of either oral suspension or eardrops significantly disrupted commensal bacteria in the gut microbiome or increased the gut resistome.
In the Netherlands, oral amoxicillin suspension is the first-line treatment for AOM if antibiotics are indicated, while hydrocortisone-bacitracin-colistin eardrops may be used should ear discharge persist beyond 1 week [7]. Amoxicillin is a broad-spectrum β-lactam antibiotic [Reference Lieberthal12, Reference Gibson and Veening37]. Hydrocortisone-bacitracin-colistin eardrops contain two antibiotics: bacitracin, primarily targeting Gram-positive bacteria, and colistin, which targets Gram-negative bacteria [38]. In our study, oral amoxicillin suspension reduced Streptococcus species in the NP more effectively than eardrops. We could not assess this in the middle ear because only four children still had ear discharge after treatment completion, and because the NP microbiome was not a good proxy for the MEF microbiome. We also found that Haemophilus and Moraxella increased in the NP after amoxicillin exposure. This aligns with the existing literature reports that the effectiveness of amoxicillin against H. influenza and M. catarrhalis is often compromised due to β-lactamase production by some strains [Reference Lieberthal12, Reference Frost39, Reference Konno40]. The observed increases may be due to the selective pressure of amoxicillin: By effectively reducing Streptococcus, the outgrowth of Haemophilus and Moraxella may be facilitated. While less effective against Haemophilus and Moraxella compared to Streptococcus, amoxicillin is generally effective in resolving clinical AOM symptoms [Reference Frost39] and, in the PLOTS trial, at least as effective as hydrocortisone-bacitracin-colistin eardrops [Reference Hullegie9]. In our study, all children with persistent ear discharge at Week-2 had resolved symptoms by Month-3. Furthermore, certain Streptococcus species, including S. pneumoniae and viridans group streptococci, are known to acquire antibiotic resistance [Reference Konno40]. Consistently, children in our study who continued to have increased Streptococcus in the NP by Week-2 had more prior AOMd episodes, suggesting that previous antibiotic use may promote acquisition of resistant Streptococcus strains. Although clinical symptoms did resolve by Month-3, future trials should consider the underlying bacterial profiles of children with AOM to ensure antibiotics administered target the intended pathobionts.
This is the first randomized trial comparing oral amoxicillin suspension and hydrocortisone-bacitracin-colistin eardrops on the middle ear, nasopharynx, and gut microbiome compositions in children with AOMd. The trial was limited by early termination due to slow recruitment, enrolling 58 children instead of the planned 350. However, the original sample size calculations were based on the primary trial outcome, not the outcome of the exploratory analyses presented here, and we did uncover several statistically significant and clinically relevant results. Second, antibiotic use within 2 weeks prior to randomization was an exclusion criterion; however, cumulative prior antibiotic exposure data were not available. Third, samples were obtained at 2 weeks and 3 months (faecal samples only) post randomization, but not immediately following treatment completion (day-7), potentially missing transient – but less clinically relevant – effects. Fourth, all children had AOMd and received antibiotics; placebo or no-treatment groups were not included for ethical reasons, leaving us unable to investigate children with AOMd in the absence of antibiotic treatment.
In conclusion, both treatments resolved the AOMd in most children. However, oral amoxicillin suspension may reduce nasopharyngeal Streptococcus abundance more effectively than hydrocortisone-bacitracin-colistin eardrops, while increasing Haemophilus and Moraxella abundance. Neither treatment appears to adversely affect nasopharyngeal or gut commensals, or the gut resistome. There is a need for antibiotics that are highly effective against all three key NP pathobionts, and Dolosigranulum and Corynebacterium may hold promise as future live biotherapeutic agents. We recommend that future intervention trials assess treatment effects on relevant microbiomes, enabling both beneficial outcomes and unintended off-target microbiological effects to be clearly quantified.
Supplementary material
The supplementary material for this article can be found at http://doi.org/10.1017/S0950268826101836.
Data availability statement
The meta data is stored in the digital archive DataverseNL, https://dataverse.nl/dataset.xhtml?persistentId=doi:10.34894/J4KPP1. Raw sequencing reads are available on the European Nucleotide Archive (ENA), under accession number PRJEB94155. All code used in this manuscript can be found at https://github.com/rosssmcinnes/ and https://github.com/juanaclaus/PLOTS_microbiome.git.
Acknowledgements
We gratefully thank all children and parents who participated in our trial and would also like to thank our parent panel for their valuable input. We also thank Fien van Beveren, Joline de Sévaux, and Merijn Rijk for their contributions to this work.
Author contribution
Conceptualization: R.A.M.J.D., A.G.M.S., W.vS., D.B., R.P.V., J.H.H.M.vdW. Data curation: J.C., R.S.M., S.H. Formal analysis: J.C., R.S.M., S.H. Funding acquisition: R.A.M.J.D., A.G.M.S., R.P.V. Investigation: R.S.M., S.H., J.T., R.S., M.L.C. Supervision: W.vS., R.P.V., J.H.H.M.vdW. Visualization: J.C., R.S.M. Writing – original draft: J.C. Writing – review and editing: R.S.M., S.H., R.A.M.J.D., A.G.M.S., J.T., R.S., M.L.C., D.B., W.vS., R.P.V., J.H.H.M.vdW. All the authors have read and agreed to the published version of the manuscript.
Competing interests
The authors declare none.
Ethical standards
The authors assert that all procedures contributing to this work comply with the ethical standards of the relevant national and institutional committees on human experimentation and with the Helsinki Declaration of 1975, as revised in 2024.
Funding statement
The trial was supported by a grant from the Netherlands Organization for Health Research and Development (ZonMw) – Rational Pharmacotherapy 5th Open Call – grant number 84801 5006. The funding agency had no role in the design, data collection and analysis, decision to publish, or preparation of the manuscript. Open access funding provided by University Medical Center Utrecht.


 Open access

