


Key results
-
• A systematic review was conducted on the literature on excess mortality in mainland China during the COVID-19 wave after the Zero COVID policy ended.
-
• Two studies analysed the death records of a town and a district in Shanghai estimating the excess mortality rates of 153.6% and 174.3% respectively.
-
• Using indirect methods four studies estimated national excess mortality (range: 0.71–1.87 million).
-
• Diverse methods applied to estimate excess deaths in this setting and consequent different and uncertain results were identified.
Introduction
A stringent public health and social measures protocol, primarily consisting of nonpharmaceutical interventions, was imposed in mainland China from 23 January 2020 to 6 December 2022. This protocol, known as the Zero COVID policy, mandated obligatory facemask wearing, social distancing, contact tracing, isolation of patients, and quarantine of exposed individuals and inbound travellers. In addition, mass testing and regional lockdowns were imposed in locations with recent clusters of cases [Reference Mark and Schuman1, Reference Shankar2]. While implementing the Zero COVID policy, the government rolled out locally developed inactivated vaccines and one billion people were fully vaccinated by September 2021 [Reference Wee and Chen3]. Two doses of CoronaVac (Sinovac) had an estimated real-world effectiveness of 55% against mortality among the ≥80-year-olds before the emergence of the Omicron variant [Reference McMenamin4]. However, the inactivated vaccine was found less effective against the Omicron variant [Reference Suah5]. The government did not authorize foreign-made mRNA vaccines for emergency use in mainland China following the emergence of the Omicron variants, except for expatriates residing there.
Anecdotal evidence suggested that the Omicron variant was spreading nationwide, leading to large-scale lockdowns and mass testing in many locations [Reference Mark and Schuman1, Reference Gan6]. By November 2022, the government was reconsidering the Zero COVID policy [Reference Mark and Schuman1, Reference Gan6] and abandoned it on 7 December 2022 [Reference Yeung7], when all the public health and social measures prescribed by the Zero COVID policy were lifted [Reference Gan6]. People could now resume their daily routines and conduct business as in the pre-pandemic era. Subsequently, there was a huge COVID-19 wave in mainland China. According to Du et al., the Chinese Center for Disease Control and Prevention (China CDC) sentinel surveillance suggested that from 16 December 2022 to 19 January 2023, approximately 9 in 10 people in mainland China were infected with COVID-19 [8, Reference Du9]. However, only ~81,000 in-hospital deaths were officially confirmed by China CDC from 9 December 2022 through 30 January 2023 [10, Reference Raphson and Lipsitch11]. The COVID-19 wave subsided by February 2023.
Excess mortality is a term used in epidemiology and public health that refers to the number of deaths from all causes during a crisis above and beyond what we would have expected to see under ‘normal’ conditions [Reference Checchi and Roberts12]. The estimation of excess mortality requires the enumeration or estimation of both the true number of deaths during the event and the expected number of deaths should the event not happen. Their difference is the excess mortality [Reference Giattino13].
This systematic review aims to synthesize peer-reviewed research articles that estimated excess mortality in mainland China during the COVID-19 wave after the end of the Zero COVID policy on 7 December 2022. In our Supplementary Materials, we also review research articles that estimated mortality but not excess mortality.
Methods
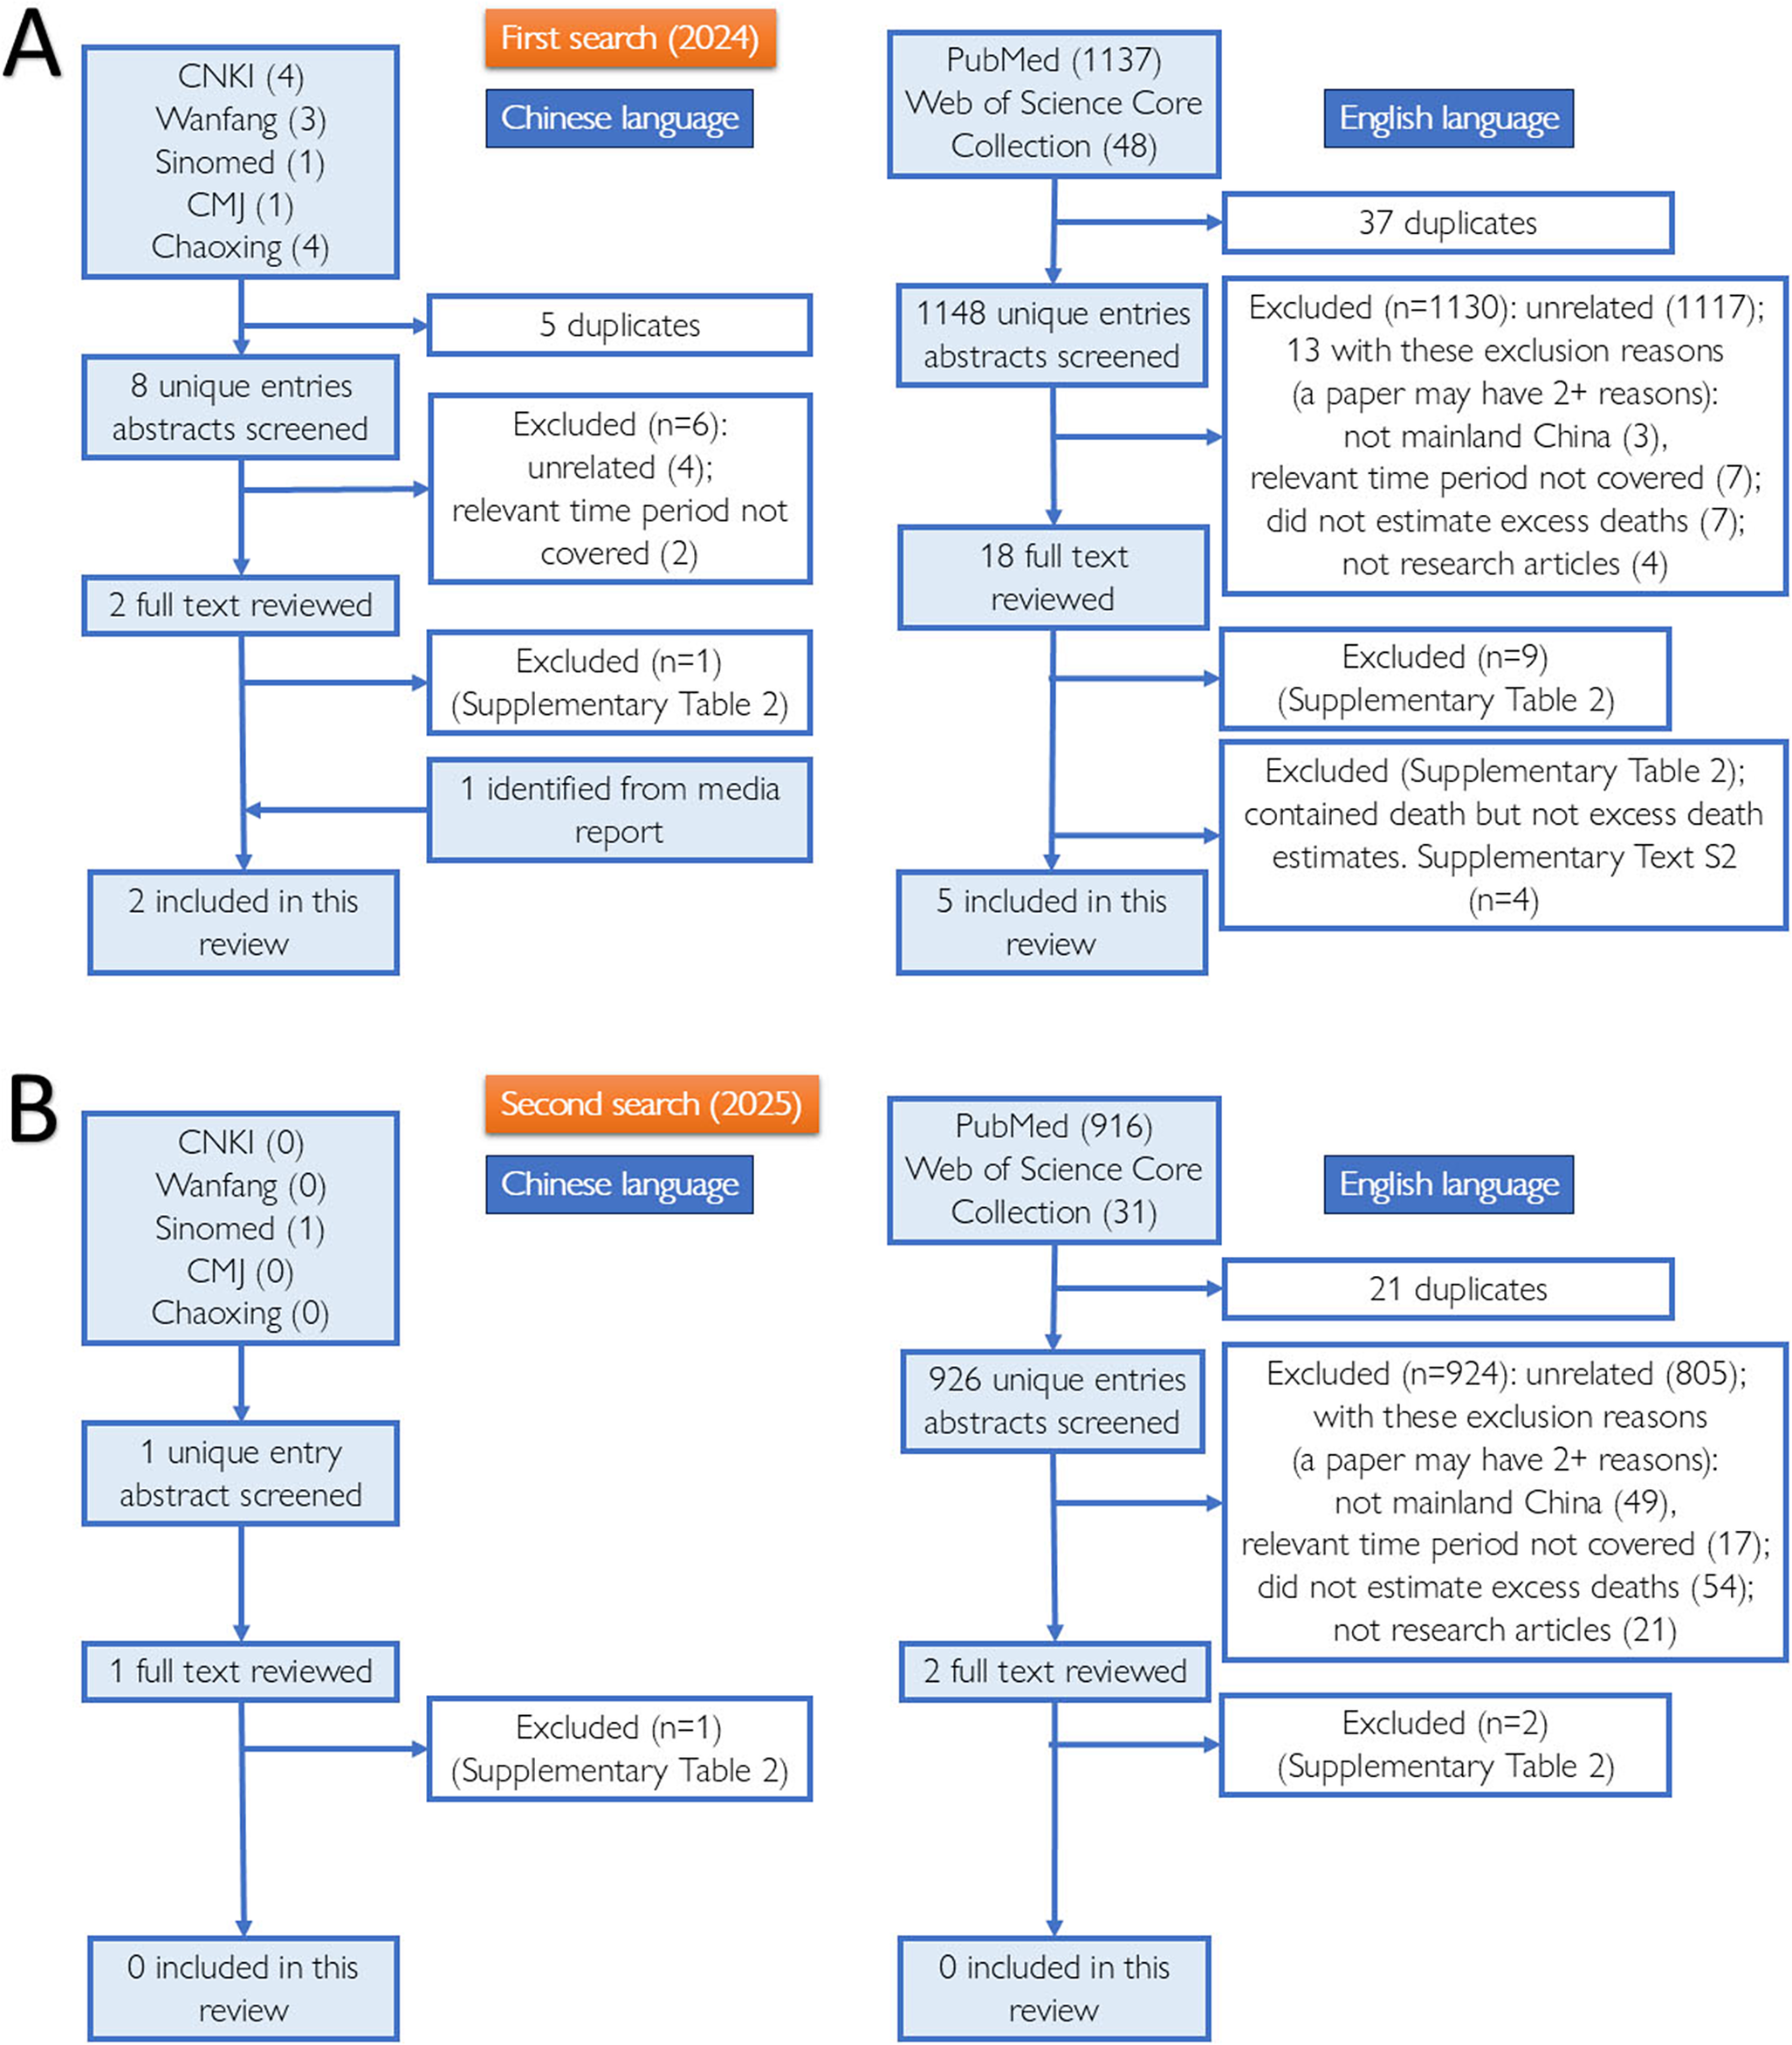
Two coauthors systematically searched for peer-reviewed research articles (in Chinese or English) in seven bibliographic databases: PubMed and Web of Science Core Collection (WoS) on 9 May 2024, and CNKI (China National Knowledge Infrastructure), Wanfang, Sinomed, Chinese Medical Journal Full Text database, and Chaoxing, on 16 May 2024. The keyword combinations included ‘COVID-19 OR SARS-CoV-2’ AND ‘China’ AND ‘(Excess Death*) OR (Excess Mortality)’; the equivalent Chinese search terms are provided in Supplementary Text S1. We limited our search to papers published on or after January 1, 2023. After deduplication, two coauthors applied our inclusion and exclusion criteria (Supplementary Table S1) to screen the titles and abstracts of the retrieved items and reviewed full texts. Papers excluded after full-text review are listed in Supplementary Table S2. Only research articles, written in English or Chinese, that included estimation of excess deaths in mainland China due to the end of the Zero COVID policy at the population level, were included. Data were extracted from the included studies. The risk of bias in the included studies was assessed using a modified Newcastle-Ottawa Scale (NOS) that we adapted from Mata et al. [Reference Mata14] (Supplementary Table S3). Studies with 6+ (out of 10) points were deemed to have a low risk of bias. Title/abstract screening, full-text review, data extraction, and risk of bias assessment were performed independently by two co-authors (Chinese papers: first and co-first authors; English papers: first and second authors). See Supplementary Text S1 for further details. A PRISMA 2020 Checklist [Reference Page15] is provided as part of the Supplementary Materials. The search was updated on 27 July 2025 (PubMed and WoS) and from 31 July to 3 August 2025 (the 5 Chinese databases). This update yielded no additional studies meeting inclusion criteria.
Results
Seven articles [Reference Raphson and Lipsitch11, Reference Huang, Li and Yin16–Reference Zhang21] were included in this systematic review (Figure 1, Tables 1, 2). Six additional articles that did not meet our inclusion criteria but provided information about estimated or projected death counts were reviewed in Supplementary Text S2–S3 [Reference Du9, Reference Amemiya, Li and Nishiura22–Reference Leung, Leung and Wu26]. Two Chinese articles estimated excess mortality in unnamed subdivisions of Shanghai using official death records [Reference Zhang, Zhou and Yan20, Reference Zhang21], and five English articles estimated excess mortality in all or some populations in mainland China using other datasets [Reference Raphson and Lipsitch11, Reference Huang, Li and Yin16–Reference Xiao19]. Tables 1, 2 summarize the studies and their excess mortality estimates. Below is a summary of each paper, with a detailed discussion of each paper’s methods and results, as given in Supplementary Text S1.
Schematic presenting the steps taken to identify literature for this systematic review: the database search, deduplication, abstract screening, full-text review, and inclusion and exclusion of literature. Panels A and B present the process and results of our first (2024) and second (2025) search, respectively. Search updated July–August 2025; no additional inclusions. PRISMA counts reconcile with Supplementary Text S1.

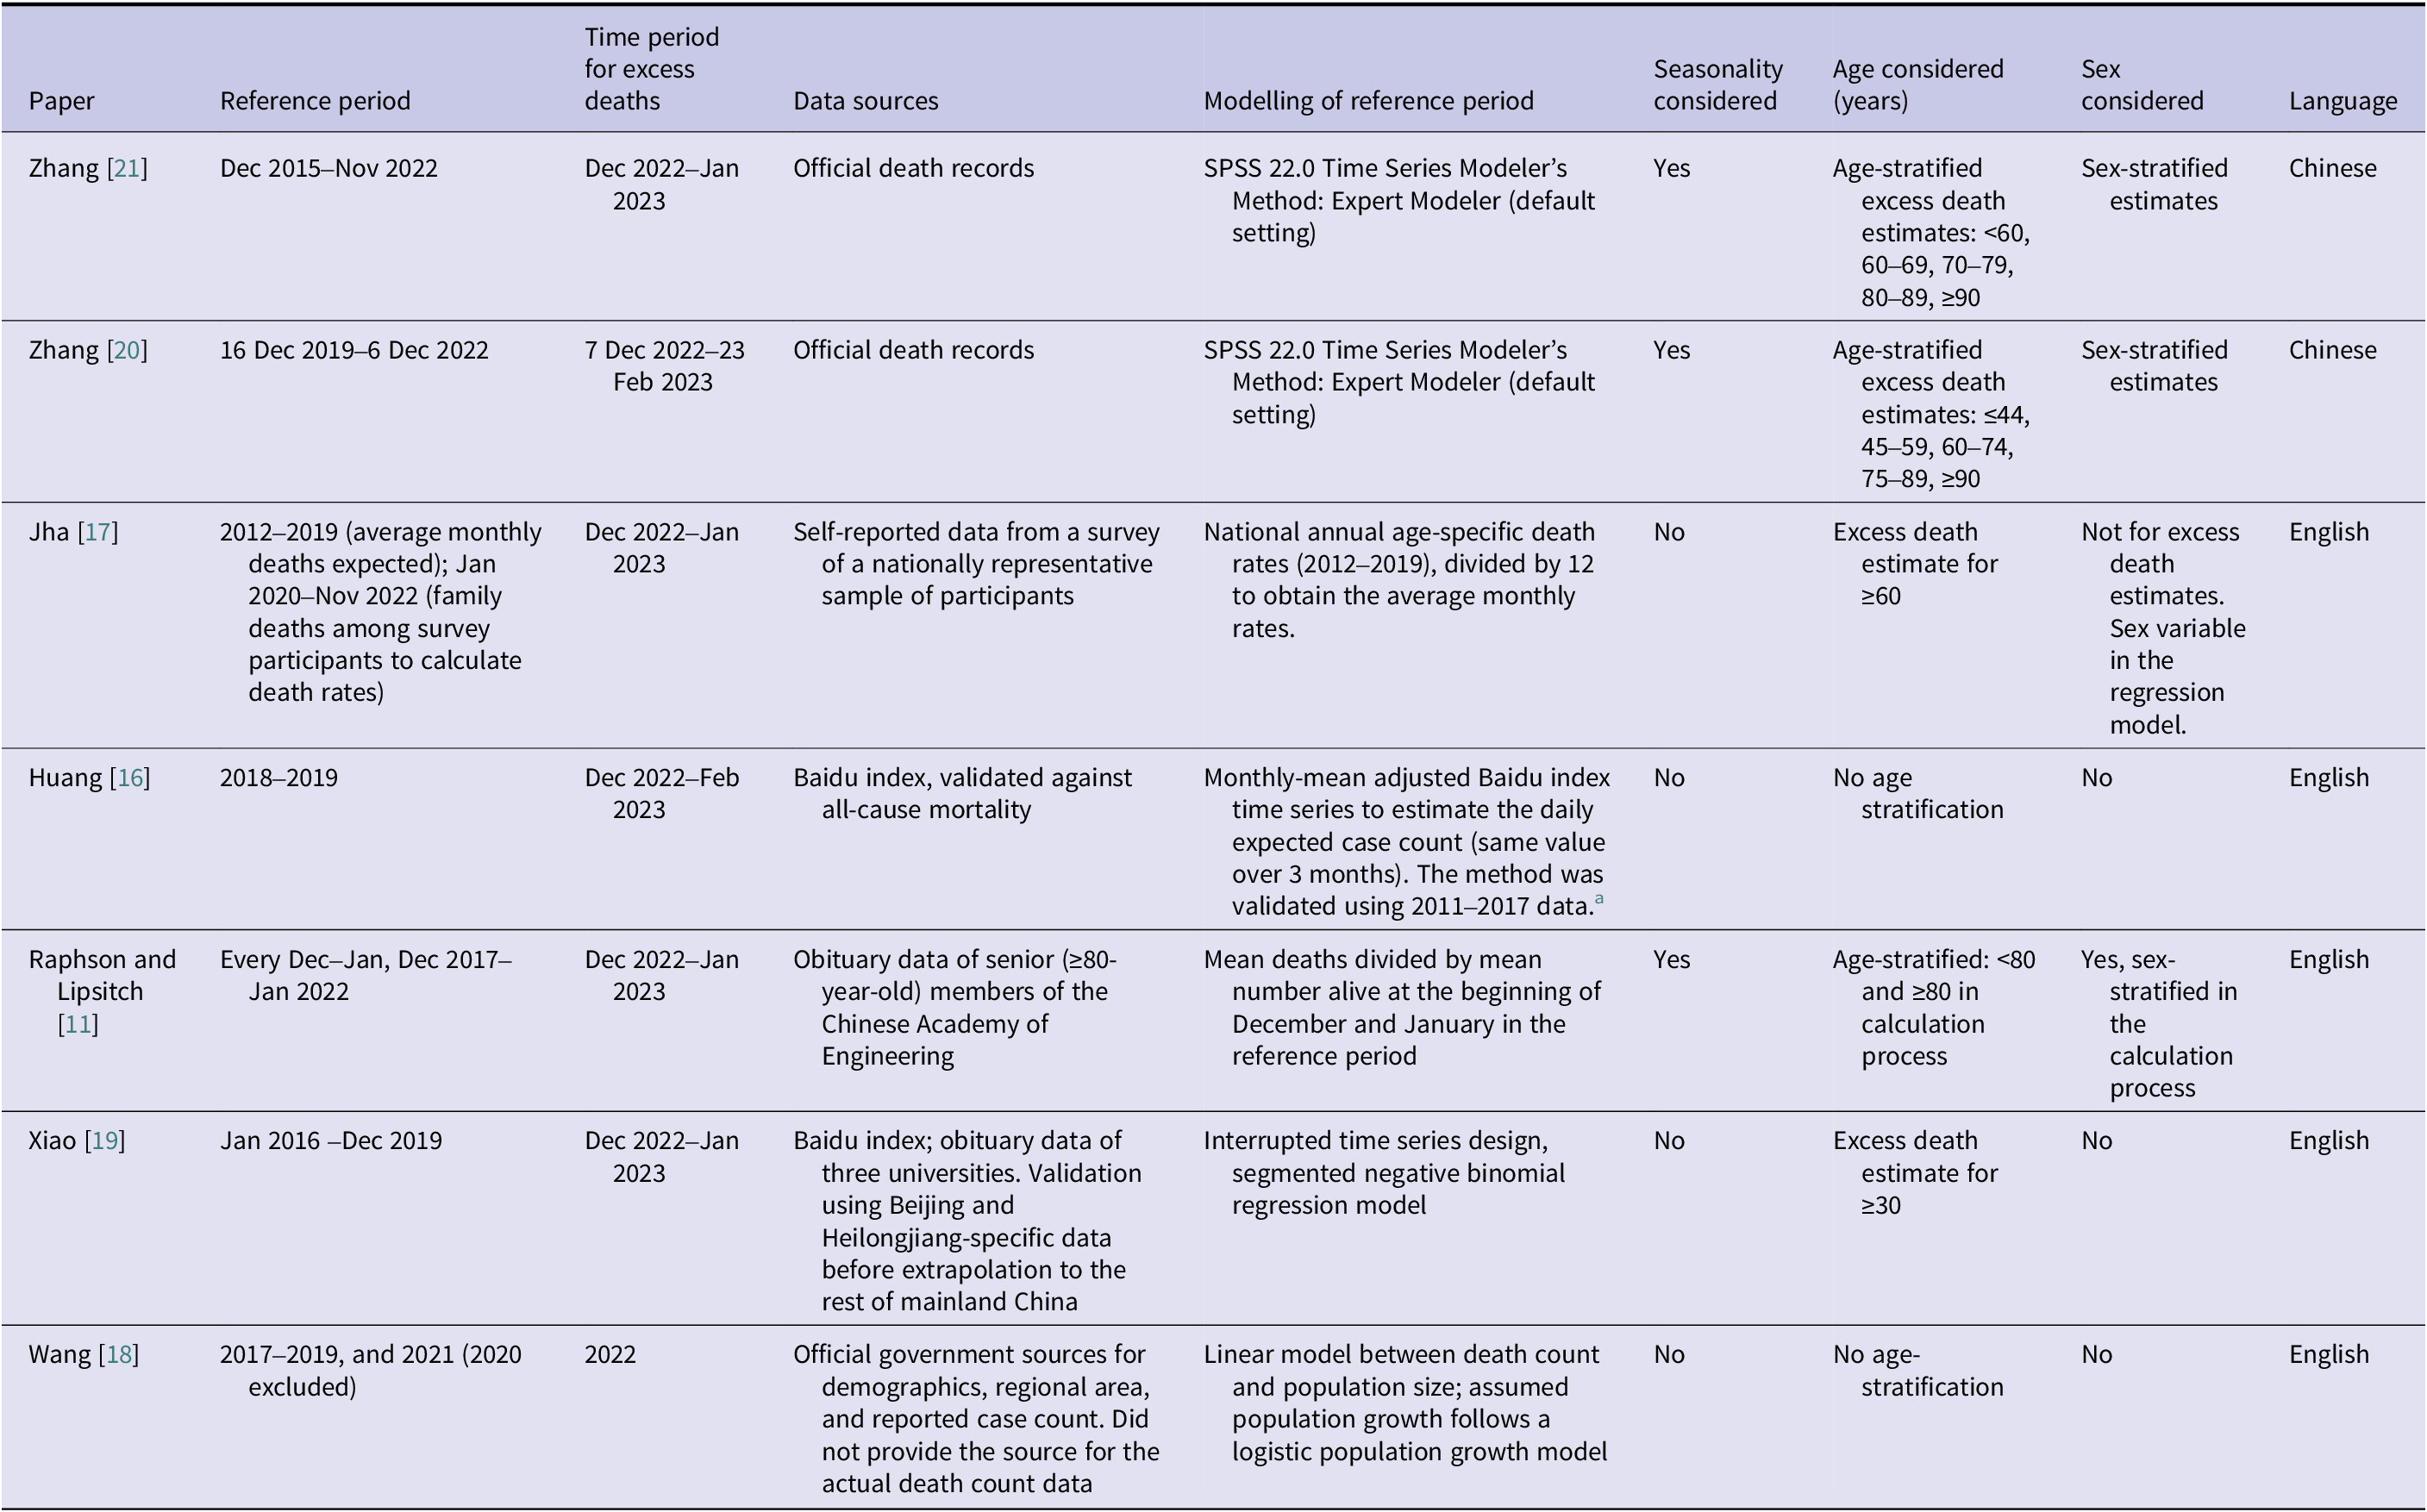
Data sources of the seven included articles, their reference period (with which the expected number of deaths was derived), and the time period in which excess deaths were calculated

a Huang et al. [Reference Huang, Li and Yin16] applied a regression model of natural log-transformed annual mortality data and natural log-transformed Baidu index data, plus a quadratic time trend, to 2011–2017 data to confirm the association between the two metrics. The national monthly-mean adjusted Baidu index time series was a population-weighted average of each province’s index.
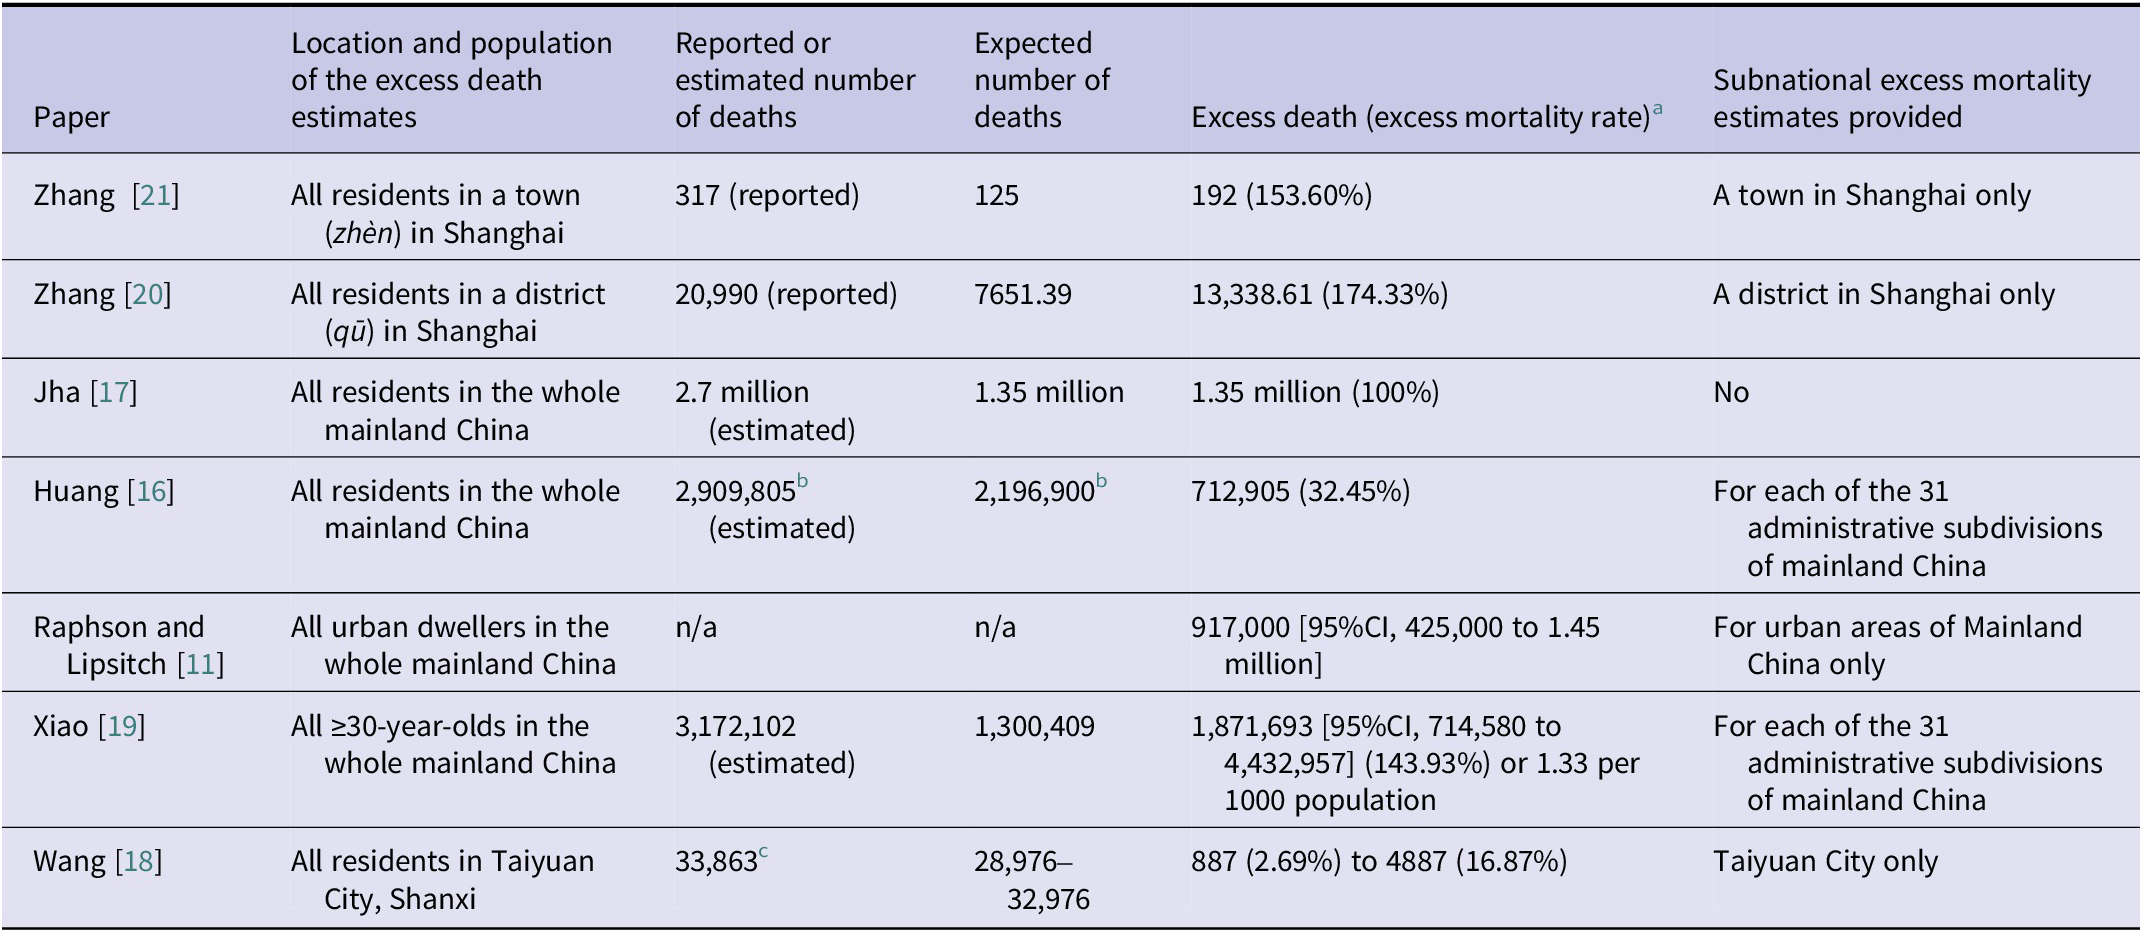
Location (population) of the excess death estimates, reported/estimated number of deaths, expected number of deaths, and excess deaths reported in the 7 included articles

CI, confidence intervals.
Notes: There are 31 administrative subdivisions in mainland China, including 22 provinces (shěng), 5 ‘autonomous regions’ (zìzhìqū) and 4 direct-administered municipalities. Shanghai is a direct-administered municipality (zhíxiáshì), which is equivalent to a province. A district (qū), equivalent to a county, is a subdivision of the municipality. Within a district, there are township-level divisions, i.e., subdistricts (jiēdào) and towns (zhèn).
a Excess mortality rate is calculated by dividing excess death numbers by expected death numbers and multiplying by 100%.
b The expected death per day = 24410 (personal communication, Prof. Oliver Zhen Li). Given a 90-day period (Dec 2022–Feb 2023), we calculated the expected number of deaths as 2,196,900. Given the reported excess death count of 712,905, we calculated the estimated number of deaths (2,909,805) and the excess mortality rate (712905/2196900=32.45%). Neither of these was directly reported in Huang et al. [Reference Huang, Li and Yin16].
c Wang et al. (2024) did not explain how they estimated or obtained the reported number of deaths in Taiyuan, but they presented it in their paper as if it was a reported number from Taiyuan Municipal People’s Government [Reference Wang18].
Zhang et al. (2023) reported that in an unnamed town of 66,703 people, 317 deaths were registered in 2 months (December 2022 and January 2023). The authors estimated 125 (95% CI, 103–148) expected deaths (reference period: December 2017–November 2022), and therefore 192 (95% CI, 169–214) excess deaths. This gave an excess mortality rate of 153.60% (192/125) [Reference Zhang21]. Zhang et al. (2024) reported that in an unnamed district of Shanghai, 20,990 deaths were registered from 7 December 2022 through 23 February 2023. The authors estimated the expected and excess deaths as 7651.39 and 13,338.61, respectively (reference period: 16 December 2019–6 December 2022). This gave an excess mortality rate of 174.33% (13,338.61/7651.39) [Reference Zhang, Zhou and Yan20].
Jha et al. estimated that there were 2.7 million deaths in mainland China, of which 1.35 million were excess deaths (excess mortality rate of 100%) between December 2022 and January 2023 (reference period: 2012–2019; and January 2020–November 2022) [Reference Jha17]. Raphson and Lipsitch estimated 917,000 (95% CI, 425,000–1.45 million) excess deaths among urban dwellers of both sexes in mainland China between December 2022 and January 2023 (reference period: 5 consecutive December–January periods, December 2017–January 2022) [Reference Raphson and Lipsitch11]. Huang et al. estimated 2,909,805 deaths in mainland China between December 2022 and February 2023. With the expected deaths of 2,196,900 (reference period: 2018–2019), they estimated 712,905 excess deaths (excess mortality rate of 32.45%) [Reference Huang, Li and Yin16]. Finally, Xiao et al. estimated that among ≥30-year-olds in mainland China, there were 3,172,102 deaths between December 2022 and January 2023. The expected death count was estimated to be 1,300,409 (reference period: 2016–2019) and so the excess death count was 1,871,693 (95% CI, 714,580–4,432,957) with an excess mortality rate of 143.93% [Reference Xiao19].
Wang et al. reported 33,863 deaths in Taiyuan city in 2022. With the expected death count between 28,976 and 32,976 (reference period: 2017–2019 and 2021), the excess death counts in Taiyuan were estimated to be between 887 and 4887. Excess mortality rates were between 2.69% (887/32,976) and 16.87% (4887/28,976) [Reference Wang18].
Methods for estimating excess mortality
SPSS 22.0 Time Series Modeler’s Method: Expert Modeler (default setting) was applied by Zhang et al. to administrative death counts in both their studies to estimate the expected death counts [Reference Zhang, Zhou and Yan20, Reference Zhang21]. The five English articles used different datasets and methods to estimate excess mortality without access to the official death records. Jha et al. conducted a survey from a nationally representative sample and asked for self-reported family members’ deaths to estimate death rates over time since the beginning of the pandemic [Reference Jha17]. Huang et al. [Reference Huang, Li and Yin16], Raphson and Lipsitch [Reference Raphson and Lipsitch11], and Xiao et al. [Reference Xiao19] used indirect methods to estimate the relative increase in mortality compared with baseline (however it was defined), using either internet search volumes (Baidu index) of mortality-related keywords and/or obituary count from academic institutions. Wang et al. estimated Taiyuan City’s expected death count in 2022 using linear regression of the city-wide death rate in 2017–2019 and 2021 [Reference Wang18] (Tables 1, 2).
Risk of bias assessment
We performed a risk of bias assessment using a modified NOS (Supplementary Text S1). The two Chinese papers scored 10 out of 10 points. The other five papers scored <6 points, indicating a high risk of bias (Supplementary Table S4). NOS scores are reported descriptively and complemented by a qualitative appraisal tailored to modelling studies. No study was excluded based on its NOS score.
Studies estimating COVID-19 death counts only
In Supplementary Text S2, we reviewed four excluded articles that estimated the COVID-19 death count but not the excess death count of the COVID-19 wave after the end of the Zero COVID policy. Amemiya et al. used age-stratified final size equations to estimate 1.44 million COVID-19 deaths in mainland China [Reference Amemiya, Li and Nishiura22]. Cheng et al. estimated a COVID-19 death rate of 83.7 per 100,000 persons (about 1.18 million deaths) in mainland China using an individual-based transmission model [Reference Cheng23]. Du et al. estimated 1.41 million (95% CrI, 1.14–1.73 million) COVID-19 deaths in mainland China again using an individual-based model [Reference Du9]. Ioannidis et al. estimated the age-specific infection-fatality ratios (IFRs) in Hong Kong and South Korea and then applied them to mainland China. In their main scenario, their projected COVID-19 death count was 249 thousand using the Hong Kong IFR or 153 thousand using the South Korea IFR [Reference Ioannidis, Zonta and Levitt24].
In Supplementary Text S3, we summarized two 2022 studies that did not meet our inclusion criteria, but they were often cited by papers reviewed here. In May 2022, Cai et al. published their age-structured stochastic compartmental model exploring different intervention scenarios with mortality prediction and recommended how mainland China could open up safely in a scheduled manner. Their baseline scenario projected 1.55 million COVID-19 deaths (1.10 per 1000) in mainland China over 6 months [Reference Cai25]. Meanwhile, on 14 December 2022, Leung et al. released a medRxiv preprint. Their age-structured meta-population compartmental model explored how this pandemic wave would unfold in real time under several scenarios. Under Scenario 1 (status quo), 568 to 770 per million COVID-19 deaths in mainland China were projected [Reference Leung, Leung and Wu26]. Applying this rate to the same age structure as in Cai et al. [Reference Cai25], this would mean a cumulative COVID-19 death count of 0.80 million to 1.09 million.
Of note, studies in Supplementary Texts S2 and S3 are summarized qualitatively and were not included in the excess-mortality synthesis to preserve its pre-specified scope.
Official reports of in-hospital COVID-19 deaths
Approximately 81,000 in-hospital COVID-19 deaths were reported by China CDC from 9 December 2022 through 30 January 2023 (extracted by Raphson and Lipsitch [Reference Raphson and Lipsitch11] from the original source [10]).
Discussion
This systematic review covers seven peer-reviewed articles that estimated excess deaths in mainland China during the COVID-19 wave following the end of the Zero COVID policy on 7 December 2022. We identified diverse methods applied by these studies and their consequent results, which varied greatly and with great uncertainty.
Two Chinese studies analysed Shanghai’s official death registers, identifying 317 deaths in 2 months in an unnamed town of 66,703 (excess mortality rate=192/125=153.60%) and 20,990 deaths in 2.5 months in an unnamed district (excess mortality rate = 13,338.61/7651.39 = 174.33%), respectively [Reference Zhang, Zhou and Yan20, Reference Zhang21]. Four of the five included English papers provided national estimates of excess deaths [Reference Raphson and Lipsitch11, Reference Huang, Li and Yin16, Reference Jha17, Reference Xiao19], ranging from ~713 thousand (all ages) [Reference Huang, Li and Yin16] to 1.87 million (≥30 years of age) [Reference Xiao19]. Additional studies estimating mortality but not excess mortality are summarized in Supplementary Texts S2 and S3.
Assessment of methods
Excess death estimates are the difference between the actual and expected death counts; a lower expected death count gives a higher excess death estimate. For example, Xiao et al. estimated 1.87 million excess deaths (3.17 million–1.30 million) [Reference Xiao19]; Jha et al. estimated 1.35 million excess deaths (2.70 million–1.35 million) [Reference Jha17]. In contrast, Huang et al. estimated only 0.7 million excess deaths (2.9 million–2.2 million) because the expected death count was as high as 2.2 million [Reference Huang, Li and Yin16].
It is important to note that the actual all-cause mortality estimates of Jha et al. [Reference Jha17] (2.7 million), Huang et al. [Reference Huang, Li and Yin16] (2.9 million), and Xiao et al. [Reference Xiao19] (3.2 million) were higher than the estimates (or projections) of studies that modelled infection counts and estimated COVID-19 deaths based on IFRs (Supplementary Texts S2 and S3). The latter ranged from 249 thousand in Ioannidis et al. [Reference Ioannidis, Zonta and Levitt24] to 1.55 million in Cai et al. [Reference Cai25].
Methodology of expected mortality estimation
In the field of methodology of excess mortality estimation, recent discussion focuses on estimating expected death counts, given that reported mortality data are used in those excess mortality studies. For example, Nepomuceno et al. highlighted that the choice of mortality indices (and their age-standardization), the methods used to estimate the baseline, the reference period, and the data time unit (weekly versus monthly) all affected the expected death count [Reference Nepomuceno27]. Levitt et al. noted the impact of the reference period, the projected period with which excess deaths were estimated, and the time patterns and their forms (e.g., if overall mortality increases or decreases over time and if it is linear or spline fit) on excess death estimates [Reference Levitt, Zonta and Ioannidis28]. Levitt et al. also highlighted the importance of age structure and the analytic decision of whether changes in age structure should be accounted for, because mortality rates increase as populations age over time despite improved healthcare, elevating the expected death counts [Reference Levitt, Zonta and Ioannidis29]. Ioannidis et al. [Reference Ioannidis, Zonta and Levitt30] reviewed nine key issues in excess death estimation that have the potential for improvement, namely, adjusting for changing population structure, adjusting for changes in other high-risk indicators, completeness corrections, sensitivity to modelling choice (including choice of reference period and statistical models), post hoc corrections not based on pre-specified rules, transparency of model and model performance, underestimation of uncertainty, excess death estimates per risk strata, and causal misinterpretation.
Among the studies reviewed herein, the reference period could affect the expected death count and, therefore, the excess death count. For instance, the reference period of Zhang et al. (2024) was 16 December 2019–6 December 2022 [Reference Zhang, Zhou and Yan20]. Most of this period was when the Zero COVID policy was implemented. In contrast, Huang et al. used 2018–19 as the reference period and found a death deficit (i.e., observed < expected) of 1,480,900 from January 2020 to November 2022 [Reference Huang, Li and Yin16]. In other words, using the pre-pandemic time period as the reference period could give a higher expected death estimate and, therefore, a lower excess death estimate. How far into history one should go before the pandemic as the baseline to constitute the expected value may not have a universally accepted answer. Meanwhile, Raphson and Lipsitch’s reference period was five consecutive December–January seasons in December 2017–January 2022, spanning from the pre-pandemic era to the Zero COVID policy period. Their rationale was that the death rate remained the same during the early phase of the pandemic, and no other nationwide disaster would have caused abnormal mortality [Reference Raphson and Lipsitch11]. By only using data from the two winter months, their study could avoid the potential confounding factor of seasonality, should mortality data in China follow a seasonal pattern. In contrast, the other four English studies did not account for seasonality.
Both Chinese studies provided age and sex-stratified excess death estimates, as Zhang et al. analysed official death records [Reference Zhang, Zhou and Yan20, Reference Zhang21]. Zhang et al. (2024) also provided excess death estimates stratified by chronic condition [Reference Zhang, Zhou and Yan20]. Adjusting for population structure in age, sex, and other risk factors that are known to be associated with mortality risk and COVID-19 mortality risk in particular could help generate more accurate estimates. However, the other studies included herein were limited by the available data. If the proportion of deaths underestimated is constant between the reference period and the COVID-19 wave period, the relative changes in mortality rate could be more accurate than the absolute numbers. The two studies using Baidu index data rested on the assumption that the correlation between online searches of mortality-related keywords and actual mortality continued to hold from the reference period to the COVID-19 wave period [Reference Huang, Li and Yin16, Reference Xiao19].
Estimating actual mortality using unconventional data
Besides the uncertainty associated with the expected death counts, all but two studies reviewed herein had an additional challenge: estimating actual death counts when death registration data were not available. Large uncertainties were associated with excess mortality estimates because both actual and expected death estimates were uncertain.
Excess mortality studies that relied on unconventional data (obituaries and internet search volumes) generated estimates with wide confidence bands. Counting obituaries of university staff or senior members of the Chinese Academy of Engineering and using their mortality rates as a proxy might underestimate deaths in the at-risk population, as they receive better-than-average healthcare in China. A 2024 paper [Reference Ioannidis31] found that the prepandemic death rates of the Chinese Academy of Engineering doubled that of the Chinese Academy of Sciences, highlighting the uncertainty associated with the sample choice in Raphson and Lipsitch [Reference Raphson and Lipsitch11]. The same paper suggested that while obituary data of elite academician cohorts were likely accurate, obituary collections of university staff might suffer from missing data [Reference Ioannidis31].
Baidu search volume depends on three variables: internet penetration, internet search habits of users, and the proportion of users choosing Baidu as their search engine. Lower-than-average access to the internet among the lowest socioeconomic stratum of Chinese society may underestimate their mortality. Internet search habits and Baidu market shares vary over time. For example, the market share of Baidu among all search engines in mainland China was 60.87% in December 2022 and 65.21% in January 2023 [32]. Such variation could bias the mortality estimates upwards or downwards.
All-cause mortality and COVID-19 deaths
Excess mortality studies estimated the all-cause mortality attributable to the COVID-19 wave, including deaths not directly caused by COVID-19. Therefore, their death count estimates (Jha et al., 2.7 million [Reference Jha17]; Huang et al., 2.9 million [Reference Huang, Li and Yin16]; Xiao et al., 3.2 million (≥30 years old) [Reference Xiao19]) would be higher than those provided by studies that estimated infection counts and then applied IFR to estimate deaths directly caused by SARS-CoV-2 infection only (Amemiya et al., 1.44 million [Reference Amemiya, Li and Nishiura22]; Cheng et al., 1.18 million [Reference Cheng23]; Du et al., 1.41 million [Reference Du9]; Ioannidis et al., 153–249 thousand [Reference Ioannidis, Zonta and Levitt24]; Cai et al., 1.55 million [Reference Cai25]; Leung et al., 0.80–1.09 million [Reference Leung, Leung and Wu26]; see Supplementary Texts S2 and S3).
Age-dependent risk of death, both IFR and all-cause mortality risk, could be a major source of uncertainty. IFR is difficult to ascertain, given the challenge of ascertaining the true number of infections in the community. Modelling studies (Supplementary Texts S2 and S3) relied on IFR data from other jurisdictions, such as Hong Kong or South Korea. This may underestimate the COVID-19 mortality risk in some of the less developed parts of China, where healthcare is less accessible. Meanwhile, delineating age groups, especially among the elderly, also plays a role here. The mortality risk increases sharply as one progresses into the very old age (e.g., ≥80). If older adults are grouped into larger age bins, e.g., ≥65 or ≥70, both the IFR and the all-cause mortality risk of the age group would be lower on average, underestimating the number of deaths of the very old. Given the age-dependent risk of COVID-19-associated mortality, more granular data among the very old will be beneficial in both data analysis and modelling to obtain a more accurate estimate. Further discussion on the six studies reviewed in Supplementary Texts S2 and S3 is provided in Supplementary Text S4. Discussion on the importance of the COVID-19 wave after the end of the Zero COVID policy in China in the history of public health can be found in Supplementary Text S5.
Significance of this study
This systematic review summarized excess death estimates in mainland China in the COVID-19 wave after the Zero COVID policy ended. The unavailability of nationally registered death data made excess death estimation a double challenge: estimation of both total and expected deaths. This systematic review provided a detailed analysis of the data used in each study and the sources of uncertainty associated with their estimates, and therefore, provides a solid foundation for future studies of excess deaths in similar circumstances worldwide.
Limitations
Limitations of this systematic review are as follows. We did not register this systematic review, and we did not publish a protocol prior to the review process. We did not create a separate data collection form; the data collected are presented in the various tables in this systematic review. The risk of bias assessment of included studies was not part of the original plan. We decided to apply a modified NOS to conduct a risk of bias assessment after the first draft of the systematic review was written. No meta-analyses were conducted because the methods used in the included studies were very different from each other.
This systematic review highlighted the differences in methods, assumptions, and data sources that could be the sources of uncertainty in the excess mortality estimates. A lack of common reference national data highlighted the need for caution when interpreting estimates derived using varied methodologies.
Conclusions
This systematic review summarizes studies that estimated excess deaths in mainland China during the COVID-19 wave after the Zero COVID policy ended on 7 December 2022. Two Chinese papers provided excess mortality rate estimates of 153.6% and 174.3%, respectively, analysing official death records of parts of Shanghai. The excess mortality rate estimates by the five English papers vary greatly (ranging from 2.69% to 767%), given their various estimates of total and expected death counts. The estimated national death count ranged from 2.70 to 3.17 million, and excess deaths ranged from 0.71 to 1.87 million, depending on assumptions and data sources used. The total death counts estimated by these excess mortality studies were higher than six other studies that estimated COVID-19 deaths (but not excess deaths), which estimated 249 thousand to 1.55 million deaths in total. This systematic review highlights the methodological heterogeneity across studies estimating excess deaths in this setting, resulting in substantial variability and uncertainty in the reported estimates.
List of abbreviations
- China CDC
-
Chinese Center for Disease Control and Prevention
- CI
-
confidence interval
- COVID-19
-
coronavirus disease 2019
- CrI
-
credible interval
- IFR
-
infection-fatality ratio
- NOS
-
Newcastle-Ottawa Scale
- PRISMA
-
Preferred Reporting Items for Systematic Reviews and Meta-Analyses
- SARS-CoV-2
-
severe acute respiratory syndrome coronavirus 2
- WoS
-
Web of Science Core Collection
Supplementary material
The supplementary material for this article can be found at http://doi.org/10.1017/S0950268826101022.
Data availability statement
The data that support the findings of this review are presented in the tables and the supplementary materials.
Acknowledgements
HL thanks his research assistant, who assisted with searching the Chinese language bibliographic databases. The authors thank Prof. Hiroshi Nishiura, Dr. Yuri Amemiya, Prof. Prabhat Jha, and Dr. Kathy Leung, who replied to our inquiries regarding their papers and who allowed us to acknowledge them here. The authors thank Prof. Jonathan Dushoff for his feedback on an earlier draft of this manuscript.
Author contribution
Conceptualization: I.C.H.F.; Data Curation: I.C.H.F., H.L., K.J.P., F.B.K., F.A.; Formal Analysis: I.C.H.F., H.L., K.J.P., F.B.K., F.A., G.C.; Investigation: I.C.H.F., H.L., K.J.P., F.B.K., F.A., G.C.; Methodology: I.C.H.F., H.L., A.N.M.K., K.O.K., A.R.A., G.C.; Project Administration: I.C.H.F.; Visualization: I.C.H.F.; Writing – Original Draft: I.C.H.F., H.L.; Writing – Review & Editing: I.C.H.F., H.L., K.J.P., A.N.M.K., K.O.K., A.R.A., F.E.B., H.J.T.U., F.B.K., F.A., G.C.
Funding statement
This research received no specific grant from any funding agency, commercial or not-for-profit sectors.
Competing interests
ICHF consulted for Merck & Co., Inc. All other coauthors have nothing to declare.


 Open access