


Introduction
Adaptive management is a general approach to managing natural resources, the guiding principle of which is “to treat management as an adaptive learning process, where management activities themselves are viewed as the primary tools for experimentation” (Walters Reference Walters1986, p. 3). It is often employed in studies of invasive plants that combine site restoration with field experiments designed to assess project outcomes and improve future management. The details of how adaptive management is implemented vary considerably among studies, but there are two main types of approaches. One is a formal, mathematically rigorous approach based on adaptive control theory (e.g., Bellman Reference Bellman1961) that is discussed at length in the seminal book by Walters (Reference Walters1986). The other is an informal, purely empirical approach in which management activities are viewed as experiments and therefore are designed in such a way that outcomes can be objectively assessed using rigorous statistical methods. With its empirical approach and emphasis on valid experimental designs and statistical methods, the informal type of adaptive management is by far the most common in studies of invasive plants and is the sole focus of the present paper.
Adaptive management studies of invasive plants are often designed to answer questions regarding the absolute efficacy of a given management practice, the relative efficacies of two or more alternative management practices, or the degree to which a restoration project reduced the abundance or spatial extent of a target population. Especially when the focal species are terrestrial, these studies commonly employ traditional plot-based experimental designs that use test and negative control plots as experimental units, random assignment of treatments, replication, and spatial blocking, as in the early applications of adaptive management in forestry by Herring and Pollack (Reference Herring and Pollack1985), Pollack and Herring (Reference Pollack and Herring1985), and Simard (Reference Simard1993). Such designs are structured around what Kaltenbach (Reference Kaltenbach2021, p. 1) calls the “three main pillars of experimental design”—randomization, replication, and blocking—which are intended to ensure the validity of an experiment and permit rigorous and sensitive statistical analysis, typically by ANOVA (e.g., Hinkelmann and Kempthorne Reference Hinkelmann and Kempthorne2008; Kaltenbach Reference Kaltenbach2021; Mead et al. Reference Mead, Gilmour and Mead2012; Montgomery Reference Montgomery2013).
There are many situations, however, where the use of plots is not feasible (this is often true in aquatic habitats) or not appropriate (e.g., when the main focus is on assessing effects of management practices on individual plants such as trees or shrubs). Additionally, statistical methods that require strong assumptions about the probability distribution from which the data were sampled (e.g., ANOVA, parametric t-tests) are susceptible to violations of those assumptions that invalidate use of the method. How, then, are we to design studies and analyze the resulting data in cases where experimental plots are not feasible or appropriate, or the assumptions of distribution-specific statistical methods cannot be convincingly verified or are clearly violated?
The purpose of the present paper is to review several alternative study designs and nonparametric statistical methods we have found useful for addressing these problems but which have been used less frequently in published studies of invasive plants than we think their utility merits. As background, we begin with brief descriptions of three alternative study designs, then explain what we mean by nonparametric statistical methods and why they are sometimes preferable to parametric methods. We then turn to the main part of the paper, which is an overview of several useful nonparametric statistical methods for the three alternative study designs we consider. For each design, we present a set of research questions that are of interest in applied studies of invasive plants and that the design is well suited to answer. For each of these research questions, we present at least one appropriate nonparametric statistical method and provide corresponding references to the statistical literature. For each statistical method, we identify at least one function from the standard or contributed packages of the R programming language and computing environment (R Core Team 2023) that implements the method, and in the Supplementary Material, we provide an example where we apply the method to real or simulated data, as well as a complete R program that illustrates how the method can be used in R.
Throughout this paper, we use the term “treatment” in a manner consistent with the terminology of Hinkelmann and Kempthorne (Reference Hinkelmann and Kempthorne2008). Thus, treatments include test treatments as well as the null (or negative control) treatment and any positive control treatments, if used. In the present context, the null treatment is the “do nothing” management option, while test treatments include all management options that involve physical, chemical, or biological manipulations, such as manual removal of individual plants, foliar application of particular herbicides, or introduction of a biological control agent. With this terminology, “random assignment of treatments” explicitly includes assignment of null and positive control treatments with no abuse of language, and we refer to statistical comparisons between “test and null treatments” instead of “treatments and negative control.”
Examples of Useful Study Designs
We now give three examples of useful adaptive management study designs that yield data of types that often are best analyzed with nonparametric statistical methods. For practical reasons related to the fact that restoration typically is the central goal of these studies, all three types of study design often employ an area that is spatially separated from the site to be restored and receives only the null treatment—usually called a reference area—as the experimental device for providing evidence that reductions in frequency or abundance of the target species in areas where a test treatment was applied are actually due to the test treatment instead of some unknown factor such weather that may have affected the entire study area. We close this section with a brief explanation of why reference areas are not true negative controls.
Fate of Marked Plants
When feasible, one of the most useful alternative designs for adaptive management studies of “large” invasive plants (e.g., trees, shrubs) consists of marking individual plants and following their fates, as illustrated in Figure 1 (left). Here we briefly describe how such designs are implemented so the link between the type of data produced and the statistical methods suggested in a later section will be clear.
Examples of useful study designs and data types for adaptive management studies of invasive plants. “Ref” denotes the reference area. Left, Determining the fate of marked plants following treatment. Black symbols, marked plant is alive; gray symbols, marked plant is dead. Center, Pre- and posttreatment point intercept surveys with binary data. Filled dots, live plants of the target species are present at the survey point; open dots, live plants of the target species are not present at the survey point. Right, Pre- and posttreatment point intercept surveys with quantitative data. Darker dots correspond to higher local densities of the target species.

Before any treatments are applied, a workable number of target plants in the study area (all, if feasible) are marked in a way that will not affect their growth, survival, or response to treatment. A single test treatment can be applied to all marked plants or, alternatively, two or more different test treatments can be randomly applied to subsets of the marked plants. After an appropriate amount of time following treatment application, each marked plant is checked and its status (treatment outcome) is recorded. The status of a plant usually is the outcome of a binary event (e.g., alive or dead, resprouted or not resprouted), and the goal is to estimate the probability of the desired outcome (e.g., dead) and its 95% confidence interval, or to compare these probabilities for different treatments. One of the treatments can be the null treatment, in which case plants that receive it are negative controls. In this case, however, some of the invasive plants in the restoration area will be left untreated.
The issue of how long to wait after treatments are applied before assessing outcomes is important but is a biological rather than statistical problem and therefore will not be discussed in detail here. The basic point is that treatment outcomes must be assessed at a time that is sufficiently long after treatment and at an appropriate point during the growing season so the assessment provides conclusive evidence regarding treatment efficacy, as defined by the management goals. For example, if the goal of management is to kill invasive Japanese knotweed (Polygonum cuspidatum Siebold & Zucc.) plants via foliar application of a particular herbicide, then it would not be appropriate to assess efficacy a month after treatment, because one could only determine whether the herbicide had killed the aboveground portion of the plant. Instead, one must wait until the growing season in the following year to determine whether new shoots sprout from the existing root stocks or rhizomes.
The practical goals of an adaptive management study might not permit leaving untreated invasive plants in the restoration area. In such cases, it is often possible to employ a nearby reference area instead. Marked plants in the reference area receive the null treatment (meaning that no test treatment is applied to them) and play a role somewhat like negative controls. These plants become important if, as is usually the case, a significant proportion of marked plants in the restoration area exhibit the desired outcome after application of the test treatment(s). If the proportion of marked plants exhibiting this outcome in the reference area is substantially lower, then it is reasonable to attribute the elevated proportion in the restoration area to the test treatment(s). If, however, the proportion of marked plants exhibiting the desired outcome is as high or higher in the reference area as in the restoration area, it is likely that some unrelated factor that was not intentionally manipulated (e.g., weather conditions) affected both areas, and the management experiment is therefore uninformative.
Point Intercept Surveys
Conducting point intercept surveys before and after application of alternative management practices (treatments) is a particularly useful approach in adaptive management studies of invasive plants, because it allows one to conduct large-scale site restoration simultaneous with rigorous assessment of the efficacy of a given management treatment or the relative efficacies of two or more alternative treatments. Another benefit is that field crews typically do not know the locations of the survey points when applying test treatments, thus removing any temptation to increase treatment effort at locations where efficacy will be measured (this is a form of blinding, another basic principle of good experimental design intended to reduce bias: Kaltenbach [Reference Kaltenbach2021, pp. 9–10]; Mead et al. [Reference Mead, Gilmour and Mead2012, p. 236]). This method is commonly used in studies of invasive aquatic plants (e.g., Gannon et al. Reference Gannon, Newman and Thum2022; Parks et al. Reference Parks, McNair, Hausler, Tyning and Thum2016; Thum et al. Reference Thum, Wcisel, Zuellig, Heilman, Hausler, Tyning, Huberty and Netherland2012; Wersal et al. Reference Wersal, Madsen, McMillan and Gerard2006, Reference Wersal, Madsen, Woolf and Eckberg2010) but to date has only rarely been used in studies of invasive terrestrial plants (for an example, see Rice et al. Reference Rice, Leimbach-Maus, Partridge and McNair2020). As we did for studies that follow the fate of marked plants, we will briefly describe how point intercept surveys are conducted so the link between the type of data produced and the corresponding statistical methods suggested in a later section will be clear.
The basic idea behind point intercept surveys is illustrated in Figure 1 (center and right). Typically, a grid of survey points is created using GIS software, with equal spacing between rows and columns of points. Point locations are then transferred to handheld GPS receivers, which are used to navigate to the points in the field. Some form of sampling is conducted at each survey point, the exact nature of which depends on the size of the focal invasive plant, whether the study site is aquatic or terrestrial, and whether one wishes to merely determine local presence–absence (Figure 1, center) or to make quantitative estimates of local abundance or density (Figure 1, right). For example, in their study of invasive baby’s breath (Gypsophila paniculata L.) in dune habitats of coastal western Michigan, USA, Rice et al. (Reference Rice, Leimbach-Maus, Partridge and McNair2020) employed survey grids with a spacing of 50 m between rows and columns of points and counted the number of G. paniculata plants within a 2-m radius around each survey point.
Point intercept surveys are conducted before and after management treatments are applied, typically using the same survey grid to maximize the ability to detect changes between surveys. The resulting data therefore consist of matched pairs. (This procedure assumes that pretreatment sampling does not measurably reduce abundance of the target species at survey points; if the chosen sampling method measurably reduces abundance of the target species, then separate pre- and posttreatment survey grids must be employed, data no longer consist of matched pairs, and less-powerful statistical methods must be used.) With quantitative data, the differences in local density before and after treatment at the various sampling points can be used to assess the efficacy of a given management treatment or to compare efficacies of two or more treatments. Changes in presence or absence at the various sampling points can be used in a similar fashion, although with different statistical methods. Because each matched pair of observations is made at the same survey point, the role of spatial habitat variability across the restoration area in inflating the variability of outcomes is partially controlled, thus increasing the ability of the experiment to detect temporal differences, compared with surveys using different pre- and posttreatment sampling points. (As with studies that follow the fate of marked plants, the issue of how long to wait after treatments are applied before conducting the posttreatment survey is important but is a biological rather than statistical problem.) If feasible, an additional survey grid should be established in a reference area outside the restoration area for the same reason as in studies that follow the fate of marked plants.
Plot-Based Experiments with Nonnormal Data
As a third and final example, we mention classical plot-based experimental designs such as the randomized complete-block design, where plots (quadrats) are the experimental units and all treatments are randomly assigned to plots within spatial blocks. If the strong assumptions of ANOVA (normality of residuals, homogeneity of variance, independence of residuals) are found to be reasonable approximations when carefully assessed, then data from such an experiment would be analyzed using standard parametric ANOVA with some type of pairwise comparisons to assess or compare efficacies of different management treatments. It is our experience, however, that data from field experiments with plants in non-agricultural terrestrial habitats often plainly violate the normality and variance homogeneity assumptions, even when transformations of the data are applied. In such cases, some of the same nonparametric or distribution-free statistical methods we review in this paper can be employed instead. (If only the variance homogeneity assumption is violated, treatment outcomes can be compared pairwise using the parametric Games-Howell test in R package PMCMRplus [Pohlert Reference Pohlert2023].) Additionally, negative control plots within the restoration area can be replaced with plots receiving the null treatment in a reference area outside the restoration area.
Why Reference Areas Are Not True Negative Controls
Adaptive management field studies designed in accordance with standard statistical principles of experimental design require negative control plots if, as is usually the case, it is necessary to provide objective evidence that changes observed in plots to which test treatments were assigned are actually due to the test treatments instead of some unknown factor that was not controlled. In such cases, a significant portion of the study area will be left unrestored. By contrast, governmental agencies and other organizations that fund applied studies of invasive plants typically require restoration to be the main goal of the projects they elect to fund, and the key measure of project success is the number of hectares restored. Thus, there is a partial conflict between the requirements of good experimental design and the necessity of maximizing the area restored.
A pragmatic way to address this problem is to employ an alternative study design with a reference area outside the area targeted for restoration. In practice, the reference area often is an area that for some reason is not available for restoration at the time the study is conducted. For example, it might be an area within the study site that contains a threatened or endangered species that would be decimated by the test treatment(s), a portion of a large park—too large to be restored in its entirety in a single year with available resources—that will be restored in a future year, or a separate lake where the target aquatic species occurs but funding for herbicide application is not available in the current year. The key points are that the reference area is spatially distinct from the restoration area and that the restoration area receives only the test treatment(s), while the reference area receives only the null treatment.
Habitat characteristics in natural lands typically exhibit substantial spatial variability. As a result, the fact that the restoration and reference areas are spatially distinct implies it is not reasonable to assume the only meaningful difference between the two areas is that one receives the test treatment(s) and the other receives the null treatment. Mainly for this reason, the reference area is not a valid negative control. In terms of classical experimental design, the restoration area is a spatial block to which only test treatments are applied, while the reference area is a spatial block to which only the null treatment is applied. The block and treatment effects are therefore confounded.
However, provided the restoration and reference areas are similar in habitat, are subject to similar levels of human and natural disturbance, and are close enough to each other so both are likely to be subject to the same levels of key weather variables (e.g., photosynthetically active radiation, temperature, and precipitation), it is reasonable to assume that the temporal change in abundance or density of the target species in the two areas would be approximately the same if the test treatment was not applied. Therefore, if the restoration area shows a statistically significant decrease in abundance or density of the target species following application of the test treatment, and if the reference area either shows no statistically significant decrease or, as is not uncommon, shows a decrease that is statistically significant but is significantly smaller than in the restoration area, then it is reasonable to attribute the greater decrease in the restoration area to the test treatment. If, however, both restoration area and reference area show a decrease and the decrease is not significantly smaller in the reference area, then there is no sound evidence that the test treatment was effective.
It is apparent that a reference area mainly serves as a check to determine whether there is evidence that some factor other than the test treatment might be responsible for an observed decrease in abundance or density of the target species in the restoration area. The evidence clearly is not as strong as the evidence provided by classical plot-based designs that use proper spatial blocking and valid negative controls, but these designs often are undesirable because, as noted earlier, they leave a significant portion of the study area unrestored.
What Are Nonparametric Statistical Methods, and Why Are They Useful?
Data produced using the study designs outlined in the previous section are often best analyzed with statistical methods that do not require verification of an assumed type of probability distribution from which the data were sampled, either because the appropriate type of distribution is known (e.g., binary data characterizing the fate of marked plants or the presence–absence status at survey points in a point intercept survey; such data necessarily come from a Bernoulli distribution, with “success” and “failure” probabilities that sum to 1) or because the appropriate distribution is determined computationally from the data by a statistical resampling method (e.g., bootstrap or permutation tests for quantitative data characterizing local abundance at survey points in a point intercept survey). For methods that do require such verification, the assumed distribution may or may not be normal; the problem is that validity of the statistical method requires one to verify convincingly that the empirical distribution of the data or residuals closely approximates the assumed distribution. Such methods are variously described in the statistics literature as parametric, fully parametric, or distribution specific. None of these terms, however, is entirely satisfactory, as each implies a distinction that is blurred for certain statistical methods. There seems to be no way around this terminological problem, so for convenience, we will simply refer to all such methods as parametric statistical methods.
The main advantage of the alternative methods we will suggest is that they do not require one to assume a specific type of distribution for the data that must be convincingly verified. Methods of this type are variously described as nonparametric, semiparametric, or distribution free, depending on details of the specific method, but all of these terms are imprecise. For convenience, we will refer to such methods simply as nonparametric statistical methods.
Conover (Reference Conover1999, p. 118) provides a useful definition of the term “nonparametric” that reflects its usage in the statistics literature:
A statistical method is nonparametric if it satisfies at least one of the following criteria: (1) The method may be used on data with a nominal scale of measurement. (2) The method may be used on data with an ordinal scale of measurement. (3) The method may be used on data with an interval or ratio scale of measurement, where the distribution function of the random variable producing the data is either unspecified, or specified except for an infinite number of unknown parameters.
For future reference, we note that under Conover’s definition, statistical methods for binary data are classified as nonparametric, because they are used on data with a nominal scale of measurement (e.g., “success” vs. “failure,” “alive” vs. “dead”). In the simplest case, where one is directly estimating proportions or success probabilities with no explanatory variables, the rationale for this traditional classification is as follows. The empirical probability distribution for the data is necessarily Bernoulli, because there are only two possible outcomes for each observation. Thus, the assumed type of distribution (Bernoulli) necessarily agrees with the observed type of distribution and therefore does not require verification. Moreover, the empirical probability mass function and the fitted Bernoulli probability mass function also necessarily agree, with the probabilities of success and failure for both being the observed proportions n 1/n and 1 − n 1/n of successes and failures, where n 1 is the observed number of successes in n trials.
Some methods for binary data, not addressed in this paper, use a statistical model that represents effects of explanatory variables on the success probability by including a parametric component that specifies an assumed functional relationship between the success probability and explanatory variables. Such methods are referred to as semiparametric methods, which we here lump into the nonparametric class (as noted earlier). Examples of semiparametric methods include logistic regression and its generalizations, as well as various methods of statistical time-to-event analysis, such as the Cox proportional hazards model and the accelerated failure time model (Harrell Reference Harrell2015). In logistic regression, for example, the observed outcome for each combination of explanatory variables is either a “success” or a “failure.” Therefore, the empirical probability distribution for each combination is Bernoulli and necessarily agrees with the type of distribution assumed by the statistical model. However, the estimated success probabilities for different combinations of values of the explanatory variables typically will not agree exactly with the corresponding observed proportions of successes (here we assume replication is employed; otherwise, no satisfactory estimate of the observed proportions of successes for different combinations of values of the explanatory variables is possible). The observed type of distribution is still Bernoulli, but the estimated probabilities of success and failure diverge from the empirical probabilities, because the assumed functional form of the parametric component of the model is not flexible enough to permit exact agreement.
Another potentially puzzling implication of Conover’s definition concerns the large-sample methods we will mention in several places. These methods apply to nominal (binary) data and are therefore nonparametric under Conover’s definition. However, each is based on a statistic that is a standardized sum of random variables that, as a consequence of the central limit theorem, has an approximately (standard) normal distribution if the sample size is sufficiently large (e.g., Chung Reference Chung2001, chap. 7). These methods can be used to construct approximate confidence intervals and hypothesis tests that are based on a fully parametric distribution (the standard normal distribution), yet they are commonly included under the rubric of nonparametric methods and are covered by both Conover (Reference Conover1999) and Hollander et al. (Reference Hollander, Wolfe and Chicken2014). They do, however, require verification that the sample size is large enough for the normal approximation to be adequate.
The variety and advantages of nonparametric statistical methods are well known to many research statisticians but, based on our interactions with colleagues over the years, seem to be less well known among biologists. Hollander et al. (Reference Hollander, Wolfe and Chicken2014, p. xiii) state without reservation that “the nonparametric approach is the preferred methodology for statisticians.” This assertion obviously may be questioned in certain areas of application (e.g., many laboratory and agricultural experiments—basically, the types of application that historically were the basis for developing ANOVA as a statistical method), but it clearly is true in many others, especially those involving human subjects. For example, despite the availability of fully parametric distribution-specific methods that allow one to specify any of a wide variety of probability distributions for the data, statistical analyses of time–to–event data in medical studies almost always employ nonparametric methods as defined by Conover, including both fully nonparametric methods like the Kaplan-Meier estimator of the survival function and distribution–free semiparametric methods like the Cox proportional hazards model, as well as related tests for group differences (e.g., Klein and Moeschberger Reference Klein and Moeschberger2003; Therneau and Granbsch Reference Therneau and Grambsch2000). The main reasons are that convincing verification of any particular distribution often is very difficult or impossible with available data, the statistical results often are sensitive to the choice of distribution, and the possibility of reaching erroneous conclusions based on an inappropriate choice of distribution may have serious implications for human health (e.g., Anderson-Bergman Reference Anderson-Bergman2017, p. 2; Conover Reference Conover1999, p. 2).
Hollander et al. (Reference Hollander, Wolfe and Chicken2014, pp. 1–2) provide an instructive list of 10 advantages of nonparametric statistical methods over parametric methods. Paraphrasing and condensing their list somewhat, the advantages that are most relevant to adaptive management studies of invasive plants are the following. Nonparametric methods:
-
• require fewer assumptions about the underlying populations from which the data are obtained (e.g., no specific probability distribution, such as a normal distribution, is assumed for ratio or interval data), and therefore are applicable to many situations where parametric procedures are either invalid or intractable;
-
• are relatively insensitive to outliers compared with parametric methods;
-
• permit computation of exact P-values for tests, exact coverage probabilities for confidence intervals and bands, and exact experiment-wise error rates for multiple-comparison procedures without assuming the underlying populations have any specific probability distribution; and
-
• are only slightly less efficient than classical normal-theory methods when the underlying populations are approximately normal, and can be slightly to greatly more efficient than these methods when the underlying populations are not approximately normal.
For statistical tests, the last item in this list essentially means that nonparametric tests require only slightly larger sample sizes to achieve the same statistical power as the corresponding parametric tests when the normality assumption for the underlying populations is tenable, while slightly to much smaller sample sizes may suffice when it is not tenable. This important point is emphasized by Lehmann (Reference Lehmann1975, p. viii) in his classic text on nonparametric statistical methods: “The feature of nonparametric methods mainly responsible for their great popularity (and to which they owe their name) is the weak set of assumptions required for their validity. Although it was believed at first that a heavy price in loss of efficiency would have to be paid for this robustness, it turned out, rather surprisingly, that the efficiency of the Wilcoxon tests and other nonparametric procedures holds up quite well under the classical assumption of normality and that these procedures may have considerable advantages in efficiency (as well as validity) when the assumption of normality is not satisfied.”
Conover (Reference Conover1999, p. 2) gives the following balanced characterization of the role of nonparametric statistical methods in general, which applies to adaptive management studies of invasive plants in particular: “Nonparametric methods have become essential tools in the workshop of the applied scientist who needs to do statistical analyses. When the price for making a wrong decision is high, applied scientists are very concerned that the statistical methods they are using are not based on assumptions that appear to be invalid, or are impossible to verify.” Thus, both parametric and nonparametric methods are essential tools in the statistical toolbox. Parametric methods are likely to be the best choice when their strong assumptions can be convincingly verified; otherwise, nonparametric methods are a better option.
Management Experiments Using Marked Plants
We turn now to a survey of selected nonparametric statistical methods that we have found to be useful in adaptive management studies of invasive plants, beginning with methods appropriate for field experiments using marked plants. Here, there are one or more groups of plants—typically either one group of a single species receiving a single management treatment, two or more groups of a single species receiving different management treatments or different levels of the same treatment, or different species receiving the same management treatment. A known number of well-spaced plants are marked, and a management treatment is applied individually to each plant in each group. If the experiment involves two or more treatments or levels, they are assigned randomly to individual plants, usually with the same number of plants in each treatment group. All plants are then assessed at a later time to identify those for which each management treatment was effective, as defined in some unambiguous way. More generally, individuals could be assessed at multiple times following treatment, yielding data appropriate for statistical time–to–event analysis, but funding levels for adaptive management studies of invasive plants rarely permit this level of effort, and we therefore do not discuss this approach here.
The statistical methods we review for experiments of this type assume that the recorded outcome of applying any given management treatment to an individual plant is binary and that the treatment application can therefore be interpreted unambiguously as either effective (“success”) or ineffective (“failure”) in producing the desired outcome (e.g., death). The statistical methods yield estimates, confidence intervals, or tests of statistical hypotheses for a parameter that represents the probability that a given treatment will be effective when applied to a randomly chosen plant of the focal species. We will call this parameter the probability of effective treatment (PET). For most purposes, the PET can be thought of as the proportion of a large number of plants for which the treatment would be effective. We motivate the statistical methods we review by considering four research questions they can be used to answer, dealing with the PET for a single group of plants or comparing PETs for two groups.
Assessing the Efficacy of a Single Management Treatment on a Single Species
We begin by considering two research questions involving a single management treatment applied to a single target species. The treatment can be the null treatment (the “do nothing” management option) but usually will be a test treatment, and the “species” might actually be a particular hybrid or genotype.
Question 1: What Is the PET and Its 95% Confidence Interval for a Given Test Treatment?
The goal here is to estimate the PET and its 95% confidence interval for a particular species, treatment type, and treatment level.
Statistical method: The maximum-likelihood estimator for (binomial) PET parameter p is N 1/n, where random variable N 1 represents the number of n marked plants for which treatment was effective. Thus, using the maximum-likelihood approach, the best estimator of success parameter p is simply the commonsense estimator: the proportion of marked plants for which the treatment was effective. Numerous methods have been proposed for estimating confidence intervals for a binomial success probability. Two that are simple but perform very well are the Wilson interval and the Agresti–Coull interval, with the former performing slightly better than the latter except when p is very close to 0 or 1. The traditional Wald confidence interval has poor statistical properties and should not be used. Additional details are provided in section 1.1 of Supplementary Appendix S1.
Recommended references: Agresti (Reference Agresti2013, sect. 1.4.2, exercise 1.25); Agresti and Coull (Reference Agresti and Coull1998); Brown et al. (Reference Brown, Cai and DasGupta2001).
R functions: Wilson and Agresti-Coull confidence intervals can be computed with the binom.confint() function in R package binom (Dorai-Raj Reference Dorai-Raj2022).
Example: An example using real data from an adaptive management study of invasive Norway maple populations (Acer platanoides L.) is presented in section 1.1 of Supplementary Appendix S1. The R program used in this example and its output are provided in section 1.1 of Supplementary Appendix S2.
Question 2: Does the PET for a Given Test Treatment Exceed Prescribed Management Threshold p⋆
The goal now is to determine whether there is strong evidence that management objective p > p ⋆ has been achieved for a particular species, treatment type, and treatment level, where p is the PET and p ⋆ is a threshold value to be exceeded.
Statistical method: The null hypothesis here is that PET p equals management threshold p ⋆ (H0: p − p ⋆ = 0), and the relevant alternative is the one-sided hypothesis that p exceeds p ⋆ (H1: p − p ⋆ > 0). (H0 and H1 here are the traditional shorthand for “null hypothesis” and “alternative hypothesis”.) The main tests are the exact binomial test and the mid-P binomial test; for sufficiently large samples, there is also a large-sample test for proportions. Simulation studies show that the exact binomial test is unduly conservative. The false-positive error rate of the mid-P binomial test is closer to the nominal α (significance level) but may exceed it slightly, so P-values less than α but very close to it are suspicious. Additional details are provided in section 1.1 of Supplementary Appendix S1.
Recommended references: Agresti (Reference Agresti2013, pp. 13–14, 16–17); Hollander et al. (Reference Hollander, Wolfe and Chicken2014, pp. 11–13).
R functions: The exact binomial test can be performed with R’s pbinom() or binom.test() function. The resulting P-value can be adjusted downward to obtain the mid-P P-value using R’s dbinom()function (see section 1.2 of Supplementary Appendix S1). The large-sample test can be performed with the prop.test() function, or simply by using the pnorm() function. All of these functions are included in the stats package (R Core Team 2023), which is part of R’s standard library.
Example: An example using the A. platanoides data is presented in section 1.1 of Supplementary Appendix S1 and the corresponding R program and output in section 1.1 of Supplementary Appendix S2.
Comparing Treatment Efficacy in Pairs of Treatments or Species
We now consider two research questions involving comparisons between two groups of individual plants. The groups usually will consist of individuals receiving one or the other of two treatments (two test treatments, or test and null treatments) but could instead consist of two invasive species receiving the same test treatment.
Question 3: Do PETs pA and pB for Plant Groups A and B Differ?
Here the goal is to determine whether there is strong evidence that the PETs for two groups of plants differ. In the most common situation, the two groups are plants of a target invasive species that receive different management treatments, one of which might be the null treatment. The null hypothesis is that there is no difference; the alternative hypothesis can be either two-sided or one-sided, depending on whether one or both alternatives are of interest.
Statistical method: We are interested in testing the null hypothesis that PETs p A and p B are the same (H0: p A − p B = 0) against either the two-sided alternative hypothesis that p A and p B are different (H1: p A − p B ≠ 0) or the one-sided alternative hypothesis that p A is greater than p B (H1: p A − p B > 0), with group labels A and B assigned appropriately. The best tests of H0 are the mid-P version of the exact conditional binomial test and various versions of Barnard’s exact unconditional binomial test; Fisher’s well-known exact conditional binomial test should not be used, as simulation studies have shown it produces P-values well above the correct values. Large-sample tests of H0 are based on approximate normality of the standardized difference between the maximum-likelihood estimators of p A and p B. Additional details are provided in section 1.2 of Supplementary Appendix S1.
Recommended references: Agresti (Reference Agresti2013, pp. 78, 93–94); Hollander et al. (Reference Hollander, Wolfe and Chicken2014, sect. 10.1, sect. 10.1 comments 4 and 5); Mato and Andrés (Reference Mato and Andrés1997); see also the documentation for the exact.test() function in R package Exact (Calhoun Reference Calhoun2022).
R functions: Various versions of the exact unconditional binomial test can be performed using the exact.test() function in R package Exact; the package author recommends using Barnard’s original version of the test when computationally feasible, as specified by option method=″csm″. The R function prop.test() in the stats package tests H0 using a large-sample test that handles both the two-sided and the one-sided H1. It checks a condition for adequacy of the large-sample approximation and reports a warning if it is violated. Function prop.test() also computes the Newcombe confidence interval for p A − p B.
Example: An example using the A. platanoides data is presented in section 1.2 of Supplementary Appendix S1. The corresponding R program and its output are displayed in section 1.2 of Supplementary Appendix S2.
Question 4: What Is the Difference between the PETs for Plant Groups A and B and Its 95% Confidence Interval?
The goal in this case is to estimate the difference p A − p B between the PETs for groups A and B and to estimate its 95% confidence interval.
Statistical method: PET difference p A − p B can be estimated by the difference between the maximum–likelihood estimators for p A and p B. The preferred methods for estimating confidence intervals for p A − p B are the Newcombe hybrid score and Agresti-Caffo estimators. The traditional Wald confidence interval has poor statistical properties and should not be used. Details are provided in section 1.2 of Supplementary Appendix S1.
Recommended references: Agresti (Reference Agresti2013, note 3.1, exercise 3.27); Agresti and Caffo (Reference Agresti and Caffo2000); Fagerland et al. (Reference Fagerland, Lydersen and Laake2015).
R functions: Newcombe hybrid score and Agresti-Caffo confidence intervals for p A − p B can be computed using the function pairwiseCI() in R package pairwiseCI (Schaarschmidt and Gerhard Reference Schaarschmidt and Gerhard2019). The Newcombe confidence interval can also be computed using the prop.test() function in R’s stats package. For small samples, the exact.test() function in the Exact package mentioned in discussing Question 3 has an option to compute an estimated confidence interval for p A − p B. An alternative that seems to be computationally more efficient is the BinomCI() function in the ExactCIdiff package (Shan and Wang Reference Shan and Wang2022), which estimates an exact unconditional confidence interval due to Wang (Reference Wang2010). Neither of these R functions is included in the review by Fagerland et al. (Reference Fagerland, Lydersen and Laake2015).
Example: An example using the A. platanoides data is presented in section 1.2 of Supplementary Appendix S1. The R program used in this example and its output are provided in section 1.2 of Supplementary Appendix S2.
Management Experiments Using Point Intercept Surveys
The second type of adaptive management study we consider is field experiments using point intercept surveys conducted before and after application of one or more management treatments. We assume that the surveys employ a grid of survey points distributed evenly over the study area, as described earlier in the overview of point intercept surveys and that the same survey points are used before and after treatment.
A proper statistical analysis of data from pre- and posttreatment point intercept surveys must account for two important properties of the data. First, because the same sampling points are used for both surveys, the pre and post data from any given survey point cannot be assumed to be independent, even if the survey points differ slightly due to navigation errors. The sources of this property vary, depending on the particular habitat and invasive species involved, but include the possibilities that the same plants are being sampled, the plants are distinct but genetically identical or correlated, and growth conditions that vary meaningfully throughout the study area are the same or highly correlated due to spatial autocorrelation of local habitat variables that affect plant growth rates. This property implies that pre and post data from each sampling point must be treated as matched pairs.
The second important property is that because local physicochemical habitat properties, plant abundance, and plant genetics typically exhibit spatial autocorrelation at sufficiently small distances between sampling locations, presence–absence or local abundance data from neighboring survey points in point intercept surveys also are likely to exhibit spatial autocorrelation unless adequately spaced. We discuss the problem of spatial autocorrelation further in a later section, where we offer some commonsense suggestions for dealing with it. Meanwhile, we will proceed to discuss several practical nonparametric statistical methods for assessing treatment outcomes on the assumption that survey points are spaced widely enough to prevent any meaningful spatial autocorrelation.
Assessing the Efficacy of a Single Management Treatment on a Single Species
We begin by addressing the case in which the management target is a single invasive plant species and the efficacy of a single management treatment and level is being assessed. The “species” might actually be a particular genotype or hybrid. The statistical methods that are appropriate for this case depend on whether the data are binary or quantitative. We consider binary data first.
Statistical methods for binary data assume that each survey point (or small sampling area surrounding the point) can be unambiguously assigned to one of two mutually exclusive management states, which we will call desirable and undesirable. Usually, the desirable and undesirable states are absence and presence, respectively, of live plants of the target species. The statistical methods we review involve one or both of two parameters, P 1 and P 1′, that represent the probabilities that a randomly chosen survey point will be in the desirable state before the management treatment is applied (P 1) or at an appropriate time afterward (P 1′). For brevity, we will call these parameters the pretreatment probability of the desirable state (PDS) and posttreatment PDS. For most purposes, P 1 and P 1′ can be thought of as the proportions of a large treated area that will be in the desirable state before and after treatment.
We present the statistical methods for binary data in the context of four research questions dealing with the PDS for a single group of plants before and after treatment. Each research question is treated in the same manner as those for studies using marked plants.
Question 5: What Is the PDS and Its 95% Confidence Interval before or after Treatment?
The goal in this case is to simply estimate the probability that a randomly chosen survey point will be in the desirable management state at a particular time, which could be either before or after treatment, and to estimate an appropriate confidence interval. This question can be answered using the same method that was used to answer Question 1, with survey points taking the place of individual marked plants. In the present case, n is the total number of survey points and N 1 is the number of these points in the desirable state.
Question 6: Does the Posttreatment PDS Exceed Prescribed Management Threshold P1⋆?
The goal here is to determine whether there is strong evidence that a management objective of the form P 1′ > P 1⋆ was achieved for a particular invasive species and treatment. It can be answered in the same way as Question 2, with survey points taking the place of individual plants and with P 1⋆ (instead of p ⋆) as the management threshold. The states of survey points before treatment are not utilized in the statistical analysis; the question is simply whether the posttreatment condition of the restoration area satisfies the prescribed management objective.
Question 7: What Is PDS Change P1′ − P1 and Its 95% Confidence Interval for Post- and Pretreatment PDS Parameters P1′ and P1?
The goal here is to estimate the change in PDS following treatment, as well as its 95% confidence interval. Unlike the previous two questions, the statistical analysis now utilizes information from both pre- and posttreatment surveys.
Statistical method: Here we are interested in obtaining an estimate of the difference P 1′ − P 1 and its 95% confidence interval. For reasons explained in section 2.1.1 of Supplementary Appendix S1, an appropriate estimator for P 1′ − P 1 is (N 21 − N 12)/n, where random variable N 21 is the number of survey points that were in the undesirable state before treatment and the desirable state after, N 12 is the number of survey points that were in the desirable state before treatment and the undesirable state after, and n is the total number of survey points. The Agresti-Min estimator of the confidence interval for P 1′ − P 1 has particularly good statistical properties and is recommended. By contrast, the traditional Wald confidence interval has poor statistical properties and should not be used. Additional details are provided in section 2.1.1 of Supplementary Appendix S1.
Recommended references: Agresti (Reference Agresti2013, pp. 414–416); Agresti and Min (Reference Agresti and Min2005).
R functions: Function diffpropci.mp() in R package PropCIs (Scherer Reference Scherer2018) computes the Agresti-Min confidence interval. Function scoreci.mp in the same package computes a score confidence interval for P 1′ − P 1 due to Tango (Reference Tango1998).
Examples: An example using real data from an adaptive management study of invasive G. paniculata populations is presented in section 2.1.1 of Supplementary Appendix S1. An R program that analyzes a set of simulated data is presented in section 2.1.1. of Supplementary Appendix S2.
Question 8: Is PDS Change P1′ − P1 Positive, Meaning That the PDS Increased following Treatment?
The goal here is simply to determine whether there is strong evidence that the PDS increased following treatment. Question 7 deals with the issue of how large the increase (if any) was, which usually is more important to know.
Statistical method: For this question, we are interested in testing the null hypothesis that posttreatment PDS P 1′ is the same as pretreatment PDS P 1 (H0: P 1′ − P 1 = 0) against the one-sided alternative hypothesis that P 1′ is greater than P 1 (H1: P 1′ − P 1 > 0). If the number of survey points that switch states (1 → 2 or 2 → 1) following treatment is sufficiently large, a score test closely related to the McNemar test can be used for this purpose. It is important to note that the chi-square test recommended by Madsen (Reference Madsen1999), Parsons (Reference Parsons2001), and Hauxwell et al. (Reference Hauxwell, Knight, Wagner, Mikulyuk, Nault, Porzky and Chase2010) and used by Mikulyuk et al. (Reference Mikulyuk, Hauxwell, Rasmussen, Knight, Wagner, Nault and Ridgely2010) as the basis for a power analysis is not appropriate for comparing pre- and posttreatment point intercept data when the same sampling grid is used for both surveys, because the pre and post observations for each survey point are paired and therefore cannot be assumed to be statistically independent. The McNemar test and the closely related score test are designed specifically for this case and have been used by, for example, Wersal et al. (Reference Wersal, Madsen, McMillan and Gerard2006, Reference Wersal, Madsen, Woolf and Eckberg2010), Madsen et al. (Reference Madsen, Wersal, Tyler and Gerard2006, Reference Madsen, Stewart, Getsinger, Johnson and Wersal2008), and Rice et al. (Reference Rice, Leimbach-Maus, Partridge and McNair2020). Two alternative tests that can be performed with R and do not require the number of survey points that switch states to be large are the exact conditional test and the mid-P McNemar test. Additional details are provided in section 2.1.1 of Supplementary Appendix S2.
Recommended references: Agresti (Reference Agresti2013, pp. 416–417); Fagerland et al. (Reference Fagerland, Lydersen and Laake2013); Hollander et al. (Reference Hollander, Wolfe and Chicken2014, pp. 506–508).
R functions: The mcnemar.test() in the stats package performs the classical McNemar asymptotic test of the null hypothesis against the two-sided alternative. Rather than dealing with the problem of how to utilize this function to produce a P-value for the appropriate one-sided alternative hypothesis, we recommend performing the test more transparently by using R function pnorm(), as explained in section 2.1.1 of Supplementary Appendix S1. The exact conditional test is easy to perform using R function pbinom(); Hollander et al. (Reference Hollander, Wolfe and Chicken2014, p. 507) give an example. The P-value for the mid-P McNemar test also can easily be computed using pbinom(). Additional details are provided in section 2.1.1 of Supplementary Appendix S1.
Examples: An example using G. paniculata data is presented in section 2.1.1 of Supplementary Appendix S1. An R program that analyzes a set of simulated data is presented in section 2.1.1 of Supplementary Appendix S2.
Additional remarks: From a management perspective, it is important to know whether P 1′ − P 1 > 0, because it provides evidence as to whether the frequency of the invasive plant decreased. It turns out, however, that having strong evidence that P 1′ − P 1 > 0 for a site that received a test treatment does not necessarily mean that the treatment caused the increase in PDS, even if there is no evidence of an increase in PDS in the reference area. Some additional statistical analysis is required if one wishes to attribute an increase in PDS to the test treatment. This issue and the additional statistical tests required to address it are discussed in section 2.1.1 of Supplementary Appendix S1.
We now consider statistical methods for quantitative data. These methods assume that a quantitative measure of the target invasive plant’s local abundance or density (abundance per unit area) has been acquired from the immediate vicinity of each survey point, both before treatment and at an appropriate time afterward. The measurements must be made in a such a way that the measurement process does not measurably change (reduce) the abundance or density at survey points, as the same points are used in both surveys. A simple measure of local abundance that is often suitable in studies of terrestrial plants is the number of live plants or stems of the target species within a disk of fixed radius around each survey point; a simple measure of local density is the local abundance divided by the area of the sampling disk. Sampling within defined disks or quadrats is often infeasible in lake studies, but suitable measures of local abundance can still be obtained (e.g., using rake tosses from a boat in studies of invasive Eurasian watermilfoil [Myriophyllum spicatum L.]). For convenience, we focus on local density here, but the same statistical methods are appropriate for local abundance.
We motivate the statistical methods we review by presenting them in the context of four research questions dealing with the mean local density of a group of plants before and after treatment. In practice, the groups usually will be plants in the restoration and reference areas, or plants in separate restoration areas receiving different test treatments. Thus, the groups will be located in spatially distinct areas, with point intercept surveys being conducted in each area before and after treatment application. We denote the mean local pre- and posttreatment densities of plants in group i by μi and μi′, respectively.
Several standard nonparametric statistical methods are potentially useful for characterizing mean local density or assessing potential changes following treatment. These include the Wilcoxon sign-rank test (for one-sample data), Wilcoxon rank-sum test (for two-sample data), permutation t-test, bootstrap t-test, and additional bootstrap methods that are available specifically for estimating confidence intervals for the mean and quantiles. While all of these methods are nonparametric, the assumptions underlying the rank-sum test are slightly more restrictive than those underlying the main permutation and bootstrap tests; most importantly, the rank-sum test assumes that either the distribution functions F(x) and G(x) for the two statistical populations are identical for all x (the null hypothesis) or the distribution function F(x) for one of the populations dominates the distribution function G(x) for the other in the sense that F(x) ≥ G(x) for all x and F(x) > G(x) for at least one x (the alternative hypothesis) (Lehmann Reference Lehmann1975, p. 66). Moreover, rank-based methods discard much of the information that quantitative data contain and are therefore expected to be less likely than permutation or bootstrap methods to detect small but real differences between the mean or median of a statistical population and a prescribed management threshold, or between the means or medians before and after treatment. Rank-based methods are often good choices in applications where sample sizes are very small, but point intercept surveys typically yield sample sizes that are large enough to allay concerns about the adequacy of permutation or bootstrap methods. For these reasons, and also because some of the newer R packages contain functions for performing permutation and bootstrap tests that are as easy to use as those for performing Wilcoxon tests, we will emphasize permutation and bootstrap methods in our presentation of nonparametric methods for quantitative data.
The theory and numerical methods underlying permutation and bootstrap tests and confidence intervals is not easily explained in a few paragraphs, so we refer the reader to the lucid presentations of both permutation and bootstrap methods by Efron and Tibshirani (Reference Efron and Tibshirani1993). The books by Davison and Hinkley (Reference Davison and Hinkley1997) and Chernick (Reference Chernick2008) are also useful. Both permutation and bootstrap methods rely on computer resampling of the original data instead of relying on assumed probability distributions. A key difference between them is that permutation methods employ sampling without replacement, while bootstrap methods employ sampling with replacement. In our opinion, permutation methods are somewhat simpler for nonexperts to use, mainly because there are so many alternative ways to implement bootstrap methods.
Question 9: What Are the Mean Local Densities μi and μi′ in Plant Group i before and after Treatment and Their 95% Confidence Intervals?
The goal here is simply to characterize the mean local density of an invasive plant species in a restoration or reference area before and after treatment, focusing on one combination of plant species, treatment type, and treatment level at a time.
R functions: The function meanCI() in R package MKinfer (Kohl Reference Kohl2023) is a flexible and convenient function for constructing bootstrap confidence intervals for the mean density (or abundance) of an invasive plant. Its bootci.type argument provides options for computing several different types of bootstrap confidence intervals, which are explained by Efron and Tibshirani (Reference Efron and Tibshirani1993, chap. 14). To use this function, we suggest setting argument boot=TRUE and accepting the default choice for the others. This will produce an estimate of the mean density and five different types of bootstrap confidence intervals (viewing all of these is interesting and may stimulate you to read chapter 14 of Efron and Tibshirani [Reference Efron and Tibshirani1993]), of which we suggest using the BCa (bias-corrected and accelerated) interval.
Examples: An example using G. paniculata data is presented in section 2.1.2 of Supplementary Appendix S1; an R program that analyzes a set of simulated data is presented in section 2.1.2 of Supplementary Appendix S2.
Question 10: Is the Mean Local Density μi′ in Group i after Treatment Less Than Prescribed Management Threshold μ⋆?
The goal in this case is to test the null hypothesis that posttreatment mean local density μi′ is the same as management threshold μ⋆ (H0: μi′ − μ⋆ = 0) against the one-sided alternative hypothesis that μi′ is less than μ⋆ (H1: μi′ − μ⋆ < 0), where μ⋆ is an appropriately low prescribed density of the target invasive plant. Rejection of the null hypothesis at a confidence level of, say, 0.95 provides strong evidence that the management goal was achieved.
R functions: Useful R packages for bootstrap methods include boot (Canty and Ripley Reference Canty and Ripley2021; originally created for the book by Davison and Hinkley [Reference Davison and Hinkley1997]), bootstrap (Tibshirani and Leisch Reference Tibshirani and Leisch2019; originally created for the book by Efron and Tibshirani [Reference Efron and Tibshirani1993]), and the more-recent MKinfer package, which also includes functions for permutation tests. We find the bootstrap and permutation functions in the MKinfer package particularly well designed and easy to use. The boot and bootstrap packages provide greater flexibility for bootstrap methods but, in our opinion, require more expertise to use properly. For this reason, we will restrict attention to the bootstrap and permutation test functions in the MKinfer package in this review.
The boot.t.test() function in the MKinfer package performs bootstrap t-tests comparing the mean of one sample with a benchmark mean or comparing the means of two independent samples and also returns appropriate confidence intervals. The perm.t.test() function in the same package provides similar functionality for permutation t-tests. Both functions have a convenient interface that is nearly identical to that of the standard t.test() function in R’s stats package.
The input data from point intercept surveys are the local densities (as a data vector) recorded for the various survey points in a given survey. For Question 10, there will be a single data vector, and the mean posttreatment plant density μi′ is to be compared with known threshold density μ⋆. The null hypothesis is H0: μi′ − μ⋆ = 0, and we are interested in the one-sided alternative H1: μi′ − μ⋆ < 0.
Examples: An example using G. paniculata data is presented in section 2.1.2 of Supplementary Appendix S1; an R program that analyzes a set of simulated data is presented in section 2.1.2 of Supplementary Appendix S2.
Question 11: Is the Change μi′ − μi in Mean Local Density in Plant Group i Negative, Meaning That the Mean Local Density Decreased following Treatment?
The goal in this case is simply to determine whether there is strong evidence that the mean local density decreased following treatment. The null hypothesis is that posttreatment mean local density μi′ is the same as pretreatment mean local density μi (H0: μi′ − μi = 0), and the appropriate alternative hypothesis is that μi′ is less than μi (H1: μi′ − μi < 0). In testing the null hypothesis, it is necessary to account for the fact that the point intercept data consist of matched pairs, because they were collected at the same survey points.
R functions: Functions perm.t.test() and boot.t.test() from R package MKinfer can be used here. There are now two sets of local density data: pre- and posttreatment, each as a data vector. Both functions have a paired argument, which should be assigned the value TRUE. Both functions also have an alternative argument, which should be assigned the value ”less” if the first of the two data arguments is the one whose density is asserted to be less in the alternative hypothesis. For Question 11, we are interested in the reported P-values.
Examples: An example using G. paniculata data is presented in section 2.1.2 of Supplementary Appendix S1; an R program that analyzes a set of simulated data is presented in section 2.1.2 of Supplementary Appendix S2.
Question 12: What Is the Change μi′ − μi in Mean Local Density in Plant Group i following Treatment and Its 95% Confidence Interval?
The goal in this case is to estimate the change in mean density before and after treatment and to estimate the 95% confidence interval for the difference. The change will be negative if mean density decreased.
R functions: Functions perm.t.test() and boot.t.test() from R package MKinfer can be used here. These functions produce P-values as well as confidence intervals, so a single R program can conveniently be written to generate both types of result. We are now interested in the confidence intervals. We note that both functions can produce two different types of confidence interval: one-sided and two-sided. These are obtained by assigning values ”less” and ”two.sided” to function argument alternative.
Examples: An example using G. paniculata data is presented in section 2.1.2 of Supplementary Appendix S1; an R program that analyzes a set of simulated data is presented in section 2.1.2 of Supplementary Appendix S2.
Comparing Treatment Efficacy in Pairs of Treatments or Species
The basic problem here is to compare the decreases in mean local density following treatment in two groups, say A and B. The groups can be two species (or hybrids or genotypes) within a restoration area that receive the same treatment, two restoration areas receiving different treatments (this is a weak experimental design but is sometimes necessary for practical reasons), or a restoration area and a reference area. The null hypothesis is always that the decreases in mean local density in the two groups are the same. The alternative hypothesis is either the two-sided alternative that the decreases in the two groups are not the same (e.g., when comparing two treatments when there is no sound reason to expect one particular treatment to be more effective than the other) or the one-sided alternative that the decrease in a specified group is greater than the decrease in the other (e.g., when comparing the decrease in a restoration area with that in a reference area).
Question 13: Is the Decrease μA − μA′ in Mean Local Density in Plant Group A following Treatment Greater (or Different or Less) Than the Decrease μB − μB′ in Plant Group B?
This question most commonly arises when comparing the decrease in mean local density in a restoration area with that in a reference area when both areas show statistically significant decreases. The main interest typically is in comparing the decrease (not simply change) in one group of plants with that in another, as test treatments are expected to cause mean local density to decrease, and greater decreases indicate greater efficacy. To avoid confusion, it is therefore best to pose the null and alternative hypotheses in terms of decreases μi − μi′ in the two groups (these estimates will be positive for groups that show decreases in mean local density) instead of changes μi′ − μi (which will be negative for groups that show decreases in mean local density). The potential confusion arises from ambiguity in the intended meaning of the term “greater” when applied to negative numbers. For example, is a change of −1.234 plants m−2 greater than a change of −0.234, bearing in mind that −1.234 < −0.234? The intended meaning becomes clear if we deal with decreases instead of changes; obviously a decrease of 1.234 is greater than a decrease of 0.234.
Statistical method: Unlike Questions 11 and 12, there are now two sets of matched-pair data: before and after treatment for group A and before and after treatment for group B. We may analyze such data by finding the density changes for matched pairs in group A and for matched pairs in group B separately, then performing a two-sample bootstrap or permutation t-test of the null hypothesis that the mean density changes in the two groups are equal, treating the two groups as independent. The null hypothesis is that the mean change in group A is the same as the mean change in group B. Depending on the specific application, the alternative hypothesis can be the two-sided “not equal” hypothesis (e.g., when comparing the efficacies of two different herbicides on a particular invasive plant species) or the one-sided “less than” or “greater than” hypothesis (e.g., when comparing the decrease in density in a restoration area with the decrease in a reference area).
R functions: Functions perm.t.test() and boot.t.test() from R package MKinfer can be used to answer Question 13. The two data vectors are the density decreases for matched pairs in group A and matched pairs in group B. The function argument paired should be set to FALSE (the default) and the argument alternative should be set to either ”two.sided”, ”less”, or ”greater”, as appropriate.
Examples: An example using G. paniculata data is presented in section 2.2 of Supplementary Appendix S1; an R program that analyzes a set of simulated data is presented in section 2.2 of Supplementary Appendix S2.
Management Experiments Using Plot-based Designs
Classical plot-based experimental designs are most appropriate for studies where the primary goal is simply to compare the efficacies of alternative management practices rather than to simultaneously restore as large an area as possible. Such studies are often conducted by governmental agencies or other organizations with secure multiyear funding as a means of identifying the best management practices to be employed in weed control or future restoration projects. A common experimental design in studies of this type is the randomized complete-block design (e.g., Herring and Pollack Reference Herring and Pollack1985; Simard Reference Simard1993), where blocking is used to partially separate effects of spatial variation from statistical error, each block is complete in the sense that it includes all treatments (test and null), and treatments are randomly assigned to plots within each block. This design is particularly useful when the response variable can be measured nondestructively (e.g., number of target plants or stems per plot), in which case measurements can be made both before and after treatments are applied. The resulting data consist of a matched pair for each plot, and statistical analysis can then be performed on the differences.
Classical plot-based experimental designs were originally developed by Fisher (Reference Fisher1935) in parallel with his development of the ANOVA. As we pointed out in the “Introduction,” this statistical methodology rests upon several strong assumptions regarding statistical properties of the data that, in our experience, often fail in field studies of invasive plants. In particular, one or both of the normality and variance-homogeneity assumptions are often found to be untenable when residuals are properly assessed. If all assumptions are found to be tenable (possibly after the data are transformed), results of designed experiments should be analyzed with ANOVA, supplemented with appropriate tests for pairwise differences. If the normality assumption is tenable but the variance-homogeneity assumption is not, then the (parametric) Games-Howell pairwise comparison test is a good option. But if normality fails, nonparametric statistical methods become necessary.
The most useful and reliable methods for assessing the assumptions of parametric statistical methods are diagnostic plots that permit visual assessment. Formal hypothesis tests that produce P-values can be useful supplements when visual assessment is ambiguous but should not be used by themselves or as the primary assessment tool because (among other reasons) they are sensitive to sample size (small and large) and provide no guidance for correcting problems via transformation. Useful accounts of how to assess the key assumptions regarding residuals and specific probability distributions are provided by, for example, Goodall (Reference Goodall, Hoaglin, Mosteller and Tukey1982) and Faraway (Reference Faraway2015, chap. 6). The presentation by Faraway (Reference Faraway2015) is particularly thorough and informative and also shows how to produce and interpret the most useful diagnostic plots using R functions.
When nonparametric methods are required for traditional plot-based study designs, group comparisons can be made using the permutation or bootstrap methods presented earlier. When more than one comparison is performed, the resulting P-values should be adjusted in order to maintain the nominal experiment-wise error rate. In most cases, the Holm adjustment should be used for this purpose, because it is conservative but less so than the original Bonferroni adjustment while remaining valid under equally general assumptions. Alternatively, permutation tests for designed experiments are available in R, including randomized complete-block designs and many others (e.g., using function aovp() in R package lmPerm by Wheeler and Torchiano [Reference Wheeler and Torchiano2016]), although we currently have no firsthand experience using any of these tests.
When assessing the assumptions of ANOVA or any other distribution-specific statistical method, it is common to find the assessment less than convincing. Bearing in mind that the data or residuals should be considered “guilty” of violating the distribution-specific assumptions unless convincingly shown to be “innocent,” the following practical advice by Ryan (Reference Ryan1997, p. 14) provides useful guidance: “With any statistical analysis (using regression or some other technique) it is a good idea to analyze the data first assuming that the assumptions are met and then analyze the data not assuming that the assumptions are met. If the results differ considerably, then the results of the second analysis will generally be the more reliable.” Of course, if the results closely agree, then one knows that it makes no meaningful difference which type of analysis is used and one can report the results of either.
The Problem of Spatial Autocorrelation
The two types of plot-less study design we have recommended—determining the fate of marked plants and conducting point intercept surveys—require that the state of numerous individual plants or survey points be assessed before and after management treatments are applied. By sampling the same marked plants or the same survey points, these designs partially control the effects of variation in age, size, and genetics of individual plants and of spatial variation in physicochemical properties of the study area on measures of treatment response, which otherwise might substantially inflate statistical error.
A by-product of these methods for controlling effects of individual and spatial variation is that they create two potential sources of statistical dependence between samples:
-
Response measurements made on the same plant or at the same survey point before and after treatment cannot be assumed to be statistically independent.
-
Response measurements made on plants or at survey points that are located close to one another often are positively correlated and hence not statistically independent.
These potential sources of dependence must be taken into account when choosing the locations of marked plants or the spacing between survey points, and when choosing appropriate statistical methods for analyzing the resulting data.
The first source of dependence can easily be handled by analyzing data consisting of binary or quantitative changes in the state of marked plants or survey points instead of data consisting of separate before and after states. Examples include statistical methods based on the PET or PDS for binary data or, for quantitative data, one-sample bootstrap or permutation t-tests where the single sample consists of the observed changes in local abundance or density at the same survey points before and after treatment. Alternatively, one can use statistical methods designed specifically for matched-pairs data, such as the McNemar test for binary data or two-sample bootstrap or permutation t-tests for quantitative data.
The second source of dependence—spatial autocorrelation—is more problematic. To the best of our knowledge, no versions of the statistical methods we have considered in this review have thus far been developed that can accommodate spatial autocorrelation among data from different plants or survey points or from neighboring experimental plots (however, if different point intercept survey points are used before and after treatments are applied, one can employ a modified chi-square test developed by Cerioli (Reference Cerioli1997, Reference Cerioli2002) that accounts for spatial autocorrelation). The usual approach to handling this problem, where feasible, is simply to reduce or eliminate it by employing sufficiently wide spacing of marked plants or survey points, because spatial autocorrelation decays with distance between plants or points. A similar problem and commonsense solution apply to plot-based experiments, where data from neighboring plots are likely to be correlated unless the spacing between them is sufficiently wide. The problem then shifts to determining what “sufficiently wide” means, which takes us into a gray area of spatial statistics.
Our recommendations for addressing the problem of spatial autocorrelation are to be aware of it, to space marked plants, survey points, or experimental plots as widely as feasible, to quantify spatial autocorrelation when possible, and to consider “thinning” marked plant or point intercept data by strategically deleting observations for a subset of plants or points to increase nearest-neighbor distances if spatial autocorrelation is statistically significant. Quantifying spatial autocorrelation requires that the locations of all data from individual plants or survey points be recorded (e.g., with a GPS receiver) and projected to an appropriate spatial coordinate system for which distances between locations are accurate. To deal defensibly with the uncertainty that spatial autocorrelation creates, it is important to be aware that the main impact of positive spatial autocorrelation (the type usually encountered) on statistical tests of the sort we have discussed is to erroneously decrease the reported P-values. Intuitively, strong positive spatial autocorrelation can be thought of as decreasing the effective sample size (because neighboring plants or points provide much of the same information), thereby increasing the true P-value for hypothesis tests.
Ignoring the effect of positive spatial autocorrelation results in an erroneously small P-value, meaning that the true P-value will be larger than the value reported by the statistical test one performs. It follows that if statistically significant positive spatial autocorrelation is present but weak, and if the reported P-value is much less than α (the significance level one is using), then the decision to reject the null hypothesis based on the reported P-value is defensible. If the reported P-value is greater than α, then regardless of the strength of positive spatial autocorrelation detected, the decision to accept the null hypothesis is defensible. But if statistically significant positive spatial autocorrelation is detected and the reported P-value is only slightly less than α, one should consider thinning the data to eliminate the smallest nearest-neighbor distances and then repeating the entire analysis.
Figure 2 shows an example from a study of invasive watermilfoil (Eurasian watermilfoil [Myriophyllum spicatum L.] and its hybrid with northern watermilfoil [Myriophyllum sibiricum Kom.]) in Houghton Lake, MI, by Parks et al. (Reference Parks, McNair, Hausler, Tyning and Thum2016). Point intercept surveys using the same survey points were conducted before and after spot application of two herbicides (2,4-D-amine and triclopyr) to watermilfoil patches comprising either or both of the above taxa. Local abundance at each survey point was estimated by averaging the yields of two rake-toss samples. The first source of dependence mentioned above was addressed by subtracting posttreatment abundance from pretreatment abundance at each survey point, yielding a single sample of observed changes in local abundance. A simplified version of the data is displayed in Figure 2, with increase, decrease, and no change at survey points indicated by gray triangles, black inverted triangles, and open circles, respectively. As the figure suggests, local abundance exhibited positive spatial autocorrelation, with points where local abundance decreased tending to occur in clusters, and similarly for points where local abundance increased or showed no change. This problem was resolved by removing alternate survey points from the data set, thereby increasing the distances between neighboring points. This remedy also decreased the number of survey points by roughly half, but the original survey size was large enough (996 points) for this consequence to be acceptable.
Map of changes in local abundance of invasive Myriophyllum spicatum and Myriophyllum sibiricum in Houghton Lake, MI, following spot application of herbicides 2,4-D-amine and triclopyr. Black inverted triangles, abundance decreased; gray triangles, abundance increased; open circles, no change. Based on data from a study by Parks et al. (Reference Parks, McNair, Hausler, Tyning and Thum2016).
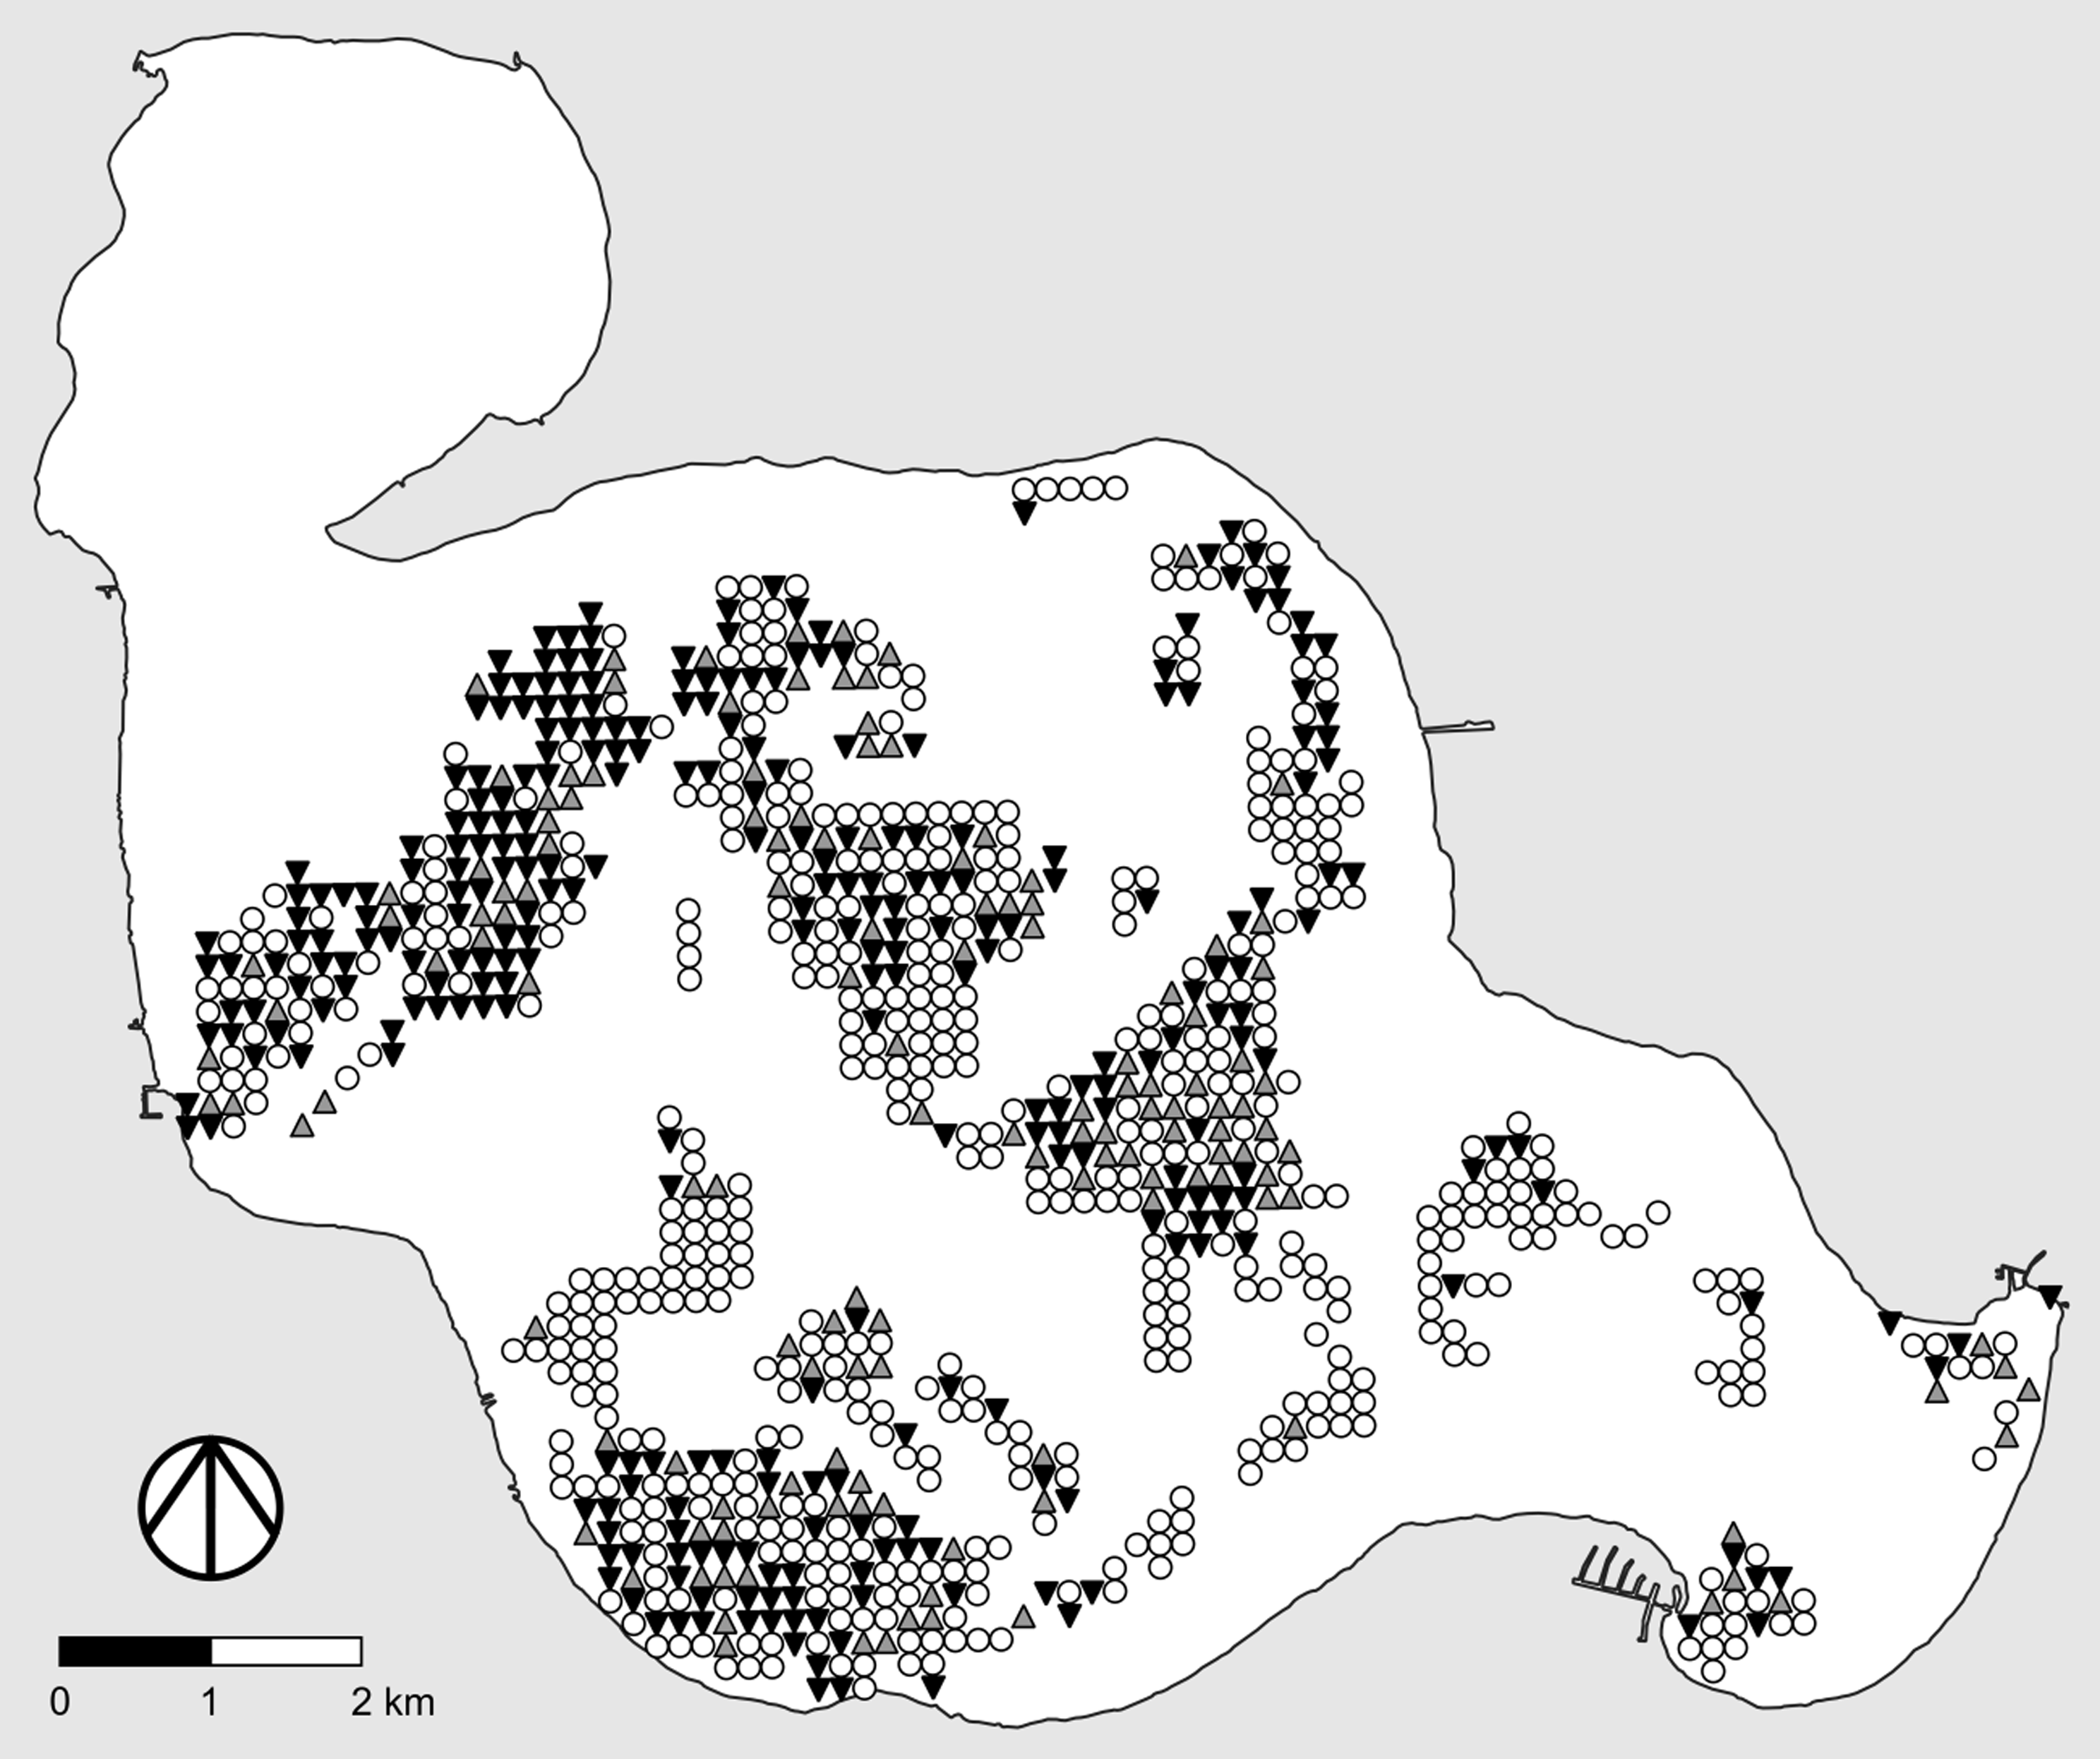
There are several useful textbooks and monographs on spatial statistics, but none of them address the types of statistical tests used to assess treatment efficacy in adaptive management studies of invasive plants. They do, however, address the issue of spatial autocorrelation, which is fundamental to all of spatial statistics. References we have found useful include Cliff and Ord (Reference Cliff and Ord1981), Ripley (Reference Ripley1981), Cressie (Reference Cressie1993), Bivand et al. (Reference Bivand, Pebesma and GomézRubio2013), and Plant (Reference Plant2019), with the last two specifically addressing the use of R for performing the various types of spatial analysis they cover. R packages we have found useful include ncf (Bjørnstad Reference Bjørnstad2022), sp (Pebesma and Bivand Reference Pebesma and Bivand2023), and spatial (Ripley Reference Ripley2022). ncf is mainly focused on spatial autocorrelation and provides an easy-to-use function correlog() for estimating spatial autocorrelation, assessing its statistical significance as a function of distance, and plotting the results. The other two packages provide much broader collections of tools for spatial statistics but, in our opinion, require greater expertise for effective use. spatial is included in the standard distribution of R.
Discussion
Three main themes run through our review of alternative study designs and nonparametric statistical methods. The first is the reality that alternative study designs are sometimes better choices than traditional plot-based designs. For example, plot-based designs often are infeasible in aquatic habitats and often inappropriate in studies designed to assess effects of management practices on individual plants. The second theme is that data produced by these alternative study designs often are best analyzed with nonparametric statistical methods, some of which may be necessary even when a traditional plot-based design is used if the assumptions of ANOVA or other distribution-specific parametric statistical methods turn out to be questionable or clearly untenable when properly assessed. The third major theme is that research questions that arise in adaptive management studies of invasive plants typically can be answered rigorously and efficiently using nonparametric statistical methods available in R.
It is not our intent to deny the value of traditional plot-based study designs coupled with ANOVA. To the contrary, this usually is the preferred approach when funding is available strictly for assessing the efficacies of alternative management practices, as is often the case for studies conducted by governmental agencies (e.g., the protocols for forest management developed by Herring and Pollack [Reference Herring and Pollack1985] and Simard [Reference Simard1993] for the Ministry of Forests, Province of British Columbia, Canada) or at agricultural experiment stations (e.g., the 14 years of agricultural experiments at Rothamsted Experimental Station in the United Kingdom that were the main basis for Fisher’s development of ANOVA and the specialized statistical discipline of DOE or design of experiments). However, in our experience with restoration projects involving invasive aquatic plants and “large” terrestrial plants like trees and shrubs that are distributed sparsely over large areas, plot-less study designs or statistical methods that make only weak distributional assumptions (or both) are often necessary or preferable. The main purpose of this review is to make researchers and practitioners aware of a few of the practical alternatives that are available for use in such situations.
The main nonparametric methods we have reviewed for estimating confidence intervals and testing statistical hypotheses are summarized in Table 1. All of the research questions discussed in this paper are included in the table, as are most of the statistical methods (we have omitted the large-sample methods to reduce the size of the table, but these are approximations to some of the tests that are included). While we obviously were not able to include all potentially useful research questions and nonparametric statistical methods in our review, those that we chose to discuss are ones we have found useful for assessing the short-term efficacy of management practices in our own studies. Assessing or predicting long-term efficacy is another matter altogether and would carry us into the realm of rapid evolution of herbicide resistance and related phenomena, which are of great importance in adaptive management of invasive plants but are beyond the scope of this review.
Summary of study designs, research questions, and statistical methods discussed in the various sections of this review a .

a Abbreviations: PET, probability of effective treatment; PDS, probability of the desired state; CI, confidence interval; PI, point intercept; MLD, mean local density; B, binary data; Q, quantitative data; prime (′), distinguishes a posttreatment value from the corresponding pretreatment value; other notation is defined in sections of this paper dealing with the corresponding research questions.
In our opinion, the most important unresolved problem with statistical analysis of data from adaptive management studies of invasive plants is that nearly all the methods for estimating confidence intervals and testing statistical hypotheses require that observations from different plants or survey points at any given sampling time be independent. Cerioli’s (Reference Cerioli1997, Reference Cerioli2002) modifications of the chi-square test to account for spatial autocorrelation suggest a fruitful approach to resolving this problem, although these particular tests are not appropriate for matched-pairs data and therefore require one to forgo the statistical advantages of such data. Another promising approach to this problem is to develop bootstrap tests for spatially autocorrelated data, using ideas similar to those used in bootstrap analyses of time series (e.g., Davison and Hinkley Reference Davison and Hinkley1997). To the best of knowledge, however, no tests of this type for spatial data are currently available in R.
Supplementary material
For Supplementary Material accompanying this paper visit https://doi.org/10.1017/inp.2024.17
Acknowledgments
We thank two anonymous reviewers for their thorough and perceptive comments that pushed us to significantly improve this paper.
Funding statement
Our experience with the study designs and statistical methods presented here was gained from studies of invasive terrestrial and aquatic plants conducted over the past 20 years. Funding sources for these studies include the William Penn Foundation (Philadelphia), Michigan’s Invasive Species Grant Program, and USEPA’s Great Lakes Restoration Initiative. Partial funding for preparing this paper was provided by the U.S. Fish and Wildlife Service through Great Lakes Restoration Initiative Interjurisdictional Funding grant no. F22AC00106-01.
Competing interests
The authors declare no conflicts of interest.


 Open access