


Introduction
In the past decades, substantial literature on the link between the public's policy preferences and actual policy has emerged. One result of this research has been that policy representation is unequal. That is, policy outcomes align more with the preferences of affluent voters than with the preferences of middle‐ and low‐income citizens (cf. Bartels, Reference Bartels2016; Elkjær & Iversen, Reference Elkjær and Iversen2020; Elsässer & Schäfer, Reference Elsässer and Schäfer2023; Gilens, Reference Gilens2012; Persson & Sundell, Reference Persson and Sundell2024).Footnote 1
To fully understand unequal representation, we must know its underlying mechanisms. However, these mechanisms are still poorly understood, despite a growing number of studies addressing them (Burgoon et al., Reference Burgoon, Lupu, Pontusson and Schakel2022). Existing studies tend to address single mechanisms (e.g., Mathisen et al., Reference Mathisen, Schakel, Hense, Elsässer, Persson, Pontusson, Lupu and Pontusson2023), single countries (e.g., Rigby & Wright, Reference Rigby and Wright2013) or both, with the exceptions relying on more distant proxies of substantive representation than policies (Lupu & Warner, Reference Lupu and Warner2022b; Rosset & Kurella, Reference Rosset and Kurella2021). As a result, broader insights into the causes of political inequality are lacking.
This study contributes to our understanding of affluence and influence by analysing the relationship between electoral behaviour, government formation and unequal representation. Elections are generally considered the key channel by which the people can translate their preferences into policy (Powell, Reference Powell2004; Stimson et al., Reference Stimson, Mackuen and Erikson1995). Moreover, electoral behaviour and associated factors such as turnout, issue voting or political knowledge are often posited to be important causes of unequal representation by scholars (e.g., Erikson, Reference Erikson2015; Elkjær, Reference Elkjær2020; Rosset & Kurella, Reference Rosset and Kurella2021).
Our analysis is based on a unique and wide‐ranging combination of data sources. More specifically, we use data on voters' policy preferences, turnout and voting behaviour; data on election results and cabinet formation; and data on implementation of the same policy issues that respondents were surveyed about. In total, these sources cover nearly 300,000 respondents in 32 European countries during 197 election periods. Studies in the field generally link aggregate levels of support with policy implementation. By using individual‐level data, we are able to explore variation in electoral behaviour and opinion–policy congruence between individuals. We are thus equipped to better handle potential problems related to ecological inference and use the full variation in the data as opposed to relying on strong assumptions of constant parameters within income groups.
We first corroborate and extend the findings of previous research. Compared to citizens with lower incomes, those with high incomes have higher turnout rates, are ideologically closer to parties and more often vote for parties that match their ideological positions. They are also more likely to see their preferred parties in power. All of these factors – turnout, ideological closeness, having preferred parties in power – are associated with better opinion–policy congruence. However, these patterns still do not explain income inequality in representation. Our results thus suggest that the electoral stage is less important in producing biased representation than commonly assumed. This has important implications for our understanding of this bias and, indeed, for policy responsiveness more generally.
Theory
A useful starting point for our analysis is the chain of responsiveness described by Powell (Reference Powell2004), expressing a straightforward Downsian view of the policy process. This chain links (a) voters' policy preferences to (b) their voting behaviour, which is then linked to (c) the outcomes of elections and subsequent selection of governments and finally to (d) policy implementation. Applying this to the topic at hand, we can make a rough division between those who emphasize the electoral stage (links a–c) versus those who focus on the post‐electoral stage (links c–d) in explaining unequal representation.
The former strand of the literature suggests causal mechanisms that occur early in the causal chain, that is, how voting and elections contribute to unequal representation. These include inequalities in voter turnout (Bartels, Reference Bartels2016), issue voting (Rosset & Kurella, Reference Rosset and Kurella2021), political knowledge (Erikson, Reference Erikson2015; Elkjær, Reference Elkjær2020) and party supply (Rigby & Wright, Reference Rigby and Wright2013; Schakel & Burgoon, Reference Schakel and Burgoon2022). These mechanisms imply that elections, voting and subsequently which party obtains power, have a large influence on unequal representation.
In contrast, others have pointed towards the final step in the chain, from governments to policy implementation. A prominent example of this strand is the work of Hacker and Pierson (Reference Hacker and Pierson2010), who caution against viewing politics as ‘electoral spectacle’ and instead emphasize the importance of organized interest mobilization in between elections. Other proposed mechanisms behind unequal representation that are consistent with the post‐electoral stage are biased descriptive representation (Carnes & Lupu, Reference Carnes and Lupu2023; Persson, Reference Persson2021; Rosset & Stecker, Reference Rosset and Stecker2019), elites' misperception of public preferences (Pereira, Reference Pereira2021) and money in politics (Gilens, Reference Gilens2012). Here, the implication is that who votes and who is elected are less consequential, as the rich will be over‐represented regardless.
We address four interrelated questions, particularly related to the electoral stage: (1) Are high‐income individuals better represented in terms of opinion–policy congruence?; (2) Do they vote to a larger degree, and are they more likely to vote for parties ideologically closer to them than middle‐ and lower‐income groups?; (3) Do high‐income individuals see their preferred, or ideologically closest, party more often in cabinets?; (4) And if so, does this explain inequality in opinion–policy congruence?
Based on previous research, we expect to find affirmative answers to all these questions. Beginning with voter turnout, various studies have found that high‐income citizens are more likely to vote than middle‐, and particularly low‐income citizens (Gallego, Reference Gallego2015; Ojeda, Reference Ojeda2018). There is also some evidence suggesting that those who vote are better represented in substantive terms than non‐voters (Dassonneville et al., Reference Dassonneville, Feitosa, Hooghe and Oser2020; Griffin & Newman, Reference Griffin and Newman2005).
In addition, unequal representation could result from differences in what can be called proximity voting (Joesten & Stone, Reference Joesten and Stone2014). This refers to the closeness between one's own policy preferences or ideology and the policy preferences or ideology of the party one votes for. Some studies have found that income is associated with increased proximity voting, possibly due to differences in education and political knowledge between income groups (Lesschaeve, Reference Lesschaeve2017; Rosset & Kurella, Reference Rosset and Kurella2021).
If the affluent are indeed more likely to vote, and do so in a way that aligns with their policy views, the process of electoral replacement will function better for them. It follows from this that ceteris paribus, their preferred or ideologically closest party should also have a higher chance of being a part of the ruling government. Finally, we expect that voters' policy representation will be improved if their preferred parties are in power. We base this on studies which show that parties generally implement their manifestos, once in power (Thomson et al., Reference Thomson, Royed, Naurin, Artés, Costello, Ennser‐Jedenastik, Ferguson, Kostadinova, Moury, Pétry and Praprotnik2017).
At the same time, there is no consensus on the extent to which the above‐mentioned factors matter. For instance, the evidence for unequal turnout as an explanation for unequal representation is rather mixed in single‐country studies (Bartels, Reference Bartels2016; Persson & Sundell, Reference Persson and Sundell2024; Schakel, Reference Schakel2021). Furthermore, recent research has shown that high‐ and low‐income voters rely on similar criteria when making voting decisions, with only minor differences in how they weigh policy proximity and leader evaluations in their vote choices (Kurella et al., Reference Kurella, Giger and Rosset2024). More broadly, then, we still know little about how the electoral connection translates into policy representation across income groups.
We contribute to this question by testing an explanation that is largely mechanical: high‐income individuals are better represented in policy because they are more likely to be better represented electorally. In the empirical analysis, we will put this hypothesis to the test and see whether electoral behaviour and government formation can account for inequality in policy representation.
Data and methods
We use data on opinions and policies collected by Persson and Sundell (Reference Persson and Sundell2024). This includes survey data from the Eurobarometer, European Social Survey, Comparative Study of Electoral Systems and European Values Study (from 1978 to 2015) on attitudes towards various policy proposals (see Online Appendix Table B.2 for the full list of survey questions). For each country‐year proposal, these data have been combined with hand‐coded information on whether these policies were implemented in the following years. A complete list of the countries and election years included in the analysis is presented in Online Appendix Table B.1.
In our analysis, we focus on opinion–policy congruence – that is, the descriptive match between the support for policy change and actual change – as an important facet of policy representation.Footnote 2 In contrast to the aggregate analysis of Persson and Sundell (Reference Persson and Sundell2024), and to the dominant approach in the field, we conduct the analysis at the individual level. Conducting the analysis at this level allows us to avoid issues of ecological inference and to see whether more active political participation among high‐income earners is associated with higher congruence at the individual level.
There are roughly two million individuals in the original dataset, and we calculate the average congruence between each individual's opinions and policies, for the issues on which the individual was surveyed. Congruence is coded as 1 when an individual supports a proposal, and it is implemented during the incumbent government term, or when the individual opposes it, and it is not implemented. Likewise, it is coded as 0 if an individual supports a proposal and it is not implemented, or if an individual does not support a proposal and it is implemented. If the respondent has answered that they neither support nor oppose the proposal, congruence is coded as 0.5.Footnote 3
Some of the surveys, totalling 290,000 respondents, include questions about party preference and ideological (left‐right) self‐placement. We harmonize codes for party preferences for this subset of surveys and merge it with the ParlGov database (Döring & Manow, Reference Döring and Manow2012),Footnote 4 which contains information about election outcomes and cabinet composition. We further complement the dataset with the Chapel Hill Expert Survey (Jolly et al., Reference Jolly, Bakker, Hooghe, Marks, Polk, Rovny, Steenbergen and Vachudova2022) placement of each party on the left‐right dimension, for the closest available year. When the Chapel Hill data are not available, we use ParlGov's placement of the party, which has been static over the years.
We then construct a dataset of close to 3 million voter–party dyads, where each prospective voter is matched with the parties that ran in the preceding election. The combined data allow us to see whether the individual's preferred party was included in the cabinet during the current government term and also whether the respondent's closest party was. Finally, these data also allow us to determine whether the respondents indicated that they would vote for the party that is the closest to them ideologically.
It is common to use the left‐right dimension when measuring unequal congruence between voters and elites (e.g., Giger et al., Reference Giger, Rosset and Bernauer2012), with some studies showing that the left‐right scale produces similar inequalities compared to more specific issues (Lupu & Warner, Reference Lupu and Warner2022a).Footnote 5 However, it should be noted that there are both downsides and upsides to using the left‐right scale as a measure of proximity voting. One advantage is that while it is less concrete than actual policy, the left‐right dimension is the most widely understood (Noël et al., Reference Noël, Thérien and Boucher2021) and the most salient ideological dimension in most representative democracies (Huber & Inglehart, Reference Huber and Inglehart1995). Policy questions regarding specific policies may be too specific for many respondents, who may not have informed views on these issues.
One potential downside, however, is that income groups may have different understandings of the left‐right dimension, which could affect comparisons between the two groups. We address this challenge in the Online Appendix by examining a subset of the data where voters themselves placed parties on the left‐right dimension. Our analysis shows that while low‐income respondents agree less with experts on where to place parties, the distance between where voters place themselves and their preferred parties is greater for low‐income respondents. This pattern is the same when using expert placement of parties as we will see later in the Results section. Lastly, we also examine only the individuals who agree with experts (both high‐ and low‐income respondents) in an Online Appendix analysis and still find the same patterns as we do in the main models. Overall then, these supplementary analyses on a subset of the data indicate that our findings concerning income differences are the same even when individuals have similar understandings of the left‐right dimension, and when they classify the parties themselves.
Despite the limitations of the left‐right scale, Figure 1 shows that there is a strong connection between the ideological positions of voters and their party choice. For each respondent, we rank the available parties according to the distance between the respondent's self‐placement and the expert positioning of the party and compare with party preference. Respondents preferred the party with the smallest ideological distance 29.7 percent of the time, the party with the second smallest distance 21.6 percent of the time and the third closest party 15.3 percent of the time. Ideological proximity as measured on the scale seems to be an important factor in vote choice, or at least a proxy for other relevant factors. However, we are not able to rule out reverse causality of the form where respondents adapt their ideological position to their party choice, which should be kept in mind when interpreting the results.
Voters tend to vote for parties that are closest to them on the ideological left‐right spectrum (1 = The party with the least distance between the voter and the party's ideological placement).

Results
The results section contains three types of analysis. First, we investigate whether policy better matches the preferences of high‐income voters than low‐income voters. We do this in order to corroborate findings from previous research, using our new individual‐level data approach. Second, we examine the relationship between income and potential mediators: various measures of electoral behaviour and government formation. Finally, we combine the previous two steps in an analysis to see whether the association between income and opinion–policy congruence can be explained by the mediators. For the first two parts, we rely on graphical presentations of average values over income deciles in the main text. Corresponding Ordinary Least Squares (OLS) regression models including country and year fixed effects can be found in the Online Appendix. The final analysis is presented as a regression analysis in the main text.
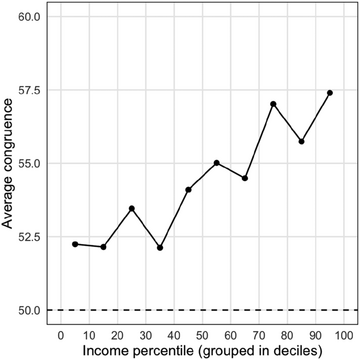
Figure 2 shows average congruence for respondents grouped by income decile, based on calculations of the entire sample, across all issues, countries, and years. A value of 50 means that respondents on average saw their preferred policy realized in 50 percent of the cases. All groups are above the 50 percent line, but there is also a clear pattern: the higher the income, the better the congruence. The top income decile has an average congruence of 57.5 percent, while the bottom group only has 52.2 percent. These differences may seem small, but they are statistically significant (see Online Appendix Table A.1), and they are in line with the findings of previous research (Mathisen et al., Reference Mathisen, Schakel, Hense, Elsässer, Persson, Pontusson, Lupu and Pontusson2023). We also believe these gaps are sizable enough to matter in practical terms. In particular, given that policy changes might accumulate over time, even limited changes in congruence can add up to substantial policy differences in the long run.
Opinion‐policy congruence is stronger for individuals with higher incomes.

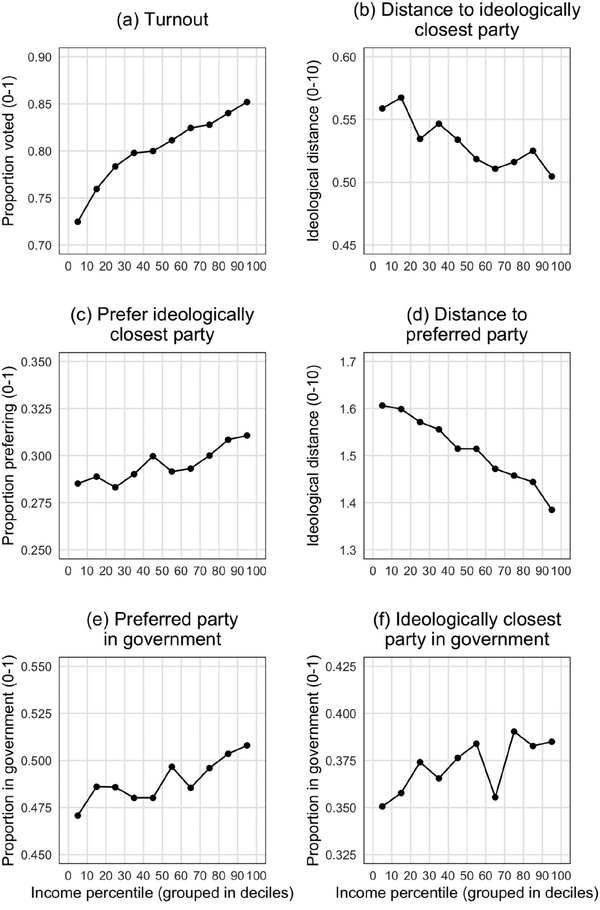
We now turn to the electoral behaviour of voters in different income groups. Figure 3, panel a, first shows that voters with higher income tend to vote more: in the highest income group, self‐reported turnout in the last election was 85.3 percent, compared to 72.5 in the lowest income group. As expected, respondents with higher incomes are thus making their voices heard to a greater extent.Footnote 6
Respondents with higher incomes are more likely to vote (a), have a smaller ideological distance to the closest party (b), vote for the closest party (c), have a smaller distance to the party they vote for (d), have their preferred party in government (e) and have their closest party in government (f).

To determine whether they are also more likely to vote for parties that match their ideological stance, we compare the self‐reported left‐right position of each respondent with the expert‐assessed left‐right position of the country's parties at the time. Panel b reveals that voters with higher incomes have smaller distances to the closest party, meaning that they have better party options to choose from than low‐income voters.Footnote 7 And in Figure 3, panel c, we see that respondents in the higher income groups are indeed more likely to vote for the nearest party.Footnote 8 Together, these two patterns result in higher income voters being considerably closer to the parties they prefer (panel d).
The bottom two panels in Figure 3 show the percentage of respondents who saw their preferred party (panel e) and their ideologically closest party (panel f) included in the cabinet. Voters with higher incomes are more likely to see both kinds of parties in government. In the highest income group, 50.8 percent of the voters have their preferred party in government, compared to 47.1 percent in the lowest income group. Similarly, in the highest income group 38.5 of the ideologically closest parties were included in government, compared to 35.1 percent in the lowest.Footnote 9
This brings us to our most important question: Can the fact that higher income voters vote more, vote for parties that are closer to them, and see their preferred parties in government more often explain the fact that they have a higher opinion–policy congruence?
The question is answered by Table 1 where we regress congruence on respondent income while accounting for potentially mediating factors. If inclusion of these factors weakens the coefficient on the income variable, the interpretation is that the income effect is mediated through them. We account for whether the respondent's preferred (model 2) or closest party (model 3) is in the cabinet, the ideological distance to these parties (model 4 and model 5) and whether the respondent voted for the closest party (model 6) or voted at all (model 9). As expected, all these variables have statistically significant effects on congruence. For instance, having one's preferred party in government increases congruence by 0.87 percentage points (model 2), while moving from the lowest to the highest income percentile (i.e., from 0 to 100) adds 6 percentage points.
Regression analysis. Dependent variable: Congruence (0–100)

Note: **, *, denote statistical significance at the 1 percent and 5 percent level. Unit of analysis is individual, dependent variable is average congruence for each individual. The scale for the income variable is 0‐100. Model 8 is included as a comparison for model 9, as the sample size differs in this analysis.
Importantly, none of the potential mediating variables meaningfully alter the income effect, which remains stable across models. That is also the case in model 7 where we include all four variables from models 2 to 5 simultaneously. This suggests that income is a robust predictor of congruence, independently of one's voting behaviour or proximity to parties on the ideological spectrum.Footnote 10 In Online Appendix Table A.5, we also provide formal mediation analyses. The findings corroborate the results from Table 1: the explored variables do not substantially mediate the effect of income on congruence.
This might seem hard to reconcile with the results in the table: if there is a significant association between income and, for instance, having the preferred party in government, and there is a significant association between having the preferred party in government and congruence (0.870, model 2), why does inclusion of the mediating variable not reduce the income coefficient? The answer is that the effect of income on the mediating variables is very small. Recall from panel e in Figure 3 that about 47 percent of respondents in the bottom decile saw their preferred party in government, compared to just over 50 percent for individuals in the top decile. Moving from bottom income to top income thus increases the probability by about 3 percentage points and moving up a single percentile increases the probability with 0.03 percentage points. If we multiply this with the coefficient for the preferred party in government, we get  . This is roughly what the income coefficient is reduced by between model 1 and model 2, but it is invisible due to rounding.
Conclusion
In this study, we combined individual‐level data on opinions, policy implementation, party preferences and government cabinets to investigate whether unequal policy representation can be explained by electoral mechanisms. We find that high‐income voters vote more often are more likely to choose parties that match their ideological position and are more likely to have preferred and ideologically close parties in government. Having preferred and ideologically close parties in government is also associated with higher congruence, but these facts still can not explain the better congruence of the affluent. The reason is that the associations between income and mediating variables are too weak.
This slightly counter‐intuitive result demonstrates the need for an integrated approach in the search for mechanisms. Taken separately, all signs in Figure 3 point to electoral behaviour being an important explanation for the over‐representation of the affluent, but the integrated analysis shows that this is not the case.
What are the remaining explanations for the unequal representation of income groups? One is the account suggested in previous research, in which bias mainly arises during the final link in the chain of responsiveness. For instance, influence from donors and interest groups after elections could push governments to pursue policies that align with the preferences of the affluent (cf. Gilens & Page, Reference Gilens and Page2014). This aligns with recent research showing that low‐ and high‐income voters make voting decisions in similar ways (Kurella et al., Reference Kurella, Giger and Rosset2024), suggesting that the sources of unequal representation likely lie in post‐electoral mechanisms rather than in how different income groups engage with electoral politics.
An alternative explanation that focuses on the earlier parts of the chain is that there is a lack of policy alternatives. If parties across the ideological spectrum run on platforms that are biased towards the preferences of high‐income individuals, the specific electoral outcome will not substantially affect inequalities in representation. This could even be an indirect effect of the greater turnout of the affluent. Hence, ‘demand‐side’ explanations of unequal representation should not be discounted altogether just yet.
At the same time, a remaining question is how our findings can be reconciled with studies showing that unequal representation does seem to be moderated by government ideology (e.g., Mathisen et al., Reference Mathisen, Schakel, Hense, Elsässer, Persson, Pontusson, Lupu and Pontusson2023). One possibility is that the multiplicative effect of (a) differences in voting behaviour between income groups and (b) differences in parties' actions once in office is not large enough to show up in our results. We also note that the effect of partisanship is consistent with post‐electoral mechanisms, given, for instance, variation in lobbying between interest groups (McKay, Reference McKay2010).
Regardless of these remaining questions and possibilities, our basic conclusion is that inequality in representation cannot be attributed to inequalities in electoral behaviour. This has important implications since it means that the causes and hence the potential remedies of unequal representation are not what they are commonly assumed to be. It also suggests a failure of electoral accountability from the perspective of political equality which surely deserves more attention and study.
Acknowledgements
This study was supported by grant 2017:00873 from The Swedish Research Council for Health, Working Life and Welfare (FORTE), Riksbankens Jubileumsfond, Sweden, grant P20‐0359, and The Swedish Research Council (VR) 2017‐03397. We would like to thank seminar participants at Uppsala University and ECPR 2023 for their helpful comments.
Data Availability Statement
For data and replication files for this article, see https://doi.org/10.7910/DVN/W8IZ21.
Online Appendix
Additional supporting information may be found in the Online Appendix section at the end of the article:
Table A.1: Regression analysis: Dependent variable congruence (0‐100), independent variable income percentile
Table A.2: Regression analysis: Dependent variable turnout (0‐100), independent variable income percentile.
Table A.3: Regression analysis: Dependent variable: Whether individual prefer closest party on the left/right scale (0‐100), independent variable income percentile.
Table A.4: Regression analysis. Dependent variable: Whether preferred party (models 1‐2) and ideologically closest party (models 3‐4) are included in cabinet (0‐100).
Table A.5: Mediation analysis
Table B.1: Included Countries and Election Years
Table B.2: Included survey questions
Figure C.1: CSES. Perceived Distance to Preferred Party ‐ All Respondents
Figure C.2: CSES. Perceived Distance to Ideologically Closest Party ‐ All Respondents
Figure C.3: CSES. Income and Agreement With Experts' Left‐Right Party Placements
Figure C.4: CSES. Distance to Preferred Party ‐ Only Including Respondents Who Agrees With Experts


 Open access