
In September 2022, the month after my presidential address, hospitals and schools across the United States faced harassment and bomb threats for their support of transgender children and teens. A Twitter account that amplified this harassment and identified specific targets remained active—it was only removed from Twitter after Boston Children’s Hospital was evacuated after a specific bomb threat. At the same time, Kiwi Farms, a website dedicated to facilitating stalkers’ ability “to organize leads, online campaigns, and real-world harassment,” frequently targeting the LGBTQ+ community and women, refused to moderate its content. Ultimately, it fell on Cloudfare, the business that provided Kiwi Farms’ security services, to take a stance—it blocked Kiwi Farms. Without Cloudfare, Kiwi Farms could not exist (Mann and Lorenz Reference Mann and Lorenz2022).
Big Tech—to include Apple, Amazon, Google, Meta, and Microsoft by most definitions—exemplifies the dominance of the general industry, yet thousands of firms follow in the long trail of the ethical exhaust created by the corporate decisions of the Big Five, including how data are gathered and used, how content is moderated, and how platforms are governed. These companies dominate our economy and our lives. The market cap of Meta is US$451 billion, of Google US$1.2 trillion, and of Amazon US$1.2 trillion—business ethics’ favorite examples of Johnson & Johnson (US$457 billion), Pfizer (US$293 billion), JPMorgan Chase (US$333 billion), and ExxonMobil (US$377 billion) pale in comparison.Footnote 1 Entire sections of the Wall Street Journal and the New York Times are dedicated to the sector.
Although technology companies, including social media, can support democratic principles and aid in valuable goals (Whelan, Moon, and Grant Reference Whelan, Moon and Grant2013), Big Tech has also strained our norms and laws in employment, property, customers, privacy, surveillance, friendship, and community. New laws have been proposed to protect stakeholders. Areas of academia dedicated to the study of how data are used, monetized, and weaponized have been established in law, information studies, communications, computer science, and philosophy. These disciplines have subfields, specialized programs, and research agendas on tech ethics broadly as well as the specific issues we face today.
The discipline of business ethics has been slow to include Big Tech as a worthwhile object of examination.Footnote 2 My goal in this presidential address is to make the case that the discipline of business ethics is overlooking novel harms and marginalized stakeholders in emerging and impactful technology industries. One reason we are missing these novel harms is because they are felt by margainalized stakeholders whom we as business ethics scholars do not necessarily see and address in our analysis and deliberations. And although the business ethics discipline is in some ways and to some extent becoming more inclusive, the persistent narrowness of our field inhibits our ability to identify and examine novel issues in these important industries. I use standpoint theory (Harding Reference Harding2004, Reference Harding2015; Allen Reference Allen1998) to suggest one reason why we remain narrow in what we think counts in business ethics as valid objects of concern: because we are similarly narrow in who counts as a business ethicist. What we see as valid objects of ethical, critical examination—in journals, hiring, conferences—is dependent on our standing, experiences, knowledge, education, and so on. As business ethicists, we are a lens that we train on the world to identify who counts as a scholar, what we study, and who matters.
We need not only to broaden who we consider valid stakeholders worthy of ethical examination but also, through the arguments of standpoint theory, to continue our efforts to broaden participation in our field as scholars to remain relevant and impactful. I provide examples of self-reflection on inclusiveness in sister disciplines of economics, philosophy, and management. There exist many ways to reflect on the inclusiveness of a discipline. Although many studies have focused on gender, more work needs to be done along other vectors of analysis. I include references to studying authorship by international collaborations as well as home institution within business ethics.
I report the results of an authorship analysis within Business Ethics Quarterly (BEQ), the journal of the Society of Business Ethics. I find that while the field is improving in regard to broadening who is considered a scholar in business ethics, over 70 percent of the articles currently being published by BEQ are all-male authorship teams (either single male authors or all-male author teams). I provide this report as an example of the type of self-reflection possible within a discipline. Being more inclusive along many vectors is important, according to standpoint theory, to ensure that many methodologies, theories, and views are present in the discipline. Importantly, being more inclusive does not guarantee that particular theories will be used. Standpoint theory suggests that different approaches, theories, and methodologies will naturally emerge with a more diverse set of scholars with different histories, backgrounds, and lived experiences.
Business ethics is needed in the critical examination of Big Tech for two reasons. First, this conversation about the ethics of firm decisions needs the language and theories of business. Scholars outside of business, in computer science, law, information studies, and philosophy, tend to assume a “business sucks” story (Freeman Reference Freeman1994, Reference Freeman2018) owing to their lack of familiarity with organizations, industries, and managers. Second, although information studies and management have begun to examine topics like artificial intelligence and privacy, their uncritical assumptions concerning the efficiency and accuracy of technology fall into more fatalistic technological imperative arguments and lack the important critical examination of the type of “progress” being made, the prioritization of adopting technology, or even the values encoded in their own research (Birhane et al. Reference Birhane, Kalluri, Card, Agnew, Dotan and Bao2021). Business ethics has an important role to play in the ethical examination of Big Tech, and we need as many voices as possible for novel insights and grounded approaches.
ROLE OF BIG TECH
Origin Story: Gamergate
In 2014, thousands of people in the gaming community began to systematically harass, heckle, threaten, and doxFootnote 3 several outspoken women in the gaming industry. First focused on those in game design and development, the harassers soon included journalists and allies as their targets. Those advocating for greater inclusion in gaming were being targeted by “vitriolic naysayers,” who were predominantly white, young, conservative cis-men (Dewey Reference Dewey2014). The issue started with a young, female game designer who produced a game, Depression Quest, that was considered not really to be a game by the detractors. As summarized, “remember, this whole debate essentially boils down to identity: what counts as gaming and what doesn’t” (Dewey Reference Dewey2014).
The harassment occurred under the social media hashtag #Gamergate, which still reflects antifeminist resentment today (Romano Reference Romano2021). People were targeted online and at their homes—including a journalist who merely tweeted about the issues (Scimeca Reference Scimeca2014). Importantly, the targeting and harassment occurred online on social media, which allowed for disparate naysayers or actors from across the world to coordinate to target individuals. Social media platforms allowed onlookers to witness, join, and amplify the harassment and to participate in the campaign.
In the same year, hacked pictures of a number of celebrities were posted online—now known as nonconsensual porn. These pictures were also posted on social media and went viral. As noted back in 2013 by law scholar Mary Ann Franks, “once these pictures are distributed this way, these women are suffering stalking, they’re suffering harassment, they’re forced to leave their jobs, their relationships are suffering, we’ve had a couple tragic cases where victims have committed suicide. . . . We are looking at a situation where the problem is clear but there isn’t a lot of ways they can take action within the law” (Kopan Reference Kopan2013). In 2016, 2 percent of Americans reported being victims of nonconsensual porn, with young adults, women, and LGBTQ+ being victims at a higher rate; the number of victims grew 400 percent by 2019 (Carter Reference Carter2021).
In both cases from 2014, social media platforms were weaponized to harm other users and people not even on the platform. Over the next eight years, this ethical issue—what responsibility do platforms have for those harmed by the information posted on their sites?—was debated in the law; arguments were presented at computer science, law, privacy, and information studies conferences; and new laws were passed. Top law scholars worked with state regulators and social media companies to design programs and laws that would protect the firms’ stakeholders (Citron and Franks Reference Citron and Franks2014).Footnote 4 Facebook started a program to help victims proactively identify material posted on its site that would be considered nonconsensual pornography (Andrews Reference Andrews2017). From 2013 to 2019, forty-six states, a US territory, and Washington, D.C., passed anti–revenge porn laws (Carter Reference Carter2021).
An ethical issue around the responsibility of businesses for the information they promote and from which they profit was debated in the press, businesses came up with solutions five to six years later, and new laws were passed throughout the states. These same ethical issues—responsibility of platforms for the content they host and amplify, novel harms to marginalized stakeholders with no power—shifted from targeting women to fostering hate groups, hosting deepfake porn, and recommending an insurrection (Martin Reference Martin2022b). Gamergate was a harbinger of the types of ethical issues now found frequently.
From 2013 to 2019, our field had zero publications on platform harms in business ethics journals.
Issues Afflicting Those at a Distance
Common to each of these issues is a transaction on a platform between two market actors—a content supplier and a user—that creates a harm to third parties with no power. Figure 1 is an illustration for social media, which is an industry designed to benefit the platform, advertisers, and some users, but in which data subjects and marginalized stakeholders are systematically harmed (Villegas-Galaviz and Martin Reference Villegas-Galaviz and Martin2022). The revenue models for social media reward hateful and awful content by prioritizing mere engagement with content: more engagement means more advertising revenues, and engagement is seen as the priority of the platform in deciding what content to amplify. Companies have a market incentive to amplify harmful material (Bhargava and Velasquez Reference Bhargava and Velasquez2021) and violate consumer privacy by collecting more data (Martin Reference Martin2015). We also see this phenomenon of destructive demand with online ad networks and data brokers (Calo Reference Calo2014; Martin Reference Martin2022a; Susser, Roessler, and Nissenbaum Reference Susser, Roessler and Nissenbaum2019).
Technology and Marginalized Stakeholders

Gamergate may seem isolated, but this issue in the platform economy of two market actors transacting—for example, a content creator and a user who sees the content—has ballooned to industry-wide ethical issues. The harms also continued to balloon.
We have large industries whose business models are based on using marginalized stakeholders’ data—social media, ad networks, or even many artificial intelligence (AI) programs—against the subjects of the data themselves, acting in ways that are demeaning and objectionably exploitative (Bhargava and Velasquez Reference Bhargava and Velasquez2021). These firms have stakeholders who are negatively impacted by the decisions of a firm but who do not have any real relationship with the firm, power over the firm, or voice.Footnote 5 Tae Wan Kim and coauthors (Reference Kim, Lee, Xu and Routledge2021) have made a convincing argument that we need to see such an individual as a type of investor.
The content moderation issues of Gamergate started as targeted harassment, but nonconsensual porn, hate speech, deep fakes, disinformation campaigns, and domestic terrorism recruitment are all made possible by platforms that benefit from the creation of bad content that provokes engagement—content that is viewed as “bad for the world” by its own users and causes harm to those not on the platform. As Suneal Bedi (Reference Bedi2022) notes, content moderation is the quintessential business ethics issue as the law actually states that firms are given the space to moderate their content in alignment with their values—it is up to us as scholars to help.
Ethical Issues at Scale
Left unattended, the issues of this industry have grown in scope and reach. Content moderation, platform governance, and data governance are not only issues in the United States; platforms face issues of governing hate speech and inciting violence as well as their role in fostering genocide in Kenya and Myanmar (Cameron Reference Cameron2022; Mozur Reference Mozur2018). And these platforms have a broad impact beyond their market cap as a measure of their importance in the economy: Facebook has 2.9 billion unique monthly users, Twitter has 330 million, Instagram has 2 billion, and Amazon has 213 million. Incredibly, 36.8 percent of the world population is on Facebook monthly (Martin Reference Martin2022c).Footnote 6
Gamergate illustrated ethical issues we see today at scale:
-
• corporate responsibility of platforms for the content they carry, monetize, and even promote (Klonick Reference Klonick2017)
-
• novel harms, including emotional distress, addiction (Bhargava and Velasquez Reference Bhargava and Velasquez2021), intimate privacy violations (Keats Citron Reference Keats Citron2019), manipulation and gamification (Kim Reference Kim2018; Martin Reference Martin2022a), and violence and harassment
-
• content moderation issues (Bedi Reference Bedi2021), including hate groups, domestic terrorism, and disinformation
-
• racial and gender discrimination on dating sites (Bedi Reference Bedi, Brison and Gelber2019), on job and rideshare platforms (Greenwood et al. Reference Greenwood, Adjerid, Angst and Meikle2022), in insurance (Steinberg Reference Steinberg2022), and on ad networks (Lambrecht and Tucker Reference Lambrecht and Tucker2019)
Not only has the US Congress held hearings on platform governance and content moderation but state attorney general’s offices, the US Federal Trade Commission, and the US Department of Justice have started to take action against firms to protect consumers. New protections are being put in place around the collection and use of consumer data, the power of platforms to dictate how consumer data flow online, and the criminalization of nonconsensual porn.
These business models—which dominate our social lives and economy—have gone underexamined within business ethics, and the stakeholders most impacted by this industry are also marginalized in society: victims of nonconsensual porn and almost all deep fakes are women (Chesney and Citron Reference Chesney and Citron2019), victims of targeted harassment and hate speech are racial and ethnic minorities and LGBTQ+ persons, victims of the genocides are ethnic minorities. As Citron and Franks (Reference Citron and Franks2014, 347) note, “our society has a poor track record in addressing [these] harms that take women and girls as their primary targets.” The same can be said about the harms in the collection and use of data targeting those crossing the US border (Paullada Reference Paullada2020), those on welfare (Eubanks Reference Eubanks2018), and racial and ethnic minorities in general (Hu Reference Hu2017; Benjamin Reference Benjamin2019).
STANDPOINT THEORY
How is business ethics—a discipline dedicated to critically examining firms, industries, and markets—overlooking Big Tech, firms, industries, and markets that systematically harm stakeholders with little power? One reason is offered by standpoint theory. Standpoint theory is a critical theory focused on the relationship between the production of knowledge and practices of power (Harding Reference Harding2004). Standpoint theory suggests that what is studied as a valid object of concern is seen through the lens of the individual or group in power. In other words, what we study in business ethics is defined by the scholars who are making sense of the world, including the issues they see and the moral problems that need addressing. If we take sensemaking seriously (Sonenshein Reference Sonenshein2007), this is not controversial.
Initially, standpoint theory was a mechanism to empower oppressed groups and value their experiences to develop an oppositional consciousness (Harding Reference Harding2004; Collins Reference Collins2002; Sandoval Reference Sandoval1991).Footnote 7 For example, Patricia Hill Collins (Reference Collins2002) notes the advantage outsiders, specifically, in her case, Black women, can have in providing insights unavailable to “insiders” of a given organization or field; Allen (Reference Allen1996) takes a similar approach to being an outsider in an academic department. Standpoint theory has been leveraged to correctly critique feminist theory as dominated by white women and concerned only with the issues those scholars as a dominating group see (Allen Reference Allen1996, Reference Allen1998; e.g., hooks Reference hooks1989, Reference hooks2000). In each case, standpoint theory helps to examine how the narrowness of knowledge producers limits the scope and type of knowledge produced.
Standpoint theory has been applied to academia. Dorothy E. Smith (Reference Smith and Harding2004) gave a presentation using standpoint theory to the American Association for the Advancement of Science. Smith was concerned with the way the popular theories from sociology’s methods, conceptual schemes, and theories had been developed within the male social universe and how sociology had at that time “taken for granted not just that scheme of relevances as an itemized inventory of issues or subject matters … but the fundamental social and political structures under which these become relevant and are ordered” (22). As Harding (Reference Harding2004, 17) summarized, Smith found “a suspiciously good fit with, on the one hand, the ways men tend to understand social life and, on the other hand, the categories and explanations of social relations that administrators and managers of social institutions … need in order to succeed at their work.” In other words, the conceptual frameworks and objects of study were “complicitous with the projects of dominant groups.”
For our field, the concern would be that what we study as valid objects of concern are through the lens of the scholar. And if that scholar list is made up of people in positions of power, then who we think are “harmed” and what we see as important areas of ethical concern can also be limited. For example, queer theory “demands that we question the dominant foundational assumptions about what is ‘normal’ and what is ‘abnormal’ through a process of incessant critique, typically to disrupt claims about the essential nature of sexuality and gender” (Rumens and Tyler Reference Rumens, Tyler, Mir, Willmott and Greenwood2015, 225). One does not necessarily need to be queer to understand or empathize or identify the “unsettling processes of normalization” relevant to areas of heteronormativity and LGBT+ people. However, the lived experiences of someone in the LGBTQ community would allow the individual to more easily identify the issues that queer theory can elucidate. Standpoint theory, similar to performativity in management studies, acknowledges that knowledge and the pursuit of knowledge do not represent “reality” but are an embodied process that is collective and transformative (Mir, Willmott, and Greenwood Reference Mir, Willmott, Greenwood, Mir, Willmott and Greenwood2015, 9).
Standpoint theory suggests that we focus on the relationship between the production of knowledge and practices of power and be concerned that who counts as a scholar in business ethics matters not only to remain relevant and maintain academic rigor but also to explore new issues and theories not seen by the dominating group of scholars. Narrowing who counts as a scholar means, according to the research, that we are leaving behind those with signficant potential and intellect, insightful ideas, and new concepts.
WHO COUNTS AS SCHOLARS
Within the academy, scholars have examined who “counts” within a discipline by examining authorship in journals. Academic journals are crucial gatekeepers for a discipline (Hassoun, Schwitzgebel, and Smith Reference Hassoun, Schwitzgebel and Smith2018). Within management, Aguinis et al. (Reference Aguinis, Cummings, Ramani and Cummings2020) offer insights as to how the focus on journals for hiring, tenure, and promotion dominates decisions at universities, and Osterloh and Frey (Reference Osterloh and Frey2020) call publications in top journals the “currency of performance for the evaluation of scholars.” For example, Hassoun, Schwitzgebel, and Smith (Reference Hassoun, Schwitzgebel and Smith2018) examine not only the proportion of philosophy faculty who are women (26.6 percent) but also the percentage of authors in elite publications who are women (13 percent) or Black (less than 1 percent). Who counts as authors in our journals both embodies and dictates who counts as scholars in the field.
For some, the argument to broaden who counts is around quality. The narrowness of who counts means that more qualified, insightful scholars are being left behind. Research supports this. For example, female authors in economics are found to have better citation metrics over time (Conde-Ruiz et al. Reference Conde-Ruiz, Ganuza, García and Puch2022). Similarly, Hengel and Moon (Reference Hengel and Moon2020) show that articles published in “top five” economics journals authored by men are cited less often than articles in those same journals published by women. And men’s citations rise when they coauthor with women, whereas women’s citations fall when they coauthor with men, conditional on acceptance.Footnote 8
This issue of quality—that the discrimination actually leaves behind the more qualified candidate—is supported in studies outside of academia. High-achieving women are more penalized in math, with high-achieving men (high–grade point average [GPA] math majors) being called back three times more often than their equally qualified high-achieving female counterparts (high-GPA math majors). Gendered stereotypes penalize women with good grades—particularly math (Quadlin Reference Quadlin2018). In other words, hiring managers would rather discriminate against women than hire the most qualified candidate.Footnote 9 Why men discriminate against more competent women is also studied. One study found that “female-directed hostility primarily originates from low-status, poorer-performing males” (Kasumovic and Kuznekoff Reference Kasumovic and Kuznekoff2015). Less competent men were more likely than their more competent male peers to be hostile to high-performing women. These same, less competent men were simultaneously more deferential to high-performing men.
For others, the issue of who counts is more than representation or quality, but more aligned with standpoint theory. The ideas of people with different backgrounds just differ, and we hear and see the voices that we can identify. Within business schools, Black, Latinx, and Native American scholars remain underrepresented as faculty (Grier and Poole Reference Grier and Poole2020), and their experiences of discrimination oddly need to be validated by others before being perceived as “real”—adding an additional burden (Wooten and Ferguson Reference Wooten and Ferguson2021).Footnote 10 Similar to the studies in economics and nonacademic fields, requests from women and minority students are ignored by faculty at a higher rate than requests from white males (Milkman, Akinola, and Chugh Reference Milkman, Akinola and Chugh2015).Footnote 11 Some people are not heard or seen by the dominant group.
A recent post on the philosophy blog Daily Nous by Alexander Guerrero (Reference Guerrero2022) lays out the issues when the field stays within a standard story of what counts as philosophy: “It’s natural to feel defensive and protective of what you have come to know and love. . . . [However,] the problem with the standard story is entirely about what it excludes.” Those who stay with the standard story of who counts in philosophy cannot really claim that they “have either no or only glancing acquaintance with the work from these other traditions.” Those in power in journals—editors, reviewers—form a type of gatekeeping, and recent work has shown that gatekeeping is a powerful force in the effort to define a discipline or field. Fini et al. (Reference Fini, Jourdan, Perkmann and Toschi2022) find that high-performing but “ill-fitting” candidates are penalized by evaluators because they threaten the distinctiveness and knowledge domain of a discipline (i.e., the standard story according to Guerrero). The study was on disciplines across academia.
This self-reflection in other disciplines as to who counts in their disciplines is for good reason—academics are not great at maintaining diversity. In general, although women make up more than half of doctoral students, the proportion of women falls at each stage of the profession and is around 32 percent at the full professor level.Footnote 12 In studies of academics, researchers found that US scientists were more likely to offer a research position to men, offer more hours of mentorship, and provide a higher salary than for equally qualified women (they kept the CVs the same) (Moss-Racusin et al. Reference Moss-Racusin, Dovidio, Brescoll, Graham and Handelsman2012). Letters of recommendation by faculty for undergraduate students applying to medical school include more “standout” compliments if they are written for men (Trix and Psenka Reference Trix and Psenka2003). During the editorial process, the best economics journals forced women to go through more revisions, even though there was no difference in quality between the first submissions of male and female economists (Hengel Reference Hengel2022). These female economists also receive less credit at promotion time for their coauthored papers compared to male junior economists who coauthor at promotion (Sarsons Reference Sarsons2017).Footnote 13
Such self-reflection within management, though rare, provides a template for my specific examination within business ethics. Auschra, Bartosch, and Lohmeyer (Reference Auschra, Bartosch and Lohmeyer2022) examined the gendered distribution of authorship in the leading management and organization studies (MOS) journals.Footnote 14 Women have been underrepresented across the leading MOS journals, with variance across journals and across fields or specializations. Male authors dominate the majority of research topics, and all-male authorship (single-authored papers or all-male teams) remains the most prevalent form of authorship of journal articles, as shown in Figure 2. The number of single-author females and all-female teams remained fairly consistent over the thirty-six years, but the percentage of mixed (male and female) teams grew substantially, from 12 percent of the articles in 1991 to 41 percent in 2017.
Article Authorship in Management and Organization Studies (MOS) Journals, 1991 and 2017 (Auschra, Bartosch, and Lohmeyer Reference Auschra, Bartosch and Lohmeyer2022)

WHO COUNTS AS BUSINESS ETHICS SCHOLARS
I turn now to analyzing who counts within our discipline as business ethics scholars. There are many ways to analyze diversity for a discipline: by race, ethnicity, LGBTQ+ identity, nationality, gender, scholarship type, theoretical approach, and so on. Fassin (Reference Fassin2022) recently analyzed which universities produced the most business ethics scholarship. Through a thorough search across journals on the general topic business, firm, or organization ethics, Fassin found that business ethics research is dominated by authors from Penn State University, the University of Washington, and York University.
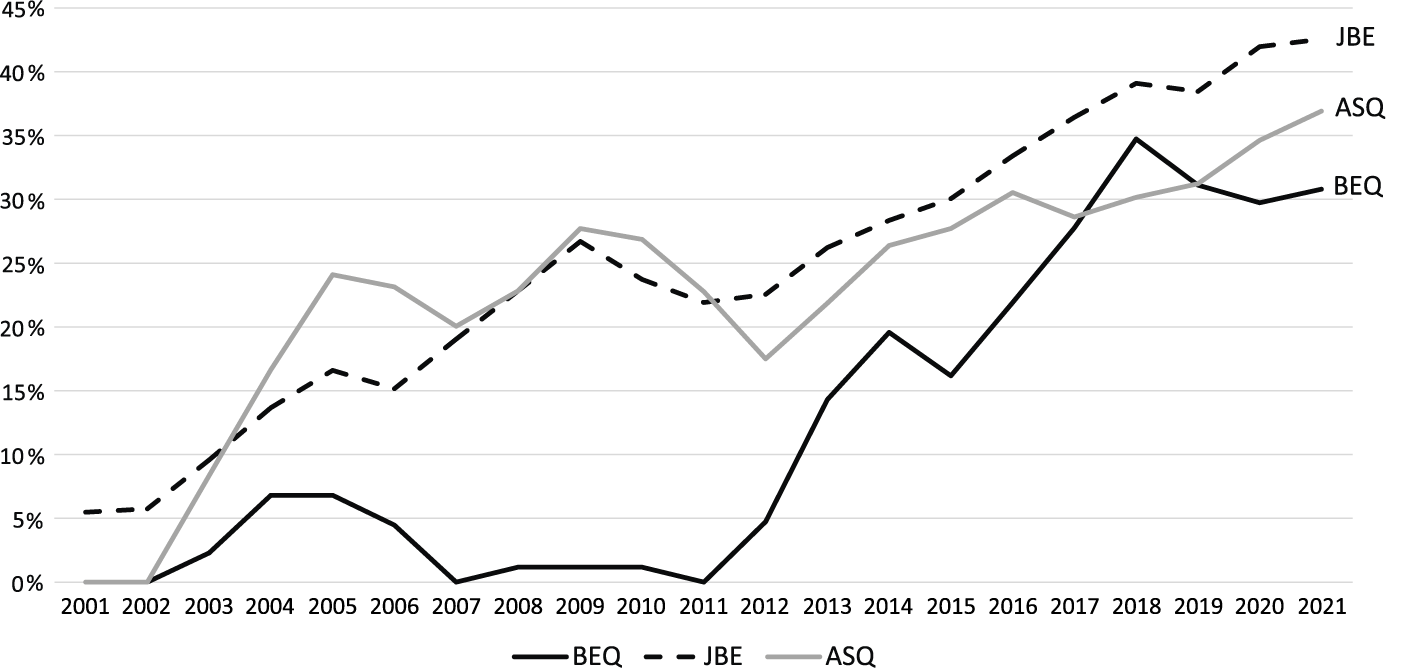
Another metric tracked across journals is the percentage of international collaborations,Footnote 15 as shown in Figure 3. I have included the same information for both the Journal of Business Ethics (JBE) and Administrative Science Quarterly (ASQ).Footnote 16 While both ASQ and JBE had a head start in diversifying their authorship through international collaborations, BEQ’s growth in this area started about ten years behind—but BEQ is catching up, aside from a slight dip from 2017 to 2022.
Diversity by International Collaboration of Authors for BEQ, JBE, and ASQ
Note. Trailing three-year average. Data from SCImago Journal Rank 2022.
I conducted an authorship analysis of BEQ by gender. For my analysis, I recorded the year, issue, title, and authors for every article since BEQ was first published.Footnote 17 I then recorded the gender of each author; when any confusion arose, I searched for the author until I found how the author identified. I categorized the authorship type of each article using the types from the MOS study reported in Figure 2: 1) SA F, single-author female; 2) SA M, single-author male; 3) MA F, multiauthor female; 4) MA M, multiauthor male; and 5) Mixed, mixed team. The results are therefore reported two ways: by 1) the distribution of authors (male/female) and 2) the authorship type of the articles. Overall, I found that 78 percent of the authors of BEQ since 1991 have been male. As to authorship type by article, 73 percent of the BEQ articles were either single-author male (51 percent of all articles) or all-male team (22 percent of all articles). Single-author female articles were 9 percent of all articles,Footnote 18 and all-female teams were 3 percent of all articles (12 percent of all articles were all-female authorship). Fifteen percent of articles had mixed author teams. Figure 4 illustrates authorship type by article.
Distribution of Authorship Types for All BEQ Articles

Figure 4 does not capture the entire story of authorship at BEQ, however. Specifically, I found that authorship diversity has high variability by year and by issue and is also improving. For example, Figure 5 illustrates the improvement in authorship from 1991 to 2021 by gender.
Authorship by Gender, 1991 and 2021

Variability
In plotting the authorship gender diversity by issue, I noticed outliers where an issue would have over 50 percent female authors, while the surrounding issues were dominated by male authors. For example, issue 89 in 2011 had eight female and three male authors, although the average was the reverse at that time. Similarly, and to the opposite effect, two issues were published with 100 percent male authors (all were single-author male and all-male teams). Not one female author was accepted for those issues in 2012, though the surrounding issues were improving in authorship. I soon realized these were special issues, as seen in Figure 6 (green stars).
Count of Author Gender by Issue of BEQ
Note. Star is special issue.

To better understand the authorship trend within special issues, Figure 7 shows how different the authorship teams are for the regular editorial process at BEQ (middle) versus special issue editorship (left) and overall (right). The left column (special issues) shows a greater proportion of female authorship teams and mixed author teams. Special issues also have more teams of authors (rather than single authors), which is partially explained because, similar to the MOS study in Figure 2, teams in general became more popular in 2011, and special issues started only in 2011 at BEQ.
Special Issue Authorship Types

However, the variety of authorship in special issues offers a few important insights. First, editorship matters. Special issues are focused on a specific topic, with editors brought in with expertise in that topic. An editor with expertise in an area can better judge the quality of contributions and identify any theoretical contributions. Second, special issues illustrate a more diverse pool of possible authors and author teams, and these diverse (or more diverse) author teams were writing on business ethics topics. These types of authors either did not submit or were not accepted in the regular process, while being available within the academic market as possible BEQ authors at the time.
Improvement
Second, authorship diversity by gender has improved over the years. Figure 8 shows the percentage of male authors decreasing over time. When broken down by decade, we see the field trending more inclusive, similar to the trend with international collaborations discussed earlier.
Percentage of Male Authors by Decade

Figure 9 shows authorship diversity trends by article from the start of BEQ (1991–93) to the present day (2018–21). We see a similar trend to the management analysis in Figure 2. The large shift is from single-author male articles to all-male teams and mixed author teams. This is consistent with the management authorship study we saw earlier, with BEQ having a similar growth in diversity of authorship types. BEQ started “behind” management in terms of gender diversity but has a similar trend over the last thirty years.
Authorship Types of Articles over Time

Overall
So, although BEQ had a slightly later start in international collaboration and gender diversity, the field is improving on a number of metrics. I turn to examining BEQ metrics in citations and impact factor. Figure 10 shows the percentage of BEQ articles cited for a given year with comparison to JBE and ASQ. This is a trailing three-year average to even out fluctuations by year. BEQ was improving up until approximately 2017, when we see the percentage of articles cited at all start to fall.
Percentage of Published Articles Cited (at All)
Note. Trailing three year average.

Figure 11 charts the four-year citation count per article (approximately the impact factor) and illustrates a similar trend—improvement with a bit of a stall starting in 2015 compared to competitors. Publications in 2015 would have been submitted in 2012–13.
Average Number of Citations per Article (Four Years)

Figure 12 brings the metrics together with the percentage of articles cited at all, the percentage of female authors, the percentage of all-male authorship teams, and the percentage of international collaborations in authorship teams. Improvements in the percentage of international collaborations and female authors stall in 2017, along with the percentage of articles cited; all-male authorship teams make a resurgence. Although articles published in 2017 demonstrate an issue, it is important to note that, initially, these would have been submitted in 2014 and would have been working papers back in 2012–13.
Trends in Journal Metrics, BEQ

DISCUSSION AND CONCLUSION
Moving forward, the field of business ethics could benefit from the type of introspection and self-reflection performed in our sister academic disciplines of economics, philosophy, and management, not only out of fairness, but because disciplines are better when they are more inclusive, with a better breadth of knowledge, according to standpoint theory, and better-quality scholarship, according to empirical studies.
Not only is self-reflection beneficial to the discipline but the lack of self-reflection about inclusion can be harmful. A Reference Castilla and Benard2010 study by Castilla and Benard showed the paradox of “meritocracy”: “when an organization is explicitly presented as meritocratic, individuals in managerial positions favor a male employee over an equally qualified female employee by awarding him a larger monetary reward” (543). Translated to academia, scholars making decisions in an organization that claims to focus on meritocracy will show a greater bias in favor of men over equally performing women. In fact, the foregoing studies showed such a phenomenon.
Although the focus of the BEQ authorship study was on gender, standpoint theory pushes us to think of all the ways we are exclusive—by race, ethnicity, LGBTQ+ status, nationality, educational background, methodology, and so on. This has provided only one way to self-reflect as a discipline, and standpoint theory provides the theory to show why being exclusive in who counts as a business ethics scholar has only harmed the field over time.
I turn next to how the field of business ethics can contribute to the field of tech ethics: by 1) applying our existing theory, 2) extending existing theories, 3) offering novel theories, and 4) bringing business theory to the ongoing debate in tech ethics. I give examples of current work in the field that has included understanding novel harms within the Big Data industry as well as work in critical data studies that focuses on marginalized stakeholders.
Issues for the Discipline
In regard to what to study next in the general area of Big Tech and the tech industry, we can think of business ethicists as contributing in a few ways. First, applying our existing theories and concepts to novel markets and firms illustrates that the Big Tech industry is not so very different from what we have dealt with in the past. For example, Bhargava’s work on social media addiction (Bhargava and Velasquez Reference Bhargava and Velasquez2021) and firms’ reactions to employees at the center of mass online outrage (Bhargava Reference Bhargava2020) brings attention back to concepts we have known for decades and ties the issues we face today to those we have faced, analyzed, and dealt with in the past. Similar work by Kim on a right to an explanation (Kim and Routledge Reference Kim and Routledge2020), the ethical issues of gamification (Kim Reference Kim2018), and when it is ethical for AI to lie (Kim et al. Reference Kim, Lee, Xu and Routledge2021) uses existing rights of individuals as well as obligations of firms to tie our current issues to current concepts in business ethics.
We also see the benefits of showing how behavior in this “new” field is similar to issues we have faced in the past. For example, Etye Steinberg (Reference Steinberg2020) analyzes the ethics of personalized pricing online, an economic phenomenon that has been known for decades. Peter Seele and colleagues (Reference Seele, Dierksmeier, Hofstetter and Schultz2019) have similarly applied existing theory around personalized pricing to firms online.
More broadly, more work needs to be done to justify the use of AI or other technologies within the values and goals of the organization. In other words, is the use of AI in a particular circumstance congruent with the values and purpose of the organization? For example, Bhargava and Assadi (Reference Bhargava and Assadi2022) examine the use of AI for hiring and argue that firms should be concerned with abdicating a hiring choice to an algorithm, however sophisticated the AI programs ultimately become. Their argument does not depend on whether the AI program is “right” or “wrong” in the outcomes; instead, Bhargava and Assadi clearly identify the role of interviews in the hiring process, for the recruit and the firm, and the harms that follow from having AI perform interviews. Importantly, their argument stands even if a technical solution is found to make the outcomes “perfect” (my word, not theirs). For Bhargava and Assadi, management theorists as well as managers need to broaden and reframe their traditional understanding of the nature of interviews—and what is lost by automating them. Similarly, Parmar and I (Martin and Parmar Reference Martin and Parmar2022) argue that before any adoption of AI, firms should clearly identify how AI would allow them to meet their current obligations around their mission, values, and purpose, regardless of how ‘efficient’ or ‘accurate’ the AI claims to be. Both papers attempt to shift the justification of using AI back to whether the adoption and use of AI is good for the firm, using the theories, arguments, and concepts that exist for management and firm decision-making.
Second, we can think of how we need to extend our current theories to think differently about both the situation and the concept. Scharding (Reference Scharding2021, Reference Scharding2022) suggests that we extend our ideas of trust to include technological trust, and Johnson (Reference Johnson2015) suggests that we extend our ideas of moral agency and corporate responsibility to include technology as a moral actant (acting with moral implications, but not agents)—and applying the known issue of greenwashing to AI with “machinewashing,” where firms use AI to hide their unethical behavior (Seele and Schultz Reference Seele and Schultz2022). Whelan, Moon, and Grant (Reference Whelan, Moon and Grant2013) look at how new technology impacts existing theory with the role of social media in corporate social responsibility literature.
Kim et al. (Reference Kim, Lee, Xu and Routledge2021) provide an illustrative analysis of considering current theories and concepts and seeing how we may need to extend our assumptions with new markets and industries. In “Data and Manure: Are Data Subjects Investors?,” the authors first define investors and then explain how data subjects, in providing a key resource to the firm while retaining some rights with regard to how that resource is used, are better understood as investors than as consumers or labor. The article shows the benefit of using business concepts and theory to understand a given phenomenon within Big Tech. Too often, we act as though Big Tech or Big Data is a dark hole absent of any working theories, whether ethical, economic, managerial, or legal. Kim et al. illustrate the power of bringing forth existing theories to understand what is new and speaking in the language of business for other scholars and practitioners to understand. In many ways, these scholars are saying “see, this is not so different that we can’t figure it out” and grounding the analysis in current management vocabulary.
Platforms are an interesting area to look to extend our current thinking about the role of the firm and the ethics of platform governance (Etter, Fieseler, and Whelan Reference Etter, Fieseler and Whelan2019). Platforms are unique in acting as both firms and markets and have a dual obligation (Martin, Hong, and Easley Reference Martin, Hong and Easley2022). Given how prevalent platforms are in the current economy, more work needs to be done to better understand how our theories of firms work with platforms—or if some assumptions need to be dropped or amended.
Third, we may need to bring forth new theories and approaches that have been neglected within business ethics. For example, Carolina Villegas-Galaviz (Reference Villegas-Galaviz and Martin2022) is applying the ethics of care to AI to better understand how the development and deployment of AI impact existing relationships and vulnerable stakeholders—stakeholders who are further silenced with the use of AI. Greater inclusivity enables a wider variety of theories to be included within the discipline and used as ethical tools to interrogate novel technologies and situations.
Perhaps as an indicator of where the field needs to move, increasingly, scholars are using critical theory to better understand the value-laden-ness of the technology and the power dynamics of the industry. For example, Trittin-Ulbrich and colleagues (Reference Trittin-Ulbrich, Scherer, Munro and Whelan2021) have a special issue on critical approaches and the technology industry.
Similarly, Scorici, Schultz, and Seele (Reference Scorici, Schultz and Seele2022) take a critical approach to understanding how firms are “intentionally or unintentionally misleading organizational stakeholders and the broader public about the true capabilities that AIEMs [AI-enabled machines] possess.” The work on machinewashing is similarly critical in acknowledging the use of AI to further the power of Big Tech firms by deceiving stakeholders (Seele and Schultz Reference Seele and Schultz2022).
In a critical analysis of human resources (HR) decision-making, Leicht-Deobald and colleagues (Reference Leicht-Deobald, Busch, Schank, Weibel, Schafheitle, Wildhaber and Kasper2019, 377) explicitly eschew the false claim that the tech industry’s decision-making tools “are efficient and objective, downplaying their potential biases.” The authors try to ensure that these new HR tools do not undermine the employee’s personal integrity and attempt to hold technology to the standard that exists for employees.
A critical approach to examining AI, tech firms, and the technology industry helps identify the mistaken notion of AI and tech being neutral, efficient, and accurate; the existing power dynamics between firms and subjects and within the industry; and the vulnerable stakeholders further marginalized by the use of AI and other technologies.
Finally, business ethicists should bring business theory and concepts to the ongoing debate within neighboring disciplines. Scorici, Schultz, and Seele (Reference Scorici, Schultz and Seele2022) do bring management theory to the issue of anthropomorphization by identifying “a new gap in the relational interaction between humans and AI triggered by commercial interests, making use of AI through advertisement, marketing, and corporate communications.” The authors explicitly broaden the field of AI and society by “adding the business-society-nexus.” Similarly, Kim and Mejia (Reference Kim and Mejia2019) bring virtue ethics to AI with artificial wisdom in the journal Computer. Similarly, not only have Teodorescu and Yao (Reference Teodorescu and Yao2021) published in business ethics; they have also analyzed how to implement fairness criteria within other disciplines and connected the goal of an accurate solution to the search for an ethically acceptable solution.
Be Knowledgeable as to the Subject
With these four approaches to tech ethics within business ethics—applying existing theory to novel tech issues; extending our theory as needed with a new business model in Big Tech; applying novel theories to the firm, technology, or industry; bringing business theory and concepts to neighboring disciplines—scholars in this area are bringing forth a deep knowledge of the technology they are studying. No one here is claiming that AI is impenetrable or arguing that AI is efficient or accurate with a breezy confidence of someone who has read only marketing material. These scholars are knowledgeable about the subject they are studying.
This is because, although business ethics and management generally are new to this discussion, data, privacy, AI, and Big Tech have been studied for decades in other fields, and there is much to be learned from those who have been researching and writing on a given topic. An excellent example of bringing forth others’ knowledge is the analysis of bitcoin and business ethics by Dierksmeier and Seele (Reference Dierksmeier and Seele2018), who look at relevant literature in “neighboring disciplines” that are further along in the subject, then frame the current debate and link to existing work in business and society.
Similarly, Morse and colleagues (Reference Morse, Teodorescu, Awwad and Kane2022, 1) demonstrate deep knowledge of the actual technology they are studying and the ethical nuances that emerge once the details are known: “we encourage organizations to recognize that managing fairness in machine learning systems is complex, and that adopting a blind or one-size-fits-all mentality toward algorithmic criteria will surely damage people’s attitudes and trust in automated technology. Instead, firms should carefully consider the subtle yet significant differences between these technical solutions.”
Similarly, Suneal Bedi (Reference Bedi2021) takes a careful approach to both how content moderation works and the intricacies of content moderation law when designing a quantitative study. Bedi’s work exemplifies the type of quantitative work for which we hope: clearly normatively grounded, technical details and legal intricacies of the subject, clean study design, and interesting findings that careful content moderation can not only not silence voices on platforms but may in fact make many feel safer to share online.
Finally, Whelan (Reference Whelan2021) provides an example of many of these calls already with his book on the new megacorporation by using existing theories to understand a new phenomenon in the market, examining the phenomenon with a critical lens and taking every available tool—ethical theory, political theory, socioeconomic theory—to understand the new megacorporation in Big Tech. Whelan illustrates the importance of the critical examination occurring within business ethics (broadly construed) by understanding a new type of corporation within Big Tech and the ethical implications of this evolution.
Conclusion
My goal in this presidential address was to make the case that the discipline of business ethics is missing novel harms in the technology industry because these harms are being felt by marginalized stakeholders. I used standpoint theory to suggest one reason why we remain narrow in what we think counts in business ethics as valid objects of concern: because we are similarly narrow in who counts as a business ethicist. Although we, as a field, struggle to be inclusive in many ways, I offer a single gender study of the authorship of BEQ as an example of how the field has become more inclusive over time, while still remaining behind other fields. More work needs to be done to understand where the field is in terms of other vectors of inclusivity.
Acknowledgments
I thank the following people for their constructive comments in developing this presidential address: Vikram Bhargava, Michelle Greenwood, Paul Harper, Tae Wan Kim, Erin Klawitter, Bobby Parmar, Rob Phillips, Harry Van Buren, and Carolina Villegas-Galaviz.
Kirsten Martin (kmarti33@nd.edu) is the William P. and Hazel B. White Professor of Technology Ethics at the Mendoza College of Business at the University of Notre Dame. She is also the director of the Notre Dame Technology Ethics Center (ND-TEC). She researches privacy, technology ethics, and corporate responsibility. She earned her BS in industrial and operations engineering from the University of Michigan and her MBA and PhD from the University of Virginia’s Darden Graduate School of Business.


