

Over the last decade in European politics, the fringe has become mainstream. European voters have increasingly redistributed electoral power to the far‐right and the far‐left, with these parties emerging as a stable feature of the political landscape. To date, populist parties – which comprise a range of movements emphasizing a purported struggle between the ‘pure people’ and ‘the corrupt elite’ (Mudde & Kaltwasser, Reference Mudde and Kaltwasser2017) – have joined governments in Austria, Bulgaria, the Czech Republic, Finland, Greece, Hungary, Italy, Poland, Slovakia, Serbia, Sweden and Switzerland.Footnote 1 What explains their appeal?
Explanations fall along two broad lines. Supply‐side theories emphasize how populists have constructed political platforms which strategically exploit the weaknesses of mainstream parties. In contrast, demand‐side explanations suggest that populist voting is largely a reflexive response to rapid societal change. For instance, some accounts highlight the importance of cultural threat derived from increasing ethnic and religious diversity (e.g., Bustikova, Reference Bustikova2014; Cutts et al., Reference Cutts, Ford and Goodwin2011; Ford et al., Reference Ford, Goodwin and Cutts2012; Harteveld et al., Reference Harteveld, Schaper, De Lange and Van Der Bruget2018; Ivarsflaten, Reference Ivarsflaten2008; Kefford & Ratcliff, Reference Kefford and Ratcliff2021). Others focus on economic grievances related to inequality and diminished socio‐economic mobility (e.g., Abou‐Chadi & Kurer, Reference Abou‐Chadi and Kurer2021; Anelli et al., Reference Anelli, Colantone and Stanig2021; Betz, Reference Betz1994; de Lange, Reference Lange2007; Halikiopoulou & Vasilopoulou, Reference Halikiopoulou and Vasilopoulou2018).
Although cultural and economic grievances can be mutually reinforcing (Colantone & Stanig, Reference Colantone and Stanig2019; Gidron & Hall, Reference Gidron and Hall2017), many analyses tend to link them with different political outcomes. Cultural grievances are often highlighted as the primary driver of support for populist right‐wing parties (Margalit, Reference Margalit2019), whereas explanations for populist left‐wing voting tend to revolve around economic grievances (March Reference March2017; Marcos‐Marne Reference Marcos‐Marne2021; Salmela & von Scheve Reference Salmela and von Scheve2018). However, both sets of grievances are linked to the globalization of markets and human mobility (Rodrik, Reference Rodrik2018). Thus, while left and right‐wing populist platforms may ultimately highlight different targets and scapegoats, it remains possible that they appeal to voters with similar grievances.
Scholars highlighting commonalities among left‐ and right‐wing populist voters have increasingly focused on the concept of relative deprivation – the subjective evaluation that one is worse off compared to a reference group (e.g., Gurr, Reference Gurr1970; Pettigrew et al., Reference Pettigrew, Christ, Wagner, Meertens, Van Dick and Zick2008; Smith et al., Reference Smith, Pettigrew, Pippin and Bialosiewicz2012). Although relative deprivation typically involves a comparison of one's present circumstances with others, ethnographic research has revealed that many populist voters engage in explicit temporal comparisons; that is, they express a sense of loss and a desire to return to an idealized past (Cramer, Reference Cramer2016; Gest, Reference Gest2016; Kuisz & Wigura, Reference Kuisz and Wigura2020). Crucially, such comparisons rely on individuals’ subjective evaluation of life circumstances versus an ideal referent, and may not be based upon an objective deterioration in one's circumstances.
Building on this insight, Gest et al. (Reference Gest, Reny and Mayer2018) argue that support for Donald Trump and the United Kingdom Independence Party (UKIP) can be explained by a concept they term ‘nostalgic deprivation’ – the discrepancy between voters’ subjective understandings of their current status and their perceptions about past positionality – that is, their relative political power, economic well‐being and/or social clout. Specifically, the authors argue that populist supporters perceive discrepancies between their present circumstances and an idealized past when they believe people like them enjoyed more privilege.Footnote 2 Recent research has refined this argument by distinguishing between different types of nostalgia. For instance, Versteegen (Reference Versteegen2023) argues that while personal nostalgia plays a limited role, group‐based nostalgia can lead individuals to view the past status of their identity group in an overly optimistic light triggering feelings of relative deprivation. The resulting sense of downward mobility can unite a variety of disparate grievances under a common frame. Politically, it can be readily exploited by the supply‐side appeals of left‐ and right‐wing populist parties, which despite significant policy differences, share a messaging strategy which calls for a return to an idealized prior era when ‘ordinary’ people – rather than elites – were more central to society.
To date, a number of studies have suggested that discrepancies between present and past circumstances are associated with populism. One line of research has focused on objective measures of declining economic status. For instance, Burgoon et al. (Reference Burgoon, Van Noort, Rooduijn and Underhill2019) find that lower‐income voters are more likely to support far‐right parties when their income growth lags behind other groups in society. Other studies using income inequality as a proxy for economic deprivation find a similar relationship (Ciccolini Reference Ciccolini2021; Nolan &Weisstanner, Reference Nolan and Weisstanner2022). Kurer and van Staalduinen (Reference Kurer and Van Staalduinen2022) demonstrate that the findings hold when economic deprivation is viewed generationally rather than in cross‐sectional terms, showing that voters in Germany whose educational and occupational situation compares unfavourably to their parents are more likely to support populist parties.
Although objective measures of economic deprivation are positively associated with populist voting, voters’ subjective attitudes are arguably more proximate to their choices in the voting booth. As a result, many studies have focused on directly measuring citizen's perceptions of downward mobility. For instance, a subjective sense of economic backsliding has been correlated with support for far‐right parties in eight European countries (Arvantis, Reference Arvantis2021), while conversely the anticipation of future economic opportunity is associated with reduced support for radical opposition parties (Häusermann et al., Reference Häusermann, Kurer and Zollinger2023).
Measuring subjective attitudes also enables scholars to use a broader lens that encapsulates other dimensions of deprivation beyond labour market position, such as social and political status. Gidron and Hall (Reference Gidron and Hall2017) demonstrate that subjective social status anxiety predicts populist right‐wing support across 15 European countries. They argue that status anxiety is linked to cultural and economic grievances, although data constraints imply that the analysis focuses mostly on demographic indicators. Subsequent research has expanded the study of social status anxiety by leveraging survey measures which assess citizens’ own sense of downward social mobility. For instance, Bolet (Reference Bolet2022) demonstrates that Europeans who perceive their social status to be lower than their parents have increased support for populist parties.
These lines of work suggest a potential link between populism and how individuals evaluate their past and present group status and their support for populist parties. However, a full evaluation of this theory has been constrained by two limitations. First, the majority of studies focus exclusively on a single dimension of deprivation, using proxies available in existing cross‐national survey instruments. However, deprivation can be understood through a variety of different lenses, including economic loss, power loss and a loss of social status (Gest et al., Reference Gest, Reny and Mayer2018). Although these measures may plausibly be correlated, they are conceptually distinct sentiments: someone may feel economically stable but simultaneously outnumbered, socially discomforted or politically disempowered. It thus remains unclear how tightly these different dimensions are correlated in practice, as well as how they manifest in terms of support for different types of populist attitudes and voting behaviour. Second, the majority of studies have focused on support for far‐right parties within a limited subset of countries within Western Europe. We know little about how nostalgic deprivation generalizes across countries, including the degree to which it translates to Eastern Europe. Moreover, existing work does not assess how different dimensions of deprivation are linked to support for far‐left as opposed to far‐right political parties.
Data and methods
In this study, we seek to address both limitations by examining the relationship between individuals’ perceptions of downward mobility and populism. To do so, we fielded original representative surveys across 19 European countries (Austria, Bulgaria, Czech Republic, Denmark, Estonia, France, Germany, Hungary, Italy, Latvia, Lithuania, the Netherlands, Poland, Romania, Slovakia, Slovenia, Spain, Sweden and the United Kingdom) in August 2020. Initial samples of 1,000–1,200 European adults aged 18 and older were contacted in each country, drawing from the IPSOS online panel. All sampled countries had at least one populist party gain seat share within the national legislature in the most recent national election. All surveys were conducted using respondents’ native language. After the final sample was obtained, respondent characteristics were weighted to be representative based on each country's population distribution with respect to gender, age, occupation, region and population density. Prior to creating weights, IPSOS removed responses flagged as violating data quality standards and removed those respondents who are ineligible to vote. The final sample consists of 19,296 respondents.
We draw on two outcomes to assess support for populist political platforms. First, as an attitudinal measure, we assess the degree to which respondents agree with a populist worldview. The survey includes four questions derived from Akkerman et al. (Reference Akkerman, Mudde and Zaslove2014), which probe the degree to which respondents are sceptical of elites, politicians and government institutions (see Supporting Information Appendix for question wording). These responses are aggregated into a cumulative index, and rescaled between 0 and 1. Second, as a behavioural measure, we measure reported vote choice in the most recent national election. Since categorizations of parties are frequently contested, we rely on the European party classification compiled by Rooduijn et al. (Reference Rooduijn, Van Kessel, Froio, Pirro, De Lange, Halikiopoulou, Lewis, Mudde and Taggart2019), who identify parties that separate society into two homogeneous and antagonistic groups, ‘the pure people’ versus ‘the corrupt elite’, and argue that politics should be an expression of people's general will. Our measure of populist party support includes reported voting for far‐left and far‐right parties, as well as centrist populist parties (i.e., the Five Star Movement in Italy, or ANO 2011 in the Czech Republic) that engage in populist rhetoric and tactics.Footnote 3
Going beyond measures available on existing cross‐national surveys, the questionnaire included a battery of questions intended to evaluate different dimensions of nostalgic deprivation. Each set of questions was designed to capture subjective, rather than objective, deprivation and thus asked respondents to compare the current situation they face to the situation in the past. Given that our sample spans Eastern and Western European countries, the questions explicitly ask about conditions in the present as well as 25 years ago (i.e., one generation) to ensure that individuals are not considering a time period prior to the end of communism. Following the method used by Gest et al. (Reference Gest, Reny and Mayer2018), in soliciting respondents’ subjective impressions of the past, we ask about the status of ‘people like you’ so that younger respondents can communicate their intuition in the absence of direct lived experience.Footnote 4 Similarly, we also measure three dimensions of deprivation: social, economic and political power. For social deprivation, respondents were asked to place themselves in a diagram which visualized how ‘central and important you are to your society’. For economic integration, respondents were asked how ‘financially well off are people like you compared to other people’, while for power deprivation they were asked ‘how much power do people like you have’.Footnote 5 For each dimension, the questions about present and past circumstances appeared on the same page in the form of paired sliders with a 0‐to‐10 point scale. This operationalization encouraged respondents to explicitly compare their subjective evaluations of the past and the present when answering the questions. We operationalize the difference between the subjective questions on past and present circumstances as nostalgic deprivation. Lastly, we constructed a composite measure of all three dimensions to capture potential additive effects resulting from interactions between different types of deprivation.
Results
We begin by investigating descriptive characteristics of different types of nostalgic deprivation. In the full sample, the measures are correlated but not interchangeable with one another, with Pearson correlation coefficients of 0.44 (social and economic), 0.45 (social and power) and 0.31 (power and economic).Footnote 6
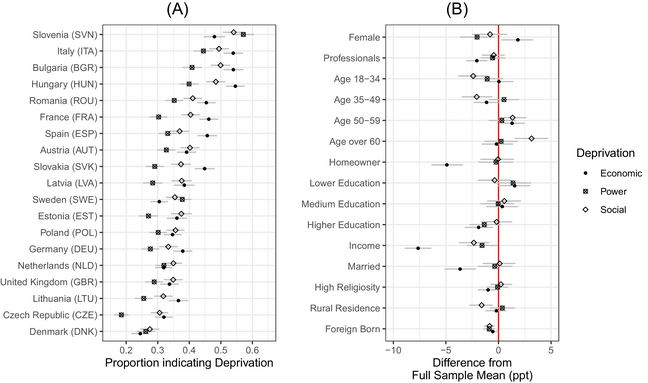
In Figure 1, Panel A, we plot the proportion of respondents expressing economic, power and social deprivation for each country. For interpretability, we rescale each dimension between 0 and 1. We find that a sense of nostalgic deprivation is widespread among European citizens; the lowest rate is in Denmark where approximately a quarter of respondents indicated deprivation, while the highest is in Slovenia, where roughly half of respondents do. Perceived power deprivation is, on average, the least common form of deprivation expressed. The rank order of social and economic deprivation differs across countries; in those with the highest overall levels of deprivation, we find that economic deprivation tends to dominate. In contrast, among those countries with lower deprivation overall, we find that perceived social deprivation is more important. Notably, the countries exhibiting the highest levels of deprivation (Slovenia, Italy, Hungary and Bulgaria) were governed by populists during the survey fielding period. A clear exception to this pattern is Poland, which was governed by the populist right‐wing Law and Justice party, but displays deprivation scores more consistent with its Baltic neighbours.
Nostalgic deprivation across countries and demographic groups
Note: Panel A depicts weighted mean levels of each type of deprivation across each country in the sample with 95 per cent confidence intervals. Panel B shows deviation from sample means across each demographic category, with 95 per cent bootstrapped confidence intervals for deprived groups (75th percentile or higher within each country).

In Panel B we examine the demographic characteristics of those respondents reporting the highest levels of deprivation (75th percentile or higher within each country). Each point indicates how the demographic characteristics of economically, politically or socially deprived individuals, respectively, deviate from the full sample of respondents. For example, we find that those perceiving a sense of power deprivation are more likely to be male, while those perceiving economic deprivation are more likely to be female. We see that socioeconomic indicators like profession, homeownership, education and income are strongly correlated with economic deprivation and to a lesser extent with social deprivation. Social deprivation is notably correlated with age, with older respondents indicating elevated rates, and negatively correlated with living in a rural environment. Finally, power deprivation is not strongly correlated with any demographics except for income and gender.
Although the results shown in Panel B demonstrate that nostalgic deprivation is correlated with socio‐demographic characteristics, the correlation remains relatively weak. In other words, on average, we find that citizens expressing high levels of deprivation are statistically similar to citizens who do not view their situation as pessimistically. This suggests that deprivation may primarily be driven by subjective attitudes which shape how individuals perceive their own standing, rather than anchored in a decline in objective conditions.Footnote 7 This is underscored by the fact that we not only see high levels of nostalgic deprivation in Western Europe, but also in Eastern Europe, where living conditions have improved more substantially over the last 25 years.
To estimate how nostalgic deprivation is related to populist attitudes and voting, we fit a series of models across the pooled sample of 19 countries, with standard errors clustered by country. Since deprivation measures are correlated, we regress attitudinal and behavioural outcomes separately on economic, social and power deprivation.Footnote 8 We also regress outcomes on a composite indicator to account for potential additive effects. In each model, we include country fixed effects to adjust for variation in mean levels of perceived deprivation across national contexts and apply survey weights in all models. We also include two control variables to model temporal dynamics specific to the time period in which the survey is fielded. First, to account for the fact that the survey was administered during the COVID‐19 pandemic, we include a variable measuring the degree to which respondents are concerned about COVID. Our expectation is that concern with COVID will be linked with support for mainstream parties (Wondreys & Mudde, Reference Wondreys and Mudde2022). Second, following our prior hypothesis that the effects will vary as a function of populist political power, we include a dummy variable measuring whether a populist party was currently in government, which we interact with the deprivation measures.
In our main specification, we also include a set of controls associated with objective deprivation and voting, including gender, age, income, education, marital status, occupational class and nativity. By controlling for objective socio‐economic characteristics, the estimates thus focus on variation in subjective deprivation within countries. In the Supporting Information Appendix B, we fit models without these socio‐economic controls. The similar point estimates for deprivation across these models further suggest that variation in nostalgic deprivation within our sample of European citizens is largely sociotropic and orthogonal to individuals’ observed socio‐demographic characteristics.
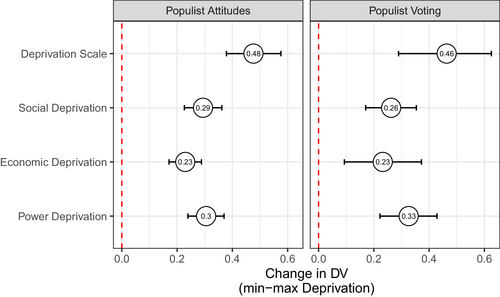
Figure 2 displays the results of the main specification. The plotted points display the effect of moving from the minimum to the maximum deprivation score on the attitudinal and behavioural outcomes, within the pooled sample.Footnote 9 The left‐hand panel demonstrates that a sense of nostalgic deprivation is tightly linked with populist attitudes. Moving from the minimum to the maximum on the deprivation scale is associated with an increase in the average agreement with populist attitudes by 0.48 points, on a 0 to 1 point scale. Moreover, we find that all three dimensions of deprivation predict such attitudes, with point estimates ranging from 0.23 (economic deprivation) to 0.29 and 0.30 (social and power deprivation). This suggests that populist narratives, which generally centre around the negative influence of a globalized elite (Mudde, Reference Mudde2004), effectively unite citizens expressing different dimensions of deprivation.
Nostalgic deprivation, populist attitudes and populist voting
Note: simulated change in predicted values (probabilities) moving each deprivation measure from its observed minimum to maximum, holding all other values at their means and incumbency at 0, with 95 per cent confidence intervals for populist attitudes, estimated via OLS (Panel A) and logit (Panel B) in the pooled dataset. See Supporting Information Appendix Table B1 for all coefficients, Appendix Table B2 presents results without socio‐economic controls.

Relative to populist attitudes, the observed relationship with voting behaviour in national elections exhibits higher variance (right‐hand panel). This is unsurprising given that voting behaviour is plausibly downstream from political attitudes; individuals may agree with populist political platforms yet be reluctant to cast their vote for these parties for strategic reasons. Nevertheless, we find that nostalgic deprivation is strongly associated with voting for a populist party. Moving from the minimum to the maximum on the pooled deprivation scale increases the probability of voting for such a party by 46 percentage points, significant at the 95 per cent level. In Supporting Information Appendix Table B5 and Appendix Figure C2, we show that these results hold when assessing support for populist left‐wing and right‐wing parties separately, with the exception of power deprivation, which is only significant for populist right‐wing parties.Footnote 10
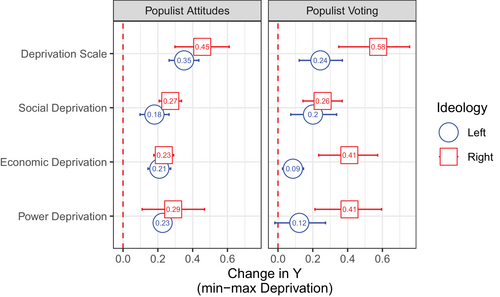
Next, we examine how these relationships differ according to respondents’ ideological self‐placement. At the beginning of the survey, respondents placed themselves on a standard 11‐point ideological scale. We subset the sample to those who identified as left‐ or right‐wing, omitting self‐identified centrists, and then fit the main specification separately on each subsample. Figure 3 displays the results. Overall, we find a remarkably consistent relationship between nostalgic deprivation and populist attitudes when comparing left‐ and right‐wing respondents. However, the relationship is conditional on ideology for the behavioural outcomes. Among right‐wing respondents, all dimensions of nostalgic deprivation predict voting for populist parties. The effect of economic and power deprivation is particularly pronounced; moving from the minimum to the maximum value increases the probability of voting for a populist party by 41 percentage points.
Deprivation, populist attitudes and populist voting across left‐wing and right‐wing respondents.
Note: simulated change in predicted values (probabilities) moving each deprivation measure from its observed minimum to maximum, holding all other values at their means and incumbency at 0, with 95 per cent confidence intervals for populist attitudes, estimated via OLS (Panel A) and logit (Panel B) in the separate models for left‐wing and right‐wing respondents. See Supporting Information Appendix Tables B7 and B8 for all coefficients.

Among left‐wing respondents, however, we find a more limited relationship between perceived deprivation and voting behaviour. The strongest predictor is social deprivation – the sense that one's own social status is eroding. Among left‐wing voters, a shift from minimum to maximum perceived social deprivation increases the probability of voting for a populist party by 20 percentage points. In contrast, power and economic deprivation are comparatively less pivotal in shaping voting among European left‐wing voters, albeit still substantively significant. For instance, we find that economic deprivation is associated with a 9‐percentage point increase in the probability of supporting a populist party.
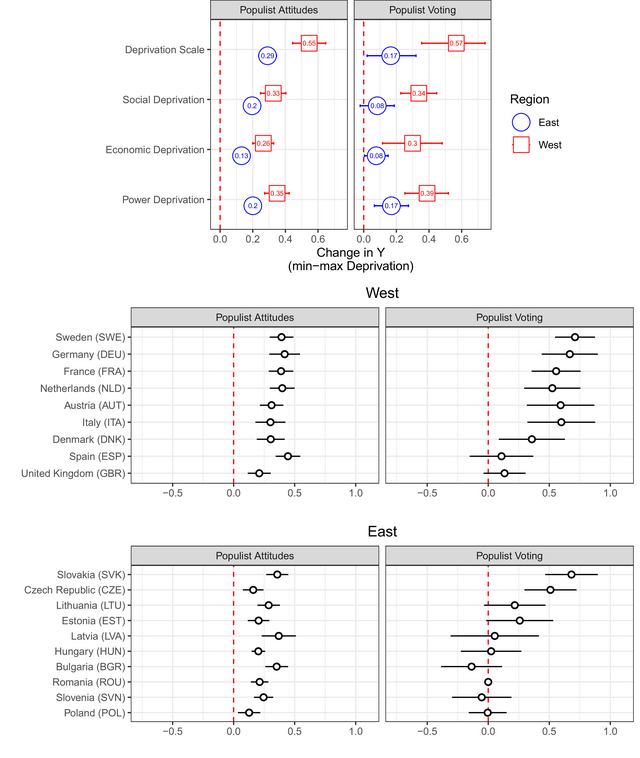
Finally, we assess how the results vary spatially. The upper panel of Figure 4 disaggregates the results by Eastern and Western European countries. The aggregate deprivation measure indicates that a respondent moving from the minimum to the maximum level of nostalgic deprivation would be 55 percentage points more likely to express populist attitudes in Western Europe, and 29 percentage points in Eastern Europe. With respect to voting, the difference between settings is sharper: we estimate that those citizens moving from the minimum to the maximum on the deprivation score would be 57 percentage points more likely to vote for a populist party in Western Europe, and 17 percentage points in Eastern Europe. The weaker results in Eastern Europe for this measure likely reflect the fact that many populist parties in this region were incumbents at the time the survey was fielded (see Appendix).Footnote 11
Deprivation, populist attitudes and populist voting across Europe
Note: Simulated change in predicted values (probabilities) moving each deprivation measure from its observed minimum to maximum, holding all other values at their means and incumbency at 0, with 95% confidence intervals for populist attitudes, estimated via OLS (attitudes) and logit (voting), with separate models for respondents from Eastern and Western Europe. See Supporting Information Appendix Tables B9 and B10 for all coefficients. The bottom two panels display the simulated change in predicted values (probabilities) for the total deprivation measure, separately by country. We do not estimate coefficients for Romania due to the small share of respondents who indicated voting for populist parties. See Supporting Information Appendix Figure C3 for all measures.

To explore this implication further, we examine results for countries separately in the lower half of the figure, using the total deprivation measure.Footnote 12 The results show that the relationship between nostalgic deprivation and populist attitudes replicates across every country in the sample. However, the results for populist voting are more heterogeneous. In the majority of the nine countries that lacked populist incumbents during the survey fielding period (see Table A.1), we find that deprivation predicts populist voting. Conversely, and consistent with our hypothesis that incumbency alters this relationship, within the 10 states that had populists serving in government, the majority display no relationship between deprivation and populist voting. Viewing these results together, we conclude that while nostalgic deprivation has different origins and magnitudes, it has broad generalizability, predicting populist attitudes and voting for populist opposition parties across a variety of contexts.
Discussion
While research has identified backlash to globalization as a precipitating factor for the recent success of populist parties, the far‐right and the far‐left are rarely treated as part of a coherent phenomenon. Scholars studying the populist right have generally focused on a series of demographic and social trends which have eroded the position of formerly dominant demographic groups, leading to fears of reduced social status, or at the extreme, ‘replacement’ by immigrant populations. In contrast, when assessing the motivations of far‐left voters, research has largely focused on economic discontent related to rising inequality, de‐unionization and increasing job insecurity.
This research note demonstrates that while the final choice of political party or policy prescription may differ across far‐left and far‐right citizens, both sets of voters are nevertheless characterized by a subjective sense of nostalgic deprivation. Left‐ and right‐wing voters are each likely to feel that the prospects for ‘people like them’ are declining, and turn to a similar set of anti‐elite populist attitudes in response. Moreover, this pattern is consistent across countries with very different experiences of globalization, deindustrialization and demographic change. It is also broadly similar across people with different types of grievances – whether social, economic or political.
Although we demonstrate that the concept of nostalgic deprivation is generalizable, it is important to note that this analysis does not establish a causal relationship. In other words, the evidence does not allow us to determine whether deprivation leads to increased support for populist political platforms, or whether the decision to identify with a populist platform exacerbates one's perception of deprivation. Indeed, these variables are likely mutually reinforcing. Nevertheless, the fact that the effect on populist attitudes is stronger and more consistent than the effect on populist voting may be suggestive of a process in which such attitudes emerge before the costly step of defecting from a mainstream party and casting a vote for a populist challenger.
The robust correlation between nostalgic deprivation and support for populist platforms across European voters suggests that addressing a single precipitating factor, such as immigration flows or rising inequality, may be insufficient to arrest the rise of populist parties if doing so does not assuage people's sense of declining wealth, status or power. Instead, mainstream parties seeking to blunt the momentum of populist parties may need to address broader perceptions of downward mobility by challenging national myths (Smith, Reference Smith1999), bolstering the dignity (Lamont, Reference Lamont2002) of those who see themselves as marginalized, or reducing the sense of threat (Gest, Reference Gest2022) associated with ascending social groups.
Acknowledgement
This work was possible thanks to a partnership with the International Republican Institute's Europe and Transatlantic Strategy teams. We thank Scott Mastic, Judy Van Rest, Kimber Shearer, Jan Surotchak and Paul McCarthy for their thoughtful leadership and trust, and Thibault Muzergues and Sonja Gloeckle for their invaluable support of our work. As part of this partnership, we also thank Mathieu Gallard, Daniel Kaddik, Jacob Moroza‐Rasmussen, Pavol Holec and Alex Tarascio. We thank participants at CES 2022 for helpful comments. Over the years, our research agenda related to nostalgic deprivation has benefited from generous advice from Matt Barreto, Bart Bonikowski, Anna Boucher, Alexandra Filindra, Rob Ford, Noam Gidron, Terri Givens, Jack Goldstone, Sean Gray, Zoltan Hajnal, Peter Hall, Jennifer Hochschild, Eric Kaufmann, Michele Lamont, Jerry Mayer, Monica McDermott, Kimberly Morgan, John Russo, Dan Rasmussen, Danny Schlozman, Kay Schlozman, David Sears, Paul Sniderman, Jessica Streib, Kris‐Stella Trump, Jennifer Victor and Ariel White. Special thanks to Tim O'Shea for his superb research assistance.
Data Availability Statement
The replication file can be found at the following link: https://doi.org/10.7910/DVN/QNOSNY
Online Appendix
Additional supporting information may be found in the Online Appendix section at the end of the article:


 Open access