


1. Introduction
A central tenant of neoclassical growth theory asserts that the marginal product of capital is high when the capital-labor ratio is low. This led Lucas (Reference Lucas1990) to ask the question: “Why doesn’t capital flow from developed to developing countries?,” the implicit assumption being that developed and developing countries are characterized by high and low capital-labor ratios, respectively. In this paper, we explore one mechanism by which cross-country differences in population growth rates can dominate these capital flows.
The mechanism arises through an exogenous steady decline in the working-age population in one of the countries under study. In every generation, the capital accumulation (savings) of the old age cohorts in the country with a declining population accrues to a significantly smaller generation of workers. The resulting endogenous increase in capital per worker has the consequence of reducing the relative foreign direct investment (FDI) flows into the country experiencing the population decline. We illustrate this mechanism in a simple two country and the “Rest of the World” model that generates closed-form steady-state characterizations which conveniently highlight the relative FDI/GDP consequences for the country with a declining population.Footnote 1 Two institutional assumptions are key to the model’s results:
-
1. Home bias in investment financing: in either country, investment financing needs are first satisfied using domestically generated savings with FDI covering any shortfall. Emerging markets economies are typically characterized by a shortfall of domestic investment capital with FDI serving as a supplement.
-
2. Household savings rates are undiminished by reduced fertility: the requirement that any bequests be distributed over fewer progeny does not diminish aggregate household wealth accumulation. Indeed, the literature identifies an enormous increase in China’s savings rate following the one-child policy implementation.Footnote 2
For the model’s empirical exercise, we exploit a natural policy experiment, the 1982 introduction of the one-child policy in China. We contrast the pattern of FDI flows into China with those of India which had in place a largely unsuccessful two-child policy initiative of its own. Except for labor force growth differences, both countries experienced similar growth in all major macroeconomic aggregates, most critically output and total factor productivity. Due to the one-child policy intervention, the population (and labor force) growth rate of China declined substantially relative to that of India. These collective events are observed simultaneously with a significant decline in relative FDI intensity (FDI/GDP), China versus India, illustrating the proposed mechanism.
Any strong motivation for increased domestic savings together with the indicated demographic intervention has the potential to diminish the relative significance of the mechanism emphasized in this paper and perhaps to overwhelm it. One such motivation is increased life expectancy, while another is a longer retirement period. As we will show, neither of these generalizations reverses our results: the macroeconomic consequences contingent on reduced population growth dominate the consequences of either of the above phenomena. Indeed, even postulating the greatest permanent increase in China’s savings rate for which there is empirical support, the model confirms that the demographic effects we detail have greater consequences for changes in China’s long-run relative FDI/GDP ratio.Footnote 3
As background to our relative FDI/GDP analysis we describe the steady-state evolution of the economy’s consumption, investment, capital stock, and labor supplied. We are also able to detail the equilibrium fraction of the economy’s aggregate capital stock that is domestic versus foreign-owned, and how these various aforementioned quantities are affected by the level of the world rate of interest.
In summary, we argue that population dynamics can play a dominant role in determining cross-country relative FDI/GDP flows and that these effects can dominate the consequences of changes in savings rates, whatever their origin. As with Lucas (Reference Lucas1990), McGrattan and Prescott (Reference McGrattan and Prescott2009, Reference McGrattan and Prescott2010), and Holmes et al. (Reference Holmes, McGrattan and Prescott2015), our analysis relies on a framework using the standard neoclassical production function.Footnote 4
An outline of the paper is as follows. Section 2 documents the relative population dynamics and FDI flows for India and China post China’s implementation of the one-child policy. Section 3 presents a parsimonious neoclassical international investment model, the implications of which are shown to replicate the patterns found in the data. Section 4 concludes.
2. Comparative population policies and macroeconomic dynamics in China and India: data
2.1. Comparative population policies and dynamics
Both China and India initiated public policies to control population growth. India’s two-child policy was voluntary and largely ineffective. In contrast, China’s one-child policy was mandatory and highly effective.
Working-age population dynamics in China and India. The two vertical dashed lines indicate that, until 2030, the assumed working population dynamics are robust to any realistic population growth scenario.

Figure 1 illustrates these exogenous demographic policy interventions. It depicts various population growth scenarios for both countries with confidence intervals obtained through a Bayesian averaging method.Footnote 5
Three key observations follow from Figure 1:
-
1. In China, an absolute decline in the working-age population (aged 15–59) began in 2010 and will continue under all reasonable scenarios. The increase in China’s working-age population for roughly 18 years following the one-child policy implementation reflects the delayed reaction due to schooling and other work preparation activities until at least the age of 16 years.Footnote 6
-
2. With a high degree of confidence, the working-age population of India is projected to continue increasing at least until 2030.
-
3. After 2025, the working-age population of India is projected to exceed that of China under all realistic scenarios.Footnote 7
Figure 1 clearly demonstrates that, in contrast to India, China’s policy intervention was not only effective shortly after implementation, but also that its effects on population dynamics are expected to persist beyond one generation.Footnote 8 The anticipation of these persistent policy effects is crucial for investment decisions because investors are forward-looking and major investments are typically long-lived.
2.2. Comparative macroeconomic performance
Table 1 presents comparative productivity and GDP growth rates. These were similar in China and India before and, significantly, after the exogenous demographic intervention, which allows us plausibly to attribute FDI trend differences between China and India principally to China’s exogenous demographic intervention.Footnote 9
Growth rates of macro aggregates. Annual rates (%)

Both China and India experienced similar rapid real GDP growth in the post-implementation (1982–2014) period (see the two columns under “ $g_{Y}$
” in Table 1).Footnote 10 Note that labor productivity growth,
$g_{Y}$
” in Table 1).Footnote 10 Note that labor productivity growth, $g_{A}$
, was also similar in China and India both in Period 1, and especially, in Period 2 while increasing in both.Footnote 11 Real capital stock grew slightly more rapidly in China in the latter period, while the dramatic labor force growth slowdown in China is clearly evident in the “
$g_{A}$
, was also similar in China and India both in Period 1, and especially, in Period 2 while increasing in both.Footnote 11 Real capital stock grew slightly more rapidly in China in the latter period, while the dramatic labor force growth slowdown in China is clearly evident in the “ $g_{L}$
” column, where
$g_{L}$
” column, where $L$
denotes aggregate hours worked.
$L$
denotes aggregate hours worked.
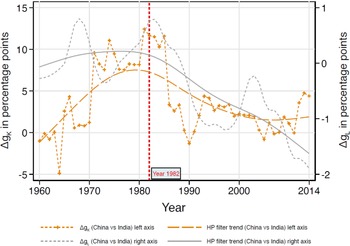
We define $\Delta g_{x,t}=g_{x,C,t}-g_{x,I,t}$
as the growth rate differential between China and India for any variable
$\Delta g_{x,t}=g_{x,C,t}-g_{x,I,t}$
as the growth rate differential between China and India for any variable $x$
. Figure 2 plots
$x$
. Figure 2 plots $\Delta g_{L,t}$
and
$\Delta g_{L,t}$
and $\Delta g_{K,t}$
, prior and post-1982, when the one-child policy was first implemented. Solid lines represent the Hodrick–Prescott filtered series using the smoothing parameter
$\Delta g_{K,t}$
, prior and post-1982, when the one-child policy was first implemented. Solid lines represent the Hodrick–Prescott filtered series using the smoothing parameter $\lambda =6.25$
. Shortly thereafter,
$\lambda =6.25$
. Shortly thereafter, $\Delta g_{L,t}$
assumes negative values which persist (right axis in Figure 2), capturing the long-term impact of the strictly enforced policy directive in China relative to India. A key feature of Figure 2 is the simultaneous reversal of the
$\Delta g_{L,t}$
assumes negative values which persist (right axis in Figure 2), capturing the long-term impact of the strictly enforced policy directive in China relative to India. A key feature of Figure 2 is the simultaneous reversal of the $\Delta g_{L,t}$
and
$\Delta g_{L,t}$
and $\Delta g_{K,t}$
trajectories, implying a causal link between the demographic intervention and the differential capital accumulation dynamics in the two countries post-1982.
$\Delta g_{K,t}$
trajectories, implying a causal link between the demographic intervention and the differential capital accumulation dynamics in the two countries post-1982.
Differential growth rates of capital and labor: China versus India.

As Table 1 indicates, $\Delta g_{A}$
rose from
$\Delta g_{A}$
rose from $-0.48\%$
pre 1982 to
$-0.48\%$
pre 1982 to $0.20\%$
. This increase was, however, not strong enough to compensate for the impact of differential population growth on capital growth:
$0.20\%$
. This increase was, however, not strong enough to compensate for the impact of differential population growth on capital growth: $\Delta g_{K,t}$
, while positive, is in general decline after 1982.
$\Delta g_{K,t}$
, while positive, is in general decline after 1982.
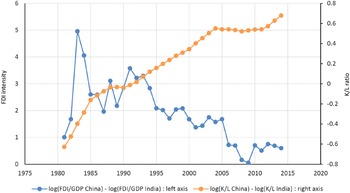
2.3. Comparative K/L and FDI dynamics
Figure 3 presents the post-1982 time path of log((FDI/GDP) $_{\text{China}}$
/(FDI/GDP)
$_{\text{China}}$
/(FDI/GDP) $_{\text{India}}$
) and log((K/L)
$_{\text{India}}$
) and log((K/L) $_{\text{China}}$
/(K/L)
$_{\text{China}}$
/(K/L) $_{\text{India}}$
).Footnote 12 It highlights two insights. First, China’s K/L ratio outpaced India’s following the 1982 policy intervention. Second, during the same period, FDI intensity (FDI as a share of GDP) grew faster in India than in China. In 1990, China’s FDI/GDP ratio was about 30 times larger than that of India, but by 2014, it had declined to less than twice that of India.Footnote 13
$_{\text{India}}$
).Footnote 12 It highlights two insights. First, China’s K/L ratio outpaced India’s following the 1982 policy intervention. Second, during the same period, FDI intensity (FDI as a share of GDP) grew faster in India than in China. In 1990, China’s FDI/GDP ratio was about 30 times larger than that of India, but by 2014, it had declined to less than twice that of India.Footnote 13
In the what follows, we propose a model to explain these empirical observations.
Differential growth rates of FDI/GDP and K/L: China versus India.

3. The Model
3.1. Production
Aggregate period t domestic production in country $i\in \left \{ 1,2\right \}$
is characterized by the production technology,Footnote 14
$i\in \left \{ 1,2\right \}$
is characterized by the production technology,Footnote 14
 \begin{equation} \bar{Y}_{i,t}=Y_{i,t}+Y_{i,t}^{r}\text{,} \end{equation}
where,
 \begin{equation} Y_{i,t}=\left ( K_{i,t}\right ) ^{\alpha _{i}}\left ( \bar{A}_{i,t}L_{i,t}\right ) ^{1-\alpha _{i}},\,\ \, \, \ \alpha _{i}\in \left ( 0,1\right ) \end{equation}
and
 \begin{equation} Y_{i,t}^{r}=\left ( FDI_{i,t}\right ) ^{\alpha _{i}}\left ( \bar{A}_{i,t}L_{i,t}^{r}\right ) ^{1-\alpha _{i}}. \end{equation}
Superscript “ $r$
” denotes capital from the ROW, while the location of production is country
$r$
” denotes capital from the ROW, while the location of production is country $i$
. Specifically,
$i$
. Specifically, $K_{i,t}$
is the period
$K_{i,t}$
is the period $t$
capital of country
$t$
capital of country $i$
invested by domestic firms, while
$i$
invested by domestic firms, while $FDI_{i,t}$
is the accumulated stock of FDI capital invested by ROW firms in country
$FDI_{i,t}$
is the accumulated stock of FDI capital invested by ROW firms in country $i$
.
$i$
. $L_{i,t}$
is the workforce of country
$L_{i,t}$
is the workforce of country $i$
working in firms using capital internally financed by country
$i$
working in firms using capital internally financed by country $i$
, while
$i$
, while $L_{i,t}^{r}$
denotes workers of country
$L_{i,t}^{r}$
denotes workers of country $i$
that work for ROW companies using FDI. Variables with a bar denote country aggregates (see, e.g.,
$i$
that work for ROW companies using FDI. Variables with a bar denote country aggregates (see, e.g., $\bar{Y}_{i,t}$
in equation (1)). The common depreciation rate for capital
$\bar{Y}_{i,t}$
in equation (1)). The common depreciation rate for capital $K_{i,t}$
and
$K_{i,t}$
and $FDI_{i,t}$
is
$FDI_{i,t}$
is $\delta \in \left ( 0,1\right ]$
, for
$\delta \in \left ( 0,1\right ]$
, for $i\in \left \{ 1,2\right \}$
, while
$i\in \left \{ 1,2\right \}$
, while $\bar{A}_{i,t}$
is the period-
$\bar{A}_{i,t}$
is the period- $t$
level of labor productivity, common to both sectors in country
$t$
level of labor productivity, common to both sectors in country $i$
.Footnote 15 In each country
$i$
.Footnote 15 In each country $i$
, we postulate a large number of identical firms operating the technologies described by equations (2) and (3).
$i$
, we postulate a large number of identical firms operating the technologies described by equations (2) and (3).
Based on the assumption of no cross-country labor force mobility, and assuming full employment in each country,
 \begin{equation} \bar{L}_{i,t}=L_{i,t}+L_{i,t}^{r}\text{,} \end{equation}
where $\bar{L}_{i,t}$
is the total workforce (population) in country
$\bar{L}_{i,t}$
is the total workforce (population) in country $i\in \left \{ 1,2\right \}$
. We maintain our assumption that population growth and productivity growth in country
$i\in \left \{ 1,2\right \}$
. We maintain our assumption that population growth and productivity growth in country $i\in \left \{ 1,2\right \}$
are both constant over time, that is,Footnote 16
$i\in \left \{ 1,2\right \}$
are both constant over time, that is,Footnote 16
 \begin{equation} \frac{\bar{L}_{i,t+1}}{\bar{L}_{i,t}}=e^{g_{\bar{L},i}},\,\ \frac{\bar{A}_{i,t+1}}{\bar{A}_{i,t}}=e^{g_{\bar{A},i}} . \end{equation}
Output in country $i\in \left \{ 1,2\right \}$
is given by:Footnote 17
$i\in \left \{ 1,2\right \}$
is given by:Footnote 17
 \begin{equation} \bar{Y}_{i,t}=\bar{K}_{i,t}^{\alpha _{i}}\left ( \bar{A}_{i,t}\bar{L}_{i,t}\right ) ^{1-\alpha _{i}}=\left ( K_{i,t}+FDI_{i,t}\right ) ^{\alpha _{i}}\left ( \bar{A}_{i,t}\bar{L}_{i,t}\right ) ^{1-\alpha _{i}}. \end{equation}
3.2. Efficient factor allocation
Competitive-equilibrium factor inputs $\left ( K_{i,t},FDI_{i,t},L_{i,t},L_{i,t}^{r}\right )$
are efficiently allocated within each country to maximize domestic production. Profit-maximizing firms, located in country
$\left ( K_{i,t},FDI_{i,t},L_{i,t},L_{i,t}^{r}\right )$
are efficiently allocated within each country to maximize domestic production. Profit-maximizing firms, located in country $i\in \left \{ 1,2\right \}$
, domestic or foreign, thus equate marginal products to factor prices. The intra-temporal conditions for the efficient allocation of these factor inputs are,
$i\in \left \{ 1,2\right \}$
, domestic or foreign, thus equate marginal products to factor prices. The intra-temporal conditions for the efficient allocation of these factor inputs are,
 \begin{equation} MPK_{i,t}=MPK_{i,t}^{r} \, \, and\,\ \, \, MPL_{i,t}=MPL_{i,t}^{r}\text{,} \end{equation}
where “MPK” and “MPL” signify the marginal products of capital and labor, respectively.
Let $r^{\ast }$
denote the prevailing world rate of interest and
$r^{\ast }$
denote the prevailing world rate of interest and $w_{t}$
the period
$w_{t}$
the period $t$
wage rate common to both domestic and foreign firms within a country. Equation (6) yields a key implication:Footnote 18
$t$
wage rate common to both domestic and foreign firms within a country. Equation (6) yields a key implication:Footnote 18
 \begin{equation} r^{\ast }+\delta =\frac{\partial \bar{Y}_{i,t}}{\partial \bar{K}_{i,t}}\text{ }\equiv \overline{MPK}_{i,t}=MPK_{i,t}=MPK_{i,t}^{r},\, i\in \left \{ 1,2\right \}. \end{equation}
From equation (6) we obtain,
 \begin{equation} w_{t}=\left ( 1-\alpha \right ) \left ( \frac{\bar{K}_{t}}{\bar{A}_{t}\bar{L}_{t}}\right ) ^{\alpha }\bar{A}_{t}. \end{equation}
From (6) we also obtain,
 \begin{equation} r^{\ast }+\delta =\alpha \left ( \frac{\bar{K}_{t}}{\bar{A}_{t}\bar{L}_{t}}\right ) ^{\alpha -1}\text{,} \end{equation}
which implies,
 \begin{equation} \frac{\bar{K}_{t}}{\bar{A}_{t}\bar{L}_{t}}=\left ( \frac{\alpha }{r^{\ast }+\delta }\right ) ^{\frac{1}{1-\alpha }}. \end{equation}
Combining (11) and (9), we obtain
 \begin{equation} w_{t}=\left ( 1-\alpha \right ) \left ( \frac{\alpha }{r^{\ast }+\delta }\right ) ^{\frac{\alpha }{1-\alpha }}\bar{A}_{t}. \end{equation}
3.3. Households, domestic savings, national capital, and equilibrium
3.3.1. Households
We use a variant of Diamond’s (Reference Diamond1965) overlapping generations model. All agents live for $T$
periods so that at any time period
$T$
periods so that at any time period $t$
, there are
$t$
, there are $T$
representative agents alive, one from each generation. At the end of period
$T$
representative agents alive, one from each generation. At the end of period $T_{R}$
, where
$T_{R}$
, where $0\lt T_{R}\leq T$
, individuals retire and earn no labor income in their retirement periods
$0\lt T_{R}\leq T$
, individuals retire and earn no labor income in their retirement periods $T_{R}+1,T_{R}+2,\ldots,T$
. During their working periods, agents save and accumulate capital from which they consume in retirement. At the close of their lives, agents may leave bequests paid out in period
$T_{R}+1,T_{R}+2,\ldots,T$
. During their working periods, agents save and accumulate capital from which they consume in retirement. At the close of their lives, agents may leave bequests paid out in period $T+1$
which provides them with utility ex ante.
$T+1$
which provides them with utility ex ante.
The following notation applies going forward: $c_{i,b,j}\equiv$
consumption of an agent of country
$c_{i,b,j}\equiv$
consumption of an agent of country $i$
, born in period
$i$
, born in period $b$
in her
$b$
in her $j$
-th period of life;
$j$
-th period of life; $L_{i,t}\equiv$
total labor force in country
$L_{i,t}\equiv$
total labor force in country $i$
, at time period
$i$
, at time period $t$
;
$t$
; $w_{i,t}\equiv$
the period-
$w_{i,t}\equiv$
the period- $t$
competitive wage for country
$t$
competitive wage for country $i$
paid to all agents at work in country
$i$
paid to all agents at work in country $i$
;
$i$
; $a_{i,b,j}\equiv$
wealth of an agent of country
$a_{i,b,j}\equiv$
wealth of an agent of country $i$
, born in period
$i$
, born in period $b$
in her
$b$
in her $j$
-th period of life;
$j$
-th period of life; $r^{\ast }\equiv \,$
the world rate of interest assumed to be constant across all periods.
$r^{\ast }\equiv \,$
the world rate of interest assumed to be constant across all periods.
Let us for the moment suppress the index $i$
, since the structure of both economies is the same except for differences in the assumed labor force growth rates. Agents who work in a period, work for the entire period, that is, we abstract from any labor-leisure trade-off.
$i$
, since the structure of both economies is the same except for differences in the assumed labor force growth rates. Agents who work in a period, work for the entire period, that is, we abstract from any labor-leisure trade-off.
Assuming no bequests, the benchmark problem confronting a representative agent born in period $b$
is as follows:
$b$
is as follows:
 \begin{equation} \underset{\left \{ c_{b,j}\right \} _{j=1}^{T},a_{t,T+1}}{\max }\underset{j=1}{\overset{T}{\sum }}\beta ^{j-1}\frac{c_{b,j}^{1-\frac{1}{\eta }}}{1-\frac{1}{\eta }} \end{equation}
 \begin{equation} \text{s.t.} \,\ \, \, \ a_{b,j+1}=\left ( 1+r^{\ast }\right ) a_{b,j}+w_{b+j-1}-c_{b,j}, \, \, \ j=1,2,\ldots,T\text{.} \end{equation}
 \begin{equation} a_{b,T+1}\geq 0\text{,} \end{equation}
given that,
 \begin{equation} a_{b,1}=0. \end{equation}
Equations (15) and (16) confirm the absence of bequests: agents start with zero wealth and bequeath zero wealth in the last period of their lives (observe that, given (15), $a_{b,T+1}=0$
is a necessary condition for an optimum).
$a_{b,T+1}=0$
is a necessary condition for an optimum).
Proposition 3.3.1. The solution to problem ( 13 )–( 16 ), is given by:
-
a.
(17)where if \begin{equation} c_{b,j}=\left [ \beta \left ( 1+r^{\ast }\right ) \right ] ^{\eta \left ( j-1\right ) }c_{b,1},\,\ \, \,\end{equation}
$\beta \left ( 1+r^{\ast }\right ) \lt 1$
, then
$c_{b,j}\lt c_{b,1}$
and is declining with
$j$
, if
$\beta \left ( 1+r^{\ast }\right ) =1$
, then
$c_{b,j}=c_{b,1}$
, for all
$j$
; while
$c_{b,j}$
increases with
$j$
if
$\beta \left ( 1+r^{\ast }\right ) \gt 1$
.
\begin{equation} c_{b,j}=\left [ \beta \left ( 1+r^{\ast }\right ) \right ] ^{\eta \left ( j-1\right ) }c_{b,1},\,\ \, \,\end{equation}
$\beta \left ( 1+r^{\ast }\right ) \lt 1$
, then
$c_{b,j}\lt c_{b,1}$
and is declining with
$j$
, if
$\beta \left ( 1+r^{\ast }\right ) =1$
, then
$c_{b,j}=c_{b,1}$
, for all
$j$
; while
$c_{b,j}$
increases with
$j$
if
$\beta \left ( 1+r^{\ast }\right ) \gt 1$
.
-
b.
(18)Ceteris paribus, a higher
\begin{equation} c_{b,1}=\frac{\underset{j=1}{\overset{T}{\sum }}\frac{w_{b+j}}{\left ( 1+r^{\ast }\right ) ^{j-1}}}{1+\underset{j=2}{\overset{T}{\sum }}\left [ \beta ^{\eta }\left ( 1+r^{\ast }\right ) \right ] ^{j-1}}. \end{equation}
$r^{\ast }$
reduces
$c_{b,1}$
, but causes the rate of growth of consumption thereafter to increase. Since
(19)
\begin{equation} w_{b+j}=e^{g_{\bar{A}}\left ( j-1\right ) }w_{b}, \, \, j=1,\ldots,T\text{,} \end{equation}
$c_{b,1}$
may be rewritten as,
-
c.
(20)where
\begin{equation} c_{b,1}=\frac{1-\psi }{1-\psi ^{T}}\frac{1-\xi ^{T_{R}}}{1-\xi }\cdot w_{b}\text{,} \end{equation}
$\psi \equiv \beta ^{\eta }\left ( 1+r^{\ast }\right ) ^{\eta -1}$
and
$\xi \equiv e^{g_{\bar{A}}}/\left ( 1+r^{\ast }\right )$
.
-
d. The optimal evolution of wealth for an agent born at time period
$t$
satisfies
(21)
\begin{equation} a_{b,j}=\left \{ \begin{array}{c@{\quad}c} \left ( 1+r^{\ast }\right ) ^{j-2}\frac{1-\xi ^{T_{R}}}{1-\xi }\left ( \frac{1-\xi ^{j-1}}{1-\xi ^{T_{R}}}-\frac{1-\psi ^{j-1}}{1-\psi ^{T}}\right ) w_{b}, & j=1,\ldots,T_{R}+1 \\[5pt] \left ( 1+r^{\ast }\right ) ^{j-2}\frac{1-\xi ^{T_{R}}}{1-\xi }\left ( 1-\frac{1-\psi ^{j-1}}{1-\psi ^{T}}\right ) w_{b}, & j=T_{R}+2,\ldots,T\end{array}\right. .\end{equation}


Proof. See Online Appendix B.
At this juncture several implications can be drawn. They are the subject of the following two corollaries.
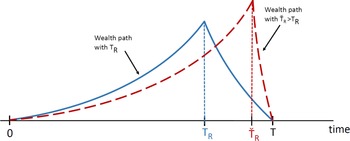
Corollary 3.3.1.
Later retirement (a larger $T_{R}$
) increases consumption in all periods of life, reduces wealth in all periods up to retirement, and increases accumulated wealth after retirement.
$T_{R}$
) increases consumption in all periods of life, reduces wealth in all periods up to retirement, and increases accumulated wealth after retirement.
Proof. The corollary rests on the behavior of $c_{b,1}$
, as
$c_{b,1}$
, as $T_{R}$
increases. Consider expression (20) for
$T_{R}$
increases. Consider expression (20) for $c_{b,1}$
, and notice that the term
$c_{b,1}$
, and notice that the term $\left ( 1-\psi \right )/\left ( 1-\psi ^{T}\right ) \,$
is unambiguously strictly positive for any
$\left ( 1-\psi \right )/\left ( 1-\psi ^{T}\right ) \,$
is unambiguously strictly positive for any $\psi \neq 1$
, and any
$\psi \neq 1$
, and any $\beta,r^{\ast },\eta \gt 0$
. Turning to the term
$\beta,r^{\ast },\eta \gt 0$
. Turning to the term $\left ( 1-\xi ^{T_{R}}\right )/\left ( 1-\xi \right )$
, provided
$\left ( 1-\xi ^{T_{R}}\right )/\left ( 1-\xi \right )$
, provided $\xi \neq 1$
, the derivative of this term with respect to
$\xi \neq 1$
, the derivative of this term with respect to $T_{R}$
is always strictly positive; accordingly, the same is true for
$T_{R}$
is always strictly positive; accordingly, the same is true for $c_{b,1}$
and, by (17), for all
$c_{b,1}$
and, by (17), for all $c_{b,j}$
. Coming to the behavior of wealth before retirement, we first focus on the top branch of the right-hand side of equation (21), which can be expressed as
$c_{b,j}$
. Coming to the behavior of wealth before retirement, we first focus on the top branch of the right-hand side of equation (21), which can be expressed as
 \begin{equation} a_{b,j}=\left ( 1+r^{\ast }\right ) ^{j-2}\left ( \frac{1-\xi ^{j-1}}{1-\xi }-\frac{1-\psi ^{j-1}}{1-\psi ^{T}}\frac{1-\xi ^{T_{R}}}{1-\xi }\right ) w_{b},\quad j=1,\ldots,T_{R}+1\text{.} \end{equation}
Observe that, for $\psi \neq 1$
, the term
$\psi \neq 1$
, the term $\left ( 1-\psi ^{j-1}\right )/\left ( 1-\psi ^{T}\right )$
in (22) is strictly positive, and the term
$\left ( 1-\psi ^{j-1}\right )/\left ( 1-\psi ^{T}\right )$
in (22) is strictly positive, and the term $\left ( 1-\xi ^{T_{R}}\right )/\left ( 1-\xi \right )$
in (22) has a positive first derivative with respect to
$\left ( 1-\xi ^{T_{R}}\right )/\left ( 1-\xi \right )$
in (22) has a positive first derivative with respect to $T_{R}$
as long as
$T_{R}$
as long as $\xi \neq 1$
, proving that
$\xi \neq 1$
, proving that $\partial a_{b,j}/\partial T_{R}\lt 0$
for
$\partial a_{b,j}/\partial T_{R}\lt 0$
for $j=2,\ldots,T_{R}+1$
. Regarding wealth after retirement, we focus on the bottom branch of the right-hand side of equation (21),
$j=2,\ldots,T_{R}+1$
. Regarding wealth after retirement, we focus on the bottom branch of the right-hand side of equation (21),
 \begin{equation} a_{b,j}=\left ( 1+r^{\ast }\right ) ^{j-2}\frac{1-\xi ^{T_{R}}}{1-\xi }\left ( 1-\frac{1-\psi ^{j-1}}{1-\psi ^{T}}\right ) w_{b},\quad j=T_{R}+2,\ldots,T\text{.} \end{equation}
For all $j\lt T$
, the term
$j\lt T$
, the term $1-\left ( 1-\psi ^{j-1}\right )/\left ( 1-\psi ^{T}\right ) \gt 0$
, in (23), and since the term
$1-\left ( 1-\psi ^{j-1}\right )/\left ( 1-\psi ^{T}\right ) \gt 0$
, in (23), and since the term $\left ( 1-\xi ^{T_{R}}\right )/\left ( 1-\xi \right )$
in (23) has a positive first derivative with respect to
$\left ( 1-\xi ^{T_{R}}\right )/\left ( 1-\xi \right )$
in (23) has a positive first derivative with respect to $T_{R}$
as long as
$T_{R}$
as long as $\xi \neq 1$
,
$\xi \neq 1$
, $\partial a_{b,j}/\partial T_{R}\gt 0$
for
$\partial a_{b,j}/\partial T_{R}\gt 0$
for $j=T_{R}+2,\ldots,T$
.
$j=T_{R}+2,\ldots,T$
.
Figure 4 depicts the main message of Corollary 3.3.1 by comparing two wealth paths when the retirement age increases from $T_{R}$
to
$T_{R}$
to $\check{T}_{R}$ $\left ( \check{T}_{R}\gt T_{R}\right )$
.
$\left ( \check{T}_{R}\gt T_{R}\right )$
.
Graphical depiction of Corollary 3.3.1: comparison between two wealth paths when the retirement age increases $(\check{T}_{R}\gt T_{R})$
.
$(\check{T}_{R}\gt T_{R})$
.

Corollary 3.3.2 examines the effects of a longer lifespan.
Corollary 3.3.2.
For a fixed $T_{R}$
, a longer lifespan
$T_{R}$
, a longer lifespan $T$
reduces consumption and increases wealth in all periods of life .
$T$
reduces consumption and increases wealth in all periods of life .
Proof. Once again the focus is on expression (20). For $\xi \neq 1$
, the term
$\xi \neq 1$
, the term $\left ( 1-\xi ^{T_{R}}\right )/\left ( 1-\xi \right )$
is strictly positive, and the term
$\left ( 1-\xi ^{T_{R}}\right )/\left ( 1-\xi \right )$
is strictly positive, and the term $\left ( 1-\psi \right )/\left ( 1-\psi ^{T}\right )$
depends negatively on
$\left ( 1-\psi \right )/\left ( 1-\psi ^{T}\right )$
depends negatively on $T$
for all
$T$
for all $\psi \neq 1$
. Therefore,
$\psi \neq 1$
. Therefore, $\partial c_{b,1}/\partial T\lt 0$
and, by (17), for all
$\partial c_{b,1}/\partial T\lt 0$
and, by (17), for all $c_{b,j}$
,
$c_{b,j}$
, $j=1,\ldots,T$
. Similarly, from (21), we can see that both branches of its right-hand side depend positively on
$j=1,\ldots,T$
. Similarly, from (21), we can see that both branches of its right-hand side depend positively on $T$
. To see this, observe that in both (22) and (23), the term
$T$
. To see this, observe that in both (22) and (23), the term $\left ( 1-\xi ^{T_{R}}\right )/\left ( 1-\xi \right )$
is strictly positive for
$\left ( 1-\xi ^{T_{R}}\right )/\left ( 1-\xi \right )$
is strictly positive for $\xi \neq 1$
, while the term
$\xi \neq 1$
, while the term $\left ( 1-\psi \right )/\left ( 1-\psi ^{T}\right )$
depends negatively on
$\left ( 1-\psi \right )/\left ( 1-\psi ^{T}\right )$
depends negatively on $T$
for all
$T$
for all $\psi \neq 1$
, establishing that
$\psi \neq 1$
, establishing that $\partial a_{b,j}/\partial T\gt 0$
for
$\partial a_{b,j}/\partial T\gt 0$
for $j=2,\ldots,T$
.
$j=2,\ldots,T$
.
3.4. Aggregate relationships
Let us now return to identifying quantities by the relevant country $i$
. Since each cohort (generation) lives for
$i$
. Since each cohort (generation) lives for $T$
periods, there are
$T$
periods, there are $T\,$
distinct cohorts alive at any time
$T\,$
distinct cohorts alive at any time $t$
. It follows that aggregate consumption at time
$t$
. It follows that aggregate consumption at time $t$
for country
$t$
for country $i$
satisfies:
$i$
satisfies:
 \begin{equation} C_{i,t}=\underset{j=0}{\overset{T-1}{\sum }}c_{i,t-j,j+1}L_{i,t-j,j+1}\text{ } \end{equation}
Identity (24) simply states that time $t$
aggregate consumption in country
$t$
aggregate consumption in country $i$
is the sum of the consumption of each generation then alive – from the generation just born (
$i$
is the sum of the consumption of each generation then alive – from the generation just born ( $j=0$
) to the generation born
$j=0$
) to the generation born $T-1$
periods ago and in its final year of life. Since the only asset in the economy by which workers in country
$T-1$
periods ago and in its final year of life. Since the only asset in the economy by which workers in country $i$
may accumulate wealth is capital stock accumulation, private wealth aggregated across all living generations and the aggregate capital stock must coincide. This is the substance of identity (25)
$i$
may accumulate wealth is capital stock accumulation, private wealth aggregated across all living generations and the aggregate capital stock must coincide. This is the substance of identity (25)
 \begin{equation} K_{i,t}=\underset{j=0}{\overset{T-1}{\sum }}a_{i,t-j,j+1}L_{i,t-j,j+1}\text{,} \end{equation}
where $K_{i,t}$
is country
$K_{i,t}$
is country $i$
’s aggregate domestic capital.
$i$
’s aggregate domestic capital.
In order to calculate aggregate domestic savings, we first consider the household budget constraint given by (14). By re-arranging (14) we obtain,
 \begin{equation} a_{i,t,j+1}-a_{i,t,j}=r^{\ast }a_{i,t,j}+w_{i,t+j-1}-c_{i,t,j}, \, \, \ j=1,2,\ldots,T\ \text{.} \end{equation}
Household savings of generation $t$
in period
$t$
in period $j\in \left \{ 1,\ldots,T\right \}$
, denoted by
$j\in \left \{ 1,\ldots,T\right \}$
, denoted by $s_{i.t,j}$
, is thus defined by,
$s_{i.t,j}$
, is thus defined by,
 \begin{equation} s_{i,t,j}=a_{i,t,j+1}-\left ( 1-\delta \right ) a_{i,t,j}=\left ( r^{\ast }+\delta \right ) a_{i,t,j}+w_{i,t+j-1}-c_{i,t,j}, \, \, \ j=1,2,\ldots,T\ \text{.} \end{equation}
Aggregate domestic savings is thus given by:
 \begin{equation} S_{i,t}=\underset{j=0}{\overset{T-1}{\sum }}s_{i,t-j,j+1}L_{i,t-j,j+1}. \end{equation}
Summing up across cohorts in equation (27), and using the definitions given by (24), (25), and (28), we obtain,
 \begin{equation} S_{i,t}-\delta K_{i,t}=K_{i,t+1}-K_{i,t}=r^{\ast }K_{i,t}+w_{i,t}\bar{L}_{i,t}-C_{i,t}. \end{equation}
Notice that in obtaining equation (29) we have used the fact that, in equilibrium, every cohort both starts and ends its life with zero wealth. Moreover (29) emphasizes that households in country $i$
receive labor income from working in both the domestic production sector that produces aggregate income
$i$
receive labor income from working in both the domestic production sector that produces aggregate income $Y_{i,t}$
, and in the FDI sector that produces aggregate income,
$Y_{i,t}$
, and in the FDI sector that produces aggregate income, $Y_{i,t}^{r}$
, with
$Y_{i,t}^{r}$
, with $\bar{Y}_{i,t}=Y_{i,t}+Y_{i,t}^{r}$
. From equation (6) and (8), we know that,
$\bar{Y}_{i,t}=Y_{i,t}+Y_{i,t}^{r}$
. From equation (6) and (8), we know that,
 \begin{equation} \bar{Y}_{i,t}=\left ( K_{i,t}+FDI_{i,t}\right ) \left ( r^{\ast }+\delta \right ) +w_{i,t}\bar{L}_{i,t}. \end{equation}
Combining (30) and (29), we find,
 \begin{equation} S_{i,t}=\bar{Y}_{i,t}-FDI_{i,t}\left ( r^{\ast }+\delta \right ) -C_{i,t}\text{ }=I_{i,t}\text{,} \end{equation}
where $I_{i,t}$
is domestic aggregate investment. Finally, from (29) we can see that,
$I_{i,t}$
is domestic aggregate investment. Finally, from (29) we can see that,
 \begin{equation} K_{i,t+1}=S_{i,t}+\left ( 1-\delta \right ) K_{i,t}\text{,} \end{equation}
while (31) and (32) reconfirm the aggregate-domestic-capital-accumulation identity:
 \begin{equation} K_{i,t+1}=I_{i,t}+\left ( 1-\delta \right ) K_{i,t}. \end{equation}
We next consider time-invariant relationships that will ultimately allow us to identify $S_{i,t}/\bar{Y}_{i,t}$
,
$S_{i,t}/\bar{Y}_{i,t}$
, $FDI_{i,t}/\bar{Y}_{i,t}$
, and
$FDI_{i,t}/\bar{Y}_{i,t}$
, and $FDI_{i,t}/S_{i,t}$
along the economy’s steady-state growth path. This is accomplished by the Proposition 3.4.1.
$FDI_{i,t}/S_{i,t}$
along the economy’s steady-state growth path. This is accomplished by the Proposition 3.4.1.
Proposition 3.4.1.
In a steady state, when the population growth rate, $g_{\bar{L}}$
, is constant, the FDI/GDP ratio of country
$g_{\bar{L}}$
, is constant, the FDI/GDP ratio of country $i$
in period
$i$
in period $t$
is given by:
$t$
is given by:
 \begin{equation} \frac{FDI_{i,t}}{\bar{Y}_{i,t}}=\frac{\alpha }{r^{\ast }+\delta }-\nu \text{,} \end{equation}
where
 $\psi =\beta ^{\eta }\left ( 1+r^{\ast }\right ) ^{\eta -1}$
,
$\psi =\beta ^{\eta }\left ( 1+r^{\ast }\right ) ^{\eta -1}$
, $\xi =e^{g_{\bar{A}}}\left ( 1+r^{\ast }\right )$
, and
$\xi =e^{g_{\bar{A}}}\left ( 1+r^{\ast }\right )$
, and
 \begin{equation} \chi \equiv \frac{1+r^{\ast }}{e^{g_{\bar{A}}+g_{\bar{L}}}}. \end{equation}
The savings to GDP ratio of country $i$
in period
$i$
in period $t$
is given by:
$t$
is given by:
 \begin{equation} \frac{S_{i,t}}{\bar{Y}_{i,t}}=\left ( e^{g_{\bar{A}}+g_{\bar{L}}}-1+\delta \right ) \nu . \end{equation}
Proof. See Online Appendix C.
Based on Proposition 3.4.1, Corollary 3.4.1 specifies the determinants of the relationship between FDI and the stock of aggregate domestic capital, that is, the ratio $FDI_{t}/K_{t}$
.
$FDI_{t}/K_{t}$
.
Corollary 3.4.1. The ratio between FDI and the domestic stock of capital is given by:
 \begin{equation} \frac{FDI_{t}}{K_{t}}=\frac{\alpha }{\nu \left ( r^{\ast }+\delta \right ) }-1. \end{equation}
Proof. From equation (6), $r^{\ast }+\delta =\alpha \bar{Y}_{t}/\bar{K}_{t}$
, which implies
$r^{\ast }+\delta =\alpha \bar{Y}_{t}/\bar{K}_{t}$
, which implies
 \begin{equation} \frac{\bar{K}_{t}}{\bar{Y}_{t}}=\frac{\alpha }{r^{\ast }+\delta }. \end{equation}
Given that $\bar{K}_{t}=FDI_{t}+K_{t}$
, equation (39) becomes,
$\bar{K}_{t}=FDI_{t}+K_{t}$
, equation (39) becomes,
 \begin{equation} \frac{FDI_{t}}{\bar{Y}_{t}}+\frac{K_{t}}{\bar{Y}_{t}}=\frac{\alpha }{r^{\ast }+\delta }. \end{equation}
Equations (34) and (40) imply,
 \begin{equation} \frac{K_{t}}{\bar{Y}_{t}}=\nu . \end{equation}
Since $FDI_{t}/K_{t}=\left ( FDI_{t}/\bar{Y}_{t}\right )/\left ( K_{t}/\bar{Y}_{t}\right )$
, using (41) and (34), we prove equation (38).
$FDI_{t}/K_{t}=\left ( FDI_{t}/\bar{Y}_{t}\right )/\left ( K_{t}/\bar{Y}_{t}\right )$
, using (41) and (34), we prove equation (38).
3.5. Dependence of the steady-state FDI/GDP ratio on population growth rate and interest rate
Proposition 3.5.1 examines how a decrease in the population growth rate, $g_{\bar{L}}$
, that is, an exogenous demographic intervention such as the one-child policy, will affect the FDI/GDP ratio. This question is central to this paper, since we claim that the one-child policy in China substantially contributed to a decrease in its FDI/GDP ratio, relative to India. Proposition 3.5.1 focuses on examining cases in which the calibrating parameters have values that reflect empirical observations. Specifically, we focus on cases where households accumulate positive wealth until retirement and then gradually deplete it, that is, cases where average household savings are always positive, as empirically observed.
$g_{\bar{L}}$
, that is, an exogenous demographic intervention such as the one-child policy, will affect the FDI/GDP ratio. This question is central to this paper, since we claim that the one-child policy in China substantially contributed to a decrease in its FDI/GDP ratio, relative to India. Proposition 3.5.1 focuses on examining cases in which the calibrating parameters have values that reflect empirical observations. Specifically, we focus on cases where households accumulate positive wealth until retirement and then gradually deplete it, that is, cases where average household savings are always positive, as empirically observed.
Proposition 3.5.1.
If $r^{\ast }$
,
$r^{\ast }$
, $g_{\bar{A}}$
,
$g_{\bar{A}}$
, $g_{\bar{L}}$
,
$g_{\bar{L}}$
, $\beta$
,
$\beta$
, $\eta$
, are such that
$\eta$
, are such that $\phi \left ( j\right ) \gt 0$
,
$\phi \left ( j\right ) \gt 0$
, $j\geq 1$
, where,
$j\geq 1$
, where,
 \begin{equation} \phi \left ( j\right ) \equiv \left \{ \begin{array}{c} \frac{1-\xi ^{j}}{1-\xi ^{T_{R}}}-\frac{1-\psi ^{j}}{1-\psi ^{T}} \\ 1-\frac{1-\psi ^{j}}{1-\psi ^{T}}\end{array}\right . \left . \begin{array}{c}, \\,\end{array}\right . \left . \begin{array}{l} j=0,\ldots,T_{R} \\ j=T_{R}+1,\ldots,T-1\end{array}\right . \text{,} \end{equation}
and if $T=2$
, that is, if there are only two overlapping generations, then a decrease in the population growth rate,
$T=2$
, that is, if there are only two overlapping generations, then a decrease in the population growth rate, $g_{\bar{L}}$
, leads to a lower FDI/GDP ratio, for any initial value
$g_{\bar{L}}$
, leads to a lower FDI/GDP ratio, for any initial value $g_{\bar{L}}\neq 0$
. For
$g_{\bar{L}}\neq 0$
. For $T\gt 2$
, as long as
$T\gt 2$
, as long as $\phi \left ( j\right ) \gt 0$
,
$\phi \left ( j\right ) \gt 0$
, $j\geq 1$
,
$j\geq 1$
,
 \begin{equation} \frac{\partial \left ( \frac{FDI_{t}}{\bar{Y}_{t}}\right ) }{\partial g_{\bar{L}}}\gt 0\Leftrightarrow \left ( \frac{1}{e^{g_{\bar{L}}}-1}-\frac{T}{e^{g_{\bar{L}}T}-1}\right ) \frac{\underset{j=0}{\overset{T-1}{\sum }}\chi ^{j}\phi \left ( j\right ) }{\underset{j=0}{\overset{T-1}{\sum }}j\chi ^{j}\phi \left ( j\right ) }\lt 1. \end{equation}
Proof. See Online Appendix D.
The general analytical result conveyed by Proposition 3.5.1, serves as a guide for all calibration exercises that follow. Proposition 3.5.2 shows the dependence of the FDI/GDP ratio on the world interest rate, $r^{\ast }$
.
$r^{\ast }$
.
Proposition 3.5.2.
For characterizing the dependence of the FDI/GDP ratio on the world interest rate, $r^{\ast }$
, parameters
$r^{\ast }$
, parameters $\alpha$
,
$\alpha$
, $\delta$
,
$\delta$
, $\eta$
,
$\eta$
, $\beta$
,
$\beta$
, $g_{\bar{L}}$
,
$g_{\bar{L}}$
, $g_{\bar{A}}$
,
$g_{\bar{A}}$
, $T$
,
$T$
, $T_{R}$
, and
$T_{R}$
, and $r^{\ast }$
must be guided by,
$r^{\ast }$
must be guided by,
 \begin{equation} \frac{\partial \left ( \frac{FDI_{t}}{\bar{Y}_{t}}\right ) }{\partial r^{\ast }}\lt 0\Leftrightarrow \frac{\alpha }{\left ( r^{\ast }+\delta \right ) ^{2}}+\nu \cdot \left [ \frac{1}{1+r^{\ast }}\left ( \frac{T_{R}\xi ^{T_{R}}}{1-\xi ^{T_{R}}}-\frac{T\xi ^{T}}{1-\xi ^{T}}-1\right ) +\frac{m^{\prime }\left ( r^{\ast }\right ) }{m\left ( r^{\ast }\right ) }\right ] \gt 0\text{,} \end{equation}
where,

Proof. See Online Appendix D.
Holston et al. (Reference Holston, Laubach and Williams2017) estimate $r^{\ast }$
, reporting that, in the past few decades,
$r^{\ast }$
, reporting that, in the past few decades, $r^{\ast }$
has decreased substantially in different major economic regions of the world, suggesting that there are global factors behind this decline. Proposition 3.5.2 offers verifiable parameter conditions dictating how the FDI/GDP could be affected by such a decrease in
$r^{\ast }$
has decreased substantially in different major economic regions of the world, suggesting that there are global factors behind this decline. Proposition 3.5.2 offers verifiable parameter conditions dictating how the FDI/GDP could be affected by such a decrease in $r^{\ast }$
. In all our calibration exercises outlined below, we have robustly found a negative dependence, that is,
$r^{\ast }$
. In all our calibration exercises outlined below, we have robustly found a negative dependence, that is, $\partial \left ( FDI_{t}/\bar{Y}_{t}\right )/\partial r^{\ast }\lt 0$
.Footnote 19 According to the present model, this negative dependence implies that the recent decline in
$\partial \left ( FDI_{t}/\bar{Y}_{t}\right )/\partial r^{\ast }\lt 0$
.Footnote 19 According to the present model, this negative dependence implies that the recent decline in $r^{\ast }$
should be pushing the FDI/GDP ratio upward. Such an effect may be common to both China and India, but, based on Proposition 3.5.1, it tends toward the opposite direction to the demographic effect of the one-child policy in China for the same calibrating parameters.Footnote 20
$r^{\ast }$
should be pushing the FDI/GDP ratio upward. Such an effect may be common to both China and India, but, based on Proposition 3.5.1, it tends toward the opposite direction to the demographic effect of the one-child policy in China for the same calibrating parameters.Footnote 20
3.6. A Permanent Exogenous Demographic Intervention: Transition Dynamics
The one-child policy in China represents a long-term exogenous demographic intervention. To approximate the conditions implied by China’s one-child policy, we next examine the consequences of a permanent exogenous change in the population growth rate. Specifically, assume that in some period $\hat{t}\gt 0$
, a permanent change from population growth rate
$\hat{t}\gt 0$
, a permanent change from population growth rate $g_{L,1}$
(for all
$g_{L,1}$
(for all $t\in \left \{ 0,1,\ldots,\hat{t}\right \}$
) to population growth rate
$t\in \left \{ 0,1,\ldots,\hat{t}\right \}$
) to population growth rate $g_{L,2}$
(for all
$g_{L,2}$
(for all $t\in \left \{ \hat{t}+1,\hat{t}+2,\ldots \right \}$
) occurs as an unforeseen event. All cohorts that are alive in period
$t\in \left \{ \hat{t}+1,\hat{t}+2,\ldots \right \}$
) occurs as an unforeseen event. All cohorts that are alive in period $\hat{t}$
, must accordingly adapt their savings plans from period
$\hat{t}$
, must accordingly adapt their savings plans from period $\hat{t}$
and on.
$\hat{t}$
and on.
In order to see the impact of this permanent change in $g_{L}\,$
on the FDI/GDP ratio, our principal quantity of interest, we return to equation (40), an aggregate relationship that holds no matter if the economy is in a steady state or in a transition between steady states:
$g_{L}\,$
on the FDI/GDP ratio, our principal quantity of interest, we return to equation (40), an aggregate relationship that holds no matter if the economy is in a steady state or in a transition between steady states:
 \begin{equation} \frac{FDI_{t}}{\bar{Y}_{t}}=\frac{\alpha }{r^{\ast }+\delta }-\frac{K_{t}}{\bar{Y}_{t}}. \end{equation}
By equation (46), in order to understand the dynamics of the FDI/GDP ratio, it suffices to analyze the dynamics of $K_{t}/\bar{Y}_{t}$
. More specifically, equations (11) and (6) imply,
$K_{t}/\bar{Y}_{t}$
. More specifically, equations (11) and (6) imply,
 \begin{equation} \bar{Y}_{t}=\left ( \frac{\alpha }{r^{\ast }+\delta }\right ) ^{\frac{\alpha }{1-\alpha }}\bar{A}_{t}\bar{L}_{t}. \end{equation}
Inserting (46) into (47) gives,
 \begin{equation} \frac{FDI_{t}}{\bar{Y}_{t}}=\frac{\alpha }{r^{\ast }+\delta }-\left ( \frac{\alpha }{r^{\ast }+\delta }\right ) ^{-\frac{\alpha }{1-\alpha }}\frac{K_{t}}{\bar{A}_{t}\bar{L}_{t}}. \end{equation}
In (48), the only variables that are affected by the change in $g_{L}$
are
$g_{L}$
are $K_{t}$
and
$K_{t}$
and $\bar{L}_{t}$
. The impact of the change in
$\bar{L}_{t}$
. The impact of the change in $g_{L}$
on
$g_{L}$
on $\bar{L}_{t}$
is direct. The impact of the change in
$\bar{L}_{t}$
is direct. The impact of the change in $g_{L}$
on
$g_{L}$
on $K_{t}$
is based on equation (25) and requires an understanding of how the change in
$K_{t}$
is based on equation (25) and requires an understanding of how the change in $g_{L}$
affects individual savings.
$g_{L}$
affects individual savings.
According to equations (21) and (42),
 \begin{equation} a_{t-j,j+1}=\left ( 1+r^{\ast }\right ) ^{j-1}\frac{1-\xi ^{T_{R}}}{1-\xi }\phi \left ( j\right ) w_{t-j}. \end{equation}
Note that “ $b$
” has been replaced by “
$b$
” has been replaced by “ $t-j$
”. Since
$t-j$
”. Since $\xi$
and
$\xi$
and $\psi$
do not depend on
$\psi$
do not depend on $g_{L}$
, the only impact of the change in
$g_{L}$
, the only impact of the change in $g_{L}$
on the individual savings plan of agents could come from changes in the wage rate,
$g_{L}$
on the individual savings plan of agents could come from changes in the wage rate, $w_{t}$
. Nevertheless, equation (12) implies that even
$w_{t}$
. Nevertheless, equation (12) implies that even $w_{t}$
is not affected by the change in
$w_{t}$
is not affected by the change in $g_{L}$
. This may seem counterintuitive for a closed-economy model. Nevertheless, in the present model the abundance of international capital keeps both interest rates and wage rates unaffected by demographic changes. Yet, aggregate domestic capital,
$g_{L}$
. This may seem counterintuitive for a closed-economy model. Nevertheless, in the present model the abundance of international capital keeps both interest rates and wage rates unaffected by demographic changes. Yet, aggregate domestic capital, $K_{t}$
, will be affected by the savings contributions of each demographic cohort, as equation (25) implies. In what follows, we focus on characterizing analytically the impact of the demographic change on
$K_{t}$
, will be affected by the savings contributions of each demographic cohort, as equation (25) implies. In what follows, we focus on characterizing analytically the impact of the demographic change on $K_{t}$
and
$K_{t}$
and $\bar{L}_{t}$
, in order to understand the impact of the exogenous demographic intervention on the FDI/GDP ratio through equation (48). Proposition 3.6.1 summarizes our analytical characterization.
$\bar{L}_{t}$
, in order to understand the impact of the exogenous demographic intervention on the FDI/GDP ratio through equation (48). Proposition 3.6.1 summarizes our analytical characterization.
Proposition 3.6.1.
The FDI/GDP ratio transition dynamics after $\hat{t}$
are given by:
$\hat{t}$
are given by:
 \begin{equation} \frac{FDI_{\hat{t}+\ell }}{\bar{Y}_{\hat{t}+\ell }}=\frac{\alpha }{r^{\ast }+\delta }-\frac{1-\alpha }{1+r^{\ast }}\frac{1-\xi ^{T_{R}}}{1-\xi }\lambda \left ( \ell \right ) \underset{j=0}{\overset{T-1}{\sum }}\xi ^{-j}\Lambda \left ( j,\ell \right ) \phi \left ( j\right ) \text{,} \end{equation}
where,
 \begin{equation} \Lambda \left ( j,\ell \right ) \equiv \left \{ \begin{array}{c} e^{-\left ( g_{L,2}-g_{L,1}\right ) \ell -(g_{L,1})j} \\ e^{-(g_{L,2})j}\end{array}\right . \left . \begin{array}{c}, \\,\end{array}\right . \left . \begin{array}{c} j\geq \ell \\ j\lt \ell \end{array}\right . \text{,} \end{equation}
 \begin{equation} \lambda \left ( \ell \right ) =\left [ \frac{1-e^{-(g_{L,2})\ell }}{1-e^{-g_{L,2}}}+e^{-g_{L,2}\ell }\frac{1-e^{-g_{L,1}\left ( T-\ell \right ) }}{1-e^{-g_{L,1}}}\right ] ^{-1}\text{,} \end{equation}
and $\phi \left ( j\right )$
is given by equation (
42
), for all
$\phi \left ( j\right )$
is given by equation (
42
), for all $\ell \in \left \{ 1,\ldots,T\right \}$
.
$\ell \in \left \{ 1,\ldots,T\right \}$
.
Proof. See Online Appendix E.
In Proposition 3.6.1, it is notable that, after setting $\ell =0$
, and
$\ell =0$
, and $\ell =T$
in (50), the FDI/GDP ratio is equal to its steady-state value given by equation (34) of Proposition 3.5.1. Specifically, after setting
$\ell =T$
in (50), the FDI/GDP ratio is equal to its steady-state value given by equation (34) of Proposition 3.5.1. Specifically, after setting $\ell =0$
in (50), one steady-state FDI/GDP ratio corresponds to population growth rate
$\ell =0$
in (50), one steady-state FDI/GDP ratio corresponds to population growth rate $g_{\bar{L}}=g_{L,1}$
in equation (34), while setting
$g_{\bar{L}}=g_{L,1}$
in equation (34), while setting $\ell =T$
in (50), another steady-state FDI/GDP ratio corresponds to population growth rate
$\ell =T$
in (50), another steady-state FDI/GDP ratio corresponds to population growth rate $g_{\bar{L}}=g_{L,2}$
. We numerically study this transition in the following section.
$g_{\bar{L}}=g_{L,2}$
. We numerically study this transition in the following section.
3.7. Calibration and simulations
While both China and India experienced major development transitions after 1982, we assume that these two countries underwent similar structural transformations, except one: the exogenous demographic intervention was effective only in China. Within the context of the present model we therefore argue that demographics alone are able to explain the different FDI/GDP ratio dynamics in the two countries.
We focus on explaining the ratio of the FDI/GDP ratios between China and India in the data.Footnote 21 We further assume that India is in a demographic steady state, with a constant FDI/GDP ratio, with China following a demographic transition solely driven by its one-child policy. The main simulation question we tackle is: can the introduction of the one-child policy alone explain the behavior of the relative FDI/GDP ratios of China and India found in the data?
There is, however, a timing issue regarding the period in which our model mechanics may reasonably be applied to the data: before 1995, both China and India had FDI restrictions; prior to 1995, FDI/GDP ratios in both China and India are, typically, below $1\%$
, with India’s FDI/GDP ratio being around
$1\%$
, with India’s FDI/GDP ratio being around $0.02\%$
. With the theory of this paper based on competitive markets, we therefore fit the model to post-1995 available data. Specifically, in our calibration, we start the transition in year 1985, but we focus on matching the transition path with respect to data only for the period 1995–2015, the period of free FDI markets without capital controls. Nevertheless, the domestic economy in year 1985 was not as controlled as were external capital flows. Therefore, in the rest of this section we match the savings rates in year 1985, but still focus on matching the FDI/GDP ratio from 1995 and on.
$0.02\%$
. With the theory of this paper based on competitive markets, we therefore fit the model to post-1995 available data. Specifically, in our calibration, we start the transition in year 1985, but we focus on matching the transition path with respect to data only for the period 1995–2015, the period of free FDI markets without capital controls. Nevertheless, the domestic economy in year 1985 was not as controlled as were external capital flows. Therefore, in the rest of this section we match the savings rates in year 1985, but still focus on matching the FDI/GDP ratio from 1995 and on.
A second purely technical issue remains. For both China and India, the FDI/GDP ratios are very small ( $0.46\%$
for China and an even smaller value of
$0.46\%$
for China and an even smaller value of $0.017\%$
for India). Starting with such small values, the model-induced transition dynamics quickly pushes the generated absolute FDI/GDP value for both China and India into negative territory. Accordingly, these initial conditions force the transition dynamics trajectory to be sensitive to the chosen calibrated parameters and initial states.
$0.017\%$
for India). Starting with such small values, the model-induced transition dynamics quickly pushes the generated absolute FDI/GDP value for both China and India into negative territory. Accordingly, these initial conditions force the transition dynamics trajectory to be sensitive to the chosen calibrated parameters and initial states.
In order to address this calibration-sensitivity problem, our numerical strategy is to:
-
1. Employ larger starting values of the FDI/GDP ratio for both China and India. Year 1995 fits this requirement (1990’s values being, again, very small); in 1995 China’s FDI/GDP ratio was
$2.90\%$
and India’s
$0.192\%$
. -
2. In order to isolate the quantitative effects of the one-child policy, we assume that the Indian transition dynamics of the FDI/GDP ratio are stable for an extended period, and that they are positive, matching India’s FDI/GDP ratio in 1995. We also keep the population growth rate,
$g_{\bar{L}}$
, of India stable and positive, which is empirically the case: starting from 1995, India’s working population growth rate has been essentially constant to slightly increasing. -
3. The model-implied slope of the Chinese transition dynamics of the FDI/GDP ratio can be, in general, flat, or exhibit a sharp decline. Nevertheless, it must be much sharper than the Indian one. The derived Chinese transition path should intersect the X-axis around 2015; in this way, the path of transition dynamics will be positive before 2015. For the population growth,
$g_{\bar{L}}$
, in China before and after the implementation of the one-child policy, we consider values of
$g_{L,1}$
within the range of
$\left [ 1\%,2\%\right ]$
, and values of
$g_{L,2}$
within the range of
$\left [ -1\%,0\%\right ]$
that fit the data well.


Regarding our calibration parameter values, we fix $r^{\ast }=10.75\%$
. While the world
$r^{\ast }=10.75\%$
. While the world $r^{\ast }$
in the literature is between
$r^{\ast }$
in the literature is between $4\%$
and
$4\%$
and $3\%$
during the examined period (see, e.g., Holston et al. Reference Holston, Laubach and Williams2017), developing countries like China and India in the 1980s and the 1990s had a risk premium that must be added to
$3\%$
during the examined period (see, e.g., Holston et al. Reference Holston, Laubach and Williams2017), developing countries like China and India in the 1980s and the 1990s had a risk premium that must be added to $r^{\ast }$
; accordingly we adopt a premium of
$r^{\ast }$
; accordingly we adopt a premium of $6\%$
, a value observed in industrial economies with well-developed financial markets. The remaining calibration parameter values are summarized as in Table 2.
$6\%$
, a value observed in industrial economies with well-developed financial markets. The remaining calibration parameter values are summarized as in Table 2.
Calibration parameters (annual values, % rates)

The difference in the physical capital intensity in production (parameter $\alpha$
) between China and India is justified by the rapid industrialization of China, in contrast to India’s greater specialization in agriculture and services. The high depreciation rate in both countries (and especially in China), is justified by the high failure rate of firms during their rapid industrialization phase.
$\alpha$
) between China and India is justified by the rapid industrialization of China, in contrast to India’s greater specialization in agriculture and services. The high depreciation rate in both countries (and especially in China), is justified by the high failure rate of firms during their rapid industrialization phase.
The transition begins in year 1985, but we only seek to match the transition path with respect to data for the period 1995–2015, since the model assumes free FDI markets without capital controls. Therefore, instead of anchoring the model using observed FDI/Y ratios in China and India, we have calibrated it using the 1985 savings rates of China and India. As mentioned above, international capital markets were not free in 1985. The observed 1985 FDI/GDP ratios were therefore not appropriate as calibration inputs. Hence, we choose to use the savings rate as the anchoring value. While we are unable to match the savings rates exactly, model-implied savings rates are close to their respective data points, as shown in Table 3:
Initial calibration targets (%)

Finally, our assumed economic lifespan is set to $T=50$
, while the retirement age is fixed at
$T=50$
, while the retirement age is fixed at $T_{R}=45$
for both China and India. Assuming that the economic lifetime starts at age 20, the expected lifespan is 70 years and retirement occurs at 65 years. Taking 1995 as a benchmark, these life expectancy and retirement ages are realistic. The population growth rates in China are
$T_{R}=45$
for both China and India. Assuming that the economic lifetime starts at age 20, the expected lifespan is 70 years and retirement occurs at 65 years. Taking 1995 as a benchmark, these life expectancy and retirement ages are realistic. The population growth rates in China are $g_{L,1}=1.44\%$
and
$g_{L,1}=1.44\%$
and $g_{L,2}=-0.58\%$
, whereas in India we assume
$g_{L,2}=-0.58\%$
, whereas in India we assume
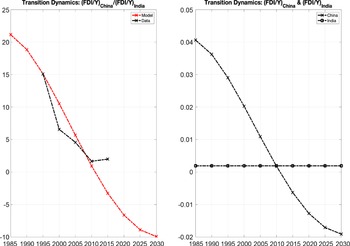
 $g_{L,1}=g_{L,2}=1.59\%$
. Our results are shown by Figure 5. The right-hand side panel in Figure 5 shows only model results (the level of FDI/GDP ratios), whereas the left-hand side panel shows the goodness of fit of the model to the relative FDI/GDP ratio data.
$g_{L,1}=g_{L,2}=1.59\%$
. Our results are shown by Figure 5. The right-hand side panel in Figure 5 shows only model results (the level of FDI/GDP ratios), whereas the left-hand side panel shows the goodness of fit of the model to the relative FDI/GDP ratio data.
Transition dynamics of the FDI/GDP ratio.

In Backus et al. (Reference Backus, Cooley and Henriksen2014) and especially in Cooley and Henriksen (Reference Cooley and Henriksen2018), there is much analysis on how changes in life expectancy and in retirement age may affect international capital flows. In order to address these concerns, we provide a sensitivity analysis of our benchmark calibration in Online Appendix F. Specifically, we analyze two cases: (i) we shorten the economic lifespan from its benchmark value $T=50$
to
$T=50$
to $T=45$
, and the retirement time from its benchmark value
$T=45$
, and the retirement time from its benchmark value $T_{R}=45$
, to
$T_{R}=45$
, to $T_{R}=40$
,Footnote 22 and (ii) we increase the economic lifespan from its benchmark value
$T_{R}=40$
,Footnote 22 and (ii) we increase the economic lifespan from its benchmark value $T=50$
to
$T=50$
to $T=55$
, while keeping the retirement time to its benchmark value
$T=55$
, while keeping the retirement time to its benchmark value $T_{R}=45$
. In both cases, we find calibrating parameters similar to the benchmark calibration that bring simulations close to the calibration targets in both Table 3 and Figure 5.
$T_{R}=45$
. In both cases, we find calibrating parameters similar to the benchmark calibration that bring simulations close to the calibration targets in both Table 3 and Figure 5.
4. Conclusion
This paper is a contribution to the nascent literature focusing on the role of demographic changes in determining FDI flows. We examine the effects of cross-country heterogeneity in population growth rates on relative FDI flows, a topic not previously addressed in the literature. In particular, we study the effects on FDI of an endogenous increases in a society’s capital/labor ratio resulting from a population decline. Our empirical setting is the mandatory one-child policy in China contrasted with India’s comparatively laissez faire approach to population control. This policy difference creates a natural experiment. We explore the resulting empirical evidence in the context of a neoclassical model of FDI dynamics. The evidence and our analysis support the hypothesis that population dynamics may have a major impact on relative FDI flows. Nevertheless, only future research, performed through more descriptive models that can simultaneously account for several other driving factors of FDI:GDP ratio dynamics, such as (international) market institutions, fiscal policies, pension policies, information imperfections, etc., may shed light on the relative quantitative importance of demographics as a driving force behind FDI.
Acknowledgements
We are grateful to Costas Arkolakis, Costas Azariadis, Espen Henriksen, and Gustavo Ventura, as well as participants at the Econometric Society meetings in Cotonou, for their valuable feedback. We pay special tribute to the late Robert Lucas and the late Edward Prescott for their insightful comments. Special thanks are also due to the late Thomas Cooley for his detailed feedback and suggestions. We appreciate the constructive critiques and guidance from three anonymous referees and co-editor Lee Ohanian, which have significantly enhanced this paper. Li acknowledges financial support from the Natural Science Foundation of Zhejiang Province, China (Contract LQ20G030006), and the China Scholarship Council.
Supplementary material
The supplementary material for this article can be found at http://doi.org/10.1017/S1365100524000166.


 Open access