Introduction
Surface-enhanced Raman spectroscopy (SERS)—the extraordinary enhancement of Raman scattering signals from molecules that are directly adjacent to metallic nanostructures—has had an amazing run. Discovered by Richard Van Duyne in 1976,Reference Jeanmaire and Van Duyne1 it has enjoyed a continual expansion in interest over the past 36 years benefitting from a series of discoveries, new fields, and technological capabilities, all of which have greatly contributed to the current broad interest in this topic. The focus on nanoscience and nanotechnology that began in the early 1990s naturally put a spotlight on SERS as a quintessentially nanoscale phenomenon. Interest was further stimulated by significant innovations in nanoparticle synthesis and fabrication, in instrumentation, and in theory, which, over the subsequent decade, began to allow detailed, computationally intensive calculations of the local electromagnetic field to be performed on nanostructure geometries of ever greater complexity, with unprecedented accuracies.
Reports by KneippReference Kneipp, Wang, Kneipp, Itzkan, Dasari and Feld2 and NieReference Nie and Emory3 in the mid-1990s, showing that Raman signatures could be detected from single molecules, caused a virtual explosion of new interest in SERS, paralleling the then-nascent field of single-molecule spectroscopy. The new fields of plasmonics and metamaterials, which began to appear at the turn of this century, enlivened this field even further, in concert with the expanding emphasis on materials science in general. As a result of all of these catalytic events, the past 12 years have seen an exponential growth in the number of scientific papers in which the term SERS appears (Figure 1). In particular, the emergence of the field of plasmonicsReference Dionne and Atwater4—the science and engineering of electromagnetic field interactions with metallic nanostructures—whose scope extends far beyond SERS, has directly benefited this topic. The precise understanding of the various types of plasmon resonances that a collection of plasmonic nanoparticles can sustainReference Halas, Lal, Chang, Link and Nordlander5 has greatly helped to systematize the design of SERS-active substrates. Moreover, the fact that most plasmonic nanostructures or assemblies can produce SERS has often made it the spectroscopy of choice when probing other plasmonic phenomena.
The number of papers returned by a Web of Science (http://wokinfo.com/) search on the acronym “SERS,” annotated with some of the milestones that contributed to the growth of research in surface-enhanced Raman spectroscopy (SERS). The number of papers given for 2013 is incomplete, showing its value on June 24, 2013. (a) The approximate year in which modern Raman instrumentation and powerful computational approaches for calculating local electric field strengths in nanostructures became commonly available and utilized; this is also the year in which widespread international interest in nanoscience and nanotechnology began its steep growth. (b) Single-molecule SERS is reported.Reference Kneipp, Wang, Kneipp, Itzkan, Dasari and Feld2,Reference Nie and Emory3 (c) The National Nanotechnology Initiative is launched in the United States; the fields of plasmonics and metamaterials are founded.

A critical early milestone in SERS was the series of reports by Metiu and co-workers that at certain wavelengths, the optical near field is inordinately concentrated in interstices between nanoparticlesReference Aravind, Nitzan and Metiu6 and between nanoparticles and continuous metallic surfaces.Reference Aravind and Metiu7 These local regions of dramatically enhanced electromagnetic field, termed “hot spots,” subsequently dominated the development of SERS substrates and are now generally accepted to be the crucial geometrical factor behind single-molecule SERS, largely on the basis of the pioneering work of Xu and Käll8 and of Brus.Reference Jiang, Bosnick, Maillard and Brus9 Concurrently, the advent of core-shell nanoparticles with tunable plasmon resonances provided SERS substrates with highly uniform particle-to-particle enhancements without relying on interstitial hot spots, but providing SERS enhancements as a systematic function of nanoparticle geometry.Reference Jackson and Halas10
Single-molecule spectroscopy
With the advent of single-molecule SERS spectroscopy and plasmonic hot spots came the challenge of single-molecule verification. An important development in single-molecule SERS was the proposal by Etchegoin and Le Ru of the bianalyte approach.Reference Le Ru, Meyer and Etchegoin11 Briefly stated, when two molecular species with approximately equal bonding affinity simultaneously adsorb within a hot spot, then, for a given overall number of molecules, the probability of finding the two constituents of the mixture is given by the Poisson distribution. Specifically, if only one type of molecule is detected in a statistically significant set of measurements, then this is strong evidence that each hot spot contains only a single molecule. This approach was refined by Van Duyne using normal and deuterated Rhodamine 6G (R6G) dye molecules (to ensure virtually identical Raman cross-sections in the molecular mixture) to show that the SERS spectra measured from a multiplicity of “hot spot” junctions was due to a single R6G molecule.Reference Dieringer, Lettan, Scheidt and Van Duyne12
The substrate geometries discovered in the context of investigating the microscopic origin of SERS provided key elements that led to the development of the field of plasmonics, in particular, our understanding of the collective plasmon modes of nanoparticle assemblies and complex nanostructures. The plasmon hybridization paradigm, which provides this foundational understanding, draws an analogy between the collective plasmon modes of these plasmonic substrates and simple quantum systems.Reference Prodan, Radloff, Halas and Nordlander13 In essence, plasmon hybridization is a theoretical analysis method for calculating plasmon modes based on the linear combinations of the modes of the simpler, constituent elements (surfaces) of a plasmonic structure. But more than that, plasmon hybridization provides a simple and intuitive picture for visualizing and understanding the collective modes of a plasmonic structure such as a cluster of nanoparticles. In this picture, a pair of adjacent nanoparticles—a hot spot—becomes a “dimer,”Reference Nordlander, Oubre, Prodan, Li and Stockman14 as the plasmonic structure analogous to diatomic molecules. Plasmon hybridization has been used to analyze the plasmon modes of a wide variety of structures that serve as popular SERS substrates.Reference Wang, Brandl, Nordlander and Halas15 In addition to nanoparticle pairs and complex nanoparticles, the coupling of a discrete plasmonic nanoparticle to an extended structure, such as a metallic substrate, thin film, or metallic nanowire, has also been analyzed using this approach. In these latter systems, the discrete modes of the localized resonances of a metallic nanoparticle interact with the continuum of surface plasmons of the semi-infinite extended structure.Reference Le, Lwin, Steele, Käll, Halas and Nordlander16,Reference Hao and Nordlander17 In the case of a thin film, the hybridization can be regarded as the electromagnetic analog of the spinless Anderson–Fano model, which is the standard model used to describe the interaction of a localized electronic state with a continuous band of electronic states.Reference Anderson18,Reference Fano19
Tip-enhanced SERS
Another key post-1990 development in SERS is tip-enhanced SERS—TERS—in which the hot spot is formed between a laser-illuminated STM tip, composed of an appropriate metal, and a surface. This arrangement allows the gap between the tip and the surface to be varied at will.Reference Stöckle, Suh, Deckert and Zenobi20–Reference Sun, Zhang, Zheng and Xu22 This approach is important for several reasons. First, it is a challenging experimental marriage between the techniques of scanning probe microscopy and those of optical spectroscopy of nanostructures. Second, the new capabilities of this method, where the tip-sample gap, which, in the case of a plasmonic tip and substrate, is the hot spot volume, can be varied controllably, potentially leading to a deep understanding of the nature of this seminal nanoscale cavity. When reduced to the dimensions of one or two nanometers, quantum effects are expected to emerge, which can profoundly modify the hot spot’s properties. Other nanometer-scale metallic geometries, such as ultrasharp tips or high aspect ratio nanoparticles, should also exhibit quantum effects. For the study of quantum effects, a full quantum treatment of the plasmonic nanostructure is needed. Time-dependent density functional theory (TDDFT) provides the theoretical method for such an analysis.Reference Marques and Gross23,Reference Stratmann, Scuseria and Frisch24
Quantum effects
Early studies of quantum effects in plasmonic nanoparticles using this full quantum treatment focused on nanoshells and nanorods. In those studies, the plasmon mode energies obtained using TDDFT were very similar to the energies obtained using simple classical electromagnetic modeling. However, the widths of the resonances could be very different in the classical versus the quantum picture, in particular when quantum size effects are present in ultrasmall systems. The property of plasmonic nanoparticles most critical for SERS, however, is the local electromagnetic field enhancement, and this quantity appears to be profoundly influenced by quantum effects. In an initial study of quantum effects in Ag nanorods,Reference Zuloaga, Prodan and Nordlander25 the field enhancement calculated in the full quantum picture, using TDDFT, showed that classical electromagnetic theory drastically overestimates the field enhancement in the vicinity (0.5 nm) of the nanorod surface, in particular in the region near its tip. This is not surprising, since the full quantum treatment describes the spill-out electron density in the surface region, which screens the local electric fields. Another contributing factor to the dramatic difference between the classical and quantum picture is the nonlocal aspect of the screening due to surface electrons. In a classical model, the surface charges reside in an infinitely thin region at the interface, while in the quantum calculation, the screening charges are spread out over a finite region encompassing the surface. The finding of strong, nonlocal, quantum mechanically induced screening near the surface of a nanoparticle means that field enhancements obtained from classical electromagnetic calculations are inaccurate within a region of ∼0.5 nm around the surfaces of metallic nanoparticles.
The theoretical implementation of TDDFT for nanoparticle dimers is considerably more difficult than its application to nanoparticles with spherical symmetry. However, because of the significance of strongly coupled metallic nanoparticle dimers for SERS, this is a system of central importance. In another landmark work,Reference Zuloaga, Prodan and Nordlander26,Reference Marinica, Kazansky, Nordlander, Aizpurua and Borisov27 Nordlander and co-workers examined the difference between the local field properties of the interparticle gap of a nanoparticle dimer in the classical and full quantum picture. TDDFT calculations were carried out on strongly coupled nanoparticle dimers for varying interparticle separations using a theoretical description based on a uniform electron gas (i.e., jellium), where the plasmon-induced electromagnetic field enhancements were determined and compared to the purely classical case (Figure 2). Both the full quantum and classical treatments reveal a plasmon resonance that shifts to longer wavelengths with decreasing interparticle separation. In this regime, the quantum and classical field enhancements in the interparticle junction are extremely similar (A to B in Figure 2a).
Comparison of the field enhancement in a classical versus a quantum dimer “hot spot.” (a) A comparison of the maximum electromagnetic field enhancements (E/E 0) calculated using classical (plasmon hybridization [PH], red) and quantum (time-dependent local density approximation [TDLDA], blue) for two nanoparticles, each of 2.4 nm diameter, approaching at separations of d = 24 (A), 8 (B), 4 (C), and 2 (D). (b) Comparison of the field distributions calculated using classical (PH) (top panels) and quantum (TDLDA) (bottom panels) methods. Reprinted with permission from Reference 26. © 2009 American Chemical Society.

For dimer separations shorter than approximately 0.5 nm, however (Figure 2a, B–D) the field enhancements calculated in the classical and the quantum picture diverge. In the quantum picture, the redshift of the bonding dipolar plasmon saturates and then reverses direction, shifting to shorter wavelengths with decreasing separation, in contrast to the classical picture where the redshift of the plasmon persists down to near-zero separation. This dramatic discrepancy is a direct result of the quantum mechanical effect of electron tunneling between the particles. For the smallest dimer separations, the conductive overlap between particles is sufficiently strong, enabling adequate charge transfer between the two structures. This detailed spectral evolution is in sharp contrast to the results of classical calculations for the same structures, which, not surprisingly, exhibit a discontinuous jump between the touching and nontouching regimes. It is interesting to note that both the spectra and the field enhancements obtained using quantum mechanics differ dramatically from the spectra obtained using classical electromagnetic theory. Recent measurements carried out within the controllable gap between two gold nanoparticles by Savage et al. illustrate this reversal of wavelength shift with decreasing gap distance.Reference Savage, Hawkeye, Esteban, Borisov, Aizpurua and Baumberg28 These studies provide wholly new insights into the properties of plasmonic SERS substrates on length scales pertinent to molecular adsorbates.Reference Song, Nordlander and Gao29–Reference Manjavacas, de Abajo and Nordlander31 The next step would be to include the molecule fully into this theoretical picture. Such a move will undoubtedly yield a new level of understanding regarding the fundamental nature of SERS.
SERS for nanoprobes
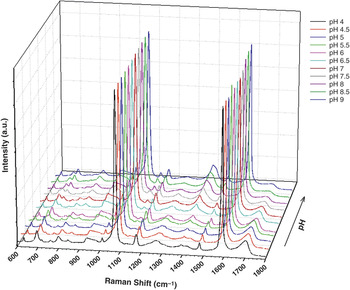
The advent of nanoscale plasmonic complexes as SERS substrates has stimulated interest in SERS as a reporting mechanism for nanoprobes that could be used in many different contexts and applications. Perhaps the most exciting and ambitious applications of “nanoSERS” is as a new method for probing, in a spatially resolvable manner, the crowded chemistry of the complex interior of living cells. This challenging goal is being approached in a variety of ways. For example, because the Raman bands of a carboxylic group vary markedly, depending on whether the group is in its neutral state, when the prevailing pH of the medium is below pKa of the acid, or an anionic carboxylate when the ambient pH is above pKa, one can use the SERS spectrum as a local pH sensor.Reference Talley, Jusinski, Hollars, Lane and Huser32,Reference Bishnoi, Rozell, Levin, Gheith, Johnson, Johnson and Halas33 By including changes in all detectable SERS modes in a multidimensional analysis based on statistical learning theory, one can increase the SERS sensitivity of this nanoparticle-molecule complex, rendering it a nanoscale “pH meter” with a resolution of ±0.1 pH units across a physiologically useful pH range (Figure 3). This approach was used more recently to map out the local pH with sensors that have been placed into living cells through the biological process of endocytosis.Reference Pallaoro, Braun, Reich and Moskovits34 Suh et al.Reference Suh and Moskovits35 foreshadowed some aspects of this application of adsorbed carboxylic acids to measure local pH. They noted that while at pH 7, glycine exists as the zwitterion in solution, the SERS spectrum of glycine recorded on a silver substrate immersed in a solution at approximately pH 7 shows it to be wholly in its anionic form, normally the case only at high pH values. Two possibilities were suggested for this observation. The first is that in the anionic form, glycine is a good bidentate ligand, so it prefers to adopt this form when adsorbed on silver even at lower pH values. The second is that the effective pH at the surface of the silver nanoparticle on which glycine is adsorbed is higher than in the ambient solution, a reasonable possibility in the electrical double layer that often exists near the surface of colloidal particles.
Surface-enhanced Raman spectroscopy (SERS) spectra of para-mercaptobenzoic acid (pMBA) on nanoshells at various pH values ranging from pH 4.0 to pH 9.0 in steps of 0.50 pH units. The numerous subtle pH-dependent changes in the SERS spectrum, when analyzed in a multidimensional model, allow for a highly sensitive (±0.1 pH units) local pH reading from the nanoparticle. Reprinted with permission from Reference 33. © 2006 American Chemical Society.

Also using SERS of carboxylates, Lee et al.Reference Lee and Moskovits36 visualized the chromatographic separation of a mixture of Pb2+ and Hg2+ ions in solution using a capillary column lined with gold nanoparticles with adsorbed para-mercaptobenzoic acid. The process could then be followed with the change in the relative SERS intensities of the two species chelated by the carboxylate group of the acid. The ratio of the two bands clearly showed how the separation process depends on the interplay between the relative chelating energy of the two species and their local concentrations.
SERS, with its high sensitivity and molecular fingerprinting capabilities, has occasionally been cited as a possible low-cost DNA sequencing strategy in which an ultrasmall SERS substrate (perhaps a bowtie-like nanoantenna), placed strategically at the mouth of a nanopore through which DNA strands are electrophoretically translocated, would identify the individual bases passing by.Reference Branton, Deamer, Marziali, Bayley, Benner, Butler, Di Ventra, Garaj, Hibbs, Huang, Jovanovich, Krstic, Lindsay, Sean Ling, Mastrangelo, Meller, Oliver, Pershin, Ramsey, Riehn, Soni, Tabard-Cossa, Wanunu, Wiggin and Schloss37 A significant development consonant with that ambitious goal is a method for obtaining high-quality SERS spectra of single-stranded and double-stranded DNA. The SERS spectra of both types of DNA oligonucleotides were found to be similar and strongly dominated by the Stokes modes of adenine, suggesting the possibility of using adenine as an endogenous SERS reporter of DNA.Reference Barhoumi, Zhang, Tam and Halas38
In this issue
Sharma et al. examine recent progress in the fabrication of SERS substrates, along with assessing what is needed for effective characterization of plasmonic materials as SERS platforms. They examine bottom-up and top-down fabrication methods, as well as the benefits of tip-enhanced Raman spectroscopy for combining vibrational spectroscopy with high spatial resolution. They also assess future experimental challenges regarding substrates, such as high degrees of reproducibility, as well as new applications for this spectroscopy.
Jokerst et al. examine molecular imaging of living cells and subjects for SERS. A focus on the types of substrates as well as imaging agents used in this range of applications, as well as specific animal models, are discussed in the context of this potentially revolutionary subfield with the potential for high-impact commercial applications.
Le Ru and Etchegoin review the central issue of enhancement factors (EFs) in SERS. They examine this topic historically, correcting some long-held misconceptions in the field of SERS that still persist in the literature. In their clarification of the basic concepts of this topic, they point toward a path of practical EF quantification. Chuntonov and Haran review work performed on three-member plasmonic clusters—“trimers”—as SERS substrates. They describe the role of symmetry in analyzing the normal modes of these plasmonic substrates. This article reviews the use of symmetry theory to analyze the plasmonic normal modes of metal nanoparticle trimers. The coupling between a single molecule in an interparticle gap of the trimer structure and its plasmon modes can result in the observation of Raman optical activity in such a cluster, a new observation in SERS that may have important future applications.
Conclusion
At 36 years and counting, SERS has a solid scientific foundation and a promising future. Advances in theory will lead to a full quantum treatment of single-molecule SERS, which should provide enticing predictions for a new generation of single-molecule spectroscopists. Merging SERS with other spectroscopies,Reference Wang, Kundu and Halas39 such as surface-enhanced infrared absorption, or even THz spectroscopy, and other techniques such as EELS, will enable the detection of molecular unknowns at the single-molecule level. Probing the nanoscale world with SERS will no doubt continue, and in the hands of biologically inclined researchers, full biophysical and biochemical processes, such as the evolution of neurotransmitter chemistry in neurological synapses, will be investigated. This will yield new insight into brain function at the single-cell level within living organisms. The next generation promises to be just as full of surprises and discoveries as the discovery of SERS itself.