

Current neuroanatomical models of obsessive–compulsive disorder (OCD) propose that specific cortico-striato-thalamic circuits are involved in the mediation of its symptoms, but structural neuroimaging studies have only produced mixed evidence to support these models. It is not uncommon for different studies to report increased or reduced grey matter volumes in the same brain regions. For example, the volume of caudate nucleus has been reported to be decreased, Reference Robinson, Wu, Munne, Ashtari, Alvir and Lerner1 normal Reference Aylward, Harris, Hoehn-Saric, Barta, Machlin and Pearlson2 or increased Reference Scarone, Colombo, Livian, Abbruzzese, Ronchi and Locatelli3 in people with OCD v. healthy controls. These inconsistencies can be partially attributed to the inclusion of small and heterogeneous samples of participants with OCD, and also to substantial methodological differences between studies. Many morphometric studies in OCD have used manual (therefore subjective) or semi-automated methods to measure the volumes of brain regions defined a priori as being implicated in OCD, therefore preventing the exploration of other brain regions potentially implicated in the disorder. The recent development of fully-automated, whole-brain voxel-based morphometry methods, Reference Ashburner and Friston4–Reference Mechelli, Price, Friston and Ashburner6 which overcome some of the limitations of the region of interest approach, provide a powerful and unbiased tool to study the neural substrates of OCD. Unfortunately, recent applications of these novel methods to the study of OCD are often limited by relatively small sample sizes, resulting in insufficient statistical power and increased risk of false-positive results. In this context, we considered it timely to conduct an exhaustive search of all published and unpublished voxel-based morphometry studies in OCD worldwide, and to perform a voxel-based quantitative meta-analysis using a new method, called signed differential mapping (SDM), which improves on other available meta-analytic methods.
Method
Inclusion of studies
Included articles were obtained from exhaustive searches by the investigators in the Medline, PubMed, ScienceDirect and Scopus databases using the keywords ‘obsessive–compulsive disorder’ plus ‘morphometry’, ‘voxel-based’ or ‘voxelwise’, as well as from hand searching in the reference lists of obtained articles. In addition, the authors contacted 303 worldwide OCD experts by email Reference Mataix-Cols, Pertusa and Leckman7 requesting any unpublished voxel-based morphometry study in OCD that they wished to include in this meta-analysis. Studies comprising less than 10 individuals with OCD Reference Cecconi, Lopes, Duran, Santos, Hoexter and Gentil8 and studies that re-analysed previously published data Reference Cardoner, Soriano-Mas, Pujol, Alonso, Harrison and Deus9,Reference Soriano-Mas, Pujol, Alonso, Cardoner, Menchon and Harrison10 were not included. Twelve studies performing whole-brain voxel-based comparisons of grey matter between individuals with OCD and healthy controls and completed before 1 December 2008 were identified and included in the meta-analysis. These included 11 published papers and a previously unpublished analysis of a published paper (Soriano-Mas et al, Reference Soriano-Mas, Pujol, Alonso, Cardoner, Menchon and Harrison10 new sample). The corresponding authors were contacted by email requesting any details not included in the original publications. After contacting the authors, no methodological ambiguities remained regarding the design or analysis of any of the studies. Meta-analysis Of Observational Studies in Epidemiology (MOOSE) guidelines Reference Stroup, Berlin, Morton, Olkin, Williamson and Rennie11 are followed in our study.
Global differences in grey matter volume
Meta-analytical estimates of the differences in global grey matter volumes between the participants with OCD and the controls were calculated using both fixed and random-effects models with RevMan version 5 for Linux (The Nordic Cochrane Centre, Copenhagen). A previous heterogeneity analysis was performed to test if the observed variance across studies was larger than that resulting from sampling error alone.
Regional differences in grey matter volume
To understand how voxel-based meta-analyses work, it must first be noted that neuroimaging studies report, from each cluster of significant differences, the coordinates of the ‘voxel’ (i.e. the 3-dimensional pixel) where the difference between the participants with OCD and controls is maximum. The basic idea behind voxel-based meta-analyses is ‘counting’, for each voxel, how many times it is close ‘enough’ to the reported maxima and subsequently associating a probability to test the statistical significance. In other words, are there more studies reporting coordinates near that voxel than would be expected by chance? Two main different methods are currently available to perform meta-analyses of neuroimaging data, known as activation likelihood estimate (ALE) Reference Turkeltaub, Eden, Jones and Zeffiro12 and multilevel kernel density analysis (MKDA). Reference Wager, Lindquist and Kaplan13 These two methods differ in a number of important ways and each has their own strengths and limitations. Here we describe a new approach, signed differential mapping (SDM), which adopts and combines the various positive features of these two methods. In addition, SDM introduces a series of improvements and novel features that are summarised in the Appendix and explained in detail below.
The first improvement introduced by SDM is a stricter selection of the reported peak coordinates to ensure that only regions that appear statistically significant at the whole-brain level are considered for inclusion in the meta-analysis. This strict criterion is intended to avoid biases towards liberally thresholded brain regions because it is not uncommon in neuroimaging studies that the statistical threshold for some regions of interest is rather more liberal than for the rest of the brain. Another improvement related to the selection of peak coordinates is the systematic preference for results that are corrected for multiple comparisons. Signed differential mapping establishes the following order of preference:
-
(a) whole-brain analyses with correction for multiple comparisons and at least one statistically significant coordinate;
-
(b) whole-brain analyses without correction for multiple comparisons and at least one statistically significant coordinate;
-
(c) whole-brain analyses with no statistically significant coordinates;
-
(d) if none of (a)–(c) apply, the study is discarded.
Inclusion of analyses without correction for multiple comparisons does not bias the probability of finding significant results because the statistical analysis controls for the number of coordinates as described below. Coordinates reported in MNI (Montreal Neurological Institute) space are converted to Talairach space using the matrix transformations proposed by Lancaster, Reference Lancaster, Tordesillas-Gutierrez, Martinez, Salinas, Evans and Zilles14 which have been shown to be more exact than earlier methods. Reference Brett15 Coordinates reported in Talairach space which had been converted using earlier methods, are converted back to MNI space and subsequently converted to Talairach space using the matrix transformations.
Once the coordinates are selected and converted, a map of the differences in grey matter is separately recreated for each study. This consists of assigning a value to the voxels close to each of the reported coordinates within a grey matter map (based on the Talairach Daemon, Reference Lancaster, Woldorff, Parsons, Liotti, Freitas and Rainey16 voxel size 2 × 2 × 2 m Reference Scarone, Colombo, Livian, Abbruzzese, Ronchi and Locatelli3 ). Signed differential mapping uses a 25 mm full-width at half maximum (FWHM) un-normalised Gaussian kernel – it must be noted that this kernel is different in nature from the smoothing kernel used to smooth raw magnetic resonance images, since it is not intended to smooth any image but to assign indicators of proximity to reported coordinates. This kernel is adapted from that of ALE and preferred to that of MKDA because it assigns a higher value to the voxels closer to the reported coordinates. Full-width at half maximum is set at 25 mm because in previous simulations we found it to have an excellent control of false positives – consistent with our simulation work, a recent study has reported that the optimal FWHM for the previous methods is about 15–30 mm. Reference Salimi-Khorshidi, Smith, Keltner, Wager and Nichols17
When a voxel can be assigned values from more than one coordinate in the same study these values are summed. An important downside of the sum of values is a bias towards studies reporting various coordinates in close proximity, as voxels can achieve rather large values. Reference Wager, Lindquist and Kaplan13 Multilevel kernel density analysis elegantly overcomes this problem by limiting the values within one study to a maximum and SDM also incorporates this feature. A novelty of our method is that both positive and negative coordinates (i.e. both increases and decreases of grey matter) are reconstructed in the same map, resulting in a signed differential map. This is an important feature that prevents a particular voxel erroneously appearing to be positive (i.e. increased volume or activation) and negative (i.e. decreased volume or activation) at the same time. This problem is often seen in published studies using previous methods, e.g. Menzies et al. Reference Menzies, Chamberlain, Laird, Thelen, Sahakian and Bullmore18
Once all the studies have their signed differential map created, a meta-analytic signed differential map is calculated. It must be noted that individual signed differential maps do not account for the variability within each study, indeed this is not reported, so that usual meta-analytic calculations are not applicable. However, MKDA overcomes this issue by defining the meta-analytic value of a voxel as the proportion of studies reporting a coordinate around the voxel (weighted by the squared root of the sample size of each study so that studies with larger samples contribute more). Thus, the question to answer at each voxel is – are there more studies reporting coordinates around that voxel than would be expected by chance? In order to adjust the approach of MKDA to our method we calculate the mean instead of the proportion of studies, although the meaning does not change.
Finally, a null distribution of the meta-analytic values is created to test which voxels have more studies reporting differences of grey matter around them than expected by chance. This is performed by means of Monte Carlo randomisations of the location of the coordinates (within a mask of grey matter plus 8 mm of white matter). The null distribution is generated at the whole-brain level to maximise statistical stability with relatively reduced computation time (almost 40 million values are obtained with 500 randomisations). We focus on results with uncorrected P<0.001 because we found in the previous simulations that uncorrected P<0.001 or even 0.002 was, in our method, empirically equivalent to corrected P<0.05. However, we also formally correct for multiple comparisons by means of the false discovery rate. Reference Genovese, Lazar and Nichols19
Descriptive analysis of quartiles
The standard randomisation test described above checks if there are more studies reporting coordinates in a particular region than in the rest of the brain. However, this information is incomplete without describing the actual proportion of studies reporting coordinates in the region (e.g. it is not the same that half of the studies report changes in a particular region than if only 5% do). To overcome this issue, a descriptive analysis of quartiles is conducted, e.g. values higher than 0 in the second quartile (median) map mean that at least 50% of the studies found increases of grey matter near the voxel. Once again, the calculations are weighted by sample size to make the studies with large samples contribute more. As this analysis could be biased by the inclusion of studies that did not correct for multiple comparisons, only studies that performed such corrections are included. Reference Soriano-Mas, Pujol, Alonso, Cardoner, Menchon and Harrison10,Reference Carmona, Bassas, Rovira, Gispert, Soliva and Prado20–Reference van den Heuvel, Remijnse, Mataix-Cols, Vrenken, Groenewegen and Uylings27
Sensitivity analysis
In order to test the replicability of the results, a systematic whole-brain voxel-based jackknife sensitivity analysis is conducted. This consists of repeating the main statistical analysis 12 times but discarding one different study each time, i.e. removing one study and repeating the analyses, then putting that study back and removing another study and repeating the analysis, and so on. The rationale of this test is that if a previously significant brain region remains significant in all or most of the combinations of studies it can be concluded that this finding is highly replicable.
Analyses of subgroups
In order to control for any possible methodological differences observed between the studies, the analysis is repeated several times including only those studies which are methodologically homogenous. Therefore, the analysis is repeated for those studies which acquired the images with a slice thickness of 1.2–1.5 mm, for those using a 12 mm smoothing kernel, for those performing parametric and voxel-based statistical tests, for those performing an additional modulation step (i.e. inference of absolute grey matter volume instead of grey matter density), for those reporting coordinates corrected for multiple comparisons, and for those that included adult participants; unfortunately, paediatric studies were too few to be analysed separately. Subgroup analyses regarding the procedure used for controlling for global volumes were not possible, as there were not enough studies using the same approach. Separate analysis depending on the magnetic strength of the scanner was not required as all studies used 1.5 tesla scanners.
Meta-regression
The potential effect of several relevant sociodemographic and clinical variables is examined by means of simple linear regression, weighted by the squared root of the sample size and restricted to only predict possible SDM values (i.e. from −1 to 1) in the observed range of values of the variable. The main output for each variable is a map of the regression slope (e.g. the amount of grey matter change per unit increase in mean Yale–Brown Obsessive–Compulsive Scale (YBOCS) score). Reference Goodman, Price, Rasmussen, Mazure, Fleischmann and Hill28 In order to reduce spurious results, we only report those clusters showing a significant trend across participants with OCD along with a predicted significant difference with healthy individuals in studies at one of the extremes (e.g. a predicted significant grey matter difference with healthy individuals in studies with maximum YBOCS). Because of the small number of studies included in this meta-analysis and the number of regression models tested (n = 6), a strict control of false positives is applied (Bonferroni correction: P = 0.001/6 = 0.00017). However, the meta-regression results should be taken with some caution because of the limited variability in the data.
Variables explored by regression are the mean age, the mean YBOCS, the percentage of participants with a major depressive disorder and the percentage of individuals receiving current antidepressant medication. The percentage of people receiving current antipsychotic medication was not considered because it was the same (0%) in all the studies. The following variables could not be studied because data was available for fewer than nine studies: mean years of education, mean age at onset, illness duration, percentage of participants with anxiety disorders other than OCD and percentage of participants having received past antidepressant or antipsychotic medication.
Computational aspects
Software for all the computations was developed by J.R. by means of a C language program accessing a SQL database (www.mysql.com/). The original Ubuntu GNU/Linux (www.ubuntu.com/) version, as well as other operative system adapted versions is freely available at www.sdmproject.com/software/.
Results
Included studies
Twelve studies were included comprising 401 individuals with OCD and 376 healthy controls. Of the 12 studies, 9 consisted of adult OCD samples and 3 of paediatric samples. The demographic and clinical characteristics of the participants are shown in Table 1. Further details and methodological aspects of each of the included studies can be found at www.sdmproject.com/database/.
Demographic and clinical characteristics of the 12 studies included in the meta-analysis
| Sociodemographic characteristics | Clinical characteristics: OCD participants only | |||||||||||||||||||||||||||||
|---|---|---|---|---|---|---|---|---|---|---|---|---|---|---|---|---|---|---|---|---|---|---|---|---|---|---|---|---|---|---|
| n | Age, years: mean | Males, % | Right handed % | Years education % | ||||||||||||||||||||||||||
| OCD | Controls | OCD | Controls | OCD | Controls | OCD | Controls | OCD | Controls | Age at onset Years: mean | Illness duration Years: mean | YBOCS score: mean | Major depressive disorder % | Anxiety % | Anti-depressant % | |||||||||||||||
| Carmona et al Reference Carmona, Bassas, Rovira, Gispert, Soliva and Prado20 | 18 | 18 | 12.9 | 13.0 | 72 | 72 | 83 | 83 | N/A | N/A | N/A | N/A | 21.4 | 0 | 33 | 56 | ||||||||||||||
| Christian et al Reference Christian, Lencz, Robinson, Burdick, Ashtari and Malhotra21 | 21 | 21 | 38.0 | 38.9 | 71 | 71 | 67 | 76 | 14.6 | 14.9 | N/A | N/A | 27.0 | 33 | N/A | 81 | ||||||||||||||
| Gilbert et al Reference Gilbert, Mataix-Cols, Almeida, Lawrence, Nutche and Diwadkar22 | 25 | 20 | 37.5 | 29.8 | 52 | 45 | N/A | N/A | N/A | N/A | 29.5 | 8.0 | 26.9 | 36 | 24 | 80 | ||||||||||||||
| Gilbert et al Reference Gilbert, Keshavan, Diwadkar, Nutche, Macmaster and Easter23 | 10 | 10 | 12.9 | 13.4 | 60 | 60 | 100 | 100 | N/A | N/A | N/A | N/A | 26.5 | 0 | N/A | 0 | ||||||||||||||
| van den Heuvel et al Reference van den Heuvel, Remijnse, Mataix-Cols, Vrenken, Groenewegen and Uylings27 | 55 | 50 | 33.7 | 31.4 | 29 | 40 | 89 | 90 | N/A | N/A | N/A | N/A | 22.8 | 18 | N/A | 0 | ||||||||||||||
| Kim et al Reference Kim, Lee, Kim, Kim, Kim and Han29 | 25 | 25 | 27.4 | 27.0 | 68 | 68 | 96 | 96 | 14.2 | 15.3 | 19.0 | 8.4 | 24.2 | 16 | 0 | 0 | ||||||||||||||
| Pujol et al Reference Pujol, Soriano-Mas, Alonso, Cardoner, Menchon and Deus24 | 72 | 72 | 29.8 | 30.1 | 56 | 56 | 85 | 85 | 13.2 | 14.0 | 17.0 | 13.0 | 26.7 | 36 | 19 | 75 | ||||||||||||||
| Riffkin et al Reference Riffkin, Yucel, Maruff, Wood, Soulsby and Olver25 | 18 | 18 | 36.1 | 34.6 | 44 | 44 | 94 | 94 | 12.1 | 13.4 | N/A | N/A | 23.3 | N/A | N/A | 17 | ||||||||||||||
| Soriano-Mas et al Reference Soriano-Mas, Pujol, Alonso, Cardoner, Menchon and Harrison10 | 30 | 30 | 31.9 | 31.8 | 70 | 53 | 93 | 90 | 12.2 | 13.1 | 19.7 | 11.3 | 21.0 | 13 | 23 | 87 | ||||||||||||||
| Szeszko et al Reference Szeszko, Christian, Macmaster, Lencz, Mirza and Taormina30 | 37 | 26 | 13.0 | 13.0 | 38 | 35 | 57 | 65 | N/A | N/A | 9.4 | 3.6 | 24.9 | 0 | 24 | 0 | ||||||||||||||
| Valente et al Reference Valente, Miguel, Castro, Amaro, Duran and Buchpiguel26 | 19 | 15 | 32.7 | 32.3 | 53 | 47 | 89 | 73 | 11.7 | 10.4 | 14.4 | 18.3 | 24.6 | 47 | 84 | 58 | ||||||||||||||
| Yoo et al Reference Yoo, Roh, Choi, Kang, Ha and Lee31 | 71 | 71 | 26.6 | 26.7 | 66 | 66 | 96 | 100 | N/A | N/A | 18.6 | 8.0 | 22.8 | 6 | 4 | 83 | ||||||||||||||
OCD, obsessive—compulsive disorder; YBOCS, Yale—Brown Obsessive—Compulsive Scale; N/A, not available.
Global grey matter volumes
Global grey matter volumes were obtained from seven studies including 297 individuals with OCD and 277 healthy controls with similar characteristics to those of the overall sample. Reference Carmona, Bassas, Rovira, Gispert, Soliva and Prado20,Reference Pujol, Soriano-Mas, Alonso, Cardoner, Menchon and Deus24,Reference Valente, Miguel, Castro, Amaro, Duran and Buchpiguel26,Reference van den Heuvel, Remijnse, Mataix-Cols, Vrenken, Groenewegen and Uylings27,Reference Kim, Lee, Kim, Kim, Kim and Han29–Reference Yoo, Roh, Choi, Kang, Ha and Lee31 Heterogeneity analysis revealed that variance across studies was not only as a result of sampling error alone (χ2 = 13.83, d.f. = 6, P = 0.03). No differences in global grey matter volume were found between individuals with OCD and healthy controls using both fixed and random-effects models (Z = 1.56, P = 0.12 and τ2 = 315.59, Z = 1.00, P = 0.32 respectively).
Regional differences in grey matter
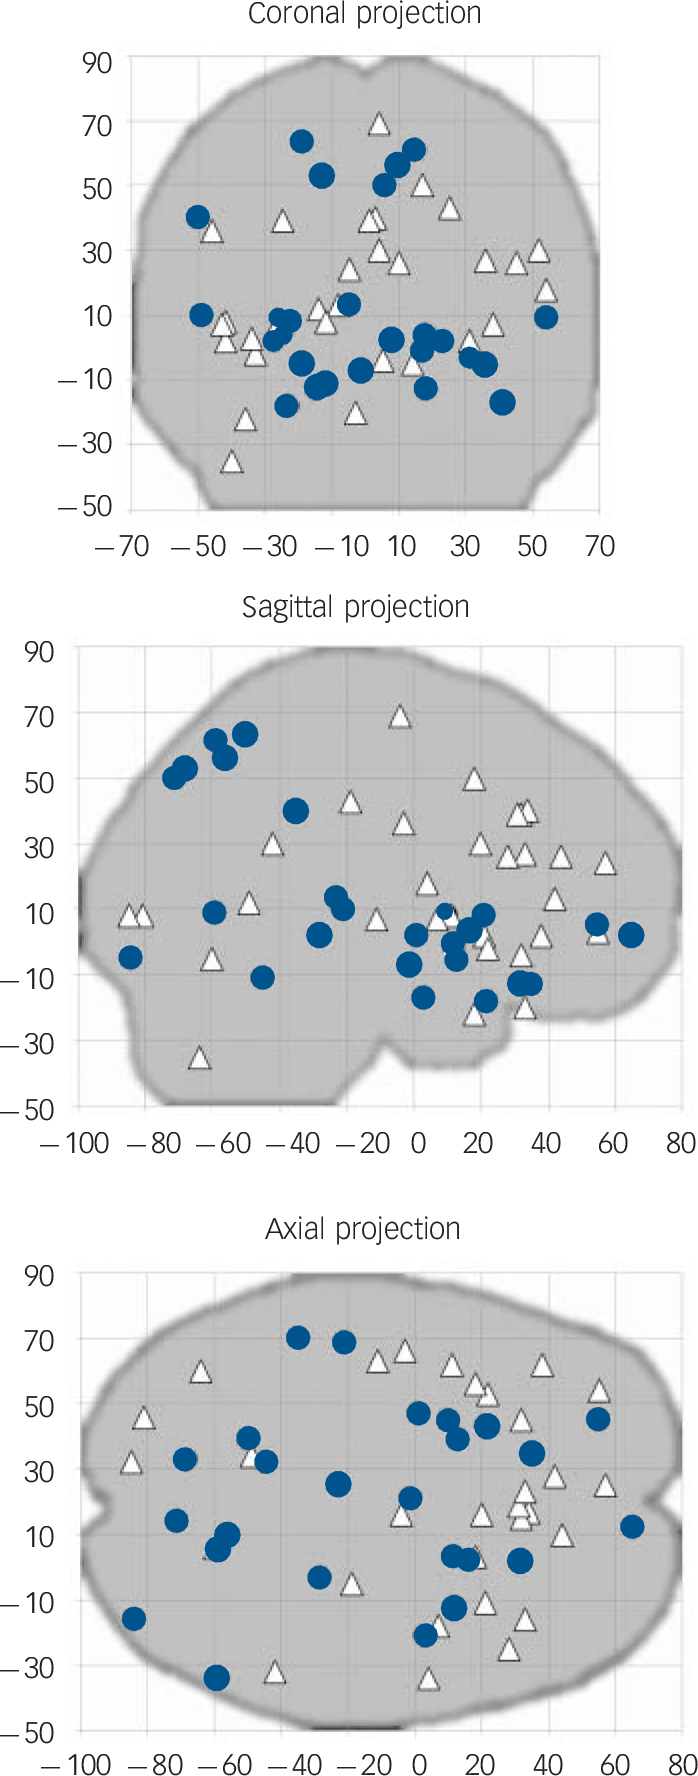
Coordinates for the SDM analyses were obtained from all the 12 studies representing 401 individuals with OCD and 376 healthy controls (Fig.1). As shown in Table 2 and Fig. 2, individuals with OCD had significant bilateral (larger on the left) grey matter volume increases in the lenticular nucleus (mainly ventral anterior putamen) extending to the caudate nucleus, as well as in a small region in the right superior parietal lobule (Brodmann area 7). Participants with OCD also showed significant bilateral (larger on the right) grey matter volume decreases in dorsal medial frontal/anterior cingulate gyri, extending to the supplementary motor area and frontal eye fields (Brodmann area 8, 32, 6 and 9).
Regional differences in grey matter volume between individuals with obsessive–compulsive disorder and healthy controls
| Maximum | Cluster | |||||||
|---|---|---|---|---|---|---|---|---|
| Talairach coordinates | SDM value | Uncorrected P | Number of voxels | Breakdown (number of voxels) a | ||||
| Clusters of increased grey matter | ||||||||
| Left lenticular nucleus (mainly anterior putamen) | -18, 8, 0 | 0.248 | 0.000005 | 506 | Left lenticular nucleus (464) | |||
| Left caudate nucleus (41) | ||||||||
| Left subcallosal gyrus (1) | ||||||||
| Right superior parietal lobule and precuneus | 14, -60, 62 | 0.210 | 0.00009 | 75 | Right Brodmann area 7 (75) | |||
| Right lenticular nucleus (mainly anterior putamen) | 14, 10, -2 | 0.187 | 0.0003 | 68 | Right lenticular nucleus (54) | |||
| Right caudate nucleus (14) | ||||||||
| Clusters of decreased grey matter | ||||||||
| Right/left dorsal medial frontal gyri/anterior cingulate gyri | 4, 28, 36 | -0.278 | 0.00002 | 385 | Right Brodmann area 8 (93) | |||
| Right Brodmann area 32 (96) | ||||||||
| Right Brodmann area 6 (34) | ||||||||
| Right Brodmann area 9 (22) | ||||||||
| Left Brodmann area 8 (59) | ||||||||
| Left Brodmann area 32 (41) | ||||||||
| Left Brodmann area 6 (26) | ||||||||
| Left Brodmann area 9 (14) | ||||||||
SDM, signed differential mapping.
a. Brodmann area 6: supplementary motor cortex; Brodmann area 7: somatosensory association cortex; Brodmann area 8: frontal eye fields; Brodmann area 9: dorsal medial frontal gyrus; Brodmann area 32: dorsal anterior cingulate gyrus. All voxels with P < 0.001 uncorrected (SDM value thresholds of 0.163 for increases and of -0.183 for decreases). No significant voxels were found after the false discovery rate correction.
Descriptive analysis of quartiles
Decreases of grey matter in dorsal mediofrontal/anterior cingulate gyri were detected in the median analysis (maximum at Talairach (20, 32, 38), SDM −0.179), meaning that most of the studies had found some degree of decreased grey matter in the region. These findings were rather large as expected in the first quartile analysis (maximum at Talairach (2, 32, 40), SDM −0.978), including several nearby clusters.
Increases of grey matter in the left lenticular nucleus were only detected in the third quartile analysis (maximum at Talairach (–22, 16, 2), SDM 0.743), meaning that at least 25% but less than 50% of the studies had found some degree of increased grey matter in this region. In this analysis, no changes of grey matter were detected in the right lenticular nucleus.
Plots of all the significant coordinates included in the meta-analysis (n = 12 studies). Reported peak coordinates of grey matter increases (obsessive–compulsive disorder (OCD)>controls; blue circles) and decreases (OCD<controls; white triangles) have been projected to the sagittal, coronal and axial planes.
Sensitivity analysis
As seen in Table 3, whole-brain jackknife sensitivity analysis showed that the grey matter increase in left lenticular nucleus and grey matter decrease in bilateral dorsal mediofrontal/anterior cingulate gyri were highly replicable, as these findings were preserved throughout all the 12 combinations of 11 studies. Grey matter increases in right lenticular nucleus and superior parietal cortex failed to emerge in two of the study combinations. No additional significant clusters were found in any of the 12 study combinations.
Analyses of subgroups and sensitivity analyses a
R, right; L, left; dMFG, dorsal medial frontal gyri; ACG, anterior cingulate gyri;
a. Yes, brain region remains significantly increased/decreased in the subgroup analysis or after exclusion of the study in the jackknife analysis; no, brain region is no longer significantly increased/decreased in the subgroup analysis or after exclusion of the study in the jackknife analysis.
b. Maximum of the dorsal mediofrontal/anterior cingulate gyri cluster was displaced to right cingulate gyrus when only studies using a 12mm smoothing kernel were included, or when either S7 or S9 was not included in the analysis.
c. Increases in bilateral lenticular nuclei were significant after the false discovery rate correction in the analysis of studies performing an additional modulation step.
d. Maximum of the right lenticular nucleus cluster was displaced to right caudate nucleus when S6 was not included in the analysis.
Analyses of subgroups
The above results remained largely unchanged when the analyses were repeated and limited to methodologically homogenous groups of studies (Table 3). Only one additional significant cluster in the left cerebellum (maximum at Talairach (–12, −46, −12), SDM 0.179, P = 0.0002) emerged in the subanalysis of studies reporting coordinates corrected for multiple comparisons.
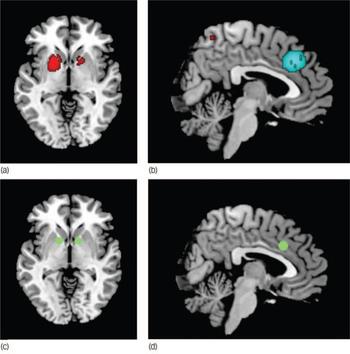
Main increased (a) and decreased (b) grey matter regions in individuals with obsessive–compulsive disorder compared with healthy controls, and usual targets of capsulotomy/deep brain stimulation (c) and cingulotomy (d). (a) Increased grey matter in lenticular nuclei and caudate, (b) decreased grey matter in dorsal mediofrontal/anterior cingulate gyri, (c) target of capsulotomy and deep brain stimulation, (d) target of cingulotomy. Images (a) and (c) are shown in the axial plane (Z = −2); images (b) and (d) are shown in the sagittal plane (X = 4). Note that the clusters of grey matter increase in bilateral lenticular nuclei include the usual targets of capsulotomy and deep brain stimulation. Similarly, the meta-analytic cluster of grey matter decrease in dorsal mediofrontal gyri/anterior cingulate gyri includes the usual target of cingulotomy. Significant clusters and surgery targets have been overlaid to an MRIcron template for Linux (www.mricro.com/mricron) for display purposes only.
Meta-regression
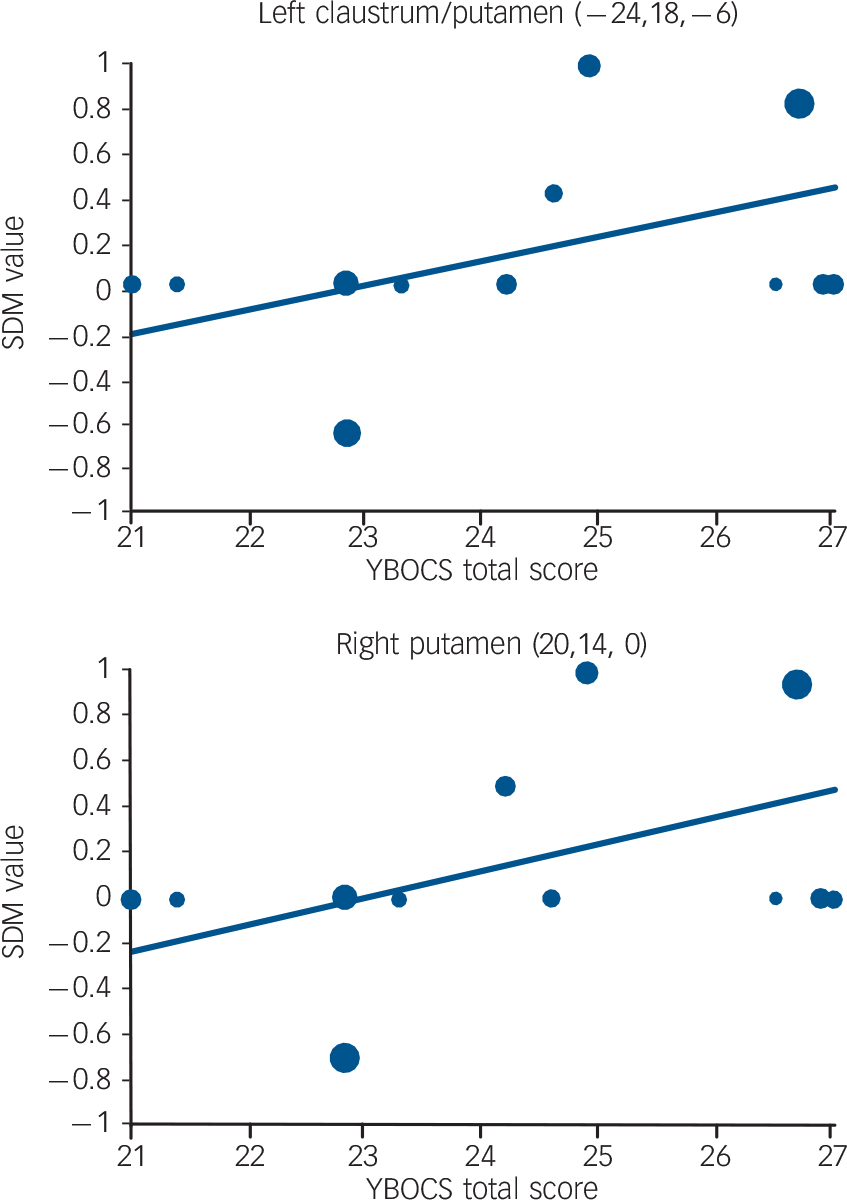
Regression analyses showed that mean age (available in all the studies) was not associated with OCD-related grey matter changes, at least linearly (slope smallest P = 0.0004). Symptom severity (YBOCS scores, available in all the studies) was associated with increased grey matter volumes in bilateral lenticular nuclei (left maximum slightly displaced to claustrum, Talairach (–24, 18, −6) and (20, 14, 0), SDM +0.106 and + 0.116 per 1 point increase in mean YBOCS score, P = 0.0001 and P = 0.00004), with predicted grey matter increase in studies including individuals with more severe symptoms (maxima at Talairach (–20, 14, −4) and (18, 12, 0), SDM 0.475 and 0.482, P = 0.000001 and P = 0.0000007) (Fig. 3).
The reported percentage of participants with comorbid major depressive disorder (available in all the studies but one, Riffkin et al) Reference Riffkin, Yucel, Maruff, Wood, Soulsby and Olver25 was found to be negatively associated with grey matter volumes in the right superior parietal lobule (maximum at Talairach (14, −58, 62), SDM −0.146 per 10% increase in the percentage of people with comorbid major depressive disorder, P = 0.00014), with predicted grey matter increase in studies reporting no individuals with comorbid major depressive disorder (maximum at Talairach (14, −60, 62), SDM 0.502, P = 0.000004). No effect of current antidepressant medication (available in all the studies) was detected (slope smallest P = 0.003).
Discussion
To our knowledge, this is the first meta-analysis of voxel-based morphometry studies of grey matter volume in OCD. The study is timely given that a sufficient number of high-quality studies have only recently become available. The main strengths of the study are the unbiased inclusion of published as well as unpublished studies, even if their results were negative (i.e. when no significant differences between people with OCD and controls were found), and the development and implementation of a new improved voxel-wise meta-analytic method. In order to facilitate replication and further analyses by other colleagues, we have also developed an online database, which contains all the data and methodological details from every study included in this meta-analysis, and is readily accessible at www.sdmproject.com/database/.
Meta-regression results showing an association between symptom severity (mean Yale–Brown Obsessive–Compulsive Scale (YBOCS) scores) and grey matter volume in left and right putamen. Each study is represented as a dot, with larger dots symbolising greater sample sizes. The regression line (meta-regression signed differential mapping (SDM) slope) is presented as a straight line. Note that the meta-regression SDM value is derived from the proportion of studies that reported grey matter changes near the voxel, so it is expected that the values of some of the studies are at 0 or near ±1 (instead of being close to the line).
The main findings were that individuals with OCD had increased bilateral regional grey matter volumes in the lenticular nucleus (mainly ventral anterior putamen) extending to the caudate nucleus, as well as decreased bilateral regional grey matter volumes in dorsal mediofrontal/anterior cingulate gyri, extending to the supplementary motor area and frontal eye fields (Brodmann area 8, 32, 6 and 9). Descriptive analysis of quartiles further revealed that most of the studies had found some degree of grey matter decrease in dorsal mediofrontal/anterior cingulate gyri and at least 25% of the studies had found some degree of grey matter increase in left lenticular region. The findings remained largely unchanged when each study was removed from the analyses ‘only one at the time’ (jackknife sensitivity analysis), as well as when methodologically homogeneous studies were analysed separately, thus adding to the robustness of the findings. Current use of antidepressant medication did not influence the results.
The basal ganglia have long been hypothesised to play a key role in the mediation of obsessive–compulsive symptoms. Reference Rapoport and Wise32 Indirect evidence is available from focal lesion studies, disorders of known basal ganglia pathology and, more recently, from neuroimaging studies. Reference Baxter, Saxena, Brody, Ackermann, Colgan and Schwartz33–Reference Mataix-Cols and van den Heuvel35 Structural neuroimaging studies have, however, been remarkably inconsistent, possibly because of the lack of sufficient sample sizes and methodological differences between the studies. This voxel-wise meta-analysis, which partially overcomes some of these problems, confirms that OCD is characterised by increased regional grey matter volumes in the basal ganglia, particularly the ventral, anterior part of the putamen, but also the caudate nucleus. Furthermore, meta-regression analyses showed that studies that included individuals with more severe OCD (YBOCS scores) were significantly more likely to report increased grey matter volumes in these regions.
The dorsal mediofrontal/anterior cingulate gyri region has also been implicated (usually hyperactive) in a wide range of functional neuroimaging studies in OCD, including resting state studies, Reference Swedo, Schapiro, Grady, Cheslow, Leonard and Kumar36,Reference Perani, Colombo, Bressi, Bonfanti, Grassi and Scarone37 symptom provocation studies, Reference Rauch, Jenike, Alpert, Baer, Breiter and Savage38–Reference Mataix-Cols, Wooderson, Lawrence, Brammer, Speckens and Phillips40 and studies employing tasks requiring inhibitory control. Reference Fitzgerald, Welsh, Gehring, Abelson, Himle and Liberzon41–Reference Maltby, Tolin, Worhunsky, O'Keefe and Kiehl44 An important study by Yucel et al Reference Yucel, Harrison, Wood, Fornito, Wellard and Pujol43 found reduced concentrations of neuronal N-acetylaspartate in the dorsal anterior cingulate gyri of people with OCD, which was inversely correlated with the level of activation in this region during a task of inhibitory control. The authors suggested that hyperactivations in the dorsal anterior cingulate gyri might therefore represent a secondary, compensatory response to neural abnormalities in this region. Our findings of reduced grey matter volume in this region are entirely consistent with this view and support current neuropsychological models of OCD whereby deficits in inhibitory processes would be primarily implicated in the disorder. Reference Chamberlain, Blackwell, Fineberg, Robbins and Sahakian45
It is striking that the regions identified in this meta-analysis are anatomically very close to the targets of surgical treatments for treatment-refractory OCD. Indeed, our maxima of grey matter increase in anterior putamen (Fig. 2a) are situated only 2–13 mm mainly laterorostrally from the usual targets of capsulotomy and deep brain stimulation (Fig. 2c). Reference Rauch, Dougherty, Malone, Rezai, Friehs and Fischman46–Reference Nuttin, Gabriels, Cosyns, Meyerson, Andreewitch and Sunaert49 Similarly, our maxima of grey matter decrease in dorsal mediofrontal/anterior cingulate gyri (Fig. 2b) are situated just 2–12 mm mainly mediorostrally from the usual targets of cingulotomy (Fig. 2d). Reference Dougherty, Baer, Cosgrove, Cassem, Price and Nierenberg50–Reference Kim, Lee and Choi55
Taken together, these converging lines of evidence suggest that the basal ganglia and the dorsal mediofrontal/anterior cingulate gyri are implicated in OCD. Studies in animals have shown that these two structures have dense direct anatomical connections. Reference Alexander, Crutcher and DeLong56,Reference Kunishio and Haber57
The evidence in humans is more indirect. For example, in one study, individuals undergoing cingulotomy experienced significant reductions in the volume of the caudate nucleus several months post-operatively, suggesting that there are direct connections between these structures in the human brain. Reference Rauch, Kim, Makris, Cosgrove, Cassem and Savage58 Some of the analyses also revealed increased grey matter volume in the right parietal cortex in people with OCD, although this finding was less robust. The meta-regression analyses further suggested that differences in this region may be particularly apparent in individuals with OCD but without comorbid depression. Although the parietal cortex is not a region traditionally implicated in OCD, recent reports suggest that its importance may have been overlooked. Reference Menzies, Chamberlain, Laird, Thelen, Sahakian and Bullmore18,Reference van den Heuvel, Remijnse, Mataix-Cols, Vrenken, Groenewegen and Uylings27,Reference Menzies, Achard, Chamberlain, Fineberg, Chen and del Campo59,Reference Menzies, Williams, Chamberlain, Ooi, Fineberg and Suckling60 Our results would support this possibility, particularly in individuals without comorbid depression.
Interestingly, this meta-analysis did not reveal significant between-group differences in the orbitofrontal cortex, a region that has been consistently implicated in functional neuroimaging studies of OCD and constitutes the basis of the most widely accepted neurobiological model of OCD. Reference Baxter, Saxena, Brody, Ackermann, Colgan and Schwartz33–Reference Mataix-Cols and van den Heuvel35 There are several plausible explanations, which are not necessarily mutually exclusive, for the lack of structural changes in this structure. First, only 3 of the 12 studies included in this meta-analysis identified changes in this region. Reference Pujol, Soriano-Mas, Alonso, Cardoner, Menchon and Deus24,Reference Szeszko, Christian, Macmaster, Lencz, Mirza and Taormina30,Reference Yoo, Roh, Choi, Kang, Ha and Lee31 Although this may be partially a result of technical difficulties in obtaining high-quality images in this region, this seems unlikely since many functional neuroimaging studies, which are also susceptible to these same technical difficulties, have more frequently reported differences in activation in this region between participants with OCD and controls. Second, the precise location and direction of the changes in this region was heterogeneous across studies, with one study reporting grey matter reductions in lateral aspects of the orbitofrontal cortex, Reference Yoo, Roh, Choi, Kang, Ha and Lee31 one study reporting grey matter reductions in primarily medial aspects of the orbitofrontal cortex Reference Pujol, Soriano-Mas, Alonso, Cardoner, Menchon and Deus24 and one paediatric study reporting increases rather than decreases of grey matter volume in this region. Reference Szeszko, Christian, Macmaster, Lencz, Mirza and Taormina30 The orbitofrontal cortex is indeed heterogeneous both in structure and function, and the precise role of its subterritories in OCD or its subtypes is unclear. Third, it is also possible that the recruitment of the orbitofrontal cortex in functional neuroimaging studies in OCD reflects secondary, perhaps compensatory, neural responses to cognitive or emotional challenges, rather than being crucially implicated in the aetiopathogenesis of the disorder. Although our results would support a dorsal prefrontostriatal, rather than an orbitofrontal cortex–striatal model of OCD, the role of the orbitofrontal cortex in the aetiopathogenesis of OCD cannot be fully ruled out.
This meta-analysis is unable to answer whether the reported changes precede the onset of the symptoms; that is, whether they represent a vulnerability factor for the development of OCD or whether they represent the consequence of a chronic illness. The fact that studies with participants with more severe OCD found greater changes in the basal ganglia could suggest the latter and some limited evidence supports this possibility. Indeed, some studies have reported volumetric reductions in subcortical brain structures following successful treatment with serotonin reuptake inhibitors in OCD. Reference Gilbert, Moore, Keshavan, Paulson, Narula and MacMaster61,Reference Rosenberg, MacMaster, Keshavan, Fitzgerald, Stewart and Moore62 On the other hand, recent reports of structural brain changes in unaffected first-degree relatives of people with OCD would suggest an underlying familial vulnerability that may be symptom-independent. Reference Menzies, Achard, Chamberlain, Fineberg, Chen and del Campo59,Reference Menzies, Williams, Chamberlain, Ooi, Fineberg and Suckling60 Only large developmental studies that examine the association between brain structure and symptom onset longitudinally will be able to answer this question fully.
Another question unanswered by this meta-analysis is whether the reported changes are specific to OCD or whether they may be common to other psychiatric disorders. Reference Mataix-Cols and van den Heuvel35 Of particular relevance to current discussions regarding the future classification of OCD in the next edition of the DSM is whether these changes are also seen in other anxiety disorders. Obsessive–compulsive disorder experts disagree on whether OCD should remain as one of the anxiety disorders or whether it should be classified separately in the DSM–V. Reference Mataix-Cols, Pertusa and Leckman7 A voxel-based meta-analytical comparison of structural and functional neuroimaging studies in OCD v. other anxiety disorders may shed some light on this contentious question.
Limitations
It is important to highlight several limitations of this study, some of which are inherent to all meta-analytical approaches. First, voxel-based meta-analyses are based on summarised (i.e. coordinates from published studies) rather than raw data and this may result in less accurate results. Reference Salimi-Khorshidi, Smith, Keltner, Wager and Nichols17 However, obtaining and analysing the raw images from these studies is logistically and technically difficult. Second, despite our attempts to contact worldwide OCD experts and include as many unpublished voxel-based morphometry studies as possible, even if their results were negative, the possibility of publication bias cannot be entirely ruled out. Third, it must be noted that normal brain regions close to abnormal brain regions may artificially appear to be abnormal. Therefore, the breakdown of a cluster should not be understood as ‘all these regions are abnormal’ but as ‘one or more of these regions are abnormal’. Fourth, most of the results were only significant before correction for multiple comparisons by the false discovery rate. However, in previous simulation work, we established that uncorrected P<0.001 or even 0.002 was, in our method, empirically equivalent to corrected P<0.05. Fifth, as mentioned above, our regression analyses should be taken cautiously because they included a small number of studies and variability in the data was limited. Similarly, we could not perform subgroup analyses by specific symptom subtypes or dimensions. This is important since OCD is likely to be aetiologically heterogeneous Reference Mataix-Cols, Rosario-Campos and Leckman63 and preliminary evidence suggests that each of the major symptom dimensions of OCD may have partially distinct neural substrates. Reference van den Heuvel, Remijnse, Mataix-Cols, Vrenken, Groenewegen and Uylings27,Reference Mataix-Cols, Wooderson, Lawrence, Brammer, Speckens and Phillips40,Reference Saxena, Brody, Maidment, Smith, Zohrabi and Katz64,Reference An, Mataix-Cols, Lawrence, Wooderson, Giampietro and Speckens65
Appendix
Main features of the signed differential mapping (SDM) method for voxel-based meta-analysis of neuroimaging data
Features adapted from the activation likelihood estimate (ALE) Reference Turkeltaub, Eden, Jones and Zeffiro12
-
(a) The value assigned to each voxel is higher as the voxel is closer to the original coordinate.
Features adapted from multilevel kernel density analysis (MKDA) Reference Wager, Lindquist and Kaplan13
-
(a) Voxel values are limited to be as high as the voxel at the coordinate of a maximum in order to avoid biases towards studies reporting various coordinates in close proximity.
-
(b) Meta-analytic values are estimates of the values in the population of studies, unlike previous mathematically inconsistent estimators.
-
(c) Meta-analytic values are weighted by the sample size of the studies, i.e. large samples contribute more.
Novel features of SDM
-
(a) Only those coordinates which are significant at the whole-brain level are included in order to avoid biases towards a priori brain regions.
-
(b) Coordinates from analyses with correction for multiple comparisons are preferred.
-
(c) The full-width at half maximum of the kernel is set at 25 mm in order to control for false-positive results.
-
(d) Both positive and negative coordinates are reconstructed in the same map in order to avoid that a particular voxel can erroneously appear to be positive and negative at the same time.
-
(e) The new descriptive analysis of quartiles overcomes the unclear contribution of studies reporting no differences in the standard randomisation test.
-
(f) Analyses of subgroups are expanded and regression is introduced for clinical quantitative variables in order to better analyse the methodological and clinical heterogeneity of the included studies.
Limitations (of all existing methods)
-
(a) Only summarised data (i.e. coordinates) are included from the studies – an analysis using all the raw data from the included studies would probably be more accurate.
-
(b) The breakdown of a cluster should not be understood as ‘all these regions are abnormal’ but as ‘one or more of these regions are abnormal’, because normal brain regions close to abnormal brain regions may artificially appear to be abnormal.
Acknowledgements
We thank all the authors of the included studies and especially Drs Busatto, Kwon, Soriano-Mas and Szeszko for kindly sharing their unpublished data for inclusion in this meta-analysis.


eLetters
No eLetters have been published for this article.