

Section 1. Forecast overview and policy recommendations
With less than two months to go before the Article 50 EU exit date, the spectrum of Brexit outcomes remains as wide as ever. The House of Commons overwhelmingly rejected the government's exit deal and on 30 January the Prime Minister signalled her intention to renegotiate the deal with the European Union (EU). If agreement cannot be reached then, under current law, the UK will leave the EU on 29 March without a deal. Exiting without a deal is nevertheless far from inevitable for the simple reason that Parliament has rejected a no-deal Brexit in an amendment on 29 January.
These developments, together with the weight of contradictions that afflicts all plausible scenarios, keep open the likelihood of any of them emerging. This is not to say that the impasse cannot be broken (Reference Aidt, Chadha and SabourianAidt et al., 2019) but until a mechanism to resolve these contradictions emerges, there is a non-negligible possibility of a wide variety of outcomes ranging from an extension of the Article 50 deadline, a second referendum or citizen assemblies,Footnote 2 membership of the European Economic Area, no deal or even a version of the government's deal emerging as the final outcome. Some of these will not be known until well after March 2019 for the simple reason that negotiations related to the future relationship will only begin after the UK exits the EU.
The impact of these different scenarios on GDP growth and other key macroeconomic metrics is so large some may legitimately ask why bother with forecasts? To us, the answer is clear: a projection gives us a scenario or set of scenarios to evaluate, think about and discuss. At the very least, a forecast enables us to think about possible futures and plan accordingly (Reference ChadhaChadha, 2017).
Policymaking and planning have to continue even if the economic and political backdrop is uncertain and, in fact, it is under these challenging circumstances that the set of assumptions behind the forecasts should be most clearly explained.
It is against this uncertain backdrop that, in previous Reviews, NIESR has published multiple economic scenarios that together capture that wide range of plausible Brexit outcomes (Reference Hantzsche, Kara and YoungHantzsche et al., 2018). Our central forecast has been conditioned on a soft Brexit where the UK and EU maintain a high level of market access for goods and services in each other's markets during and after a transition period. This scenario has been contrasted with a hard (orderly) Brexit that encompasses scenarios where the UK exits without a deal in place.
Once again we are confronted with the choice of selecting a plausible central or most likely scenario. Without clear direction and clarity, we have maintained our soft Brexit assumption, and like before, this is not because we are confident that this scenario will materialise, it is because the Phase 1 agreement between the UK and the EU which prioritises peace in Ireland and explicitly draws a link between peace and open and frictionless borders. For short-term forecast purposes, the scenario is consistent with any deal as long as there is a transition. As noted above, the negotiations related to the future relationship between the UK and the EU will only begin after the UK exits in March and as such the fog of uncertainty that has afflicted the economy since the 2016 EU referendum will likely persist. We have incorporated a heightened level of uncertainty into our central scenario which is weighing down on our forecast for business investment (Box A).
Recent information from business surveys and the financial markets suggests that the intensity of Brexit uncertainty is rising. The exchange rate has been under pressure, depending on the prospects for a hard Brexit, investment spending has slowed sharply according to the Decision Maker Panel (Bloom et al., 2019), consumer confidence has fallen on the GfK consumer confidence survey and both government and corporates appear to have activated contingency plans. At the same time, there are signs that global economic growth is moderating. The World Overview chapter in this Review concludes that the global economy and the Euro Area will lose momentum in 2019 and 2020. Against this uncertain backdrop, UK economic growth slowed in the final quarter of 2018 to 0.3 per cent from 0.6 per cent in the previous quarter according to the NIESR GDP Tracker and is forecast to remain at 0.3 per cent in the first quarter of this year. Our central scenario has GDP growth at 1.5 per cent in 2019, revised down from 1.9 per cent previously.
The slowdown we observed in late 2018 has to be seen in a broader context where UK unemployment is at a record low, employment is at a record high, wage growth higher and public finance data repeatedly surprising to the upside. Looking further ahead, on our central scenario, we would expect the economy to expand at a speed close to its potential in 2020 and beyond and for inflation to settle at close to its target rate over this period. It is against this backdrop that we have conditioned our forecast on a gentle upward path for Bank Rate. As before, we have Bank Rate rising by 25 basis points every six months and assume the next increase will take place in August 2019.
We contrast this ‘good’ central scenario with a no-deal scenario (Box B). We should expect policymakers to respond with contingency plans and stimulus measures, where possible, to mitigate any short-run disruption (Reference ChadhaChadha, 2018). There are different flavours of no-deal and policy can respond according to the specific circumstance. At one end of the spectrum is a disruptive outcome where the UK is cut off in much the same way that Iceland was in 2010 after the eruption of Eyjafjallajökull. The results shown in figure 1 are for a more benign scenario where trade barriers restrict, but do not stop, the movement of goods and services, and financial markets continue to function.
UK GDP growth against G7 growth

We present two versions of this scenario, one where policy responds actively to ease the immediate disruptions to output (No-deal Brexit, accommodative policy), as was the case in 1992 when sterling fell out of the Exchange Rate Mechanism and again in wake of the EU referendum result in 2016 when the Bank of England and HM Treasury supported economic growth in spite of higher inflation. Under this scenario where policy helps support short-term activity, the Bank of England is assumed to set Bank Rate in line with the baseline scenario in spite of higher inflation and, at the same time, the Chancellor lowers taxes.
The other no-deal scenario represented in figure 1 assumes monetary and fiscal policy respond to standard rules which, in this case, has the central bank raising Bank Rate in response to higher inflation (No-deal, non-accommodative response).
In the October Budget, the government announced a rise in public spending, predominantly targeted at filling immediate gaps in health care spending. It is our judgement that, independent of the path Brexit will take, planned spending increases will not be enough to accommodate sustainably the needs of an ageing population and to maintain the quality of public services. We therefore base our forecast on the assumption that the share of government spending in total output remains stable at its long-run average over the forecast horizon, compared to a falling share on the government's plans. With that level of spending and no changes to taxes, the public sector budget deficit continues to be around 2 per cent of GDP in our central forecast. Dealing with a more disruptive Brexit would in our view require additional fiscal effort.
Figures 2 and 3 present our assessment of the risks to GDP growth and inflation. Figure 2 for GDP growth clearly shows that the risk to our central forecast is skewed to the downside and that is mainly because of Brexit.
GDP growth fan chart (per cent per annum)

Inflation fan chart (per cent per annum)

These forecasts can be benchmarked against those published by the Warwick Business School Forecasting System, which combines state-of-the-art statistical models weighted solely by the forecasting performance of each model (Box C). On their judgement-free forecasts, year-on-year real GDP growth for the final quarter of 2019 is most likely to be somewhere between 1–2 per cent (NIESR = 1.5 per cent) but their forecast is skewed to the upside, while ours points to a downside risk. The growth forecast for the final quarter of 2020 is expected to be between 2–3 per cent compared with the NIESR forecast of 1.7 per cent. The main reason for the different assessment of risks is because the WBSFS analysis is driven by statistical models that are weighted together solely by their historical forecasting performance whereas the skew on the NIESR forecast is based on expert judgement and consistent with the forecast narrative.
Similarly, the WBSFS model points to CPI inflation between 2–3 per cent as the most likely outcome for both the final quarters of 2018 and 2019. On our forecast, inflation settles at the target rate of 2 per cent for the same period and is skewed to the upside because of Brexit risks.
Public finances
Recent developments
Public finances continued to be better than expected in the final quarter of 2018, with public sector borrowing undershooting borrowing over the same period in 2017 by £13 billion and market expectations by £7 billion (figure 4). Between April and December 2018, the government borrowed £36 billion, the lowest over a comparable period in 16 years. For the financial year as whole, the Office for Budget Responsibility (Reference ChadhaOBR, October 2018) expects borrowing to fall to £26 billion, or 1.2 per cent of GDP, while independent forecasters surveyed by HM Treasury (2019) in January expect £29 billion. Public sector net debt in December remained at 84 per cent of GDP, a decrease of 0.5 percentage points compared to a year earlier. The more favourable state of public finances can in part be explained by better-than-expected labour market outcomes, which increased the tax base and reduced social security spending. It may signal that GDP growth has been underestimated. For a discussion of changes in the fiscal outlook in response to revisions to economic data and forecasts see Reference Chadha, Hantzsche, Pabst, Lazarowicz and YoungChadha et al. (2018a).
Surprises to public sector net borrowing in 2018–19 to date

In October, the OBR provided a revised fiscal forecast that, prior to taking new policy measures into account, implied that public sector net borrowing as a percentage of GDP would be 0.7 percentage points smaller on average than expected in March 2018 for the period 2018–19 to 2022–23. The downward revision reflected a more optimistic judgement that currently strong tax receipts as a share of economic output persist over the forecast horizon as well as more optimistic assumptions about unemployment, revised down from an average of 4.6 per cent of the labour force over 2019 to 2022 to an average of 3.8 per cent, boosting tax receipts and reducing welfare payments.
As we anticipated in our November Review, the government used the additional fiscal space to announce new spending measures, adding an average of £13 billion per year to borrowing between 2018–19 and 2023–24. The largest part of this increase reflected an increase in spending on the National Health Service in England (and knock-on effects for devolved administrations), summing up to £27.6 billion a year by 2023–24. Downward revisions to borrowing due to more optimistic economic forecasts and upward revisions due to new spending measures on the OBR's calculations nearly cancel each other out, such that forecast public sector net borrowing as a share of GDP remained at an average of 1 per cent a year, only 0.2 percentage points smaller than the OBR had forecast in March 2018 (figure 5). Public sector net debt was projected by the OBR to fall to 74.1 per cent of GDP by 2023–24, at a somewhat faster pace than previously expected.
Public sector net borrowing

Soft Brexit central forecast for public finances
Our public finances projection deviates from that of the OBR in two dimensions: our economic forecast and our judgement of public expenditure needs. The OBR continued to apply broad-brush judgements on productivity, trade and migration that average over different possible Brexit outcomes. By contrast, our central forecast is based on a soft Brexit accompanied by elevated levels of uncertainty during the first half of 2019 (Box A). While differences between our real GDP and inflation forecasts are small relative to the OBR's, we hold less optimistic assumptions about the unemployment rate (while forecasting somewhat stronger wage growth).
At the same time, we believe that additional spending measures may suffice to fill immediate gaps in health care spending but will not be enough to accommodate sustainably the needs of an ageing population and maintain the quality of public services in the long run (Reference Hantzsche and YoungHantzsche and Young, 2018). We therefore assume that total managed expenditure at a minimum will have to remain close to its long-run average of 38–39 per cent of GDP, rather than fall below 38 per cent as planned by the government.
These assumptions imply that, on average over 2019–20 to 2023–24, the government will have an additional £30 billion per year at hand to meet rising spending needs. It also means that the public deficit will remain elevated for longer. We forecast public sector net borrowing to stay around 2 per cent over the forecast horizon (figure 5). Public sector net debt is projected to reach around 73 per cent of GDP by 2023–24, which is similar to the OBR's outlook given that we forecast nominal GDP to be around 1 per cent higher over that period.
Risks to the forecast
Were the UK to exit the EU without a deal in March, we would expect a sharper slowdown in economic activity than in the central case. How much the economy responds would depend on the extent to which policy steps in and eases the transition to a new trading equilibrium (see discussion in Box B). Figure 5 illustrates that, all other spending commitments held equal, an active fiscal policy intervention that would lift borrowing as a share of GDP by 2 percentage points by 2023–4, or £50–60 billion, in addition to the £500 million already earmarked for Brexit preparations in the 2018 Budget for 2019–20.
Revision of the fiscal policy framework?
The government has set itself a number of fiscal targets. The targets constrain spending of government departments in the short run but are by no means necessarily optimal from a general welfare point of view and have been changed frequently in the past, reflecting different fiscal requirements in the aftermath of the financial crisis and in the face of subdued productivity growth (for the latter see research articles published in this Review). The fiscal mandate requires the government to reduce the cyclically adjusted deficit to below 2 per cent of GDP by 2020–21. On our central forecast, using current definitions of the public deficit and assuming growth close to potential, this is achievable, as is the supplementary target of having the share of net debt over GDP fall by 2020–21. However, meeting the so-called fiscal objective of achieving overall fiscal balance by the middle of the next decade does not look likely without tax increases. A no-deal Brexit would make it much harder to meet the fiscal mandate in the short run.
We have argued before that a more comprehensive review of the current fiscal framework will be needed that also includes a review of the tax system. In our view, the rise in future spending needs and a preference for balancing the budget will require additional tax revenue that cannot be raised with increases in single tax rates alone. Instead, a comprehensive overhaul of taxation and how the government charges for public services is needed that aims at raising revenue more efficiently and equitably than under the current system. The need for such a view is likely to become more urgent as a consequence of a significant change to the accounting treatment of student loans.
In December, the Office for National Statistics announced a change to the treatment of student loans in the national accounts and public finance statistics from September 2019 onwards (Reference ChadhaONS, 2018). This will have important implications for headline fiscal figures. Currently student loans enter official statistics as any other loans provided by the government. However, around 70 per cent of loans are expected to be cancelled rather than repaid, mainly in cases where graduate earnings remain below the earnings threshold for the entire 30-year period relevant for repayment. Although the expected loss is known at the outset, the current practice is to recognise the loss with a long delay and, as a result, the near-term deficit data is flattered. Furthermore, the government is able to sell off tranches of loans below nominal value without impacting government expenditure at any time. Instead, a partitioned approach will be applied in the future, treating student loans partly as genuine loans as some portion will be repaid and partly as capital transfers. While public sector net debt remains unaffected, given the cash flow is the same, the OBR (2018) estimates that this accounting change will increase public sector net borrowing figures by around £15 billion a year between 2018–19 and 2023–24. Figure 5 illustrates that our forecast for the fiscal deficit as a share of GDP would be around 0.6 percentage points larger, purely as a result of accounting changes. The government is very unlikely to tighten fiscal policy to accommodate the introduction of student loans in the deficit measure and will either raise the 2 per cent ceiling for the cyclically adjusted deficit that it has set for itself under the fiscal mandate or ignore the breach if it is temporary. The Chancellor may use the Spring Statement on 13 March to clarify his position on the fiscal rules.
Monetary policy
We now expect the timing of the next increase in Bank Rate to be pushed back from February to August, mainly because the fog of uncertainty around the UK's future relationship with the EU has intensified since our last forecast in November and is bearing down on economic activity. If the UK settles on a soft Brexit deal and some of that uncertainty fades, we recommend, as before, that the Bank of England Monetary Policy Committee (MPC) remains on a gradual and limited path of policy normalisation. Under our central forecast, which is conditioned on a soft Brexit scenario and a forecast for government spending that overshoots the OBR's projections, the MPC should take the next 25 basis point step in August, twelve months after the August 2018 rate increase.
Thereafter, and subject to the economy evolving broadly as in our central forecast, we recommend that Bank Rate rises by 25 basis points every six months so that it reaches 1.5 per cent by end-2020. With the policy rate still at levels that are close to historic lows, it is our view that a gradual increase will only serve to withdraw some of the remaining stimulus from the economy. At that point, we expect the Bank to start shrinking its balance sheet as bonds mature in line with the guidance issued in June last year (Bank of England, 2018). We assume that the Bank will not actively sell bonds back to the market.
The financial markets have persistently priced in a more gradual path of interest rate normalisation compared with ours (figure 6). The difference between our central forecast and the implied market path is likely to be due to the markets placing weight on downside risks that are not contained in our central forecast.
Market-implied paths for short-term interest rates and NIESR forecast

What if the UK exits the EU without a deal? In that case, the exchange rate would depreciate and that would generate some short-term inflation. In those circumstances, would the MPC raise Bank Rate in line with a standard monetary policy reaction function such as the Taylor Rule in line with its hard Brexit scenario or look through the spike in inflation and instead support economic growth?
In our view, the monetary policy response will depend on inflation expectations, wage growth and a judgement on the amount of spare capacity in the economy (Box B). If medium-term inflation expectations remain well anchored, the Bank of England would have the space to inject stimulus and support economic growth. If instead, inflation expectations, and more specifically wage growth, track short-term inflation higher, the Monetary Policy Committee would be obliged, under its mandate, to raise Bank Rate to keep inflation at target.
News since the November forecast
The main news from the economy since our last Review concerns the near-term outlook for UK economic growth. The intensification of Brexit uncertainty appears to have played an important role, particularly for investment spending. The latest vintage of ONS data shows business investment falling in the first three quarters of 2018, implying erosion in the future supply capacity of the economy. Surveys suggest that investment spending will remain weak for as long as the nature of the future relationship between the UK and the EU is unclear. Brexit-related worries have also permeated into consumer confidence and the housing market. Consumer confidence surveys, such as from GfK, continue to trend lower and the latest RICS housing market survey also points to lower prices and transaction volumes because of Brexit.
Some of that overall weakness in output is driven by the moderation in global growth and, in particular, Euro Area growth where specific one-off factors such as the disruption caused by the new emissions test appear to have played a role. The impact on the UK is most evident in the manufacturing sector where output loss was broad-based. Output fell in all the four sub-sectors of the manufacturing sector in the three months to November according to official data – the first time this has happened since October 2012.
Annual consumer price inflation has fallen since the November forecast to 2.3 per cent and is set to drop below the target rate of 2 per cent in the first quarter of this year on our central forecast. The most proximate reason for lower inflation is the fall in oil prices. The price of Brent crude is some 30 per cent lower in sterling terms compared with September and this will have a direct impact on petrol prices.
Against this, signs of a tightening labour market are building. The employment rate is at a post-1971 high and the unemployment rate has not been lower at any time since early-1975. Annual labour productivity growth slowed once again in the third quarter to just 0.2 per cent on the output per hour worked measure – the lowest four-quarter growth rate in two years. At the same time, annual growth in regular pay has strengthened from around 2.8 per cent in the middle of last year to 3.3 per cent in the latest data; the pick-up is driven by both private and public sector pay. Unit labour costs rose by 2.8 per cent in the third quarter of 2018 relative to a year earlier, as labour costs rose faster than the rate of growth of labour productivity (as measured by hours).
Looking ahead, we expect economic growth to recover from the current soft patch if the UK continues to uphold a favourable trading relationship with the EU. This, together with the low levels of unemployment and rising wages, will require a gradual increase in the Bank Rate and as such our forecast is conditioned on a 25 basis point rise in August 2018.
Financial stability and Brexit
At its November meeting, the Financial Policy Committee (FPC) held the countercyclical capital buffer (CCyb) rate unchanged at 1 per cent. As before, Brexit remains a key risk for the FPC and, according to the FPC, the 2018 stress test showed that the UK banks are in a position to serve UK households and businesses in the face of an intense shock that could be triggered by a disorderly Brexit where the UK exits EU without a deal and without a transition period.
Assumptions about Brexit
On 15 January 2019, Parliament rejected the withdrawal agreement and political declaration negotiated between the UK government and their EU counterpart with an overwhelming majority of 230 votes. As this Review goes to press, there appear to be two broad possibilities in the short term. The first is that the UK maintains a similar relationship with the EU over the next two or three years as it does now. The second is that there is a hard Brexit. An average forecast would not sufficiently reflect either of these possibilities (cf. Reference ChadhaChadha, 2018). We therefore continue to provide forecasts for two alternative sequences of possible events. Our central forecast is based on the assumption of a ‘soft’ Brexit preceded by elevated levels of uncertainty. From the range of alternative scenarios, we also provide a forecast for the case of an ‘orderly no deal’. This box explains the economic assumptions underlying both variants and sketches how they may come about.
Soft Brexit central forecast
In this scenario, the UK continues to have barrier-free access to the EU single market and customs union over most of our forecast horizon. This scenario would be broadly consistent with a number of political outcomes, including a two-year long transition, as specified in the withdrawal agreement, or an extension of the Article 50 period, independent of whether in the long run these options lead to a comprehensive free trade agreement between the UK and the EU, continued EU membership of the UK in a customs union with the EU and/or the single market, or a reversal of the decision to exit altogether. Given that the final outcome may not be known for some time, political uncertainty remains high in this scenario, in particular during the first half of 2019.
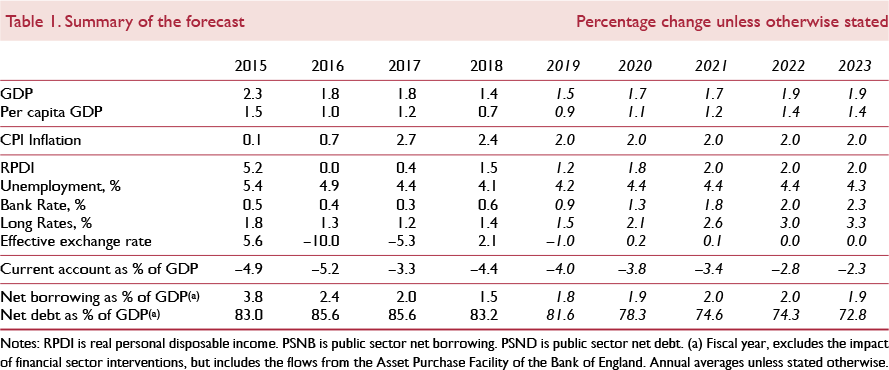
Table A1 summarises the key Brexit-related assumptions. As a result of elevated political uncertainty, investment decisions will be held back in the earlier parts of the year. The implementation of contingency measures will continue until soft Brexit emerges as the final outcome and thus, unproductive resources will be spent and stocks built up. We further apply negative residuals to export and import equations to reflect the fact that a share of exporters will refrain from renewing contracts with European counterparts and supply chains may be thinned out. Hiring is assumed to slow down somewhat in the first half of 2019 but freedom of movement continues and in the long run labour force growth is determined by population growth which develops according to principal population projections provided by the Office for National Statistics (ONS).
Orderly no-deal variant
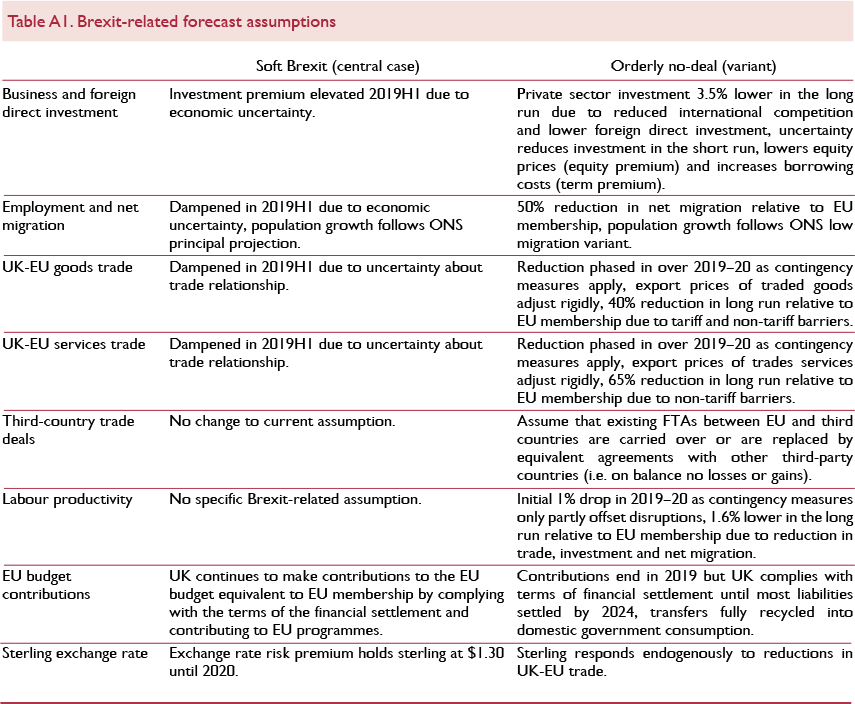
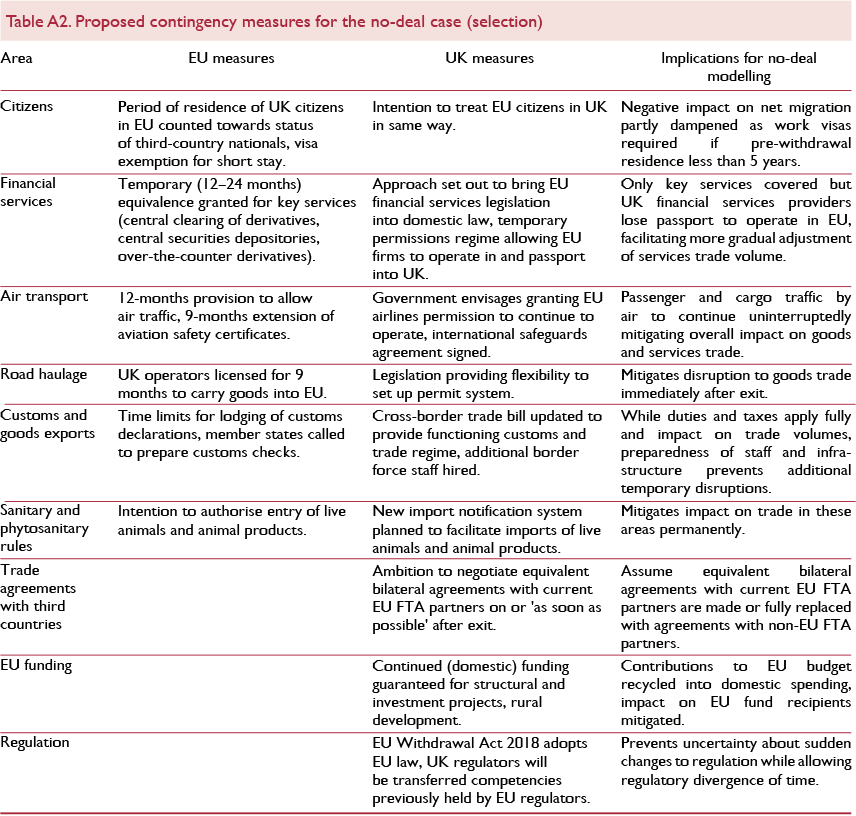
In this alternative scenario, the clock runs out without the government, Parliament or the EU agreeing on a deal. On 29 March, the UK reverts to trade under WTO terms for the foreseeable future. This would mean that customs duties are collected on UK borders and the regulatory regime of the EU single market no longer applies such that certain goods and services can no longer be exported. However, we assume that until the end of the Article 50 period, contingency planning will be stepped up. Both the UK government, the EU and member state governments have provided information to citizens and businesses, to assist them with withdrawal preparations (European Commission, 2018a, annex 3; Department for Exiting the European Union, 2018). In November, while it made clear that the UK would be treated as a third country, the European Commission proposed “a limited number of contingency measures to mitigate significant disruptions in some narrowly defined areas” (European Commission, 2018a), some of which the Commission started to implement in December (European Commission, 2018b). On 18 December, the UK government made no-deal preparations an operational priority accelerating legislation, and staffing and infrastructure decisions. Table A2 provides an overview of selected measures adopted or planned that will determine the economic impact of no deal in the short term. It is important to note that most of these measures would only be effective if reciprocated by both sides. A number of EU measures, for instance regarding financial services, are explicitly temporary and serve the purpose of allowing EU importers to switch from UK to EU suppliers. Putting procedures, infrastructure and staff in place to facilitate visa applications and customs checks will help mitigate temporary disruptions and queues but does not change the fact that freedom of movement will end, a number of services may no longer be tradable and the cross-border costs of goods trade will increase.
Long-run assumptions underlying our no-deal scenario are laid out in detail in Reference Hantzsche, Kara and YoungHantzsche et al. (2018).Footnote 1 We assume that goods trade with the EU will be 50 per cent smaller compared to continued EU membership, services trade will be 65 per cent smaller and foreign direct investment will be 24 per cent lower leading to overall business investment being 3.5 per cent lower (table A1, right column). We further assume that net migration halves and the combination of lower investment, reduced levels of international competition and the potential lack of skilled labour from abroad reduce productivity by 1.6 per cent in the long run. To reflect contingency measures announced by both sides and assuming reciprocal treatment, we phase in trade shocks gradually over 2019 and 2020 such that half of the total shock materialises within two years. We then allow for further gradual adjustment over the course of a decade to account for regulatory divergence over time. Economic uncertainty around the exit date is reflected in higher investment, equity and term premiums. The short-run impact of a no-deal Brexit depends very much on assumptions about monetary and fiscal policy which are discussed in Box B.
Notes
1 As discussed in Reference Hantzsche, Kara and YoungHantzsche et al. (2018), the baseline for our no-deal scenario is formed by a scenario in which the UK continues its membership of the European Union. Under the assumption that such a decision is made decisively in the first half of 2019, uncertainty is fully lifted, business investment rebounds from 2019 onwards, labour productivity growth picks up to just above 1.5 per cent a year and sterling appreciates to $1.40 by 2020 while growth in trade steadies. This allows us to base our no-deal assumptions on estimates about trade, foreign direct investment and productivity effects from the empirical literature which contrasts third-country status with EU membership rather than a soft Brexit case with uncertainty about trade priced on financial markets and reflected in trade and investment data.
This box was prepared by Arno Hantzsche.
Policy options for a no-deal Brexit
There is still a material risk that the UK leaves the EU at the end of March without a deal or a comprehensive transition arrangement in place. How will policymakers react to that scenario? Their response will depend on the scale and specific nature of the disruption and the reaction of financial markets to it (see also Reference ChadhaChadha, 2018). We focus here on the macroeconomics, i.e. the response of inflation and output to the Brexit shock and the mitigating action that the Chancellor and the Monetary Policy Committee might take to stabilise the economy. Our main conclusion is that policymakers have room to inject monetary and fiscal stimulus in order to stabilise output if inflation expectations and wage growth are anchored (and also thought to be anchored by policymakers) at a level that is consistent with the medium-term 2 per cent inflation target, and if fiscal rules are adjusted to allow for higher government spending. Our findings suggest that policymakers are in a position to help stabilise GDP growth in the short term but not in the medium and long term. This option would not be available in a scenario where wage growth picks up and policymakers believed that inflation expectations would be dislodged if monetary policy did not actively and immediately offset a Brexit-related spike in inflation. As such, the focus in this box lies on the short run and how policymakers can ease the transition of the economy to a new trading equilibrium by delaying some of the economic impact that is bound to materialise in the future. It complements our analysis of the long-run economic impact of a no-deal Brexit (Reference Hantzsche, Kara and YoungHantzsche et al., 2018). The long-run impact arises mainly from a slowdown in capital, employment and productivity growth and therefore leaves little room for monetary and conventional fiscal policy to respond.
We start with our central forecast which is conditioned on a soft Brexit outcome and apply a no-deal Brexit scenario that in the short term is characterised by an interruption to trade and productivity as well as a rise in risk premia (Brexit-related economic assumptions underpinning our central forecast and no-deal scenario are explained in Box A). In this scenario, the productive capacity becomes constrained immediately after exit, for instance because supply chains are interrupted and border barriers erected. Investment, interest rate and equity risk premia dampen economic sentiment and thus, aggregate demand. Policymakers have a wide range of instruments at their disposable and should deploy the tools that most effectively mitigate the dislocation. From a fiscal point of view, these tools range from tax cuts, spending measures and guarantees and from the point of the view of the central bank, there are various macro-prudential measures, Bank Rate, quantitative easing, liquidity injections, foreign currency swap lines etc. Here, we focus on taxes, transfers and Bank Rate. Using NIESR's global econometric model NiGEM, we assess the impact of these levers on inflation and GDP growth assuming that policymakers will deploy these tools depending on their perception of the size of the shock and the persistence of inflation. We present the results of four alternative scenarios: 1) a non-accommodative monetary policy response, 2) accommodative monetary policy with wage growth picking up, 3) accommodative monetary policy with restrained wage inflation, 4) additional fiscal expansion.
Scenario 1: Non-accommodative monetary policy response
As a result of interruptions to trade and lower confidence, GDP growth falls close to zero in the first two years after a no-deal Brexit (figure B1). This is partly due to supply-side constraints as productivity growth slows but also driven by a lack of demand in the face of heightened uncertainty. We would expect contingency measures to ease the initial adjustment somewhat but not prevent an economic slowdown. The effective exchange rate depreciates by around 5 per cent within a year after a no-deal Brexit, and on our analysis is 10 per cent lower than in the soft Brexit case within four years. As a result, import prices rise and consumer price inflation picks up by around 1 percentage point per annum one year after leaving the EU (figure B2). If the central bank fears that this rise in inflation would dislodge inflation expectations, it may respond mechanically to deviations of inflation from target and the fall in output relative to potential. The assumption of a mechanical response is made by the Bank of England (2018) in their assessment of the effects of different Brexit outcomes. Similar to their results, we find that Bank Rate would have to rise by 2 percentage points if it followed a standard policy rule. This, however, would exacerbate the economic slowdown (dashed red lines). The impact of automatic fiscal stabilisers would be small in this scenario. Therefore, scenarios based on the assumption of a non-accommodative policy response provide good tests of how resilient the economy is when faced with the worst case but not necessarily good forecasts.
GDP growth under no deal and different policies

Inflation under no deal and different policies

Scenario 2: Accommodative monetary policy when wages respond to higher inflation
Instead, monetary policymakers have in the past often looked through episodes of temporary inflationary pressure. For instance, in response to the financial crisis, fiscal policy provided unprecedented financial support to the banking sector while monetary policy employed unconventional tools to ease economic disruption. A more accommodative stance may be appropriate also in the event of a no-deal Brexit. In this scenario, we assume that Bank Rate would not deviate from the path we project for a soft Brexit outcome during the first year of no deal and moves only little away thereafter. In other words, the central bank takes a more accommodative stance than it would take if its interest rate policy were to follow a mechanical reaction function. As a result, GDP growth could be stabilised in the short run (solid red line) and the probability of a recession substantially reduced. The risk of such a strategy is that inflation expectations may no longer be anchored, pushing up wages and prices and keeping inflation above the Bank of England's 2 per cent target for an extended period of time.
Scenario 3: Accommodative monetary policy when wage growth is restrained
However, recent episodes have shown that nominal wages may be less responsive to economic shocks than in the past (e.g. Reference HantzscheHantzsche, 2018). Based on this evidence, we assume that nominal wage growth does not respond to the rise in inflation for an extended period of time. This would also be consistent with long-run inflation expectations being anchored. Wage setters accept reductions in real earnings for accommodative monetary policy to be effective. This is modelled by fixing nominal wages to the path they would take if monetary policy were to follow the mechanical rule described above. Under these assumptions we would expect headline inflation to subside. This would render the accommodative monetary stance effective in that initial stabilisation measures are not offset by a subsequent GDP growth slowdown (red line + crosses) and rise in unemployment.
Scenario 4: Additional fiscal loosening
Nevertheless, real disposable income will be lower than under a soft Brexit outcome, not just as a result of lower productivity growth but also because of higher import and consumer prices. This is where fiscal policy could be used to ease the burden on households. Measures could be taken that provide direct support to household income, once monetary stimulus wears off. In our analysis, we consider a combination of income tax reductions and higher transfers to households and apply it to the case where monetary policy remains accommodative while inflation expectations are anchored, assuming the government takes a more flexible approach to existing fiscal rules. We find that such a combination of expansionary fiscal measures could, while permanently increasing the public budget deficit, stabilise real disposable income, consumption and thus, GDP growth over a period of 2–3 years (red line + circles). We estimate that public sector borrowing would have to rise by 2 per cent of GDP a year to finance these policies. While such fiscal measures add up to half a percentage point to inflationary pressure, we do not find that these effects are particularly long-lasting.
This analysis suggests that a mix between accommodative monetary policy and expansionary fiscal policy has the potential to prevent the economy from a sharp slowdown in activity and should therefore be adopted in the case of a no-deal outcome, as long as wages do not respond to temporary increases in inflation and remain consistent with anchored long-run inflation expectations. It should be noted that such a policy mix will not directly resolve any disruptions to supply as a result of trade restrictions and interrupted value chains or change the fact that a no-deal Brexit would create winners and losers. But monetary and fiscal measures as ‘blunt’ instruments can be used temporarily to ease the transition of the economy as a whole to a new trading equilibrium. In the long run however, monetary and fiscal policy will not be capable of addressing structural changes arising from the new trading relationship. While leading to a somewhat smoother adjustment, expansionary monetary and fiscal policy measures would not come without a longer-term cost. As a result of looser borrowing conditions, the risk of asset price inflation rises and levels of private and public debt would increase further from currently elevated levels. Altogether this would make the economy more vulnerable to financial shocks and reduce the space available to monetary and fiscal policy to react to shocks unrelated to Brexit. The analysis could thus be extended to consider tools aimed at safeguarding financial stability, for instance using NiGEM's macroprudential modelling suite (Reference Davis, Liadze and PiggottDavis et al., 2018). The policy mix proposed here may be considerably less effective if a no-deal Brexit leads to structural disruptions to economic relationships that our modelling approach is not able to pick up.
This box was prepared by Arno Hantzsche and Amit Kara.
Section 2. Forecast in detail
Financial market developments
Financial markets in the UK and elsewhere have been volatile over the past three months as sentiment about economic growth prospects has turned more cautious. There are a number of factors at play including the impact of the tariff/non-tariff barriers, geopolitical risks, nervousness around asset valuations and tighter financial conditions driven by a less accommodative monetary policy stance in the US, the Euro Area and elsewhere (see World Chapter for more details). UK financial markets have been impacted separately by the uncertainty around the country's future relationship with the EU although the equity and sovereign bond markets have not displayed an excessive level of stress recently. All in all, the news from the financial markets since November point to tighter and more uncertain financial conditions in the UK.
Equity market
Over the course of 2018, UK equity markets have tracked the European market and underperformed the US market. The FTSE All-share fell by 11 per cent over this period compared with the S&P500 which also dropped, but by just 6 per cent. Companies listed in the UK with a large sales exposure to the European Union have tended to underperform other companies. Over the past three months however, in spite of the intensification of Brexit uncertainty, the UK equity market performance has mirrored the US and Euro Area markets – each falling by around 4 per cent (figure 7).
European and US equity markets (local currency)

Bond market
There is, however, evidence of UK-specific Brexit stress in the sovereign credit default swap market. The cost of protecting against default has risen in the UK compared with other major economies (figure 8), but the premium remains below the levels reached at the time of the 2016 EU referendum and well below the levels reached during the global financial crisis. The sovereign bond yield curve has fallen in the UK, but not by as much as the US, implying that the spread between the US and UK bond yields has widened. For example, the benchmark 10-year yield has dropped by around 20 basis points in the UK compared with a 46 basis points drop in the US. The slope of the yield curve, as measured by the spread between the ten- and two-year gilts, is commonly considered as a lead indicator of economic growth. That spread has been falling in the UK and elsewhere in line with broader concerns about economic growth and inflation prospects. Consistent with that, market expectation of policy tightening in the UK is delayed (see Monetary Policy section).
Five-year sovereign CDS spread

Gilt yields are likely to have been additionally impacted by Brexit developments. Brexit uncertainty has intensified once it became clear that the government's deal was likely to be rejected by the House of Commons. That uncertainty will raise risk premiums and at the same time also raise the likelihood of an offsetting monetary policy expansion (Reference ChadhaChadha et al., 2018b).
The borrowing costs for sub-investment grade companies issuing bonds in sterling, dollar and the euro has risen in 2018 in response to economic growth concerns, the end of ECB corporate bond purchases and worries about the credit market more generally (figure 9). Concerns related to Brexit do not appear to have had a material impact on the borrowing costs of companies issuing sterling-denominated bonds however; issuance of bonds, particularly by UK companies, had dried up recently, most likely because of Brexit uncertainty.
BBB Corporate bond spread

Sterling exchange rate
Brexit-related news tends to have a large impact on sterling exchange rates. The currency has depreciated by more than 15 per cent since the peak in 2015 with the sharpest decline in June 2016 when the results of the EU referendum result became known (figure 10). The currency has remained relatively stable since our last forecast in November. The picture of calm that is evident in headline exchange rates, however, masks a high degree of uncertainty about the future value of the currency. This is evident in measures of volatility and risk reversals that point to expectations of large movements ahead and also a higher possibility of a depreciation rather than an appreciation.
Sterling exchange rate

Components of demand
ONS data revisions and the new narrative
The ONS published a revised set of national accounts data in December. The overall picture for headline GDP has not changed but that masks important changes to the underlying picture. The most important of these is the narrative around the rebalancing of the economy since the EU referendum. Whereas the earlier data vintage indicated a positive 0.8 percentage points contribution to GDP growth for the period starting in the second quarter of 2016 up until the third quarter of 2018, the revised data, which is still prone to revision, shows that net trade instead subtracted 0.2 percentage points over this period (figure 11). In other words, the latest data suggest that net trade did not make a positive contribution to real GDP growth in spite of a weaker exchange rate and robust growth in the Euro Area. Gross capital formation and, in particular, government investment and household consumption, were revised higher such that the overall growth picture remained largely unchanged.
Net trade cumulative contributions to quarterly GDP growth

The UK economy was volatile in 2018. GDP growth recovered in the second and third quarter after the weather-related disruption in the first quarter when the economy more or less stagnated. Economic growth slowed once again in the final quarter according to the NIESR Monthly GDP Tracker. Abstracting through the quarterly volatility, economic growth is set to average 1.4 per cent in 2018 if final quarter GDP growth is in line with our forecast. If correct, this will be the weakest calendar year growth rate since 2009.
Forecasting with a benchmark: the Warwick Business School forecasting system
We provide benchmark forecasts to help understand and contextualise the forecasts presented in this Review. The box presents density forecasts for UK GDP annual growth and inflation, and reports the probabilities of a range of output and inflation events occurring, as calculated using the Warwick Business School Forecasting System (WBSFS).Footnote 1
To reflect the uncertainties inherent in economic forecasting, and following the practice of the NIESR and other forecasters such as the Bank of England and OBR, the WBSFS provides probabilistic forecasts. The WBSFS forecasts are produced by explicitly combining density forecasts from a set of 24, statistically motivated, univariate and multivariate econometric models commonly used in the academic literature. The use of combination forecasts or model averaging reflects the view, supported by research (e.g., see Reference Bates and GrangerBates and Granger, 1969; Reference WallisWallis, 2011; Reference Geweke and AmisanoGeweke and Amisano, 2012; Reference Rossi, Elliott and TimmermannRossi, 2013), that because any single model may be mis-specified there may be gains from the use of combination forecasts.
Comparison of the Institute's forecasts with the probabilistic forecasts from the WBSFS may be interpreted as providing an approximate indicator of the importance of expert judgement, which may include views on the underlying structure of the macroeconomy. This is because the WBSFS forecasts are computed by exploiting regularities in past data with the aid of automated time-series models; they do not take an explicit, structural or theoretical view about how the macroeconomy works; and they do not rely on (subjective) expert judgement to the same degree as those presented by the Institute. The forecasts from the WBSFS are not altered once produced; they are deemed ‘simply’ to represent the data's view of what will happen to the macroeconomy in the future.
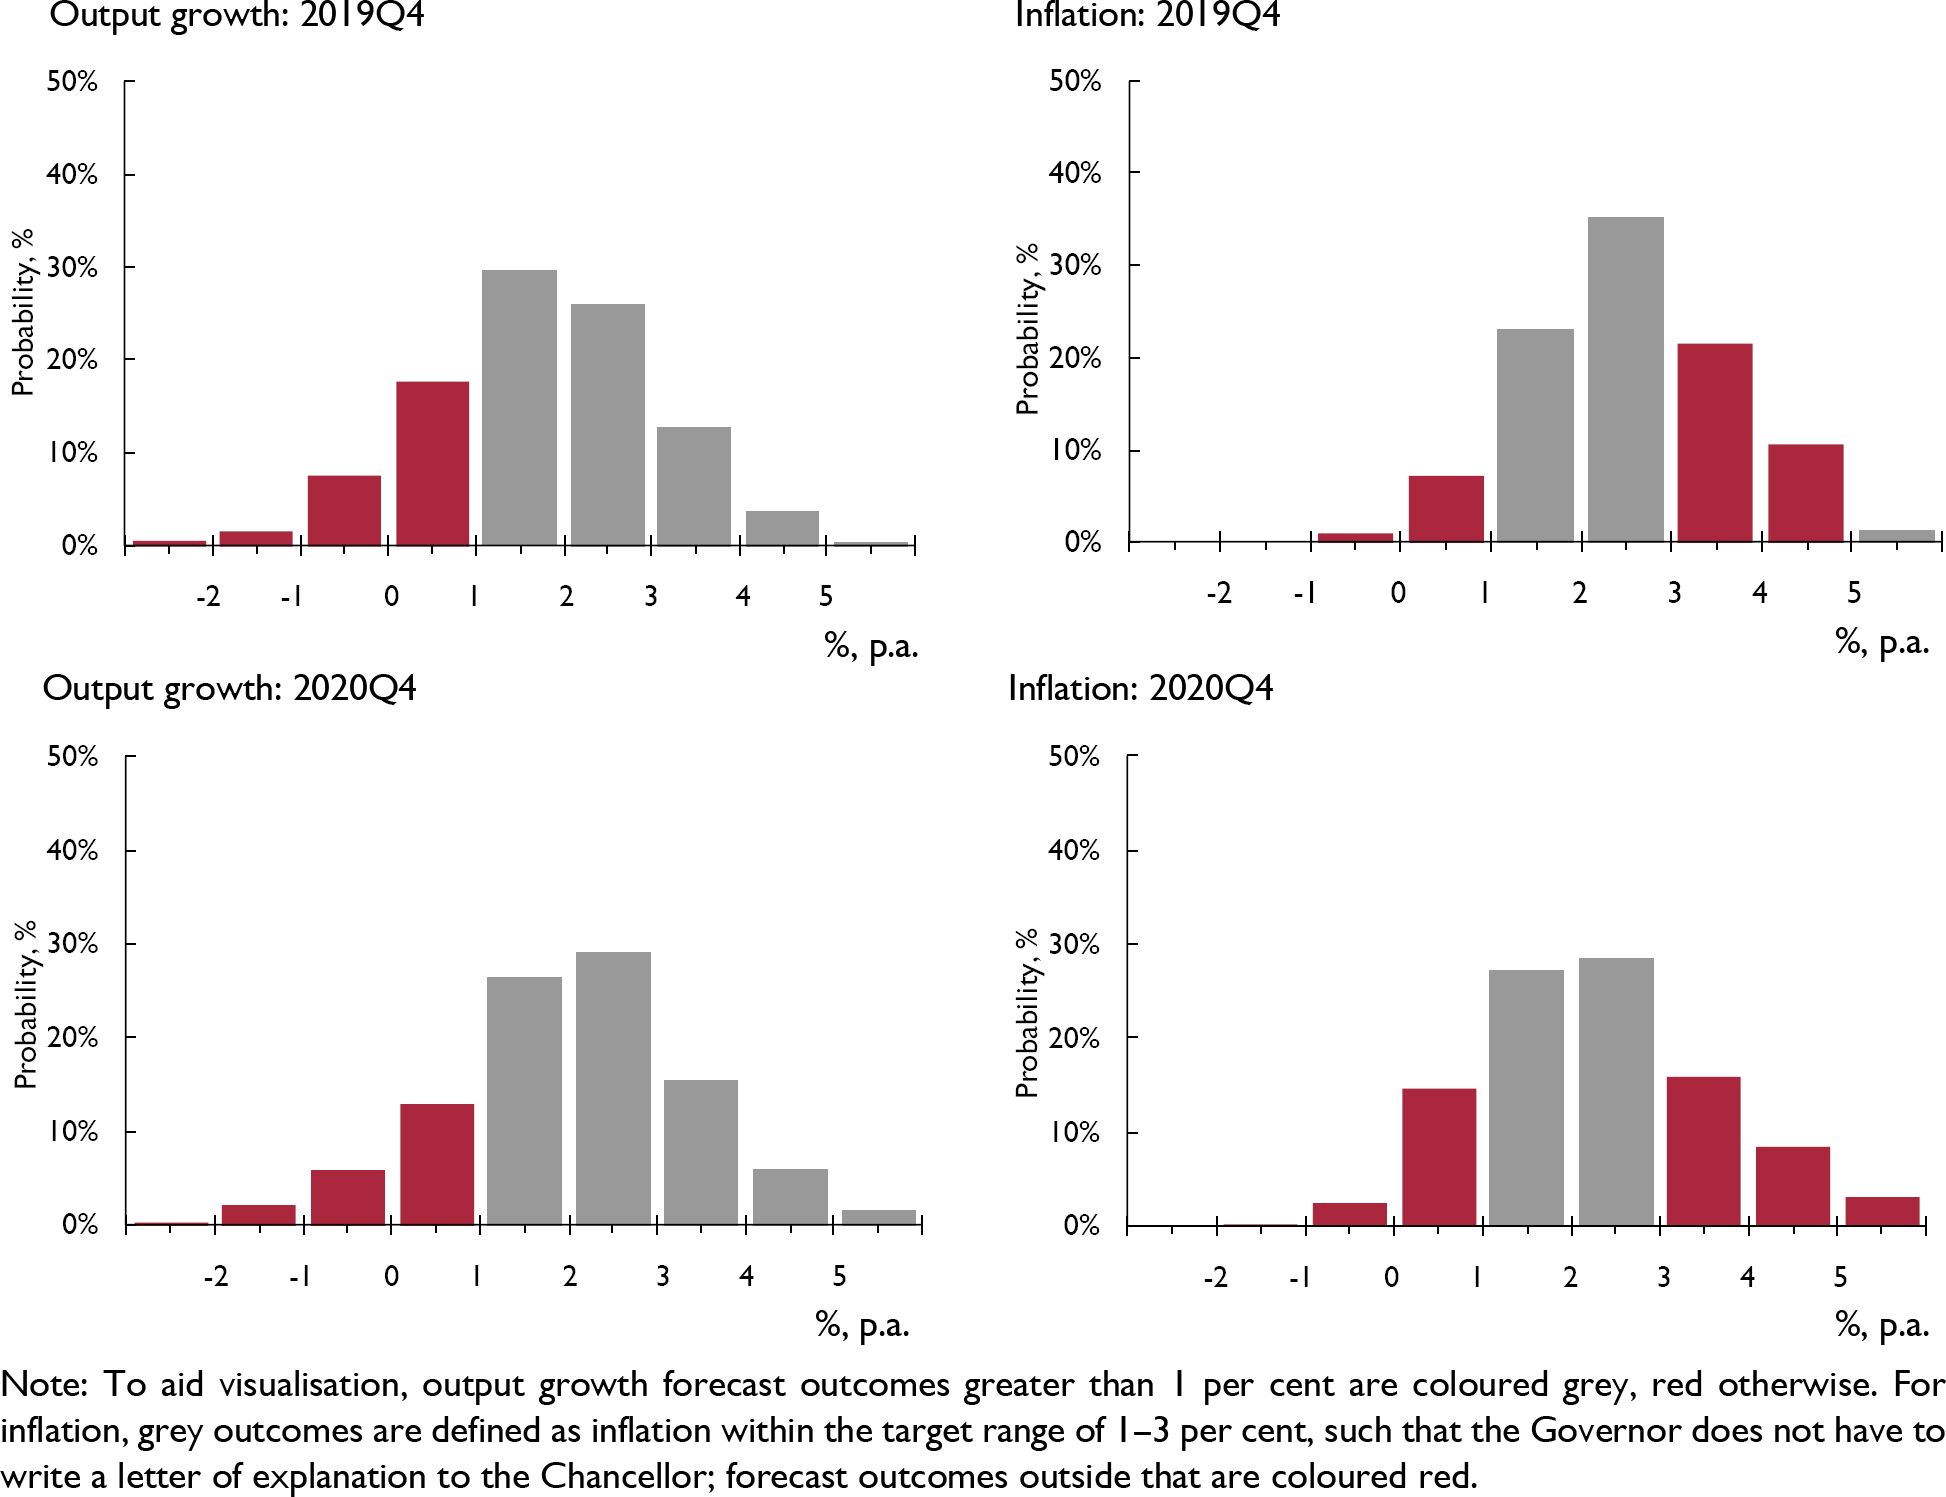
Figure C1 presents WBSFS's latest (as of 17 January 2019) probabilistic forecasts for real GDP growth and inflation – defined as year-on-year growth rates for 2019Q4 and 2020Q4 – as histograms. The information set used to produce these forecasts includes information on GDP growth up to 2018Q3 and data on CPI inflation up to December 2018.
WBSFS forecast probabilities for real GDP growth and inflation, year-on-year

Table C1 extracts from these histogram forecasts the probabilities of specific output growth and inflation events. The events considered are the probability of output growth being less than 0 per cent, 1per cent and 2 per cent, and of inflation lying outside the 1–3 per cent target range (i.e., the probability of the Bank of England's Governor having to write a letter explaining how and why inflation has breached its target range). Also reported are the individual probabilities of inflation being less than 1 per cent and greater than 3 per cent, to indicate which side of the target range is most likely to be breached.
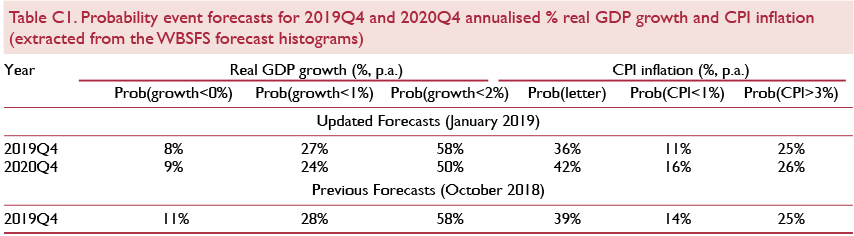
Inspection of the output growth forecasts for 2019Q4 suggests that, compared with our previous forecasts made one quarter ago, very little has changed; see table C1. The most likely outcome, with a forecasted probability of 31 per cent, is that growth continues at between 1 per cent and 2 per cent in 2019Q4. And the risk of ‘low’ growth (growth less than 1 per cent) in 2019Q4 is essentially forecast to be the same as one quarter ago: the predictive probability of this event has fallen from 28 to 27 per cent. Looking out further to 2020Q4, we observe a shift in the forecast density to one suggesting slightly higher growth. So output growth, of between 1 and 2 per cent, is now less likely at 26 per cent (versus 31 per cent for 2019Q4); and marginally more likely at around 27 per cent (versus 25 per cent for 2019Q4) to be between 2 and 3 per cent. We also observe a fairly symmetric forecast distribution for economic growth in 2020Q4, with risks evenly balanced around output growth of approximately 2 per cent.
For inflation, our probabilistic forecasts for 2019Q4 have changed between October and January only to the extent that the probability of inflation being outside the range targeted by the Bank of England has increased by a modest 3 percentage points, from 36 to 39 per cent. This change is attributable to the probability of inflation falling below 1 per cent having increased from 11 to 14 per cent. It constitutes a modest continuation of the downward movement observed in our inflation forecasts last year. An inflation rate of between 2 and 3 per cent remains the most likely outcome in the year ending 2019Q4, with a 34 per cent probability, down from around 45 per cent predicted in 2018. This slight downward trend in inflation is forecast to continue through to 2020Q4, where the probability of being outside the target range is still higher at 42 per cent, but where this risk largely comes on the downside: there is now a 16 per cent probability of inflation less than 1 per cent. The range of probable outcomes for inflation is forecast to be wider in 2020Q4 than in 2019Q4, as we also observe a small increase (of just 1 percentage point) in the forecasted probability of inflation being greater than 3 per cent.
This Box was prepared by Ana Galvão, Anthony Garratt and James Mitchell.
Note
1 WBSFS forecasts for UK output growth and inflation have been released every quarter since November 2014. Details of the releases are available at https://www2.warwick.ac.uk/fac/soc/wbs/subjects/emf/forecasting/ and a description of the models in the system and of the indicators employed is available at https://www2.warwick.ac.uk/fac/soc/wbs/subjects/emf/forecasting/summary_of_wbs_forecastng_system.pdf.
At first glance, this suggests that the economy underperformed in 2018, but on a different metric – average quarterly GDP growth over the four quarters of 2018 – the economy expanded by 0.4 per cent which is very similar to the period since 2015 and similar to our estimate of potential growth.
There have been a number of countervailing global factors at play over this period. The global economy and more specifically Euro Area GDP growth slowed sharply in the second half of 2018 (see World section). The weakness can be attributed to one-off factors such as the disruption caused to motor vehicle output by the new emissions standards, protests in France and the US government shut-down as well as more persistent drivers such as tighter monetary policy (US, Euro Area and the UK), the slowdown in China and trade barriers. There were tailwinds from oil prices, which fell by around 30 per cent since our previous forecast in November (Prices section), as well as US fiscal policy, which was expansionary for most of 2018.
The most important domestic influence behind the recent economic performance is the uncertainty around the UK's future relationship with the EU. There is clear evidence of the impact of that uncertainty on the economy in surveys as well as official data. Among surveys, the latest Bank of England Decision Maker's Panel shows Brexit as one of the top sources of uncertainty for UK companies. The latest CBI Industrial Trends survey highlights political and economic factors are amongst the main factors holding back activity over the next three months. That uncertainty, together with a potential rise in risk aversion, is also discouraging investment spending. Consistent with that message, the latest vintage of ONS data shows that business investment has fallen in each of the first three quarters of 2018 and research suggests that overseas investment into the UK is some 19 per cent lower because of Brexit (Reference Serwicka and TamberiSerwicka and Tamberi, 2018). There is also evidence of above average levels of stock building in surveys and official data as firms prepare for a disruptive no-deal Brexit.
The outlook under a soft Brexit scenario
Looking ahead, under our benign soft Brexit central scenario, we see economic growth of 1.5 per cent in 2019, revised lower from 1.9 per cent because of Brexit uncertainty and the downward revision to global GDP growth.
Household consumption is set to make the largest positive contribution to our real GDP growth forecast mainly because of rising real incomes. Official data points to a recovery in average earnings which is driven by a rising minimum/living wage and more generous public sector wage settlements (see Supply section). At the same time, inflation has surprised to the downside and is expected to remain subdued over the forecast period. Set against these tailwinds is the headwind from Brexit. Consumer confidence has been falling since the EU referendum according the GfK measure and has fallen further since our November forecast. Reinforcing this headwind is the housing market where price growth and activity, as measured by mortgage approvals, remain subdued and the household saving ratio which dropped sharply after the EU referendum in response to rising employment and lower real personal disposable income growth (figure 12). Consistent with that, total individual insolvencies rose to a 7-year high in 2018.
RICS Housing market survey and UK consumer confidence

We have revised lower our forecast for business investment over the period 2018–20 because of back data revisions as well as a more cautious view on negotiations that will ultimately settle the relationship with the EU. We now see business investment falling by 0.5 per cent in 2018 instead of expanding by 1.2 per cent as was the case in our November forecast; rising by 0.3 per cent in 2019 (2.9 per cent previously) and 1.3 per cent in 2020 (1.9 per cent previously). Business investment is around 4 per cent lower in levels by the end of 2020 compared with the earlier forecast.
Our judgement is that government spending will need to grow more than in the recent past to accommodate the needs of an ageing population and maintain the quality of public services (see Public finances section). As a result, we project government consumption to add 0.2 percentage points to real GDP growth in 2019, rising to 0.4 percentage points in 2020.
Supply conditions
Factor inputs
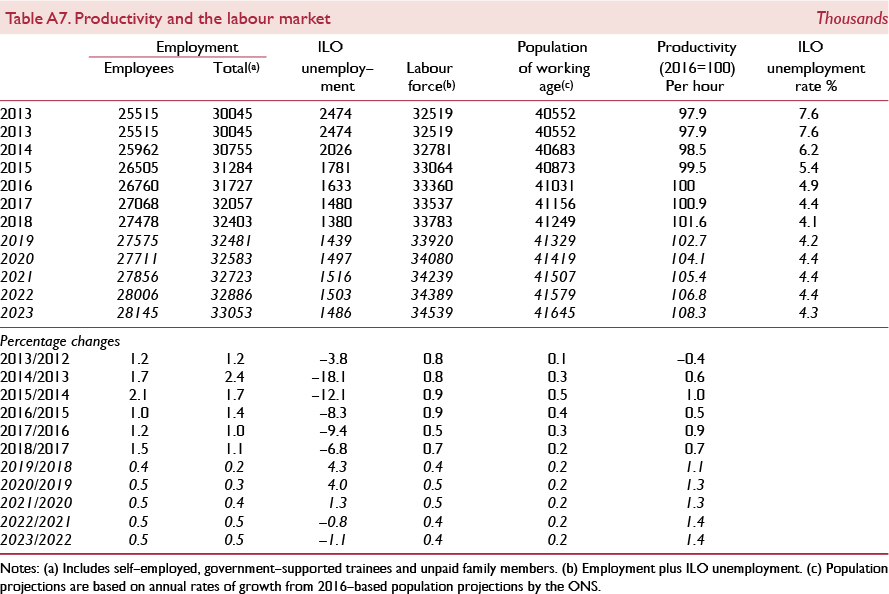
Supply is determined by factor inputs into production, i.e. capital and labour, and the level of productivity. Growth of the stock of capital, net of depreciation, has been slowing down over the past two decades (figure 13). After reaching more than 2 per cent in 2014–15, annual net capital stock growth eased to 1.1 per cent in 2017. This was mainly driven by cyclical movements in building investment but also because the stock of machinery and information technology was expanded significantly less, in particular compared to the period before the Great Recession. Labour input, on the other hand, has since the crisis grown at rates far above the long-term average of 0.6 per cent and growth reached just above 1 per cent in the third quarter of 2018. The employment rate, i.e. the share of those of working age in employment, reached 75.8 per cent in the three months to November 2018, the highest since the beginning of the series in the 1970s. The unemployment rate continued to be at a 44-year low of 4 per cent during the same period.
Factor inputs and labour share

The slowdown in the growth rate of capital and record levels of employment partly reflect structural changes in the economy (see also Box D). The average growth rate of labour productivity was 0.2 per cent a year after 2008, down from 2.1 per cent in the two decades before. After a print above 1 per cent in the four quarters before, annual labour productivity growth fell to 0.2 per cent in the third quarter of 2018, as an increase in hours worked outpaced output growth. The OECD (Reference Ahmad, Ward and ZinniAhmad et al., 2018) found that the level of labour productivity in UK official data tends to be underestimated as hours worked tend to be over-reported. They provide updated estimates that show the gap in labour productivity between the UK and the US is smaller than for Italy and Spain compared to national accounts data which has a stronger negative difference, yet productivity growth rates are unlikely to be affected. A series of articles published in this Review discusses trends in UK productivity growth and provides explanations for its slowdown.
According to the Bank of England's Agents survey, recruitment difficulties continued to intensify in the fourth quarter of 2018. This was to some extent because EU net migration of 74,000 in the year to June fell to the lowest estimate since 2012, down from 190,000 in 2015–16. The drop was only partly offset by an increase in non-EU net migration of 50,000 a year since 2015–16, reaching a 14-year high of 248,000 in the year to June 2018.
Factor costs
Labour market tightening translated into pressure on wage growth to intensify at the end of 2018. Unit labour costs increased by 2.8 per cent in the third quarter of 2018, relative to a year earlier. Regular average weekly earnings in the economy as a whole rose by 3.3 per cent in nominal terms in the three months to November 2018, the highest since 2008. Wage growth in the private sector was 3.4 per cent and that in the public sector 2.9 per cent.
Will the recent pick-up in earnings growth be sustained or is it temporary? NIESR's new short-term wage forecast points to whole-economy average weekly earnings growth of 3.7 per cent in the first quarter of 2019, driven both by firmer wage dynamics in the private and public sector (for the methodology see Reference Lopresto and YoungLopresto and Young, 2018). At the same time, real wage growth has only just recovered, nudging up to around 1.1 per cent in the three months to November, after falling below zero in 2017 as inflation picked up and staying far below 1 per cent for most of 2018. Figure 14 illustrates the time it took in the past for real wages to recover after periods of elevated inflation. While in the 1990s and early 2000s real wages moved above previous peaks within a year, it took 27 months for real wages to regain the ground lost since July 2016, before inflation started rising above 3 per cent, despite the level of real wages only falling by around 1 per cent. Meanwhile, real wages at the end of 2018 continue to be 8 per cent below their 2008 levels.
Length of recent periods with negative real wage growth

At the same time, borrowing conditions remained favourable and bank and non-bank credit readily available in the fourth quarter of 2018, according to survey data, while investment intentions were subdued as a result of Brexit-related uncertainty.
Central forecast
Based on the assumption of a soft Brexit and inflation around 2 per cent, we project real wages to grow at just above 1 per cent a year, nearly in line with productivity growth of 1.3 per cent over the forecast horizon. Higher wage growth as well as labour supply constraints translate into somewhat slower employment growth in our forecast of 0.5 per annum from 2020, while unemployment is projected to rise to near 4½ per cent.
A potential rise in the National Living Wage (NLW) to the OECD's definition of two-thirds of median earnings instead of 60 per cent as currently targeted for 2020, provides an upside risk to our wages forecast as it would not only benefit the around 16 per cent of workers currently earning less than the living wage but also mean that workers earning above that threshold will see their wages pick up (Reference Ebell, Speckesser, Rolfe, Busnall and NaddeoEbell et al., 2018), thereby bolstering whole-economy wage dynamics. Given that the available evidence on the NLW does not point to marked employment effects (Reference DoltonDolton, 2018; Aitken et al., forthcoming), we would not expect sizeable effects on our forecast for unemployment. Yet given such an increase would move the NLW above minimum wages in most other countries, the employment impact is largely unclear and may be high in particular sectors (OBR, 2018, Box 3.3).
Elevated levels of uncertainty mean investment is likely to remain subdued. Capital stock growth is projected to be around 1 per cent going forward. This, together with modest employment and productivity growth, implies that the productive capacity of the UK economy is set to settle on a growth path of around 2 per cent per annum.
Potential implications of a no-deal Brexit
A no-deal Brexit poses a considerable downside risk to our forecast of supply conditions. Short-term disruptions such as border delays and supply chain interruptions would lead us to revise down our productivity projections in the near term. We would expect labour productivity growth to fall below 1 per cent in the year after exit. In an article published in this Review, Reference CraftsCrafts (2019) concludes that Brexit is unlikely to improve the UK's productivity in the long run, “since it is neither necessary nor sufficient for the introduction of better […] industrial policies”. We expect that lower levels of investment, lower net migration and lower productivity as a result of less intense trade would lead to a lower productive capacity compared to a soft Brexit outcome.
Structural changes in UK sectoral labour markets and their macroeconomic implications
Undoubtedly, the UK labour market has undergone a substantial change in recent decades (Reference DoltonDolton, 2018). This box uses a new dataset to analyse patterns of sector-level employment over time. It provides evidence that changes in the UK labour market have been associated with sector-level developments but also changes in industry composition, i.e. the relative size of sectors. We find that a rebalancing towards more productive sectors partly offsets a slowdown in productivity growth while average wage dynamics are associated predominantly with sector-specific trends. The increase in female labour force participation has been achieved by sectors with traditionally higher shares of female employees gaining in size. Vice versa, the UK economy would be more open to international trade, and the bargaining power of workers weaker had the industry composition remained the same since the 1990s. Finally, we measure the position of sectors in the whole-economy labour market using cross-sectoral employment flows. We find that sectors with higher cross-sectoral employee turnover are less exposed to international competition, less productive and characterised by lower levels of wage growth.
Labour market trends
Based on data from the Quarterly Labour Force Survey, we construct measures of employment by sector and measure the interconnectedness between sectors using cross-sectoral employment flows. This forms part of research at NIESR that studies the impact of long-run structural changes on sectoral dynamics of employment, productivity and pay.
Sector employment shares
In figures D1 and D2, each diamond depicts one of 14 broad sectors of the economy in 1994–6 and 2017–18, respectively. The area of each diamond reflects the sectors’ workforce. Comparing figures D1 and D2, we find that some sectors gained in size and others substantially lost. Manufacturing sectors have lost more than a third of their workforce since the 1990s. Employment in outward-facing business services, education and health sectors, on the other hand, has grown by 40–60 per cent.
Labour market flows across sectors, UK, 1994–6

Labour market flows across sectors, UK, 2017–18

Connectedness
For each sector, we count the number of workers that move from this sector to another at a given point in time. The cross-sectoral employment flow is calculated as the percentage of leavers relative to total sector-level employment at quarterly frequency. We thus focus here on members of the labour force in employment and are interested in long-term structural changes in cross-sectoral flows, as opposed to labour market dynamics related to the business cycle. Comparing most recent worker flows (figure D2) with those observed in the 1990s (figure D1), we find a substantial increase in connectedness, illustrated by the denser set of lines linking sector diamonds. This suggests that workers now find it easier to work in other sectors than in the past, relative to churn of workers within sectors which our cross-sectoral analysis does not pick up. We find a particularly strong increase in flows between the hospitality (HR) and real estate and business services (RB) sectors, reflecting a deeper integration of both sectors’ labour markets. Changes in cross-sectoral employment flows over time may partly also be due to the contracting out of activities. For example, some of current business services jobs used to be undertaken as part of public administration or various production activities were contracted out which makes firms previously part of the manufacturing sector now become part of the wholesale sector.
Centrality
Figure D1 shows that in the 1990s, workers were most likely to move between the traditional sectors of the economy (upper left corner), in particular in and out of manufacturing. Since then, most of the action has moved to the right of the chart, i.e. to private and public services sectors. In particular worker flows within this set of sectors have intensified. To quantify the importance of individual sectors in the network, we employ the concept of centrality. Centrality is a measure of the importance of a node in a network. In particular, we use the concept of eigenvector centrality (Reference JacksonJackson, 2010, pp. 66). It is calculated by first constructing an adjacency matrix that captures the strength of connections between each node and all other nodes. The greatest eigenvector of this matrix provides a measure of centrality such that the centrality (or importance in the network) of each node is a function of the centralities of its neighbours. In this case, the connections between the sectors are weighted by the share of labour passing from one sector to another each period. In figures D1 and D2, the colour of the sector diamonds illustrates their centrality, with darker diamonds corresponding to more central sectors. We find that business services and public services sectors, like health and education, have become more central, while manufacturing sectors have moved somewhat to the periphery. The sector that has remained an important node throughout is wholesale and retail trading, highlighting its role in attracting workers from both traditional and internationally open services sectors.
Macroeconomic implications
How do the structural changes in employment shares and cross-sectoral employment flows link to changes in aggregate labour market outcomes?
The top panel of table D1 decomposes for a number of important labour market variables the contribution of sector-specific developments and the contribution of changes in the sector composition to structural changes observed at the level of the whole economy. To do so, we construct two counterfactuals of the UK labour market: one in which the relative size of sectors remains unchanged (yielding the contribution of sector trends), and one in which sector averages of labour market outcomes remain fixed (yielding the contribution of changes in the industry composition). We find that changes in the sector composition of employment both aggravate and buffer different sector-specific trends. While the average decline in real wage growth since the 1990s can mainly be explained by sector-specific changes in wage growth, a rebalancing towards more productive sectors partly offset the sector-specific slowdown in labour productivity growth over the past two decades.

In addition, had the sector composition remained unchanged over the past two decades, a counterfactual UK economy would be much more open to trade than it is now. While there has been a general decline in union density, at the macroeconomic level this was partly offset by a strengthening of sectors with higher union density, in particular the public sectors. Increases in the labour market participation of women are entirely reflected in changes in the sector composition of employment while on average, the share of female workers per sector has actually declined somewhat.
Is there a flipside to stronger connectedness between sectoral labour markets? The bottom line of table D1 correlates our measure of sector centrality with labour market variables over the period 1996–2015. This illustrates that sectors that play a more central role for the domestic labour market tend to be less exposed to international competition, are characterised by lower than average worker bargaining power and are somewhat less productive. This may explain lower levels of wage growth in these sectors.
Our analysis suggests that observing changes in the sectoral composition of the labour market and cross-sectoral employment flows helps to understand structural changes the whole-economy labour market undergoes.
This box was prepared by Nathaniel Butler-Blondel and Arno Hantzsche.
Prices
Recent developments
Consumer price inflation has stabilised just above 2 per cent in the final quarter of 2018, after reaching 3 per cent a year earlier and 2.5 per cent in the third quarter of 2018. This reflects a softening of price pressures from abroad while domestic prices strengthen.
The contribution of price changes for goods with high import content to overall CPI inflation has receded to a two-year low (figure 15), mainly reflecting lower energy prices. The price of Brent crude oil in sterling has fallen by 30 per cent since September. The fall in oil prices was also responsible for a fall in the growth rate of manufacturing input and output prices from 10.3 per cent and 3.1 per cent in the third quarter of 2018 respectively, to 6.4 per cent and 3 per cent in the final quarter of the year.
Measures of consumer price inflation, contribution to CPI by product group and sales

On the other hand, price pressure for domestically produced goods is firming. Underlying data show that this is due to stronger price growth for communication, education and hospitality services which suggests that the recent uptick in nominal wage growth feeds its way into consumer prices. That underlying inflationary pressure is stabilising is confirmed by our trimmed mean measure of inflation, which excludes the highest and lowest 5 per cent of price changes. It has fallen to 0.7 per cent in the fourth quarter of 2018, after a peak of 2.6 per cent a year earlier and a print of 1 per cent in the third quarter of 2018 (see NIESR press note on CPI inflation statistics).
Firmer domestically produced inflation also reflects a fall in the frequency of sales entering the CPI measure. While, in 2017, 5.4 per cent of price decreases were due to sales, this share fell to 4.5 per cent in 2018. This may however, mask temporary but aggressive sales strategies like Black Friday. Apart from petrol and diesel prices, price data entering the CPI refer to the second or third Tuesday of each month. Sales taking place on and around Black Friday, which started three days after the third Tuesday of November and two weeks before the second Tuesday of December, may not be reflected. Thus, consumers may have benefitted from lower prices than official CPI data suggests.
Outlook
Inflation dynamics beyond the short run are driven by the balance between supply and demand. In our soft Brexit case we expect CPI inflation to stay around the Bank of England's target of 2 per cent. That forecast assumes GDP growth close to our estimate of potential, a steady increase in Bank Rate and wage growth in line with productivity growth. Were the UK to leave the EU in March 2019 without a deal, we would expect the currency to depreciate and inflation to rise to 3 per cent in 2020 before gradually reverting back to target.
Sectoral balance
Triple deficit
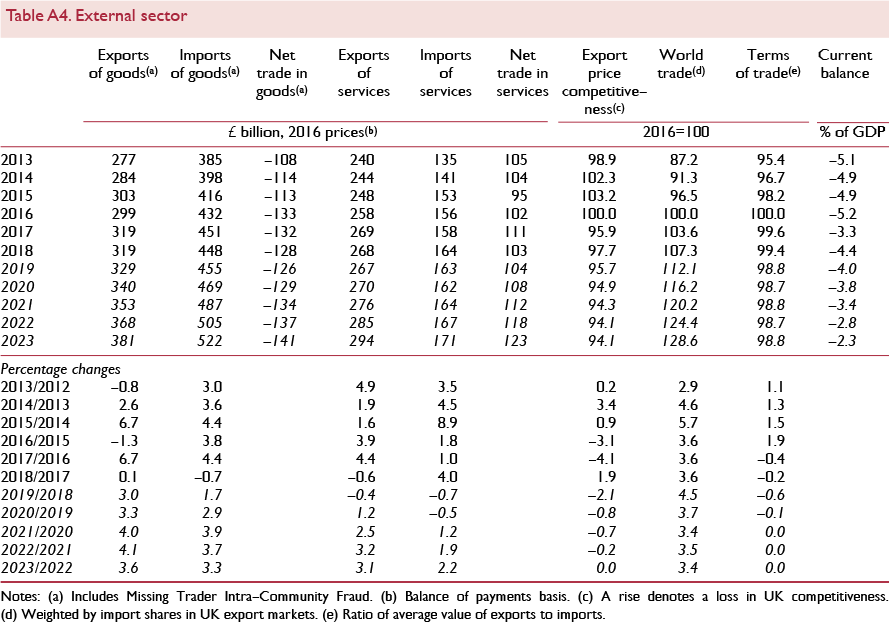
Table A9 shows the financial position of the private and public sectors of the economy and the resulting balance with the rest of the world. The private sector is further split into a household and a corporate sector. If investment is greater than saving for a sector, then this sector is a net borrower. The aggregation of these three sectors is the current account balance, which, if in deficit, implies that borrowing from the rest of the world is required in order to fund domestic investment plans. It is not possible to infer the optimality of the levels of capital from the current account but rather just the immediate financing needs of the economy. In 2017, all three domestic sectors of the economy – households, companies and government – were in deficit for the first time since at least 1987 (figure 16), and we forecast this pattern to carry on into the medium term. It is worth emphasising that published data, particularly for corporates and households, is prone to large revisions.
Sectoral balances

Households
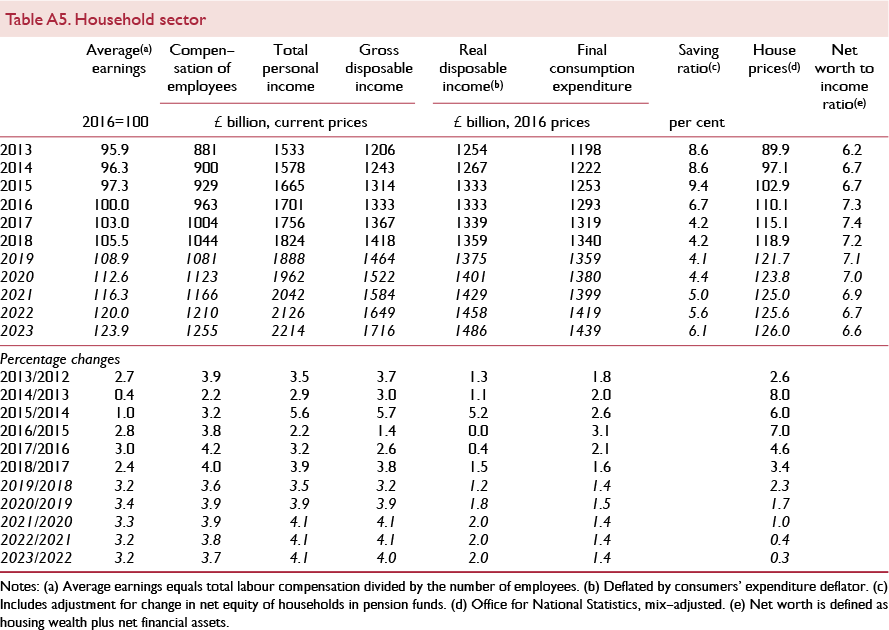
Household saving as a fraction of GDP has been falling since 2015. This erosion in savings has helped support consumer spending. In our central forecast based on soft Brexit assumptions, we expect that trend to reverse over the medium term as households look to rebuild savings from levels that are well below the long-run average. An important driver of the increase in saving will be the ongoing auto-enrolment into workplace pensions.
Household investment rose steadily from a trough of 3.2 per cent of GDP in 2009 to 4.3 per cent of GDP in 2017, which is similar to the pre-crisis high of 4.5 per cent in 2006–7. With demand for housing still growing strongly, we project household investment to increase in each subsequent year and to reach 5 per cent of GDP in 2022 under our soft Brexit scenario. The saving and investment positions of the household sector imply that in 2017 households required 1.4 per cent of GDP in funding from the rest of the economy. This represents the first time since at least 1987 that the household sector was a net borrower.
Corporates
On the corporate side, saving rebounded strongly in 2017, rising to 9.8 per cent of GDP from 7.3 per cent in 2016. This was driven by an increase in corporate profits both in manufacturing and in the oil and natural gas exploration and extraction sector. We forecast corporate saving to GDP to remain close to 9 per cent in the medium term as the headwinds from Brexit ease in our soft Brexit scenario. The corporate investment ratio was steady at around 10½ per cent of GDP in 2017. Conditional on a soft Brexit assumption, we forecast corporate investment to remain at about 10 per cent of GDP in the medium term, and therefore the corporate sector still to require about 1½ to 2 per cent of GDP of net financing from the rest of the economy over the same time horizon. The risks to corporate investment are skewed to the downside.
Government
Government sector dis-saving, which reached a peak in 2009 of around 5½ per cent of GDP, has vanished in 2016 as a result of the ongoing fiscal consolidation. We now expect saving to be steady at about 1.0–1.5 per cent of GDP from 2018 to 2022. Government investment stayed stable in 2017 at 2½ per cent of GDP and we have maintained our estimate of 2½ per cent of GDP over the forecast horizon. As a result of constant saving and investment, we now expect the government to remain in a net borrowing position of 1½ per cent of GDP until 2022.
Rest of the world
To finance the triple deficit of the household, corporate and government sectors, the domestic economy is estimated to have borrowed around 4 per cent of GDP in 2018 from the rest of the world. This is high compared with other G7 economies or the Euro Area and as such leaves the UK vulnerable to capital flight in the event of a large global shock, especially if that is accompanied by a disruptive Brexit.
Appendix – Forecast details