



1 INTRODUCTION
Asteroseismology is a mature field of study and the associated concepts and methodologies have been established for some time. The use of stellar pulsations as a probe of stellar structure is recognised as a powerful tool in building understanding of the interior structure and evolution of stars. The gravity modes (g-modes) characteristic of the γ Doradus stars are deeply penetrative and so provide a way to characterise the deep stellar interior and layers close to the core. Accurately finding and characterising these g-modes is the first step in obtaining a more complete understanding of the γ Doradus class of pulsating stars.
This work improves upon a prior set of spectroscopically identified modes in Maisonneuve et al. (Reference Maisonneuve2011) and Tkachenko et al. (Reference Tkachenko, Van Reeth, Tsymbal, Aerts, Kochukhov and Debosscher2013) by incorporating new spectra from other sites, providing a longer timebase of observations to improve frequency determination, and incorporating a more detailed exploration of the mode-identification parameter-space.
HD 189631 was selected for study as it displays robust line-profile variation. Perryman (Reference Perryman1997) classifies HD 189631 as an A9V star and Vizier (Ochsenbein, Bauer, & Marcout Reference Ochsenbein, Bauer and Marcout2000) lists the star as an F0V. The star has a relatively bright visual magnitude of 7.54 making it a good target for high-resolution spectroscopic observation and analysis. HD 189631 has been found to have a moderate vsini = 43.6 ± 0.5 kms−1 and a mean radial velocity of −10.13 kms−1 (Maisonneuve et al. Reference Maisonneuve2011).
2 OBSERVATIONS AND DATA TREATMENT
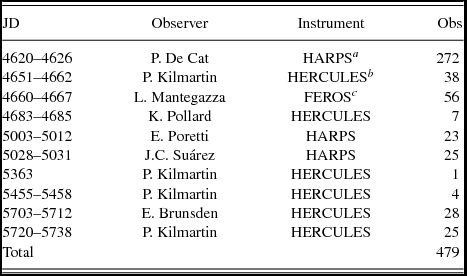
In total just over 100 spectra of HD 189631 were collected from the 1-metre McLellan telescope at Mt John University Observatory (MJUO) in Tekapo, New Zealand with the fibre-fed High Efficiency and Resolution Canterbury University Large Echelle Spectrograph (HERCULES). Spectra from MJUO were collected over a period of 3 years from 2008 July to 2011 June. The main improvement of this paper over that of Maisonneuve et al. (Reference Maisonneuve2011) is the incorporation of 58 new spectra, increasing the timebase over which spectra were acquired from 411 days to 1118 days and thereby improving the precision of the resultant frequencies. These spectra were reduced using a customisable matlab pipeline initially written by Dr. Duncan Wright (Brunsden et al. Reference Brunsden, Pollard, Cottrell, Wright, De Cat and Kilmartin2012b) and barycentric corrections applied.
Spectra were also obtained during 2008 July – August and 2009 June – July using HARPS and FEROS at the ESO in La Silla, Chile (see Table 1). A total of 376 spectra were obtained at the ESO. These spectra are dominated by the very high-cadence observational campaign in 2008 at La Silla Chile (Table 1). The spectra from both La Silla spectrographs were initially reduced on-site using an automated pipeline. Once reduced, each of the spectra were then cross-correlated against a delta-function comb as described in Brunsden et al. (Reference Brunsden, Pollard, Cottrell, Wright, De Cat and Kilmartin2012b) to create a representative line-profile for each of the spectra.
Spectra of HD 189631 collected for analysis in this project. The lower section of the table displays spectra that are new to this work. Julian Dates given here are JD-2450000.
a ESO, La Silla, Chile.
b MJUO, Lake Tekapo, New Zealand.
c ESO, La Silla, Chile.
Frequency analyses were undertaken using sigspec (Reegen Reference Reegen2007) and famias (Zima Reference Zima2008) and the subsequent mode identification used famias. Frequecies were analysed both from moments as in Briquet & Aerts (Reference Briquet and Aerts2003) and pixel-by-pixel across the line profile. Mode identification in famias uses the Fourier Parameter Fit method; for each identified frequency, synthetic spectra for different modes are generated from a range of parameters until the fit is optimised by minimisation of the χ2 parameter.
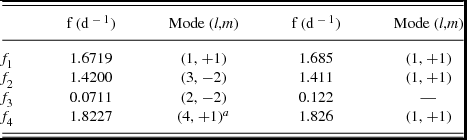
The previous spectroscopic frequencies and modes identified for HD 189631 from Maisonneuve et al. (Reference Maisonneuve2011) and from Tkachenko et al. (Reference Tkachenko, Van Reeth, Tsymbal, Aerts, Kochukhov and Debosscher2013) may be found in Table 2.
Previously determined frequencies and modes for HD 189631 from Maisonneuve et al. (Reference Maisonneuve2011) in the second and third columns, and Tkachenko et al. (Reference Tkachenko, Van Reeth, Tsymbal, Aerts, Kochukhov and Debosscher2013) in the fourth and fifth columns.
a The fit of this mode was uncertain in Maisonneuve et al. (Reference Maisonneuve2011). It was suggested that a (l,m) = (2, −2) mode may also be a good candidate for this frequency.
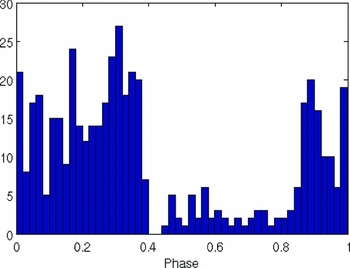
In this work additional spectra were obtained, substantially broadening the timebase (from 411 d to 1118 d, see Table 1) for determination of frequencies. The key outcome of this is to improve the frequency determination of the stellar pulsational behaviour and the confidence in the subsequent modes identified for them. The spectra obtained for this study were from two sites. Whilst this does offer some relief from the 1-day sampling problem it does not alleviate it completely as there are many more spectra obtained from HARPS and FEROS than from HERCULES. Figure 1 shows the uneven distribution of spectra over a period of time phased on one day.
Spectra for HD 189631 phased to 1 d−1 showing uneven sampling of spectra.
In combining the cross-correlated line profiles from the three spectrographs (HARPS, FEROS and HERCULES) into one data set, the mean line profiles needed to be similar. As HARPS has the highest resolution of the three spectrographs, a greater number of lines can be chosen for creating the δ-function mask for the set by using the HARPS spectra. The cross-correlated line profiles from FEROS and HERCULES were scaled such that their mean line profiles were similar to the mean line profile from HARPS.
3 FREQUENCY ANALYSIS
Figure 2 shows the spectral windows for observations of HD 189631 from each contributing site and as a whole. Distinctive peaks are readily seen at one cycle-per-day and subsequent aliases. Figure 2a shows the spectral window for the HARPS observations. There are 273 observations over a relatively short timeframe. That they were collected over just a few weeks is significant, as the peaks in the spectrum are broad and give relatively poor definition of the frequencies. In comparison, the other spectra were taken over a longer timespan, but with fewer spectra in total.
Spectral window for HD 189631 observations per site. (A) HARPS; (B) FEROS, (C) HERCULES, (D) all observations combined.

The Fourier spectra from FEROS appear particularly noisy owing to the relatively low number of observations and short timebase over which the observations span. In comparison, the spectra from HERCULES are of a similar number but over a much longer timebase giving better resolution of the peak and more depressed side-lobes than FEROS, but a similar level of 1-day aliasing.
The number of HARPS spectra means that it dominates in the collective spectral window (Figure 2d), but the collective timebase is now much longer, giving good sharpness of peaks for frequency determination.
The frequencies and the significance of each identified frequency were calculated using sigspec (Reegen Reference Reegen2011). An conservative acceptable significance for an identified frequency was deemed to be sig(f) > 15 following Brunsden et al. (Reference Brunsden, Pollard, Cottrell, Wright and De Cat2012a).
3.1 Frequency analysis from moments
The first four moments were calculated from the cross-correlated line profiles in famias. sigspec was used to determine the frequencies and their significances, sig(f), found in the zeroth to third moments of the cross-correlated line profiles (see Table 3). Strongly seen in the zeroth moment is the 1d−1 frequency (f m1) and two aliases of it at f m2 and f m4. The 1d−1 frequency also appears as f m3 in M 1 and as f m6 in M 3.
In the first moment (M 1), several strong frequencies are noted that also appear in other moments. In M 1, f m1 (1.848 d−1) appears very strongly but only marginally visible in the other moments as perhaps a 1-day alias of f m7 in M 1, f m3 in M 3, and perhaps f m5 in M 2. f m2 at 1.675 d−1 appears in M 2 as f m2 (1.677 d−1) and again in M 3 as f m4 (1.666 d−1). This frequency corresponds to f 1 as found by Maisonneuve et al. (Reference Maisonneuve2011) (see Table 2). f m4 (1.420 d−1) appears as f m1 in both the second and third moments (1.423 d−1 and 1.420 d−1 respectively). It may also appear in M 1 as f m1; a possible combination of twice f m4 - f m3. This frequency corresponds to f 2 in Maisonneuve et al. (Reference Maisonneuve2011). In M 1, f m5 (0.071 d−1) also appears as f m2 in M 3 and as f 3 in Maisonneuve et al. (Reference Maisonneuve2011). f m6 (0.561 d−1) in M 1 is also seen (for each moment) as f m8 (0.564 d−1) in M 3.)
3.2 Frequencies from pixel-by-pixel analysis
Frequencies were determined from a pixel-by-pixel analysis of the cross-correlated line profiles. Fourier spectra were created and the frequency corresponding to the highest peak was chosen if above the significance level (Zima Reference Zima2008). A pre-whitening was carried out, removing this. A pre-whitening was carried out, removing this frequency and the residuals used as the basis for the next frequency determination.
The determination of frequencies by famias is perhaps optimistic, as the calculation of the noise floor gives a rather conservative bound on the distinction of noise from a real signal. This may omit significant frequencies if taken alone. Using SigSpec also has problems in that it can over-detect frequencies as it takes little consideration of the intrinsic uncertainty from the contributing spectra. These two techniques were used together to obtain a reasoned set of frequencies for analysis.
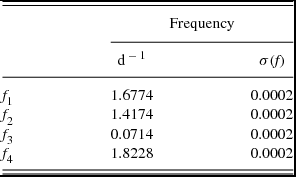
The retention of the frequencies for further analysis was decided on the basis that it appears strongly in both the pixel-by-pixel analysis and the first moment Fourier spectra. The uncertainties derived from sig(f) in Table 3 using the equation of Kallinger, Reegen, & Weiss (Reference Kallinger, Reegen and Weiss2008) were used with the final set of frequencies (Table 4).
Frequencies determined from analysis of moments for HD 189631. Frequencies for the zeroth (M 0) to third (M 3) moments are shown. The sigspec significance for each frequency is given by sig(f).
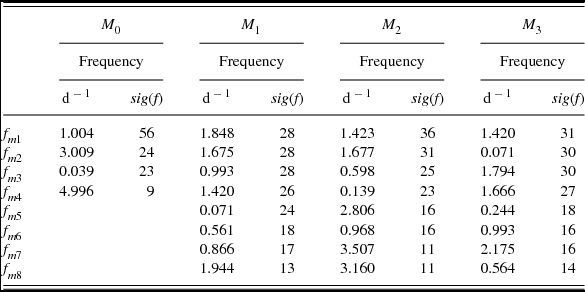
The finalised list of frequencies determined for HD 189631 from pixel-by-pixel analysis and from moments.
Using the frequencies from Table 4 it was found that not all of them were sampled well across the whole phase of variation. In particular the smallest frequency f 3 can be seen to be a little sparsely sampled (see Figure 3). The paucity of data through phases of about 0.6 and 0.9 make confident model-fitting for mode identification more challenging.
Phase sampling for the four frequencies over the dates of observations for HD 189631. (a) f 1, (b) f 2, (c) f 3, (d) f 4. f 3 has the least well sampled phase which is to be expected as the observed period is of the order of two weeks.

The variation of the line profiles over the phase of pulsation is shown in Figure 4. f 2 shows strong features in the wings that appear to remain stationary over some of the pulsational period. Also notable is the slight offset in f 3 (Figure 4 c) which might be accounted for by poor sampling over the phase, skewing the mean profile away from a mean velocity of zero. The retrograde motion of f 3 across the line profile is clearly seen when compared to the other frequencies.
Line profile variation phased to each determined frequency: (a) f 1, (b) f 2, (c) f 3, (d) f 4. The mean line profile has been subtracted in each case.

Aliases of these frequencies were also examined; 1, 2, and 3 days ± f, but these were much less strongly detected than those frequencies already identified.
4 MODE IDENTIFICATION
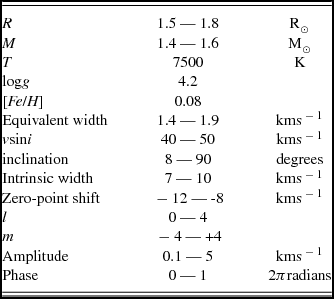
The first frequency (f 1 = 1.6774 d−1) was fit with models generated in famias using the parameters outlined in Table 5. Care was taken to limit the lower bound of the inclination to always be above the inclination at which the equatorial velocity exceeded its critical upper limit. For HD 189631 with an assumed mass of 1.5 M⊙ and radius of 1.6 M⊙ typical of γ Doradus stars, (Kaye et al. Reference Kaye, Handler, Krisciunas, Poretti and Zerbi1999) and a vsini of 43.6 kms−1, a critical inclination of 6° is found, above which equatorial rotation approaches a breakup scenario. The lower limit for the inclination therefore was set at 8°. famias was permitted to examine combinations of parameters which would generate non-physical scenarios, but these did not produce good fits
The parameters used for models generated for mode identification in HD 189631.
The minima of reduced χ2 values for the models generated showed decisively that f 1 (1.6774 d−1) was best fitted by an (l, m) = (1, +1) mode. This mode was fitted with a reduced χ2 of 11, the next best fit (a 4, 0 mode) had a reduced χ2 of 33. This is reasonable considering the ratio of the rotation frequency to intrinsic pulsation frequency is 0.64 (ν = 1.28 in Townsend (Reference Townsend2003)). The fit of the phase is clearly much better for the best fit of the (l,m) = (1, +1) mode (Figure 5). This identification agrees with that of Maisonneuve et al. (Reference Maisonneuve2011) for the dominant frequency. This best fit mode was achieved with an inclination of 56.0°.
Modes fitted to f 1 of HD 189631. Here the observed amplitude and phase across the line are given by the blue line, with error bounds in green. The best fit of the (l,m) = (1, +1) mode is given as the solid line and the best fit of the (l,m) = (4, 0) mode is given as the dashed line. Note that a difference of an integer in phase means that the pulsation has the same phase.

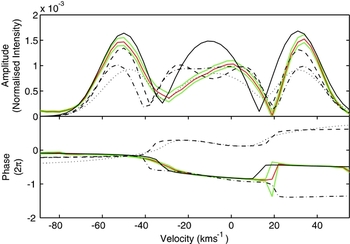
The mode identification of f 2 = 1.4174 d−1 was similarly undertaken. It was best fit with an (l, m) = (1, +1) mode (χ2 = 13) but with an inclination of 75°. Other close fits were an (l, m) = (2, −2) (with an inclination of 13° and a χ2 = 24) or an (l, m) = (4, 0) mode (with an inclination of 90° and χ2 = 25). This difference in the inclinations of the best models is particularly significant when one considers that all modes appear in a star with only one rotational inclination angle (see Section 5). The minima for the inclination are broad. The mode identified for this frequency by Maisonneuve et al. (Reference Maisonneuve2011) was a (l, m) = (3, −2) which we find to have a reduced χ2 value of 40, much greater than the best fit (l, m) = (1, +1) mode obtained here. Figure 6 shows the three best fits and that of Maisonneuve et al. (Reference Maisonneuve2011) for this frequency. The discontinuity in phase at around 20 kms−1 has large associated uncertainties and the phase is generally poorly fit by these models. The asymmetry of the central bump is also poorly modelled with famias.
Mode identifications for f 2 of HD 189631. Here the observed amplitude and phase across the line are given by the blue line, with error bounds in green. The (l,m) = (1, +1) mode is shown with a solid line, the (l,m) = (4, 0) mode is shown with a dashed line the (l,m) = (2, −2) mode is shown with the dash-dotted line, and the (l,m) = (3, −2) mode is shown with a dotted line.
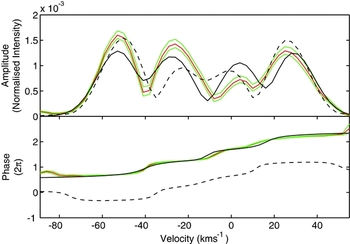
The mode identification of f 3 = 0.0714 d−1 found two retrograde (m < 0) modes showing merit. It was best fit with an (l, m) = (2, −2) mode (χ2 = 11) with the other option being (l, m) = (4, −2) (χ2 = 13) mode. The difference in the amplitude profile from these two modes is small and, with the asymmetry in the central bump in the observed profile, they are similarly well fit by either a mode with a single central bump or a mode with two low-amplitude central bumps. The difference in the phase of pulsation across the line (Figure 7) favours the (l,m) = (2, −2) mode. Maisonneuve et al. (Reference Maisonneuve2011) too found a (l, m) = (2, −2) mode for this frequency.
Best fitted modes to f 3 of HD 189631. Here the observed amplitude and phase across the line are given by the blue line, with error bounds in green as before. The (l,m) = (2, −2) mode is shown with a solid line, the (l,m) = (4, −2) mode is shown with a dashed line.
The mode identification for f 4 is much more uncertain than the prior modes. The amplitude is small, as it is found in the residuals from three stronger periodic variations. Maisonneuve et al. (Reference Maisonneuve2011) found a (l, m) = (4, +1) mode but was uncertain and suggested a (l, m) = (2, −2) mode as an alternative. These prior results and recommendations are not in good agreement with those obtained here. There are good fits of the (l, m) = (1, +1) mode (χ2 = 4), followed by an (l, m) = (2, +2) (χ2 = 11) (Figure 8), and more distantly followed by those of Maisonneuve et al. (Reference Maisonneuve2011). In observing the phase of these pulsational models we see a poor fit to f 4 of the (l, m) = (4, +1) mode (χ2 = 13) as recommended by Maisonneuve et al. (Reference Maisonneuve2011).
Best fitted modes for f 4 in HD 189631. Here, as before, the observed amplitude and phase across the line are given by the blue line, with error bounds in green. The best fit of an (l, m) = (1, +1) mode is shown with a solid black line, the best fit of an (l, m) = (2, +2) is shown with a dash-dotted line, the best fit of an (l, m) = (4, 0) mode is shown with a dashed line, and the best fit of an (l, m) = (4, +1) mode is shown with a dotted line.

5 COMBINED MODE IDENTIFICATION
Mode identification was undertaken with each frequency simultaneously, forcing the models to use one value of each stellar parameter for all modes being fitted. This assumes the pulsation axis for each mode is aligned with the rotation axis. Modes that are incompatible with each other generate a poor reduced χ2 when fitted together, such as those with very different optimal inclinations. It may be possible that pulsations are misaligned with each other or with the rotational axis but this has not been considered here.
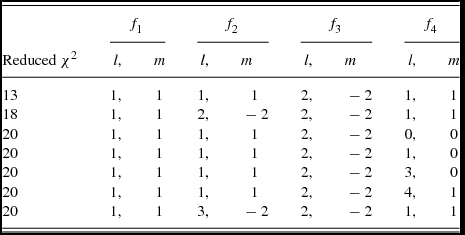
All four frequencies were fit simultaneously with models of varying l and m values. As expected the modes found from individual fitting were generally found again in the multimodal fit. The best fitting modes are shown in Table 6.
Reduced χ2 values for multiple simultaneous mode identifications of HD 189631. Only the l, m combinations with the lowest χ2 values are shown.
6 DISCUSSION
The best fit for each frequency was that of f 1 being an (l,m) = (1, +1) mode, f 2 an (l,m) = (1, +1) mode, f 3 an (l, m) = (2, −2) mode and f 4 an (l,m) = (1, +1) mode.
Modes identified from simultaneous fits of all frequencies are in agreement with those obtained by fitting modes to frequencies individually, but are conspicuously not in complete agreement with those of Maisonneuve et al. (Reference Maisonneuve2011). The modes identified here are however in excellent agreement with those of to form the line profiles where a more simple cross-correlation was applied here. That the same modes and frequencies were identified using different methods and data sets further strengthens the confidence one may place in these results and those of Tkachenko et al. (Reference Tkachenko, Van Reeth, Tsymbal, Aerts, Kochukhov and Debosscher2013).
An aspect to note is the difference in the χ2 values obtained here versus Maisonneuve et al. (Reference Maisonneuve2011). Maisonneuve et al. (Reference Maisonneuve2011) fit not just the phase and standard deviation profile but the line profile too. The much larger scale in the line profile means that any deviation from the fitted model to the observed line profile dominates the χ2 obtained at the expense of the fits of the deviation and phase profiles.
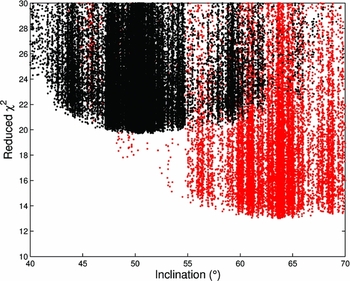
A possible explanation of this discrepancy in these mode identifications is that more data is available for this study. Improvements were achieved in the frequencies determined in this study, and similarly in the density of data over the narrow transitions seen in the phase for each frequency allowing closer modelling. Alternatively perhaps the presence of multiple local χ2 minima in the parameter-space searched led to to the different modes identified. This is problematic where parameters with the possibility of multiple minima, like the azimuthal order m are concerned. The broadness of the minima in Figure 9 gives some idea of the low level of sensitivity to the inclination parameter i. The inclination i, allows for viewing of different sums over the pulsational vector field in the line-of-sight. In the (l,m) = (3, −2) case it determines how the equatorial node is presented. What should be noted here is that for low ratios of vertical to horizontal displacement as found in g-mode pulsations, famias does not treat i well. A more robust determination of i could be used.
Reduced χ2 values for different inclinations used in the model generation for the fitting to f 2 of an (l,m) = (1, +1) mode in red and (l,m) = (3, −2) mode in black (as found by Maisonneuve et al. (Reference Maisonneuve2011)). These fits were obtained from the simultaneous multi-modal fitting of all four frequencies.
A noteworthy result of this mode identification is the detection of (l,m) = (1, +1) modes for three of the frequencies. There may well be some selection effect at work either observationally due to the strong driving (Balona & Dziembowski Reference Balona and Dziembowski2011) and resultant large amplitudes (Brunsden et al. Reference Brunsden, Pollard, Cottrell, Wright and De Cat2012a) for this modal geometry.
HD 189631 is typical of γ Doradus stars except for the detection of the retrograde pulsation f 3. There have been very few of these identified spectroscopically to date. It may simply be that the similarity between the stellar rotational frequency and the pulsational frequency makes them more challenging to detect as the scenario approaches that of a standing wave as we observe it.
ACKNOWLEDGEMENTS
This work was supported by the Marsden Fund.
The authors acknowledge the assistance of staff at Mt John University Observatory, a research station of the University of Canterbury.
This research has made use of the SIMBAD astronomical database operated at the CDS in Strasbourg, France.
Mode identification results obtained with the software package FAMIAS developed in the framework of the FP6 European Coordination action HELAS (http://www.helas-eu.org/).



