

Introduction
The Asian citrus psyllid, Diaphorina citri Kuwayama, Hemiptera: Psyllidae, is a phloem feeding insect native to Asia and the Far East with a host range of only Citrus spp. and its near Rutaceae relatives (Halbert & Núñez, Reference Halbert and Núñez2004). Diaphorina citri causes little direct feeding damage, but it vectors the phloem limited bacterial citrus pathogens, ‘Candidatus Liberibacter asiaticus’, ‘C. L. africanus’, and ‘C. L. americanus’, which cause ‘citrus greening disease’ or Huanglongbing (HLB), a disease which is considered one of the most damaging to citrus (Capoor et al., Reference Capoor, Rao and Viswanath1967; Martinez & Wallace, Reference Martinez and Wallace1967; Teixeira et al., Reference Teixeira, Saillard, Eveillard, Danet, Inácio da Costa, Ayres and Bové2005). The impact of this disease on world citrus production and concern over its continued spread have lead to research on the vector's plant host range, interactions with parasitoids and host-vector-pathogen interactions (Bové, Reference Bové2006; Halbert & Manjunath, Reference Halbert and Manjunath2004; Hall et al., Reference Hall, Hentz and Adair2008). Despite these endeavors, there is virtually no information available regarding D. citri genetic diversity and the implications this may hold for these and other studies.
The Asian citrus psyllid's current distribution extends from the Arabian Peninsula (Saudi Arabia and Yemen) and from Afghanistan through to the Indian Subcontinent, Southeast Asia and the Ryukyu Archipelago and Kyushu in Japan, Taiwan, Hong Kong and the coastal provinces of Guangxi, Guangdong, Fujian and Zhejiang in China, the Philippine Islands and through the Indonesian archipelago to northeastern Papua New Guinea; in the Pacific Islands of Hawaii and Guam; the continental USA (Alabama, California, Florida, Georgia, Louisiana, Mississippi, South Carolina and Texas), as well as the Caribbean (Bahamas, Cayman Islands, Cuba, Jamaica, Dominican Republic, Guadeloupe and the Commonwealth of Puerto Rico), Central (Honduras and Mexico) and South America (Argentina, Brazil, Paraguay, Uruguay and Venezuela) and the Indian Ocean islands of Mauritius and Réunion (Costa Lima, Reference Costa Lima1942; French et al., Reference French, Kahlke and De Graca2001; Halbert & Manjunath, Reference Halbert and Manjunath2004; Halbert & Núñez, Reference Halbert and Manjunath2004; Mead, Reference Mead1977; Pluke et al., Reference Pluke, Qureshi and Stansly2008; Tsai et al., Reference Tsai, Wang and Liu2000). Because of the lack of global phylogenetics for this species, hypotheses describing its origin include either southeastern Asia or southwestern Asia (India/Pakistan) (Mead, Reference Mead1977). Anthropogenic spread via the pathway of infested plant material has been the principal means by which this pest has spread. This was responsible for the New World invasions that have seen its distribution expand to include countries in North, Central and South America and the Caribbean (Núñez, Reference Núñez2004). Diaphorina citri was first reported from the continental USA (Florida) in 1998 (Bové, Reference Bové2006) and now occurs from Florida to California.
Understanding the genetic diversity underlying an invasive pest is a key element that supports the development of effective management strategies (Rosen, Reference Rosen and Romberger1978; Schauff et al., Reference Schauff, LaSalle and Wijeskara1998). Complicating the analysis of genetic diversity among world populations of many invasive insects is that many contain a cryptically diverse collection of populations that cannot be easily categorized by morphological characteristics (Scheffer, Reference Scheffer2000; Clarke et al., Reference Clarke, Armstrong, Carmichael, Milne, Raghu, Roderick and Yeates2005). Diversity can be represented as distinct biotypes and may extend to reproductive isolation, suggesting the existence of multiple cryptic species (Bickford et al., Reference Bickford, Lohman, Sodhi, Ng, Meier, Winker, Ingram and Das2007; De Barro et al., Reference De Barro, Liu, Boykin and Dinsdale2011). The emergence of molecular systematic approaches has allowed the more precise and rapid characterization of diversity among populations of invasive species beyond what can be ascertained from morphological evaluations. This information can be used to identify the geographic origin of the invaders, if not directly, then at least from an evolutionary perspective (Xavier et al., Reference Xavier, Santos, Lima and Branco2009; De Barro & Ahmed, Reference De Barro and Ahmed2011). Such knowledge is invaluable when looking for effective biological control agents, and understanding basic biology and ecology.
The purpose of this study was to use mitochondrial cytochrome oxidase I (mtCO1) to assess the genetic relationships between different collections of D. citri from around the world. The questions we set out to answer were: (i) Can mtCOI haplotype analysis provide an insight into phylogeographic relationships of Old World D. citri populations? If so, (ii) is there population structure that can be used to monitor global movement of specific genetic types? And, (iii) is there evidence of cryptic species based on relative genetic relationships of individuals from the different collections?
Methods
Collection of global D. citri collections and outgroup selection
Individuals were collected from Bali, Brazil, China, USA (Florida and Texas), Guadeloupe, India, Java, Mauritius Island, Mexico, Pakistan, Puerto Rico, Réunion Island, Saudia Arabia, Taiwan, Texas-USA, Thailand and Vietnam (table 1). All material was stored in 70% ethanol until DNA was extracted. In most cases, multiple individuals were collected in each location. Truncated sequences (sequences less than 550 base pairs) were deleted to leave a final aligned data set of 212 individual sequences. These sequences were then screened using a similarity matrix, and eight unique haplotypes were identified. An outgroup mtCOI sequence was from Pachypsylla venusta, the hackberry petiole gall psyllid (NC_006157). This was chosen because it was the closest psyllid relative for which the entire 612bp mtCOI sequence was available and was used to aid in alignment.
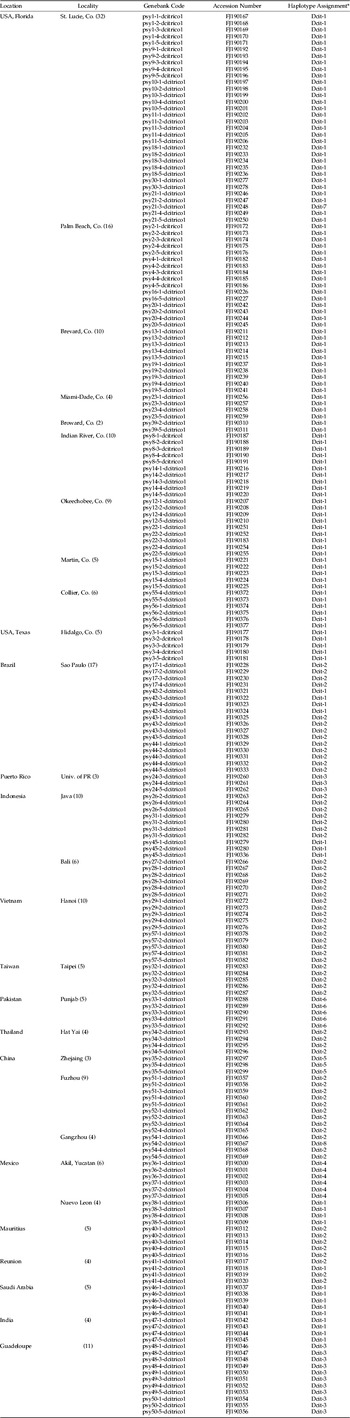
Unique haplotypes and polymorphism locations observed from the alignment of the 212 Diaphorina citri mtCOI sequences.
* Substitution type is indicated as (S) synonymous or (Ns) nonsynonymous.
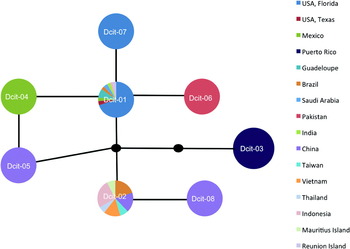
Haplotype network generated with statistical parsimony analysis of D. citri mtCOI DNA sequence. Multicolored markers indicate the presence and identity of multiple haplotypes found within a region. The block dots represent hypothetical haplotypes. See table 3 to evaluate haplotype frequencies.
Identification of novel COI primers specific for D. citri
Amplification of mtCOI was not successful using the universal primers C1-J-2195 and TL2-N-3014 (Simon et al., Reference Simon, Frati, Beckenbach, Crespi, Lui and Flook1994). New mtCOI primers for D. citri were designed from an EST library generated at the USDA (Hunter et al., Reference Hunter, Katsar, Shatters, McKenzie, Weathersbee and Hall2008) and available in GenBank (http://www.ncbi.nlm.nih.gov/). The primers were: DCITRI COI-L 5′- AGG AGG TGG AGA CCC AAT CT and DCITRI COI-R 5′- TCA ATT GGG GGA GAG TTT TG. These amplify an 821 base pair fragment of the mtCOI coding region.
DNA extraction, amplification and sequencing
Total DNA was extracted using Cartagen's (http://www.cartagen.com) rapid homogenization kit for plant leaf DNA amplification (catalog number 20700-500, lot number 08180400134). The 30μl PCR reactions were heated at 94°C for two minutes followed by 35 cycles of 30s at 94°C denaturation, 30s at 53°C annealing, 1min at 72°C extension and a final extension of 72°C for 10min in a MJ Research PTC-200 Peltier thermal cycler. The PCR reactions were composed of 27μl Platinum PCR SuperMix (Invitrogen, catalog number 11306-016), 1μl forward primer (10 ρmol), 1μl reverse primer (10 ρmol), and 1μl DNA template. Prior to sequencing, the amplified products were cleaned using the montage PCR filter units from Millipore (catalog number UFC7PCR50). All sequencing was performed using the amplification primers and BigDye® Terminator Cycle Sequencing Kits. Sequence analysis was conducted on an Applied Biosystems 3730×l DNA Analyzer. Sequence fragments were assembled with Sequencher ® version 4.2 (Gene Codes Corporation, 2004) and aligned using ClustalX (Thompson et al., Reference Thompson, Gibson, Plewniak, Jeanmougin and Higgins1997). Minor alignment issues were corrected using Se-Al (Rambaut, Reference Rambaut2000). Sequences generated at the United States Horticultural Research Laboratory (USHRL) were deposited in GenBank (table 1), and voucher specimens are deposited in the USHRL collection in Fort Pierce, Florida.
Haplotype network construction
A haplotype network was constructed using the statistical parsimony program TCS (Clement et al., Reference Clement, Posada and Crandall2000). TCS estimates phylogenetics networks from DNA sequences or nucleotide distances using the statistical parsimony algorithm which estimates the 95% parsimony limits and outgroup weights (Templeton et al., Reference Templeton, Crandall and Sing1992). Computation was performed using an alignment of each of the eight haplotypes produced in ClustalX. The program was used to construct a statistical parsimony cladogram from parsimonious connections calculated at P j≥0.95 and a matrix of absolute pairwise differences was calculated. Haplotype frequencies were not used to calculate outgroup probabilities, as there was minimal sharing of haplotypes among locations and our sampling effort was not uniform (e.g. there was more sampling within Florida than elsewhere).
Results and discussion
Identification of D. citri mtCOI haplotypes
Alignment of the mtCOI sequences showed the presence of eight polymorphic sites within the 612 bps. Four of the substitutions corresponded to synonymous sites and four to non-synonymous (amino-acid altering) sites (table 2). Six of the eight polymorphisms were the result of transitions while two were from transversions. The eight haplotypes were highly similar with shared identities >99% (table 2). Two of these haplotypes (Dcit-1 and Dcit-2) were the most frequent and represented 87% of the sequences (table 3). Of the remaining six haplotypes, two (Dcit-7 and Dcit-8) were rare variants found among populations predominated by Dcit-1 or Dcit-2. The other four haplotypes (Dcit-3, Dcit-4, Dcit-5 and Dcit-6), without the benefit of larger sample sizes, appear to be fixed in their respective populations.
Geographic distribution and abundance of Diaphorina citri haplotypes.
The rare haplotypes Dcit-7 and Dcit-8 were each recovered from a single individual in Florida and China, respectively. Moreover, each of these rare variants differed from all other sequences by a single non-synonymous (amino acid altering) substitution at an otherwise invariant site. Inspection of sequence chromatograms shows clean sequence reads for both variants, indicating that these were not related to sequence read errors.
Global relationships of D. citri
Due to the minimal sequence diversity in this intraspecific haplotype comparison, and the resulting poor support for the phylogenetic inference using standard tree construction methods (data not shown), it was determined that a haplotype network analysis would be the most appropriate way to consider the relationship between haplotypes (Hart & Sunday, Reference Hart and Sunday2007; Chen et al., Reference Chen, Strand, Norenburg, Sun, Kajihara, Chernyshev, Maslakova and Sundberg2010; De Barro & Ahmed, Reference De Barro and Ahmed2011). The analysis using TCS is graphically represented in fig. 1.
By considering the two most frequently encountered haplotypes and their singleton derivatives as separate ‘groups’, Dcit-1 groups with Dcit-4, Dcit-6 and Dcit-7 to form what we refer to as the SWA group. Dcit-1 was the most frequently encountered haplotype in this group. The other haplotype group was composed of Dcit-2 and Dcit-8 and represents the SEA group. Placement of Dcit-3 (all Caribbean collections) and Dcit-5 (a single Chinese collection) was ambiguous, possibly because of the small numbers collected from those areas and because of the greater number of nucleotide substitutions in relation to the most common sequences.
This network analysis shows a diverged haplotype, Dcit-3, distributed in the Caribbean yet absent from all other samples (fig. 1). This result was surprising since the Caribbean was thought to be the source of D. citri that entered Florida (Halbert & Núñez, Reference Halbert and Núñez2004). Since Dcit-3 is not found in Florida, either the Florida D. citri have come from some location other than the Caribbean or there is greater diversity in the Caribbean than we observed in the four collections (Psy-24, -48, -49, -50) and 13 individuals obtained from Puerto Rico and Guadaloupe (table 1). The relatively distant relationship between the Florida and Caribbean haplotypes (three substitutions, see fig. 1) indicate that the invasion of Florida did not come from the established Caribbean (Guadeloupe and Puerto Rico) populations, but more sampling is needed to verify these findings. Further, because D. citri is hypothesized to have entered the Caribbean as recently as the 1990s (Hall, Reference Hall2008) and the Caribbean samples have a mtCOI genotype that was not found anywhere else in the old world, we are left to draw the conclusion that there is more worldwide diversity than what was captured in our sampling.
Within the Old World, few haplotypes predominate. However, the distribution of these haplotypes suggests a phylogeographic break. Dcit-2 occurs in >90% of all the Southeast Asia individuals and 75% of all Chinese samples. Despite its common occurrence in SE Asia and China, it appears to be absent from the Middle East and the Indian subcontinent. Conversely, Dcit-1 and Dcit-6, just one synonymous mutation away, are the only haplotypes observed in both the Middle East and Indian subcontinent. Considering all the haplotypes present in Old World collections, Dcit-1 and Dcit-6 displayed a southwestern Asia (SWA) bias and Dcit-2, -5 and -8 a southeastern Asia bias.
In the New World, where D. citri was introduced within the last 25 years (Halbert & Núñez, Reference Halbert and Núñez2004), a geographical bias to haplotype distribution was also observed. With the exception of one individual carrying haplotype Dcit-7, all 23 USA collections (99 individuals) contained Dcit-1. The individual carrying Dcit-7, which differs by a single non-synonymous substitution, was collected from St Lucie County, Florida alongside Dcit-1. In the four Brazilian collections, both Dcit-1 and Dcit-2 haplotypes were observed, but not in the same collections. In Mexico, three collections were analyzed, one from northern Mexico near the Texas, USA border and the other two from the Yucatan Peninsula. The collection close to Texas contained the same haplotype found in Texas (Dcit-1), but the Yucatan Peninsula collections were fixed for a unique haplotype Dcit-4, which differed from Dcit-1 by a single nucleotide. Although D. citri is a pest that has spread worldwide, unlike other pests such as the whitefly Bemisia tabaci (Boykin et al., Reference Boykin, Shatters, Rosell, McKenzie, Bagnall, De Barro and Frohlich2007b; Dinsdale et al., Reference Dinsdale, Cook, Riginos, Buckley and De Barro2010), the low level of sequence diversity indicates that it is most likely a single species rather than a species complex.
A major aim of this study was to show how D. citri in Florida are related to D. citri elsewhere. We found that the Florida D. citri were most closely related to those from Mexico, Pakistan, Brazil, Texas, Saudi Arabia, India, Indonesia and Réunion Island, and includes the SWA sequences. New World populations show three distinct separations based on phylogeographic interpretation of the haplotype network (fig. 1). North American continental populations (USA: Florida and Texas; and Mexico) belong to the SWA group, whereas individuals from locations in South America were either SWA or SEA in origin; SWA and SEA did not co-occur in any of the collections, suggesting two separate introductions. The only case where a collection from a single location contained individuals from both SWA and SEA was in the Indian Ocean island of Réunion. It is interesting to consider here whether there is some factor that limits the capacity of these two groups to co-occur. The only other New World locations sampled were the two Caribbean islands of Puerto Rico and Guadeloupe, where both contained the same haplotype Dcit-3.
Geographic origins of D. citri
Network-based genealogies can offer insight into ancestral sequences, as these sequences are expected to be common, widely distributed and highly connected (Chen et al., Reference Chen, Strand, Norenburg, Sun, Kajihara, Chernyshev, Maslakova and Sundberg2010). While these predictions hold in theory, application is often difficult. Insufficient or non-uniform sampling schemes can bias the frequencies of observed haplotypes. Anthropogenic activity can alter geographical distributions at a scale and rate well beyond the ability of genetic systems to equilibrate. In our study, >60% of our samples are from the New World where D. citri is invasive. Using frequency of occurrence or geographic distribution as a metric for predicting ancestry would bias predictions by frequency of invasion and invasion success.
While both haplotype frequency and geographical distribution are likely not reflective of equilibrium evolutionary processes, patterns of haplotype connectivity may be more robust. Using this criterion, the mitochondrial haplotype network for D. citri suggests a basal and thus ancestral position for Dcit-1 (fig. 1). Even a conservative analysis, excluding all New World haplotypes that were singleton branches from the main Dcit-1 and Dcit-2 groups leaving only old world haplotypes, predicts Dcit-1 as ancestral based on connectivity.
Although early work suggested a far eastern Asia (Asia region to the east of India) origin of D. citri (Mead, Reference Mead1977), more recent reconstructions based on plant host origins and historical information suggest a southwestern Asia origin, i.e. India (Hall, Reference Hall2008). Therefore, ancestral placement of the SWA group supports the more contemporary view of D. citri evolution. However, because of limited sampling in the Old World, we do not have a clear phylogeographic picture of the complete distribution of the SWA and SEA groups. The phylogeographic interpretations of our data identify two geographical redistributions of D. citri. First, some apparent geographical separation between the SWA and SEA groups that requires more intense sampling in the Old World to provide a true characterization of this relationship, and then a more recent radiation of the SWA and SEA groups into the New World most likely within the last 25 years (Halbert & Núñez, Reference Halbert and Núñez2004). There is one earlier report of D. citri from Brazil in the early 1940s (Costa Lima, Reference Costa Lima1942); however, no one can substantiate this record, and it is certain that established populations were not reported until much more recently.
Conclusion
Our data indicate that with respect to the mCOI haplotypes and within the limits of our global sampling, there is very little genetic diversity among the populations worldwide. Despite this limited diversity, enough information was gained to partially answer the three questions on which this research was based.
(i) Can mtCOI haplotype analysis provide an insight into phylogeographic relationships of Old World D. citri populations? Limited sampling became a factor in this interpretation; however, two mtCOI haplotypes predominate, Dcit-1 and Dcit-2. These differed from each other by just two nucleotides and formed the basis of Dcit-1 group individuals (Dcit -1,-4, -6 and -7) and Dcit-2 group individuals (Dcit-2 and -8), as defined by those individuals whose mtCOI sequence diverges from the most common sequence (either Dcit-1 or Dcit-2) by only one nucleotide. Distribution of these two haplotype groups displayed some apparent Old World geographical bias. The Dcit-1 group was more abundant in SWA samples, and the Dcit-2 group was more abundant in SEA samples. Clearly, more sampling was done in SEA (Indonesia, Vietnam, Taiwan, Thailand and China) with 12 different collections, than in SWA (Pakistan, Saudia Arabia and India) with only three collections. However, if collections from Mauritius and Reunion are excluded as anthropogenic introductions because they are not considered a center of D. citri diversity and are isolated islands where both Dcit-1 and-2 are present, 11 of the 12 SEA samples contained individuals belonging to the Dcit-2 group, while all SWA samples contained only Dcit-1 group individuals. Based on these results, there is an appearance of geographically distinct populations; however, due to the limited sequence divergence between the observed groups, more in-depth sampling is needed for this to be verified. The authors suggest that further sampling from these Middle East and Asian countries needs to be conducted to better survey diversity and also utilize the other genetic markers such as microsatellites (Boykin et al., Reference Boykin, Bagnall, Frohlich, Hall, Hunter, Katsar, McKenzie, Rosell and Shatters2007a).
(ii) Is there population structure that can be used to monitor global movement of specific genetic types? Analysis of the New World collections showed that invasions into North America came from the SWA group only, whereas those involving South America came from both the SWA and SEA groups. There was extensive sampling in the USA (22 collections within Florida) and only minimal sampling in South America (four collections), so it is unlikely that SEA populations were missed in the USA. Despite this observed difference in haplotype distribution in the New World, our limited Old World sampling and the small amount of global mtCOI sequence variation precludes the ability to provide a concise determination of origin. However, knowledge from this research may be useful in searching for effective biological control agents and may help explain differences in effectiveness of Tamarixia radiata, a parasitoid introduced in the New World to control invasive populations of D. citri (Hoy & Nguyen, Reference Hoy and Nguyen2001; Hoy et al., Reference Hoy, Nguyen and Jeyaprakash2004; Michaund, Reference Michaund2004; Pluke et al., Reference Pluke, Qureshi and Stansly2008; Barr et al., Reference Barr, Hall, Weathersbee III, Nguyen, Stansly, Qureshi and Flores2009). Although, one needs to be cautious here, as ecological factors may be as or more important than genetic variability within the parasitoid and should not be overlooked.
(iii) Is there evidence of cryptic species based on relative genetic relationships of collections? All individuals were closely related, and there is no evidence for complex cryptic species structure within these populations. This may be expected as genetic variation is expected to increase with time since divergence (globalization) and increased host variability (local adaptation). D. citri has a very limited host range (only within the Rutaceae) and has only recently (within the last 15 to 25 years) spread to the New World.
Acknowledgements
The authors would like to thank Ankush Zitsi, Chris Knox, Paula Hall, Kathy Moulton, Matthew Hentz and John Prokop for laboratory assistance of the D. citri collections at the USHRL. Diana Percy provided valuable discussions regarding sequencing of the COI region. W. Evan Braswell provided useful comments to the manuscript, table 3 and fig. 1. We thank Y. S. Ahlawat, Virendra Baranwal, Shahid Nadeem Chohan, Shu-Sheng Liu, Baoli Qui, Ratana Sdoodee and Siti Subandiyah for providing us with samples.


 Open access