

1. INTRODUCTION
Ice-core drilling through snow/firn layers and solid ice to depths of 200–300 m is an important part of the International Partnerships on Ice Coring Sciences spatial 2000-year array (IPICS ‘2k Array’). This includes a network of ice-core climate and climate-forcing records for the last two millennia that can give answers about present and future climate change depending on natural climate variability. It is of great significance for research in geochemistry, microbiology, climatology and environmental science (Christner and others, Reference Christner2000; Fernandoy and others, Reference Fernandoy2010; Kawamura and others, Reference Kawamura2003), and is of value for the development of human society and understanding of the natural world. Dry drilling through firn is also a necessary preparatory step for intermediate and deep drilling with a drilling fluid.
To drill through upper permeable layers, cable-suspended electromechanical auger drills (so-called shallow drills) are usually used, in which cuttings are removed by auger conveyer to a chamber that is part of the drill (Talalay, Reference Talalay2016). The main feature of cable-suspended drills is that an armored cable with a winch is used instead of a drill pipe to provide power to the down-hole motor system and to retrieve the down-hole unit. Using a cable allows a significant reduction in power and equipment weight and can decrease the time required in round trip operations compared with pipe-based systems. During recent decades, shallow drills have become a very popular method of ice-core sampling. While some of them have performed very well, the main drawback is relatively short runs (typically, 1.0–1.2 m), and further development of shallow drilling systems remains an active issue today.
In search of new ways of shallow drilling and increasing drilling efficiency, we have developed an electromechanical drill with near-bottom air reverse circulation instead of auger conveying. Air drilling with direct airflow circulation in ice was first used in the mid-20th century on conventional drilling rigs (Kapitsa, Reference Kapitsa1958; Bazanov, Reference Bazanov1961; Tongiorgi and others, Reference Tongiorgi1962; Lange, Reference Lange1973). Generally, the drilling performance was not stable, with several problems mainly related to the loss of circulation in the permeable snow/firn. Unless this zone is carefully walled off by casing, the airflow is insufficient to bring the cuttings up to the surface and they would thus remain in the borehole, possibly packing around the drill.
Similar complications were observed with the modern Rapid Air Movement (RAM) system that uses a flexible air hose to both suspend the drill and supply air at high pressure and high flow rates without casing (Bentley and others, Reference Bentley, Bar-Cohen and Zacny2009). It was found that firn permeability and conditions greatly restricted the depth to which it is possible to drill. In the 2010–2011 Antarctic field season, the drill could not reach depths below 63 m at the South Pole. To avoid airflow failure, Wang and others (Reference Wang2017) suggested using conventional reverse-circulation drilling technology with dual-wall drill rods in which compressed air flows downward through the annular space of the double-wall drill pipes and the inner tubes provide a continuous pathway for the chips and cores from the coring head to the surface. However, all these drill rigs are still bulky, consume a lot of power and need a powerful air compressor to create enough air pressure for ice cuttings removal.
One of the options to solve all the above-mentioned problems is to use an electromechanical ice-core drill with air reverse circulation where the cuttings are removed by near-bottom airflow into the chip chamber, along the same lines as the KEMS (Kudryashov and others, Reference Kudryashov, Vasiliev and Talalay1994) and IBED electromechanical drills (Talalay and others, Reference Talalay, Siegert, Jamieson and White2017), but with the difference that the liquid pump is replaced by a blower. Here we present the concept, theoretical grounds, computer simulation and test results of this drilling method. The key target of the research was to prove the feasibility of the near-bottom air reverse circulation for firn/ice drilling. We expect the new drilling system to recover ice cores faster than shallow auger drills, with high efficiency and low energy consumption.
Power consumption to drive air impellers can be estimated according to:
 $$N = pQ/\eta, $$
where p is the pressure produced by the impeller; Q is the air flow; η is the efficiency. According to our estimations, the power consumption to drive air impellers is not <58 W, which is slightly less than the power required to transport ice cuttings by auger electromechanical drills (60–290 W, Talalay, Reference Talalay2003).
Simplification of some components (cable termination, instrumentation section) and the use of lightweight materials can significantly reduce the weight (<50 kg) and size of this type of the drill, allowing it to be delivered to a remote drill site by small aircraft or using sledges and backpacks.
2. GENERAL DESIGN OF THE DRILL
The upper part of the drill has the same components as other electromechanical drills (Fig. 1): cable termination to connect the drill with an armored cable; slip-ring device to prevent cable damage when the anti-torque fails; anti-torque system to prevent spinning of the non-rotating section; and pressure instrumentation chamber. The main new technical features of the drill are located in the lower part. There is one motor driving the core barrel with coring head, which is equipped with cutters and core catchers and the blower impellers through the planetary gear transmission. The coring head cuts ice; and the blower produces a pressure difference that drives airflow and removes ice cuttings during the drilling. The air flows through the drill head, ice-core barrel, chip chamber, blower impellers and then into the space between the drill and the borehole wall. The air forms air reverse circulation at the hole bottom, and the underpressure inside the drill does not depend on the permeability of the drilled material.
Schematic diagram of the drill with near-bottom air reverse circulation.
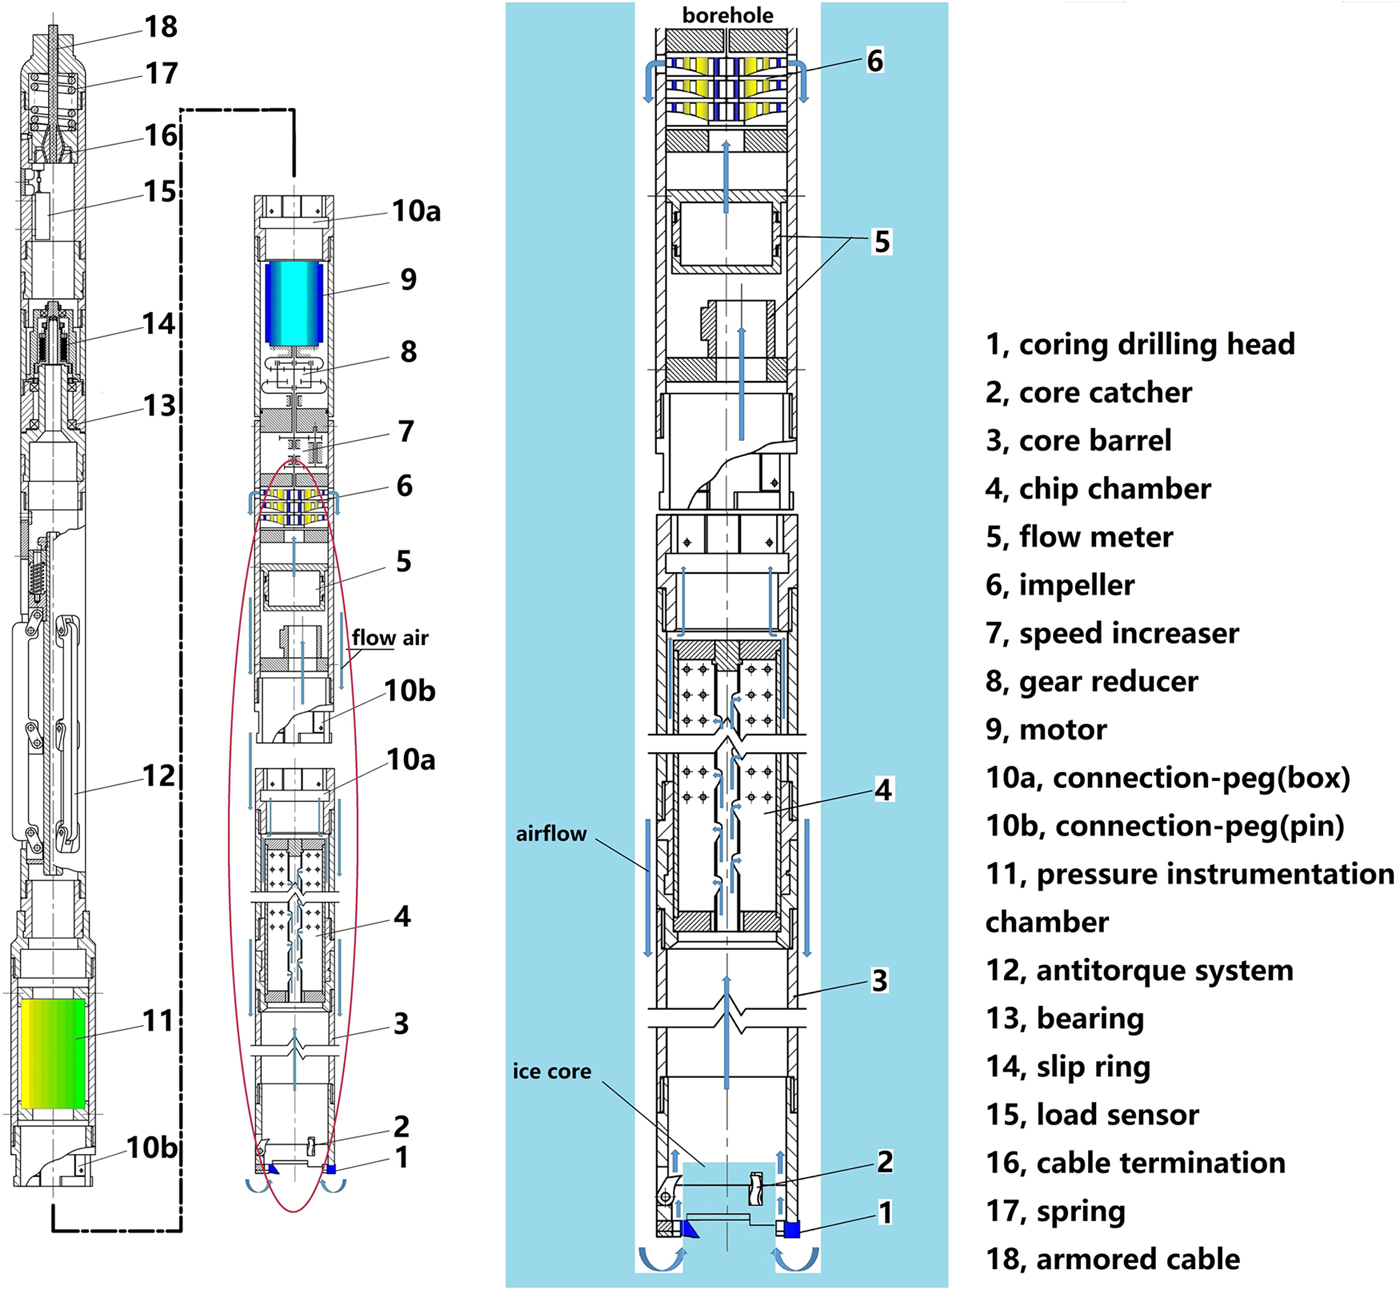
The design of the chip chamber is quite complex. There is an annular clearance between chip chamber and drill barrel. The air flows into the chip chamber through the inlet of the chip chamber's inner tube. The top of the chip chamber is sealed, so the air can only pass through the side filter screen. Ice cuttings are first moved by airflow to the top of the chip chamber, then fall to the bottom under gravitational force.
Key questions about the drill concept are whether circulation can be sustained at the hole bottom and whether the circulating air can remove ice chips. It was therefore decided to: research air reverse circulation in theoretical terms; set up an air reverse circulation test stand to acquire some of the data required from the experiment in order to prove that the air can form reverse circulation and readily suck ice cuttings into the chip chamber; use the fluid dynamics software ‘Fluent 15’, which is a general finite element analysis software developed by the ANSYS company, to verify the parameters obtained from the theoretical calculation; and carry out the overall simulated field trial after laboratory testing.
3. THEORETICAL BACKGROUND
Although air drilling has been used several times in glaciers and ice sheets, we are not aware of any previous theoretical work on estimating air circulation parameters. The following theoretical estimations aim to determine the minimum airflow speed required for lifting ice cuttings from the hole bottom to the chip chamber.
Timely removal of ice cuttings is the first requirement. Cuttings are subjected to gravitational force and air pressure when air flows through the cuttings surface. As the air friction and air drag increase, the cuttings start to slide, roll and become suspended. The airflow speed at that time is the critical shear speed for cuttings moving. Only when airflow speed exceeds this critical shear speed are the cuttings likely to move (Nickling, Reference Nickling1988).
The airflow in the drill barrel is turbulent motion, so the ice cuttings are affected by several forces: head resistance or drag force, lifting force, impact force among ice cuttings and gravity.
The head resistance or drag force consists of: friction caused by relative motion between airflow and ice cuttings; and pressure difference between the windward and leeward of ice cuttings because of the vortex generated in the leeside of cuttings (Li and Zheng, Reference Li and Zheng2003):
 $$F_{\rm D} = \displaystyle{\pi \over 8}\rho _{\rm g}u_{\rm r}^2 D^2C_{\rm D},$$
where F D is the head resistance or drag force, u r is the relative speed between the airflow and the ice cuttings, ρ g is the air density and D is the diameter of the cuttings. C D is the resistance coefficient, which is shape-dependent. For a flat cutting, C D = 1.4, for an angular or sub-circular cutting, C D = 0.85.
The lifting force is mainly caused by the shear of the rotation of cuttings and the airflow (Li and Zheng, Reference Li and Zheng2003):
 $$F_{\rm L} = \displaystyle{\pi \over 8}\rho _{\rm g}u_{\rm r}D^3\Omega, $$
where F L is the lifting force and Ω is the revolutions per second of the cuttings.
The impact force, the dominant force in the process of cuttings movement, is caused by collisions among cuttings according to the momentum conservation law:
 $$\mathop \int \limits_0^t F_{\rm m}{\rm d}t = mu_2-mu_1,$$
where F m is the impact force, u 1 and u 2 are the speed of ice cuttings before and after collision.
According to Li and Zheng (Reference Li and Zheng2003), Bagnold proposed that the critical speed of moving particles, whose size exceeds 0.08 mm (Fletcher, Reference Fletcher1976), may be given a semi-empirical formula, which has been derived through dimensional analysis and a series of experiments (Li and Zheng, Reference Li and Zheng2003):
 $$u_{\rm t} = a\sqrt {(\rho _{\rm s}/\rho _{\rm g}-1)gD}, $$
where a is an empirical coefficient, g is the gravitational acceleration, usually g = 9.8 m s−2, and ρ s is the cuttings density (kg m−3).
The airflow speed during drilling can be obtained by:
 $$u_{\rm g} = 5.45k_{\rm s}\lsqb {\lpar {\rho_{\rm s}/\rho_{\rm g}-1} \rpar gD} \rsqb ^{1/2}\lpar {1-\varphi_0} \rpar ^\beta, $$
where u g is the minimum air delivery speed required for conveying cuttings (m s−1), k s is the conversion coefficient, generally 1.3–1.7 (dimensionless), φ0 is the volume fraction of solid cuttings (dimensionless) and β is the test index, which is 2.3 when the Reynolds number is in the 103–2 × 10⁵ range.
At steady state, the continuous supply of external energy ensures that the cuttings move at constant speed, which is called the final speed. Assuming that the moving particles are round, the ice cuttings’ speed can eventually be calculated (Guo, Reference Guo2006):
 $$\nu _{\rm c} = (1 + D_{\rm s}/D_{\rm H})^{-1}{\rm \Psi} \sqrt {\displaystyle{4 \over 3}C_{\rm D}^{-1} gD_{\rm s}\lpar {\rho_{\rm s}/\rho_{\rm g}-1} \rpar }, $$
where ν c is the final speed of ice cuttings (m s−1),D s is the equivalent diameter of the ice cutting (m), Ψ is the sphericity coefficient (dimensionless) and D H is the hydraulic diameter of the air (m).
According to the conservation of matter, the volume flow of ice cuttings in the channel is equal to the volume flow of ice chips produced by drilling. So, the chips’ displacement speed can be calculated:
 $$\nu _{{\rm tr}} = \pi R_{\rm P}D_{\rm b}^2 /14400AC_{\rm P},$$
where ν tr is the air displacement speed (m s−1), D b is the hole diameter (m), C P is the volume fraction of the ice cuttings in the stream (dimensionless), A is the cross-sectional area of the fluid (m2) and R P is the penetration depth per second (m s−1).
The airflow speed required to carry the ice cuttings can be obtained by the following formula:
 $$\nu _{\rm g} = \nu _{\rm c} + \nu _{{\rm tr}},$$
where ν g is the airflow speed (m s−1).
If it is supposed that the length of the ice chip chamber is 2 m, the central channel diameter of the air fluid is 40 mm, the inner and outer diameters are 115 and 125 mm, and the ice-core diameter is 100 mm, it can be calculated that u g = 7.71 m s−1 and ν g = 8.24 m s−1 according to (4)–(8). These numbers are quite close to the estimates of US drillers who indicated that an up-hole speed of ~7.62 m s−1 would be necessary to properly clean the hole of ice chips of ~2.54 mm diameter (Lange, Reference Lange1973).
4. COMPUTER SIMULATION
In real ice-drilling conditions, the circulating air and cuttings constitute an air–solid two-phase flow model, considered as a continuous airflow, and the ice cuttings flow with the airflow. The ice cuttings cannot pass through the filter screen of the chip chamber with airflow (the mesh of the filter is 0.2 mm). To solve this problem numerically, a porous media model, which is a way of combining grid-structured processing and unstructured processing, was created.
There is only approximate symmetry, so the model can be simplified, which can also reduce the computational load of the computer, as follows.
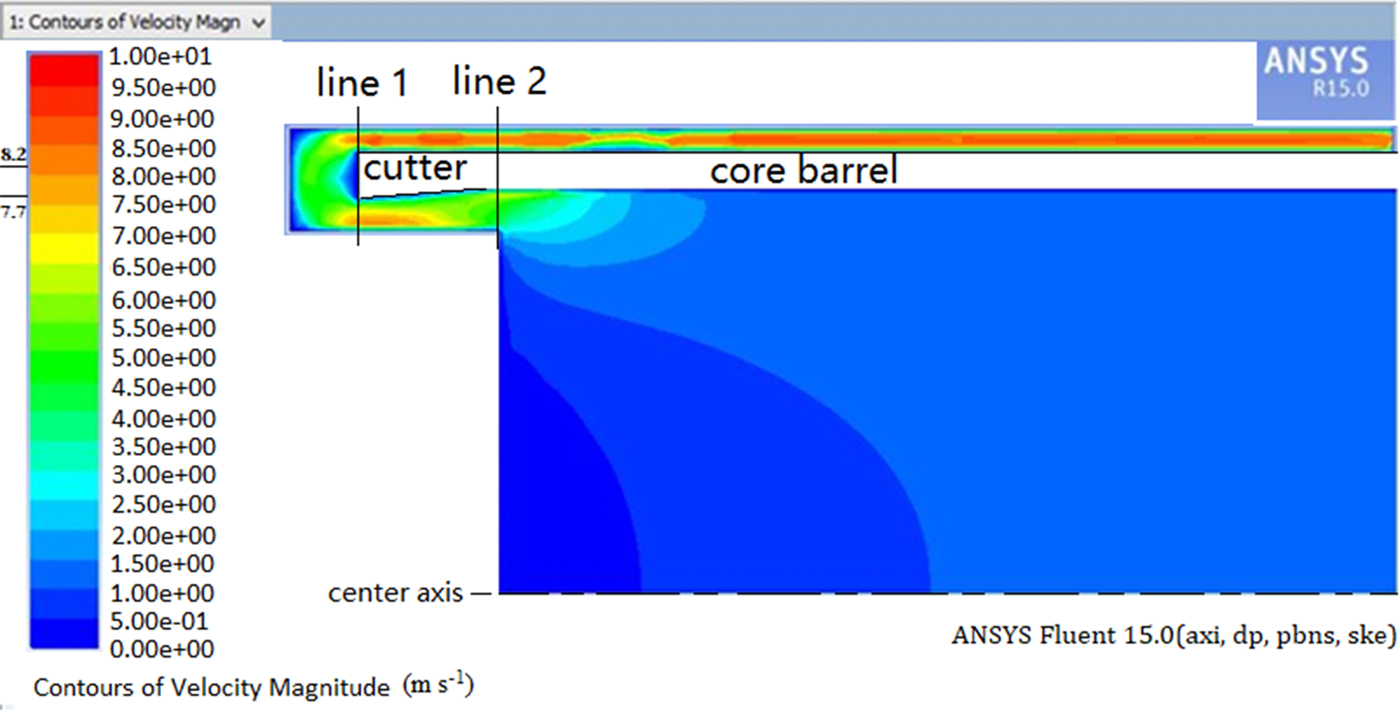
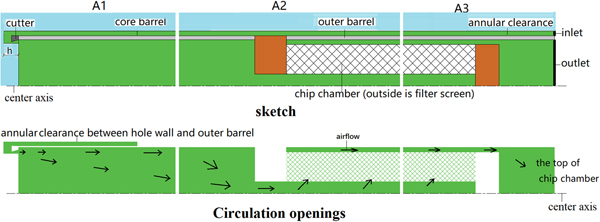
It is difficult to directly observe the pressure field and the speed field of the air in the full size picture, because the length/width ratio of the lower part of the drill is ~45:1. According to theoretical calculation and analysis, the airflow speed at the hole bottom is the key, and the pressure and speed fields in the straight tube are constant, so we just need to observe the pressure and speed fields near the head (A1 in Fig. 2), the junction of the core barrel and chip chamber (A2 in Fig. 2) and the top of the chip chamber (A3 in Fig. 2).
The airflow field and the key observation sites. The model was divided into three parts to analyze the potential pressure weakest areas, lower part near the drilling head (A1), the junction part of the core barrel and chip chamber (A2) and the top part of chip chamber (A3). In the picture, these parts are partitioned by vertical white break lines. The blue color indicates surrounding ice, the green color indicates air flow, the gray color indicates drill tube and the orange color indicates one part of chip chamber, which air cannot pass through. The upper drawing is a sketch of the core barrel and chip chamber shown as net, and the lower drawing shows circulation openings. While drilling, the air flows through windows in the coring head. However, in the two-dimensional model with rotational symmetry, this situation cannot be described exactly. In the model, h instead represents a distance equivalent to the area of the coring head windows.

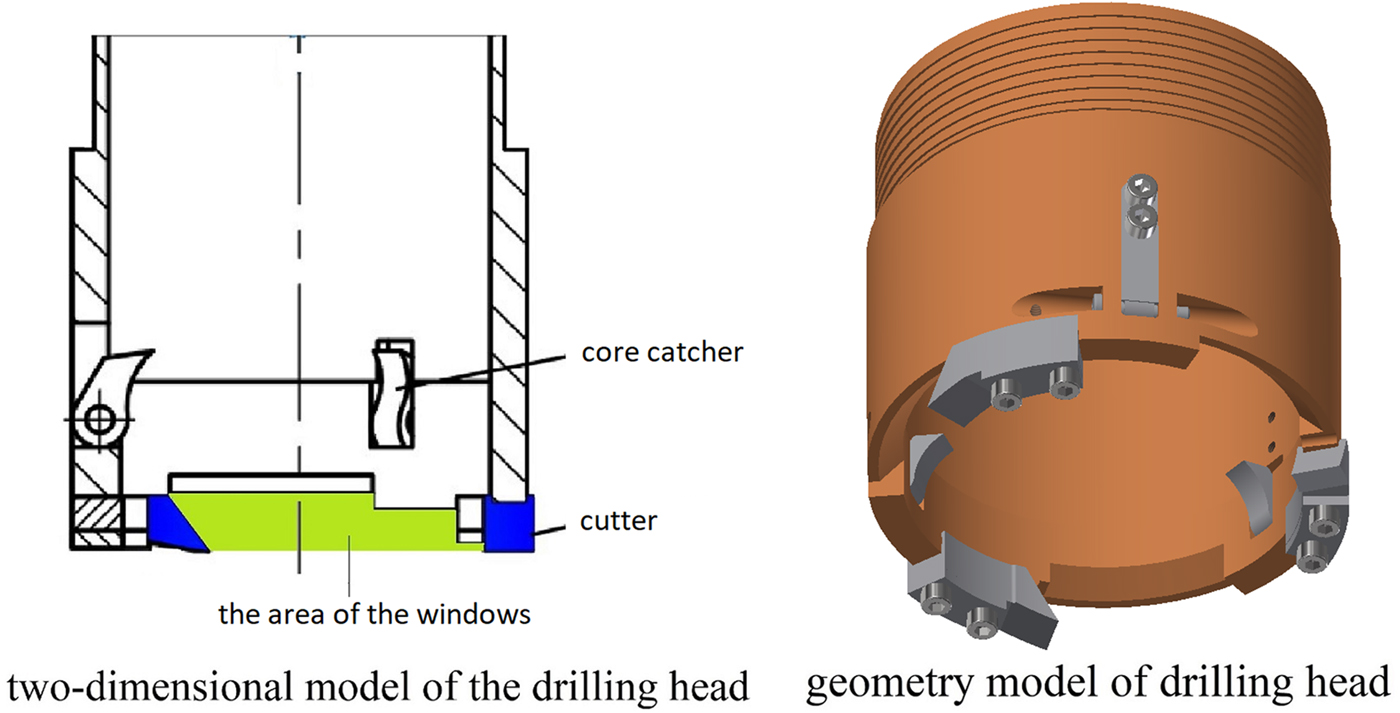
The area of the windows on the drilling head (Fig. 3) controls the air velocity to lift the cuttings and should neither be too large, resulting in a lower air velocity, or too small which may cause a blockage of cuttings. The value h between the hole bottom and the cutters (Fig. 2) in the model calculations is a ‘trick’ to simulate the effect of the windows, which cannot be precisely described in a model with axial symmetry. In practice there is no clearance between the hole bottom and the cutters when drilling. The distance h between the top surface of the drilling cutter and the hole bottom directly determines the suction capability of the blower. If h increases, the airflow speed near the bottom will decrease. Then, ice cuttings would be more difficult to remove from hole bottom. On the contrary, if the distance h decreases to a reasonable interval, ice cuttings will be picked up easily.
The drilling head. The green color on the two-dimensional model indicates the area of the windows, we can know that there are three windows from the geometry model.
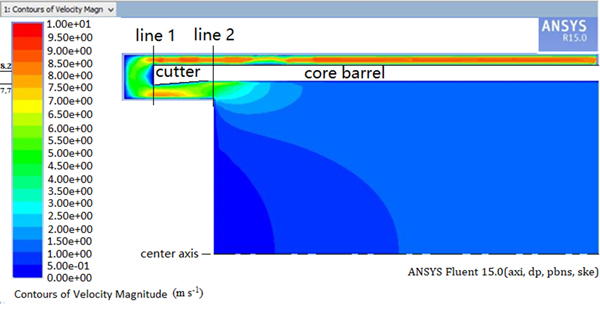
In the simulation, h is assumed as 60 mm, the maximum value to pick all chips into chip chamber (Hu and others, Reference Hu2012) and the vacuum degree is 20 kPa at first, around the maximum value of used vacuum pump. The minimum airflow speed near the cutter can reach 25 m s−1, which is sufficient to complete the task of sucking the ice cuttings during drilling. However, if the pressure difference is too large, there will be other drawbacks, e.g. core suffering from erosion due to air flow. Our premise is that the drilling work is smooth, as far as possible to reduce energy consumption and prolong the service life of the blower. So, in the next step, we set several pressure differences (10, 9, …, 2, 1 kPa) and analyze the air velocity magnitude field near the coring head. With the pressure difference set to 3 kPa, the air velocity magnitude field near the cutters was solved by computational fluid dynamics (CFD) and the results are shown in Figure 4.
The air velocity magnitude field when the relative limit vacuum is 3 kPa.
Air speed as a function of distance from the center axis on the bottom plane of the coring head (line 1, Fig. 4) and the wall of the ice core (line 2, Fig. 4) was obtained. Furthermore, the speed as a function of distance from the center axis in the plane of the outlet and inlet is very important. The air speed as a function of distance from the center axis on these four planes is shown in Figure 5.
The speed as a function of distance from the center axis.
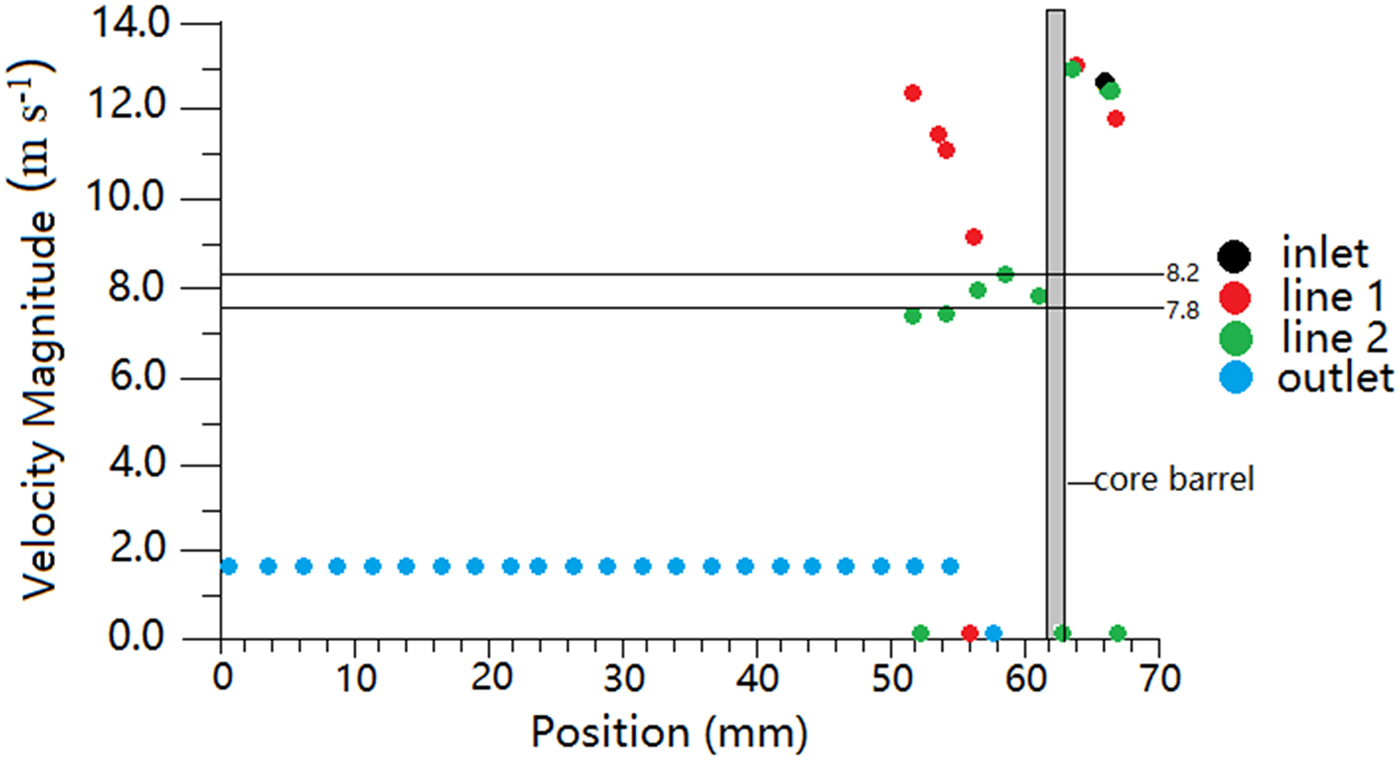
When the pressure difference is 3 kPa, the air speed along line 2 is just below 8.2 m s−1. It means that the ice cuttings are produced slightly faster than the ability of the air circulation. According to the simulation analysis of ‘Fluent’ software, we can conclude that the final vacuum degree has a direct effect on the air flow rate and should be more than 3 kPa.
5. TESTS
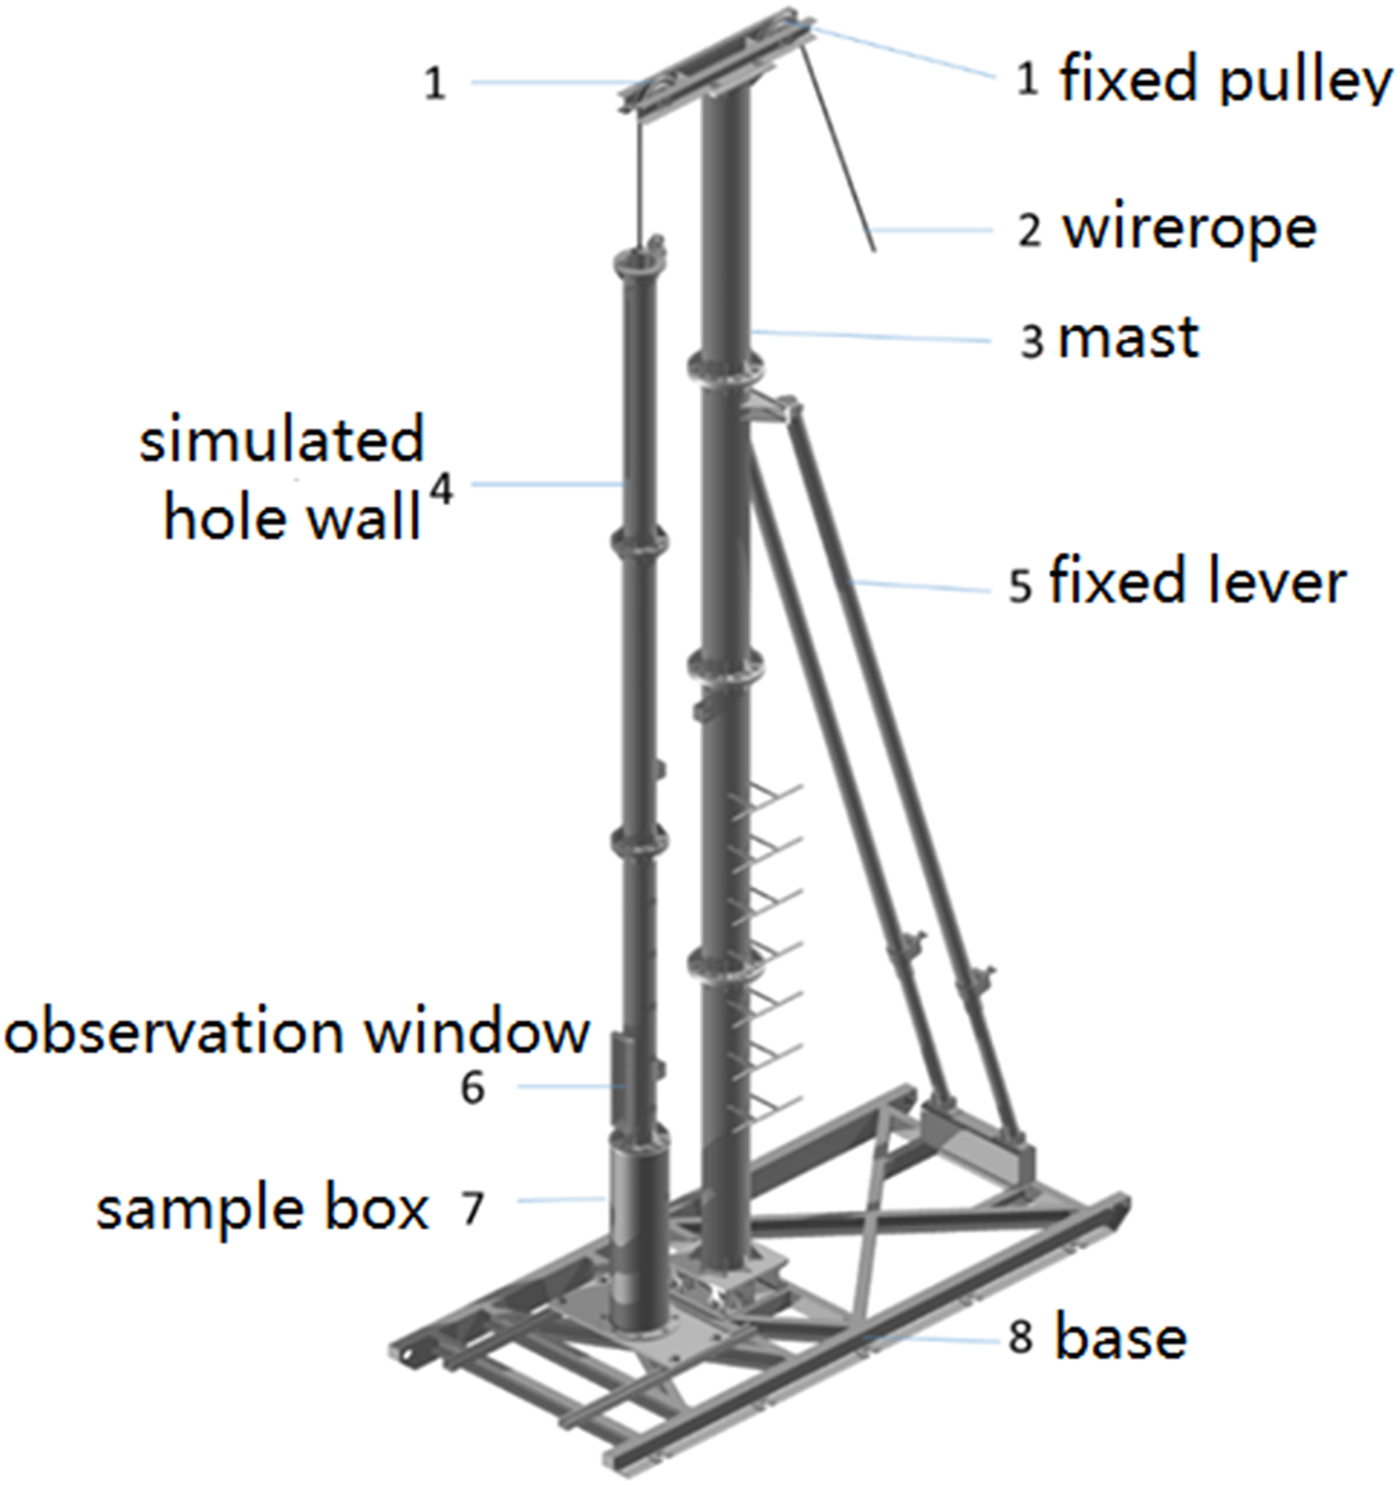
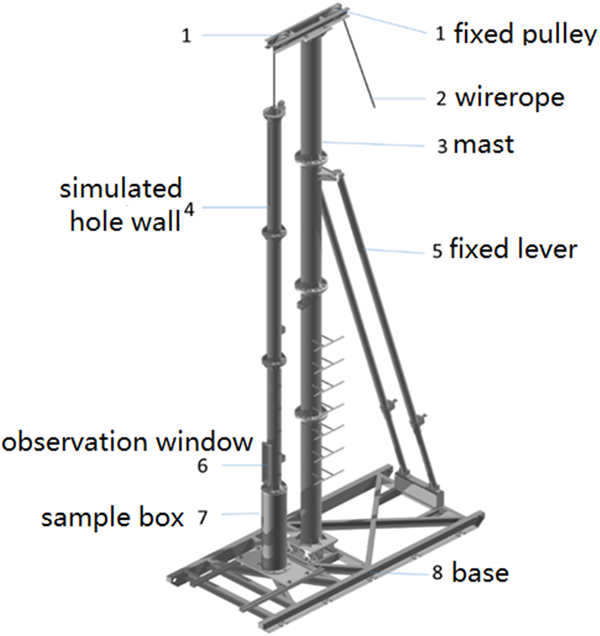
In order to verify that the electromechanical ice-core drill with near-bottom air reverse circulation can work well and drill ice core smoothly, a test stand (Fig. 6) was constructed in Changchun City, Jilin Province, China, where the air temperature can reach −30 to −20°C in winter. Such air temperatures can last for 2 months and create good conditions for simulating polar climate and ice drilling.
Diagram of the testing platform.
In this experiment, artificial ice and lake ice were tested successively, and the artificial ice was frozen layer by layer. This experiment involves two main tests: an impeller test and a drilling test. In the impeller test, we changed different impellers in the drill, and then increased the rotation speed of the output shaft. If the impellers were not strong enough and produced insufficient underpressure, we changed them. The better impellers were selected for use in the next test, which provides some test results.
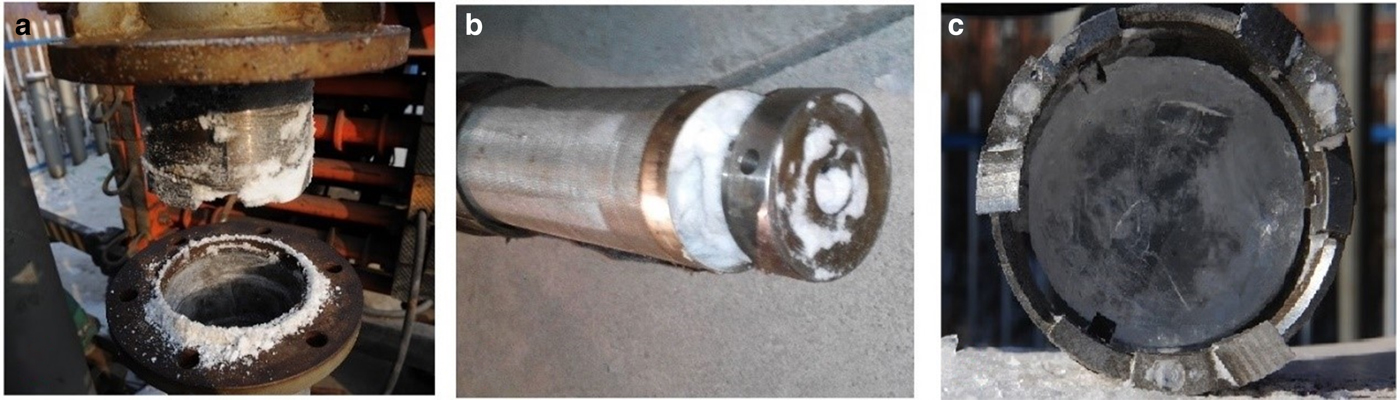
First, the relationship between the rotation speed of the impellers and the final vacuum was measured. We know of no suitable vacuum pump to install in the drill, so blower impellers were chosen to produce the underpressure. The drill-driven motor was connected with impellers through increasing planetary gears. The test results show that the centrifugal impeller (Fig. 7a) works better than the axial flow impeller (Fig. 7b).
(a, c) Centrifugal impeller; (b) axial flow impeller; (d) damaged impeller. As the rotation speed increased, the higher impeller blade twisted and damaged, like shown in (d).
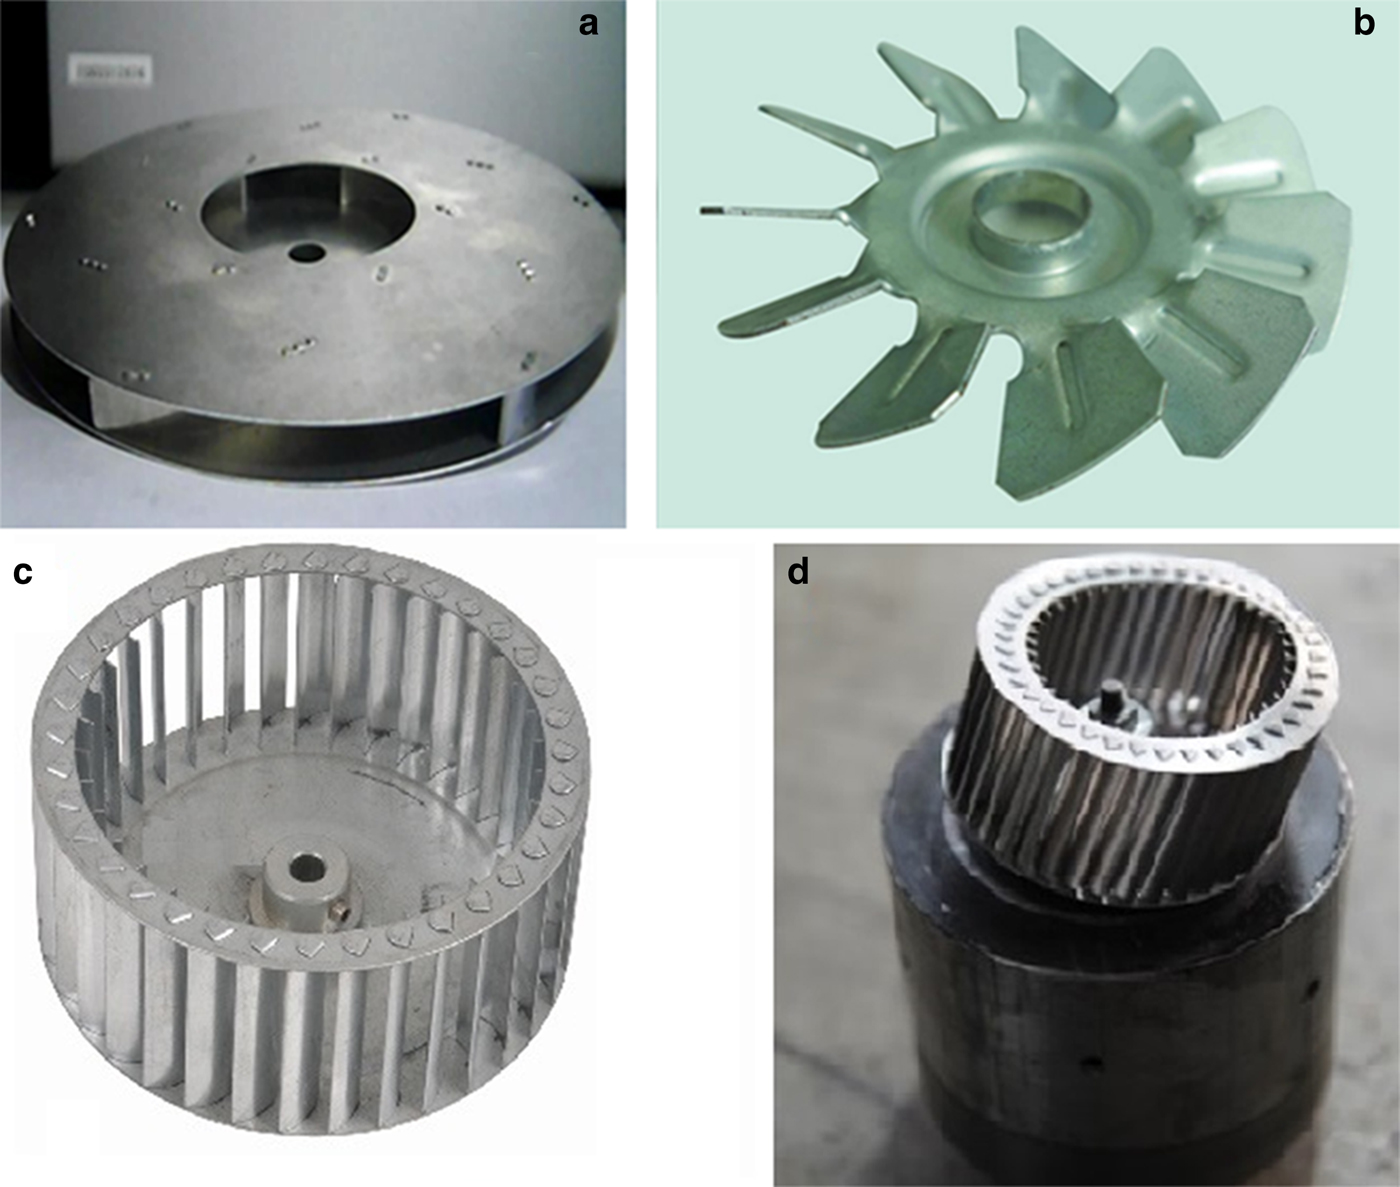
Almost every relevant type of centrifugal impeller on the market was purchased and tested (Figs 7a, c); the parameters of these impellers are shown in Table 1.
Impeller parameters
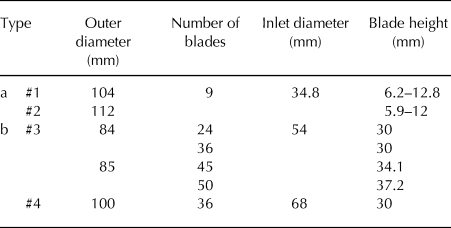
The findings from the test were that the final vacuum degree is influenced by the rotation speed, blade height impellers and impeller diameter. Final vacuum increases with increasing rotation speed of the impellers when the impeller blade heights are constant. In the same way, as long as the sealing is good, higher impellers blade and larger impeller diameter yields greater vacuum degree. The underpressure generated by #2 and #4 impellers can remove ice cuttings before they are twisted and damaged. The underpressure generated by #1 impeller is insufficient with this gear increaser, and the #3 impeller is twisted and damaged before it can produce sufficient vacuum degree (Fig. 6d).
With the #2 and #4 impellers, the relationship between vacuum degree and rotation speed of the impellers is shown in Figure 8.
Relationship between vacuum degree and rotation speed of impeller.
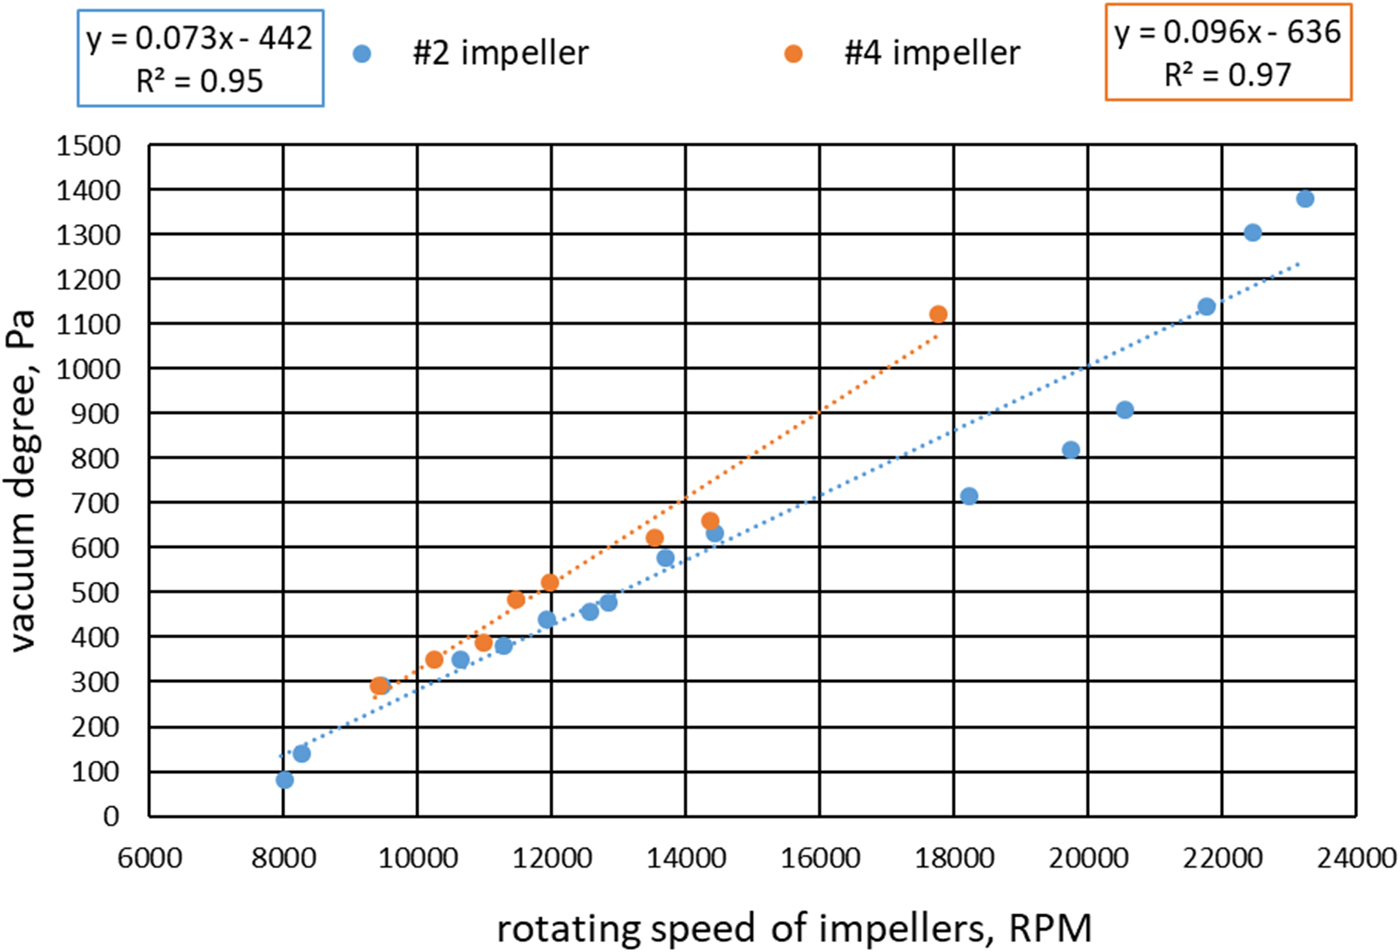
The vacuum degree produced by impeller #4 exceeds that of impeller #2 at the same rotation speed, because the impeller blade height of impeller #4 is higher than that of impeller #2. However, impeller #2 delivers a stronger vacuum if the rotation speed reaches up to more than 20 000 rpm, in which impeller #4 will be damaged because of high rotation speed. In the following experiments, impellers #2 were chosen as the research object to obtain higher vacuum degree.
The fitted formula (Fig. 8) between vacuum degree without pressure loss y vd (Pa) and rotation speed x rs (rpm) of the impeller can be obtained:
 $$y_{{\rm vd}} = 0.07x_{{\rm rs}}-442.$$
We then determined the relationship between the rotation speed of impellers and the penetration rate. Determining the minimum rotation speed of the impeller when the cuttings can be pumped completely under a different penetration rate provides a realistic basis for optimizing the drill design. Although we experienced setbacks and failures, e.g. ice cuttings sticking near the coring head (Fig. 9a) or insufficient impeller speed or sealing, we succeeded in many experiments (Figs 9b, c).
(a) Ice cuttings pile up near the cutters; (b) chip chamber filled with ice cuttings; (c)ice core in core barrel.
The data obtained by the measurement and control system showed the relationship between the impeller rotation speed and penetration rate (Fig. 10).
Relationship between impeller rotation speed and penetration rate.
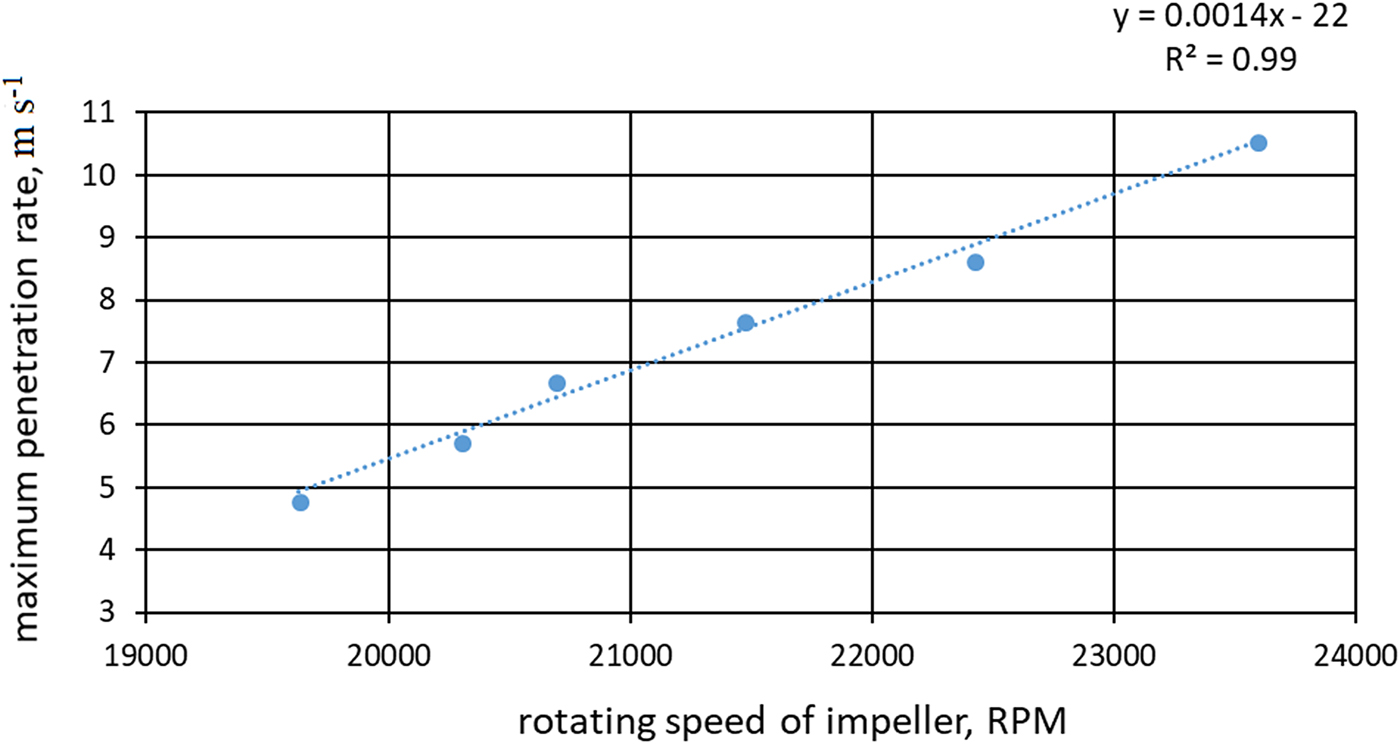
The impeller rotation speed determines the maximum final vacuum, and using the regression results of vacuum vs rotation speed and penetration rate vs rotation speed, we obtain the equation of the penetration rate z pr (m s−1) and final vacuum degree y vd (Pa):
 $$z_{{\rm pr}} = 0.02y_{{\rm vd}}-13.96.$$
There is a linear relationship between the airflow and the final vacuum. Therefore, the relationship between the airflow Q gf (m3 s−1) and final vacuum degree (Liang and Xi, Reference Liang and Xi2009) is given by
 $$Q_{{\rm gf}}^2 = 0.005y_{{\rm vd}}-0.7.$$
Finally, from (10)–(12) we derive the relationship between penetration rate and airflow:
 $$z_{{\rm pr}} = 4.2Q_{{\rm gf}}^2 -13.68.$$
6. CONCLUSIONS
Our study demonstrates that near-bottom air reverse circulation should theoretically be a sound option for polar ice-core drilling. Air drilling systems can be relatively light and environmentally friendly. The maximal possible length of the coring run depends mainly on the design of the circulation system and capacity of the air blower. Theoretically estimated up-hole speed of the airflow should be not <7.7 m s−1, which enables the proper removal of ice cuttings from the borehole bottom. The computer simulation and test results showed that the design of the ice-coring drill with air reverse circulation at the hole bottom is feasible. The maximum allowed penetration rate depends by square law on airflow. To drill faster and more safely, the number of impellers must be increased and their strength must be enhanced. Field tests will then be conducted in Antarctica as soon as financial and logistical support is obtained for the project.
ACKNOWLEDGEMENTS
We are grateful to our research team members for their help with the drill testing. This work was supported by grant No. 41327804 from the National Natural Science Foundation of China and the Program for Jilin University Science and Technology Innovative Research Team (Project No. 2017TD-24) and the Fundamental Research Funds for the Central Universities. We thank Sune O. Rasmussen, Scientific Editor of Journal of Glaciology, Alex R. Pyne (Antarctic Research Centre, Victoria University of Wellington) and anonymous reviewers for fruitful discussion, useful comments and editing.


 Open access