


Introduction
Hepatitis A is caused by hepatitis A virus (HAV) and occurs worldwide. HAV is a ribonucleic acid virus that replicates in the liver and is shed into the stool. Outbreaks of hepatitis A have been mostly linked to the consumption of uncooked contaminated foods and contaminated waters. However, close person-to-person contacts in families, institutions, child care setting and schools are also an important mode of HAV transmission [Reference Wu1, Reference Regan2]. One special group of people is men who have sex with men (MSM), and numerous outbreaks of hepatitis A have been reported in MSMs. Recent outbreaks of hepatitis A among MSMs in England, France, Germany, Israel and the Netherlands [3] challenge our countermeasures in controlling the transmission of HAV. Hepatitis A is a vaccine preventable disease and the natural countermeasure is hence vaccinating the groups of people in danger. Herd immunity can help control the transmission by imposing the resistance to the spread of a contagious disease within a population that results if a sufficiently high proportion of individuals are immune to the disease, which can be achieved especially through vaccination. The minimum proportion immune of individuals (i.e. the critical immunity threshold) is determined by transmissibility of the contagious agent [Reference Vynnycky and White4]. The transmissibility is usually characterized by the basic reproductive number R 0, the mean number of secondary infectious cases generated by a single primary infectious case introduced into a totally susceptible population [Reference Anderson and May5]. To protect the MSM people against HAV by vaccination, we need to evaluate this crucial parameter. Obviously, its precise and reliable estimate is vital for the reasonable design of effective countermeasures such as vaccination.
Regan et al., [Reference Regan2] proposed a compartmental model to estimate R 0 of HAV infection in a MSM population. They applied the model to the 1991/1992 Sydney outbreak of hepatitis A in which large proportions of the infected individuals were MSMs. By applying the least squares algorithm to fit their model outputs to the outbreak data, they obtained an estimate of R 0 ranging from 1.71 to 3.67 and the critical immunity threshold ranging from 42% to 73% in Sydney MSM population. Therefore, as they claimed in their paper, ‘sustained epidemics cannot occur once the proportion immune to HAV is greater than ~70%’. In other words, epidemics could possibly occur if the proportion immune to HAV cannot reach this level.
The examination [Reference Ali6] of the HAV status of all MSMs seen at a large sexual health clinic in inner Sydney between 1996 and 2012 showed that the proportion immune to HAV increased from about 32% in 1996 to 64% in 2012. The similar levels of proportion immune were also reported in the MSM population in Victoria, Australia [Reference Weerakoon7]. In accordance with their results of the event-driven stochastic model for outbreak analysis (Fig. 3a and 3b of [Reference Regan2]), if the proportion immune ranges from 32% to 64%, there is a definite chance for outbreaks of hepatitis A in MSMs to occur with outbreak sizes ranging from a hundred to a thousand. This theoretical indication appeared not to be in agreement with the actual observation: ‘No outbreaks of hepatitis A in Australian MSMs have been reported since 1996’ [Reference Regan2].
We further noted that among ten parameters of Regan et al.’s [Reference Regan2] model, (posterior) distributions of eight parameters diverge to their lower and upper bounds set up by fitting constraints (see their Fig. A2 and Table 2). Another important parameter (‘force of infection per sexual contact per day’), though not diverging to lower and upper bounds, appears to have a bimodal distribution. The distribution of the size of the MSM population converged to the lower bound which is clearly below the range of 5000–10 000 of the MSM population size that was estimated from the survey of [Reference Madeddu8]. In view of such ill-distributed model parameters, the accuracy and reliability of their estimate of R 0 are doubtful.
We think the abnormal behaviours of the distributions of model parameters obtained in [Reference Regan2] stem from two aspects. The first is that the least squares algorithm is inappropriate for calibration of the transmission model to obtain the reliable estimates of model parameters (see Appendix A); the second is that the only data used in [Reference Regan2] (i.e. the time series of case onset dates) lack enough information to distinguish ten model parameters because the inherent correlations between them such as transmissibility and susceptibility.
In view of these questions, in this study we revisited the model of [Reference Regan2] by proposing the Bayesian inference for model calibration in replace for the least squares algorithm and reducing the number of independent model parameters by considering the early transmission dynamics of the outbreak. These changes will hopefully improve the behaviour of distributions of model parameters and compromise the discrepancy between the field observations and theoretical prediction from the analysis of [Reference Regan2].
Models and methods
We adopted the deterministic model of [Reference Regan2] for the transmission dynamics of the 1991–1992 hepatitis A outbreak in Sydney, Australia. Susceptible MSMs (S) contact with infections and then become infected but not yet infectious (E). The exposed people progress to become occult infectious (I O) at rate σ. A proportion of infections (p S) becomes symptomatic (I S) and the rest still remains asymptomatic but infectious (I A) at rate γ 1. All infections recover and become immune to HAV (R) at rate γ 2. The model equations are given in Appendix B.
We propose the Bayesian inference for the model calibration and use Markov Chain Monte-Carlo (MCMC) [Reference Metropolis9, Reference Hastings10] to sample posterior distributions of model parameters and hence to obtain their median and 95% credible interval (CI). We think Bayesian inference has privilege over least squares algorithm in calibrating the transmission model and obtaining the estimates of model parameters. In order to consider the variation in the number of monthly cases, Regan et al., [Reference Regan2] added Poisson noise to the observed epidemic data. Within the Bayesian framework through MCMC, the variation in the data has been naturally included in the likelihood function (e.g., negative binomial distribution we use in this study). Moreover, Bayesian inference is more flexible and realizes more information by sampling the posterior distributions of model parameters (the detail of the Bayesian inference method is given in Appendix B).
We can also reduce the number of independent model parameters by considering the early stage of transmission dynamics. Following [Reference Birrell11], we assume that at the early stage of the outbreak, the number of newly infected cases increases exponentially with growth rate Ψ r. Then the initial conditions can be parameterized as follows:


and S(0) = Nρ − E(0) − I O(0) − I S(0) − I A(0)
Here α 0 = exp (Ψrδt) − 1 and δt is a small time step used in the simulations. We assume the transmission dynamics started from December 1990 and I O(0) represents the number of occult infections on December 1990. N is the effective size of MSM population and ρ is the initial proportion of MSMs that are susceptible to HAV. α is the rate of entry/exit from MSM population, which is fixed at 1/(30 × 365) as in [Reference Regan2] who assumed a sexually active period from age 20 to 50 years old.
Following [Reference Wearing, Rohani and Keeling12], we can establish the relationship between the transmission rate β (i.e. what Regan et al., [Reference Regan2] called ‘force of infection’) and the initial growth rateΨ r,

The derivations of these expressions are given in Appendix B. After these treatments, the model is now described by eight-independent parameters (see Table 1).
Prior and posterior distributions of model parameters under different model variants. Here U stands for the uniform distribution

Even with the above parametrization of the model, there are still a lot of model parameters to be estimated. Because of the inherent associations between model parameters such as the proportion of non-immune people and transmissibility, the calibrating transmission model to symptom onset dates cannot identify all the eight model parameters. In general, the lack of identifiability was met when the calibrating transmission model with one dataset in other infectious diseases (e.g. [Reference Corbella13]). To avoid this identifiability problem, we first consider a situation by fixing some model parameters based on the literature.
The survey results of [Reference Ali6] suggested that about 30% of the MSM population in inner Sydney between 1996 and 2012 would have been immune. This was further supported by another survey: Heywood et al., [Reference Heywood14] show the seropositivity is 34% in the Australia population in 1988. In view of these, we can fix the initial proportion of the susceptible individuals before the 1991/1992 outbreak at ρ = 70%. The risk that a hepatitis A infection will cause symptomatic case is known to increase with age at infection. In accordance with the modelling of [Reference Armstrong and Bell15], the proportion of symptomatic for individuals of age >20 years can be approximated at 85%. Hence we can use this estimate to fix the proportion of symptomatic cases at p S = 85%. To further reduce the number of model parameters to be estimated, we also fix the life history parameter at their middle values of the ranges used in [Reference Regan2]: latent period (P L) = 1/σ = 14 days, period of occult infection (P OI) = 1/γ 1 = 14 days and period of symptomatic infection (P SI) = 1/γ 2 = 7 days (also see [Reference Zhang and Iacono16]). We now have three parameters to be estimated: size of the MSM population (N), the number of initial occult infection (I 0) on Dec 1990 and the initial growth rateΨ r. Uniform distributions within some ranges will be used for priors of model parameters (Table 1). In view of the downsized distribution of the population size of [Reference Regan2], we assume a uniform prior from 500 to 10 000 for N. The prior for growth rate Ψ r is chosen so that a large range of R 0 for HAV will be covered. The priors for other parameters follow that of [Reference Regan2]. The arrangement of the model parameters will be hereafter referred to as model variant 0.
Sensitivity analysis
To assess how the estimate of R 0 depends on the different choices of life history parameters, the proportion of the susceptible and the proportion of symptomatic cases, we relax the above assumptions of the model parameters and consider the following model variants:
Variant I: Allowing the proportion of symptomatic cases (p S) to vary within the range (0.5,1.0) as suggested in [Reference Regan2]. We now have four parameters to be estimated: N, I 0, Ψ r and p S.
Variant II: Allowing both p S and ρ to vary within the range (0.5,1.0) and fixing life history parameters (P L, P OI and P SI) at 14:14:7.
Variant III: The model variant allows eight parameters (N, P L, P OI, P SI,ρ, p S, I O(0) and Ψ r) to be estimated. We regard the estimates of model variant III as our estimates and use further for our outbreak analysis.
Outbreak analysis
To capture the stochastic features of outbreak of hepatitis A within a MSM population, we approximate the deterministic equations by the Monte Carlo algorithm [Reference Gillespie17], which tracks the succession of discrete events that change the number of individuals in each of the six infection compartments. The whole stochastic system is described by 13 transmission and transition events. Each event occurs at a rate equal to that in the deterministic model (see Table A1). The size of each compartment is the number of individuals occupying the compartment. From initial sizes of compartments, the programme first determines the time of the next event, which follows an exponential distribution with mean 1/Ω; here Ω denotes the sum of all individual event rates. The nature of the next event is chosen at random, with each of the 13 events having a probability equal to its own rate divided by Ω. After each occurrence, the sizes of the compartments are updated according to the picked events (Table A1). The input parameters for these simulations were the 5000 samples of model parameters (N, P L, P OI, P SI, p S, I O(0) and Ψ r) obtained from the above model calibration. For each set of model parameters, 20 stochastic realisations are generated to evaluate probabilities and size of outbreaks. To investigate how the proportion immune (ρ) impacts the outcome of simulating transmission dynamics, we replace the proportion immune in the input parameters by 0%, 5%, 10%,…,100%. We define sustained epidemics as simulations in which the epidemic ceases via depletion of susceptible individuals rather than by chance elimination. Technically, we regard an outbreak takes place when the total number of symptomatic cases exceed 5% of susceptible individuals.
Results
Estimation of R 0
The estimates of model parameters under four model variants are shown in Table 1. The initial number of occult infections (I O(0)) and the initial growth rate (Ψ r) are nearly insensitive to the model variants, and have medians of 2.1–2.7 and 0.29–0.31, respectively. Under the model variant 0, the three model parameters converge well (see Fig. A1) and the basic reproduction number (R 0) is estimated to have median 2.00 and 95% CI from 1.84 to 2.12. Under model variant I where the proportion of symptomatic cases (p S) was also to be estimated, albeit the three parameters (i.e. N, I 0 and Ψ r) converging well as in model variant 0, the posterior distribution of parameter p S is nearly equivalent to its prior (Fig. A3). To test how the results depend on the choices of the values of life history parameters (P L, P OI and P SI) and the proportion of susceptible (ρ), 10 combinations of three life history parameters were sampled by Latin hypercube sampling (see Table 2a). The estimate of R 0 is nearly insensitive to the variation in life history parameters given the proportion of the susceptible (ρ) being fixed. Further supplement was provided by choosing ρ at 50%, 60%, 70%, 80% and 90%. The estimate of R 0 is fairly sensitive to the value of ρ (see Table 2b). Therefore it is no wonder in Model variant II where parameter ρ was also to be estimated that the effective reproduction number R e converge well even both R 0 and ρ don't (Fig. A4).
Sensitivity analyses with (a) different combinations of three life history parameters by Latin hypercube sampling and (b) different proportion of the susceptible under model variant I

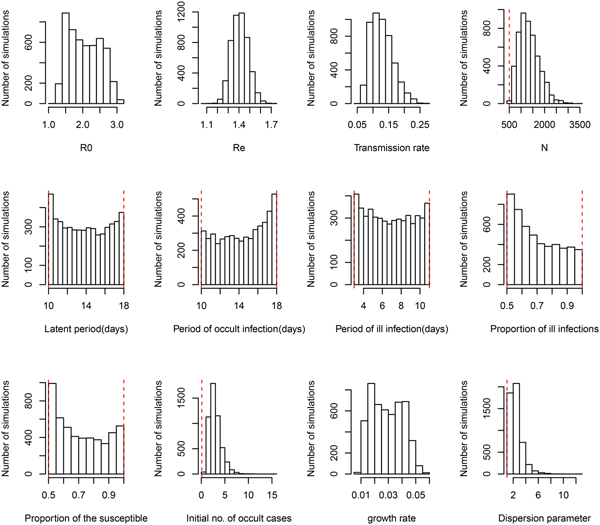
Under the general model choice (Model variant III) the median of R 0 is 2.02 and its 95% CI ranges from 1.38 to 2.89. This very well agrees with the other three simplified model variants. However, Figure 1 shows that within model variant III, the posterior distributions of three life history parameters (P L, P OI, P SI), and both the proportion of symptomatic cases (p S) and the proportion of the susceptible (ρ) are nearly equal to their priors. This result has been demonstrated by the sensitivity analysis shown in Table 2. Table 1 further shows that the distribution of R e remains nearly the same over the four model variants. Notice that R e is the product of R 0 and the proportion of the susceptible (ρ), insensitiveness of R e to ρ indicates the highly negative correlation between R 0 and ρ. This observation reflects the fact that data of symptom onset dates do not contain sufficient information to distinguish these characteristics. Nevertheless, these posteriors appear to be much better than that obtained by least squares (see Fig. A2 of [Reference Regan2]). Although the posterior distribution of the growth rate does not converge to a bell-shaped curve, it does converge to a restrictive range, and its associated parameter transmission rate (β) does converge well. The distribution of R 0 was also restricted in a range, however, the distribution of effective reproductive number R e converges very well, with a median of 1.44 and 95% CI from 1.27 to 1.57.
Posterior distributions of model parameters under model variant III. The red vertical lines represent the lower and upper bounds of uniform priors.

The effective size of MSM population in Sydney is estimated to be 1274 with 95% CI from 676 to 2277. This is comparable with that obtained in [Reference Regan2]. The dispersion parameter in the negative binomial likelihood that captures the variation in observed epidemic data (Fig. 2) consistently has a median of 2.2, which show that the monthly counts of symptom onset dates during the outbreak are over-dispersed when compared to a Poisson noise assumed in [Reference Regan2].
The model was also fitted to the total outbreak (n = 570) which included a further 240 cases that were recorded as heterosexual men/women and children or unknown. The nearly same estimate of R 0 was obtained (see Table A2). The population size is estimated to be nearly double that for the analysis based on the outbreak of 330 cases.
Model fitting to observed symptom onset dates of 330 MSM patients under model variant III. Triangles represent observed data, dark dashed line represents the median of model predictions and thin dashed lines represent the 95% CIs.

Outbreak probability
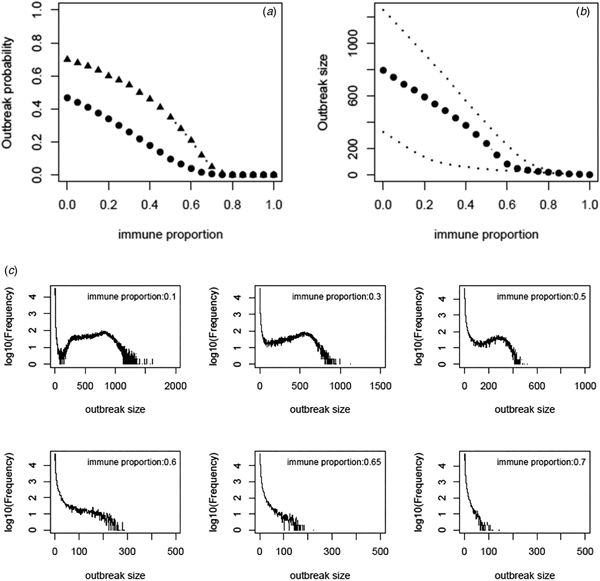
Based on the estimate of transmissibility within model variant III, the critical level of immune proportion to HAV in the MSM population in Sydney is 65%. The outbreak probability we obtain here is greatly decreased compared to that of Regan et al.'s analysis (see Fig. 3a). The outbreak analysis shows that an outbreak probability per initial MSM case is about 1.8% (vs. 12% of [Reference Regan2]) when the population immunity was 65%; it is only 6.6% (vs. 28% of [Reference Regan2]) when the population immunity was 55%. The corresponding sizes of the outbreaks are also reduced substantially (see Fig. 3b). Using the estimates of model parameters based on the total outbreak (n = 570), the outbreak analysis suggested the similar outbreak probabilities to that based on the outbreak of 330 cases (Fig. A7).
(a) Outbreak probability as a function of the immune proportion, (b) the median size and 95% CI of such outbreaks and (c) examples of distribution of the outbreak size as a function of immune proportion. In panel (a) triangles represent the outbreak probability predicted by Regan et al., [Reference Regan2].

Discussion
We revisited a HAV transmission model of [Reference Regan2] by using Bayesian inference and considering the early stage dynamics of the outbreak to reduce the number of independent model parameters. We, therefore, improve the model analysis and prediction. The posterior distributions of model parameters either converge well to a bell-shaped curve or restrict in a limited range; they are much more proper than that of [Reference Regan2]. The estimate of R 0 ranges from 1.38 to 2.89 and the corresponding critical level of immune proportion to HAV reduce to 65% for controlling the hepatitis A outbreaks in MSMs in Sydney. Although this appears a small reduction in the critical level compared to 70% suggested in [Reference Regan2], the outbreak analysis suggests that the outbreak probabilities under a proportion immune smaller than this critical level decrease greatly (Fig. 3a). A combination of both reductions greatly compromises the discrepancy between the theoretical prediction of [Reference Regan2] and the observation of no outbreaks in Australian MSMs since 1996.
One concern is on the size of MSM population. Based on the survey of [Reference Madeddu8], the estimated size of the MSM population in the postcodes that predominated in the 1991 outbreak ranged from 5000 to 10 000. If we fix the population size at such levels and assume the proportion of the susceptible ranging from 0.5 to 1.0, then the simulated transmission dynamics cannot reach the peak around the end of 1991 and downturn will take much longer to emerge than the duration of the outbreak. This is because many susceptible MSMs are still there to be infected. In this simple model proposed by [Reference Regan2], the downforce for the spread of HAV infection is the deletion of susceptible MSMs. By allowing the population size to vary and thus to be estimated, our analysis suggests a size of 1274, which is much smaller than the survey, though being comparable to that of [Reference Regan2]. Another possible downturn force for an outbreak is the reduction in contact rate between MSM people, presumably due to interventions and health education by local health agency since the onset of the outbreak (c.f., [Reference Zhang and Iacono16]). A simple simulation analysis (see ‘Effect of behaviour response during the outbreak’ in Technical appendix B) shows that when the contact rate and thus the transmission rate reduce 29% (ranging from 2% to 47%) from July 1991, the estimated size of MSM population increases to 2811, which is still much smaller than the ranges suggested by the survey of [Reference Madeddu8]. Nevertheless, the shrinkage of the size of the MSM population is another cause that reduces the outbreak probabilities.
This deviation of theoretical estimation from the actual survey in the effective size of MSM population might reflect the fact that the real mixing patterns among MSM population depart significantly from the homogeneous-mixing. In more or less realistic contacts, most people have only one or few contacts while only a very small proportion of people have large numbers of contacts [Reference Bansal, Grenfell and Meyers18]. This deviation might also suggest that there would be a small but highly connected core group of MSMs during the outbreak while the remainder large proportion of MSMs are isolated in some way from the spread of HAV. Such structured contact patterns should greatly reduce the effective size of MSMs in view of spread of HAV infection. Transmission models that include these realistic demographic characteristics of MSMs and their contact rates will be required for a complete understanding of the spread of HAV especially the force for the downturn of the outbreak within the population where susceptible has not been exhausted.
Conclusion
In this study, we have demonstrated the importance of using appropriate inference methods for model parametrization and calibration. With the information of only symptom onset dates of symptomatic infections, many epidemiological parameters are left unidentifiable. Making reasonable assumptions about the transmission dynamics can help reduce the number of independent parameters and therefore the uncertainty in model calibration. Bayesian inference through MCMC sampling treats model fitting processes as a dynamic process and can dig out the possible combinations of model parameters that can generate the time series comparable to the observed outbreak dataset. We show that compared to the traditional least squares algorithm, Bayesian inference provides a more reliable estimation of model parameters; the outbreak analysis based on the calibrated model might be more robust to explain the field observation (i.e., the absence of the HAV outbreak in MSM population in Australia since 1996).
Supplementary material
The supplementary material for this article can be found at https://doi.org/10.1017/S0950268819001109
Author ORCIDs
X.-S. Zhang, 0000-0002-6596-4500
Acknowledgements
We would like to thank the anonymous reviewer for his/her helpful comments and suggestions. The authors received no specific funding for this work.
Declaration of interest
None





 Open access

