

Introduction
Which ministryFootnote 1 is in charge when governments set out to design their policies? This question is not just a matter of administrative pedantry, but far‐reaching real‐world implications can ensue from the assignment of policy responsibility inside a government. Public policies are treated differently depending on the ministry within which they are handled. For example, when contemplating the matter of immigration, bureaucrats in the ministry of economic affairs are concerned primarily with the national economy's need for labour, whereas their colleagues in the ministry of interior affairs rather set the focus on domestic security.
The notion of exclusive ministerial portfolios is the linchpin of a substantial part of scholarship on ministerial governance. Admittedly, most scholars do not unconditionally support Laver and Shelpse's (Laver & Shepsle, Reference Laver and Shepsle1994, Reference Laver and Shepsle1996) assertion about the absolute policymaking powers of ministers; yet they often stress different mechanisms governments employ to “keep tabs” on ministers (e.g., Höhmann & Sieberer, Reference Höhmann and Sieberer2020; Martin & Vanberg, Reference Martin and Vanberg2005, Reference Martin and Vanberg2011; Moury, Reference Moury2011; Thies, Reference Thies2001; Timmermans, Reference Timmermans2006). With a few notable exceptions (Dewan & Hortala‐Vallve, Reference Dewan and Hortala‐Vallve2011; Fernandes et al., Reference Fernandes, Meinfelder and Moury2016), the general premise remains that governments create departments with exclusive policy jurisdictions. From this perspective, the question of how governmental policy initiatives are assigned to ministries to be fleshed out is essentially predetermined.
This paper questions this widespread assumption and asks to what extent departments dominate a particular issue domain empirically. Using data from the Comparative Agendas Project (CAP), our research design relies on content‐coded data from three European countries. For all parliamentary bills from the Dutch Tweede Kamer (1995–2009), the German Bundestag (1972–2017) and the Danish Folketing (1988–2011), the CAP provides information on the substantive policy content of a bill. We matched this information with procedural features such as ministerial responsibility. The combination of both types of information allows us to measure the policymaking dominance of a ministry in a particular policy domain.
For all countries, we show that there is hardly any ministry with an exclusive focus on a single policy dimension. Their legislative activities range across numerous policy domains. Furthermore, more than one‐third of all observed policy issues defy a neat allocation to any ministry's jurisdiction but are generally dealt with by several ministries. Since the content classification employed in this paper distinguishes about 250 distinct policy issues, we refrain from adjudicating to what extent this finding conforms to the notion of exclusive ministerial portfolios. Instead, we interpret the observed empirical patterns as implying that the final decision on which ministry is in charge of a policy initiative is political. Given the uncovered variation, neither coalition agreements nor administrative directives are likely to circumscribe the assignment of bills to a particular ministry. As there is little public information on the rules and procedures of cabinets, the process by which the top executive assign bills to individual ministries is largely uncharted territory. In the conclusion, we therefore advocate for opening the black box of bill assignment in future research.
Portfolios and policy domains
The majority of contemporary coalition governance studies simultaneously depart from, centre on and take issue with Laver and Shepsle's policy dictator model (Laver & Shepsle, Reference Laver and Shepsle1996). Devised as a policy‐centred theory of government formation, it places governments at the centre stage of the policy‐making process. The model rests on a strict departmentalization of policy areas into ministerial portfolios, each of which can be steered by the responsible ministers without major interference from their colleagues. There are two main reasons that are commonly marshalled to support a strict departmentalization of ministerial affairs. Firstly, in many governments there is a tacit agreement among ministers not to interfere in their colleagues' affairs, be it for reasons of high ministerial workload or anticipated reciprocity (Andeweg, Reference Andeweg2000). Secondly, the task of drafting legislation is performed by highly specialized bureaucrats within the ministries, who are able to embed new policy ideas within the already existing legal framework (Bonnaud & Martinais, Reference Bonnaud and Martinais2014, p. 2003). Hence, as long as the government neither purposefully condones nor accidentally permits redundancies of this specialized policy staff, ministries lack the expertise to design bills outside their policy domain (see case studies in Laver & Shepsle, Reference Laver and Shepsle1994).
The policy dictator model was equally successful in highlighting governments' role in policymaking and spurring research on the various means of how governments control ministers to prevent them from reneging on agreed government policy guidelines. Being rooted in a principal‐agent framework (Strøm et al., Reference Strøm, Müller and Bergman2008), this literature seeks to curtail ministerial dominance either ex ante or ex post. Speaking to the former, governments rather appoint ministers whose preferences are expected to be aligned with the policies their principal envisions (Bäck et al., Reference Bäck, Debus and Müller2016). Another ex ante mechanism discussed in the literature that zooms in on coalition governments is the use of public coalition agreements, which set a yardstick against which ministerial activity can be compared and potentially reversed (Moury, Reference Moury2011; Timmermans, Reference Timmermans2003, Reference Timmermans2006). Regarding ex‐post controls of curbing ministerial dominance, junior ministers (Thies, Reference Thies2001) can scrutinize ministerial activities and, thus, deprive ministers of their agenda‐setting advantage. Moving from the executive to the parliamentary arena, Martin and Vanberg (Reference Martin and Vanberg2005, Reference Martin and Vanberg2011) stress how legislators use their authority to adapt government bills to spot and re‐write biased legislation.
Each of these tools is capable of curbing ministers' ability to dominate their own policy habitat. However, with the notable exception of Dewan and Hortala‐Vallve (Reference Dewan and Hortala‐Vallve2011) and Fernandes et al. (Reference Fernandes, Meinfelder and Moury2016), these studies on ministerial governance have generally not questioned the validity of the underlying assumption of exclusive policy domains itself but accepted it as a token. In our reading of the literature, it is common practice in the field to use Laver and Shepsle (Reference Laver and Shepsle1994, Reference Laver and Shepsle1996) theoretical foundations as a starting point from which new theoretical ideas can be developed. Instead of providing another theoretical discussion on the proper structural description of ministerial portfolios, we strive to assess empirically to what extent a strict departmentalization is an adequate proxy of how ministries devise governmental policies. While we acknowledge that Laver and Shepsle (Reference Laver and Shepsle1996) did not conceive their model as a precise description of reality but rather a modelling strategy for overcoming the problem of circular preferences during coalition formation, it yields the testable expectation that bills on similar policy issues should neatly cluster within ministerial jurisdictions. If, however, bills on similar issues commonly are drafted by different ministries, departmentalization merely serves as a helpful assumption and does not reflect an empirical regularity.
Data on legislation and ministerial sponsorship
Our analysis rests on a longitudinal dataset of all parliamentary bills from the Danish, Dutch and German national parliaments, which originated in first drafts supplied by the executive. The data were obtained from the respective national branches of the CAP (Breunig & Schnatterer, Reference Breunig, Schnatterer, Baumgartner, Breunig and Grossman2019; Green‐Pedersen & Walgrave, Reference Green‐Pedersen and Walgrave2014; Timmermans & Breeman, Reference Timmermans, Breeman, Green‐Pedersen and Walgrave2014). Inspired by Baumgartner and Jones (Reference Baumgartner and Jones1993) early work on political agendas, the CAPFootnote 2 traces policy issues across political systems and political activities within each system (Baumgartner et al., Reference Baumgartner, Breunig and Grossman2019). The CAP community's main interest is in what policy issues rise and fall on the political agenda. With this focus, they classify political activities according to their substantive policy content. The coding scheme comprises the content of approximately 250 different policy topics.Footnote 3 The topic categories are mutually exclusive and exhaustive, as well as backward compatible. Multiple coders used the title, summary and whole content of the text for assigning a bill into one particular policy category. In the analyzed countries, the inter‐coder reliability is well above 90 per cent at the major topic level. Details about coder training and classifying policy content are found in the respective country chapters in Baumgartner et al. (Reference Baumgartner, Breunig and Grossman2019).
In the CAP data, each bill possesses a unique identifier. We utilize this identifier for locating bills in the official national parliamentary repositories of legislative activities, which furnish the necessary information on ministerial sponsorship of bills. Each national repository defines and assigns ministerial sponsorship. Sponsorship is assigned to the ministry that supplies the first legislative draft. The sponsoring ministry determines both the substantive and procedural approach to a policy problem and, hence, manages the process of drafting legislation. Furthermore, they are expected to consult with other ministries whose stakes are being touched (Busse, Reference Busse, Schrenk, Ismayr and Soldner2010, pp. 225–226). Based on a sample of bills, we find that in only 1 per cent of observations, more than just one ministry is in charge of the first draft. Moreover, the sponsoring ministry remains first in the list of ministries signing a bill.
Our observations are nested in 102 distinct ministries scattered over 27 governments in three countries. Due to the longer time span of the Danish and German data, there are almost twice as many governments from these countries (12, 10) in our sample as there are Dutch cabinets (6). Furthermore, the average number of ministries per government varies vastly across the three countries. Whereas Dutch and German governments are composed of about 13 ministries on average, Denmark affords a more specialized ministerial landscape of twice as many ministries per government. This imbalance has potential repercussions for the later analysis, as more specialization might lead to higher exclusivity of ministerial policy domains. The final dataset contains 12,251 observations and enables us to both identify the policy areas in which each ministry commonly drafts parliamentary bills and determine the extent to which these policy areas are dominated by one ministry.
Ministerial issue dominance in reality
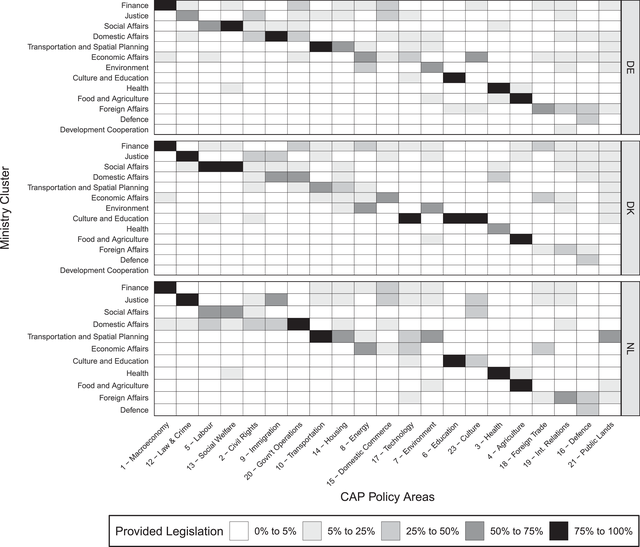
Our descriptive analysis relies mostly on graphical illustrations of ministerial policy making as well as simple summary statistics. The heatmaps in Figure 1 exploit the nested structure of the CAP coding scheme – detailed policy issues clustered in larger policy areas, which include inter alia topics such as macroeconomy (1), civil rights (2) or law and crime (12) – to depict the extent to which topically similar bills originate in the same cluster of ministries. In order to improve readability, ministries have been assembled into larger groups whenever they are essentially equal and only differ about slight alterations in their title.Footnote 4 For brevity, we refer to these clusters as ‘generic ministries’. The x‐axis denotes the 21 areas, as defined by the CAP, while the y‐axis lists generic ministries that have existed during the time frame of this study. The order in which ministries appear reflects the total number of bills they have drafted, with more active ministries at the top. Each square within the heatmap shows the degree to which a ministry dominates a given policy area, which is measured as the percentage of legislation it provides vis‐à‐vis its peers.
Percentage of legislation provided by a cluster of ministries. Ministries are ordered by bill count. CAP policy areas are at the bottom. Shading is the percentage of bills per domain. Columns add to 100 per cent. Refer to Figures A1 to A3 in online Appendix B for a representation that does not rely on generic ministerial clusters.

A visual inspection of the heatmaps reveals that there are some policy areas that neatly map onto generic ministries, whereas others defy such a precise correspondence. Some clearly defined policy areas such as agriculture or education are dominated by the corresponding Danish, Dutch and German ministries, all of which are in charge of more than three quarters of legislation the government forwarded to parliament in these areas. Interestingly, the same is true for the macroeconomy, which is arguably less clear‐cut. The respective ministry of finance dominates macroeconomic policy making in all three countries.Footnote 5
The plot also makes apparent that many policies are not dominated by any single ministry. For example, defense matters are evenly divided between the Ministry of Foreign Affairs and the Ministry of Defense in the Netherlands. To a lesser degree, the same is true for Denmark and Germany, even though these countries have spread out policy‐making authority in this area more radically. The policy domain of international relations is typically run by the Ministry of Foreign Affairs, but legislation is frequently drafted by the Ministries of Finance and Justice. More generally, only seven to eight policy areas per country can clearly be mapped on one dominant ministry, that is, there is one ministry that is in charge of at least 75 per cent of the relevant legislation.
Ministries with strict and with permeable domain boundaries exist. In all three countries, the larger and legislatively more active ministries sponsor bills across different policy issues. For sure, the Danish Ministry of Finance has a clear focus on macroeconomy; yet, it is also rather active in the areas of energy policies, foreign trade and government operations. The German Ministry of Domestic Affairs drafts the majority of legislation speaking to matters of immigration; it is also involved in an array of different policy areas spanning, inter alia, environment, domestic commerce, and technology. In contrast, ministries drafting fewer bills tend to focus their efforts on fewer policy areas. A striking example of such a ministry is the Ministry of Food and Agriculture, which in all countries dominates the corresponding policy area and otherwise remains largely inactive.
Two important descriptive insights emerge from Figure 1. First, more than 60 per cent of policy areas are not dominated by a ministry, in the sense that just one single ministry has exclusive jurisdiction over it. Policy areas that are exclusive to one ministry are often, but not only, topics that can more intuitively be demarcated, such as health, agriculture or education. Secondly, especially larger ministries dealing with governmental core functions (Jennings et al., Reference Jennings, Bevan, Timmermans, Breeman, Brouard, Chaqués‐Bonafont, Green‐Pedersen, John, Mortensen and Palau2011) sponsor bills across numerous policy areas. These ministries supply many bills across a diverse portfolio.
While the heatmaps provide a first indication that ministries often legislate in numerous policy areas, the use of rather broad policy areas naturally gives the impression of broad ministerial activity. The CAP coding scheme also distinguishes about 250 sub‐issues within the larger topic clusters, which facilitates a more fine‐grained analysis of policy issues. This detailed data can be leveraged for measuring ministerial policy dominance, which is a measure that captures the diversity of ministries sponsoring legislation that speaks to a narrowly defined policy issue. While there are many possibilities of operationalizing dominance, the Inverse Simpson Diversity Index is well known in political science, typically used as the measure of the ‘effective number of parties’ (Laakso & Taagepera, Reference Laakso and Taagepera1979). Analogously applied to our data, it describes ministerial dominance for each government in our sample as the ‘effective number of ministries’ that draft legislation on a policy issue. Mathematically, the measure is defined as $1/\lambda = 1/\sum _{i=1}^{N}p_{i}^{2}$, where N denotes the total number of ministries and $p_{i}$ describes the proportional abundance of bills sponsored by ministry i. The resulting score ranges from one to the number of individual ministries designing legislation about a policy issue, where smaller values denote a higher degree of dominance. More palpably, when ministerial dominance is exactly one, there is only one ministry drafting legislation on a given policy issue. In contrast, integers larger than one signify that multiple ministries draft equal amounts of legislation. Values in between integers are indicative of policy issues that are dominated by one or multiple ministries, which, however, are accompanied by additional, less active ministries.
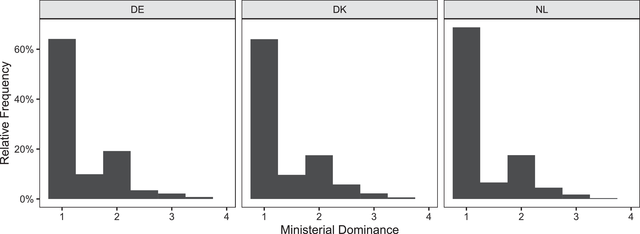
The histograms in Figure 2 show that in any of the three analyzed countries about two‐thirds of policy issues are below 1.25, meaning that there is one clearly dominant ministry responsible for the main bulk of governmental legislation.Footnote 6 Regarding the remainder of policy issues, the assignment of government bills to ministries is less clear. Across all countries, about 20 per cent of policy issues are dealt with by two rather equal ministerial peers, and in about 3 per cent of policy issues, this number even rises to three ministries that are equally in charge of drafting legislation on a particular public policy. In short, the level of ministerial dominance across the three countries is variegated.
Distribution of ministerial dominance per government in each country. Dominance is measured as the effective number of ministries drafting legislation on a policy issue (using all 250 CAP policy issues). To improve readability, 16 extreme cases that are beyond 4.25 on the x‐axis are not shown.

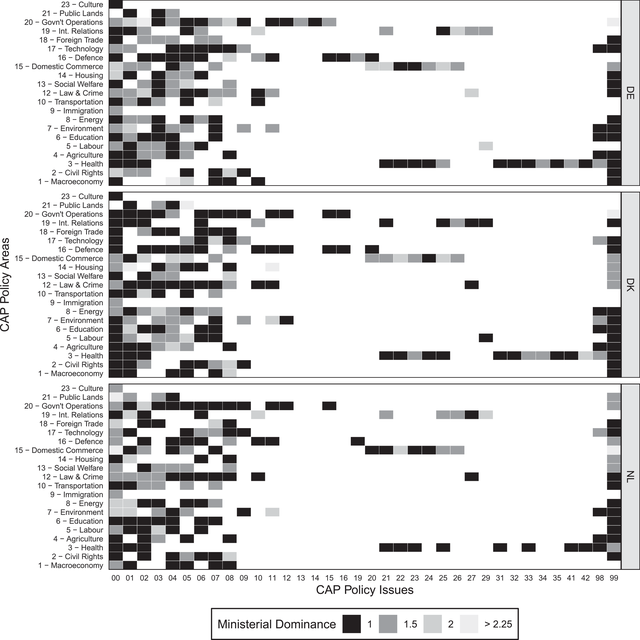
Our data offer detailed insights regarding which policy issues are particularly prone to be dealt with by multiple ministries. Figure 3 visualizes ministerial dominance per policy issue averaged across all observed governments within a country. Again, the plot capitalizes on the nested issue definition of the CAP and plots the issue areas on the y‐axis, while the x‐axis denotes the more detailed policy issues within those major areas. Each box symbolizes one of the detailed policy issues that are defined by the CAP. The boxes' shading represents the degree to which ministerial sponsorship is dominated. Hence, the plot allows discriminating policy issues that are commonly dealt with by just one ministry from those that defy ministerial exclusivity.
Ministerial dominance per policy issue. Each box denotes one policy issue as defined by the CAP. The legend is compatible with Figure 2, and shading denotes a 0.5 interval around the specified midpoint.

Across all governments of the three countries, many policy issues are not dominated by one ministry, and a clear cross‐national distinction is absent. While Danish and Dutch governments generally allow their respective ministries of housing, justice and domestic affairs to draft legislation around ‘community development’ (CAP‐code 14‐01), their German peers attach this matter to just one ministry, be it spatial planning or justice. Similarly, bills regarding ‘employment training’, that is, workforce development and job training for displaced workers, are generally designed just by the respective national ministries of social affairs in Germany and the Netherlands; yet, in Denmark both the Ministry of Social Affairs and the Ministry of Education commonly draft legislation regarding this issue. It might be exactly those differences in ministerial dominance that are revealing whether governments regard policy issues as clearly defined and contained, or rather cross‐departmental and, hence, allow ministerial assignments to vary in order to capture more diverse expertise.
Even though there is no clear pattern regarding which policy issues are generally served by multiple ministries across the three studied countries, Figure 3 echoes the point that about 60 per cent of policy issues are clearly below 1.25 and, thus, can unequivocally be ascribed to one ministry.Footnote 7 The remaining policy issues are dealt with by either multiple equally dominant ministries or at least a dyad of one dominant and one subordinate ministry. We do not want to adjudicate whether the fact that about 40 per cent of policy issues cannot be ascribed to one dominant ministry suffices to uphold the idea of exclusive portfolios. We are certain, though, that the empirical regularities elucidate that the ministerial division of labour within governments is considerably more complex than often assumed.
Implications
The policy dictator model (Laver & Shepsle, Reference Laver and Shepsle1994, Reference Laver and Shepsle1996) has served studies of parliamentary democracy as a linchpin for many years. The model provides an elegant solution to the problem of circular majorities (Laver & Shepsle, Reference Laver and Shepsle1996, pp. 9–11) in multidimensional policy spaces and serves as a focal point for ministerial governance. Although its ideas and predictions have been extensively criticized and discussed (e.g., Martin and Vanberg, Reference Martin and Vanberg2005, Reference Martin and Vanberg2011; Thies, Reference Thies2001), its core assumption of largely exclusive ministerial jurisdictions has rarely been questioned as a foil against which more collaborative models of ministerial governance can be developed.
This study describes the assignment of all parliamentary bills to ministries in Denmark (1988–2009), Germany (1972–2011) and the Netherlands (1995–2009). We find that many ministries have a discernible policy focus, and that policy jurisdictions cannot generally be characterized as exclusive. Especially traditional ministries that serve governmental core functions, such as domestic affairs or justice, often draft legislation across a wide range of policy domains. One implication of this finding might be that some ministries could be a prized asset during coalition negotiations because of their ability to legislate on many policy domains. Second, our results support previous studies researching overlapping ministerial policy briefs (Dewan & Hortala‐Vallve, Reference Dewan and Hortala‐Vallve2011; Fernandes et al., Reference Fernandes, Meinfelder and Moury2016) by showing that the expertise to draft legislation of often spread across different ministries. Hence, ministries themselves, equipped with ample coordination capacities (Mayntz & Scharpf, Reference Mayntz and Scharpf1975; Scharpf & Mohr, Reference Scharpf and Mohr1994), have the potential to spot policy bias and broker compromises between different political perspectives – be it on the level of individual politicians or coalescing parties.
Using a detailed array of about 250 discernible policy issues as defined by the CAP, our data also show that about two‐thirds of those issues are exclusively dealt with by just one ministry. The remainder of policy issues is often a playground for numerous ministries to design and launch their own legislation. In our sample, we are unable to identify a cross‐national pattern regarding the set of policy issues that defy the notion of exclusive ministerial jurisdictions. Rather, the differences may be telling about whether national governments regard policy issues as clearly defined and, thus, allocate exclusive ministerial policy‐making authority, or instead conceive of an issue as cross‐cutting, which is why policy making can transgress boundaries between ministerial jurisdictions. Whether ministries indeed ‘poke their noses’ into their colleagues' affairs or certain policy areas are simply unaligned with the portfolio structure remains to be researched.
Our empirical findings have implications for the study of governments. Most research on coalition government neglects the bill assignment process and uses the drafted bill as the starting point of inquiry. This disregard appears to be an unwarranted simplification. The decision of which ministry will be in charge often entails a conflict of competence, because the leading ministry determines the substantive, procedural and managerial aspects of a legislative project. Cabinets are reluctant to allow ministers to deflect controversial issues while engaging in attractive matters. Surprisingly, there are no formal rules on the process of assigning sponsorship. The process is merely guided by a shared understanding of substantive responsibilities (Busse, Reference Busse, Schrenk, Ismayr and Soldner2010, pp. 225–226). Our findings mirror this insight. The fact that multiple ministries draft legislation speaking to about 40 per cent of policy issues means that neither coalition agreements nor detailed organizational decrees sufficiently determine which ministry oversees a policy project. Rather, the non‐exclusivity of policy issues may be suggestive of a strategic interaction among ministers, who seek to have particular bills assigned to their ministry.
The empirical ambiguity of bill assignment also casts new light on the models of coalition governance that presuppose self‐contained ministerial jurisdictions (e.g., Laver & Shepsle, Reference Laver and Shepsle1996). The resulting principal‐agent problem within cabinets is conventionally thought to motivate extensive monitoring among coalition partners (Andeweg, Reference Andeweg2000), who might install ‘hostile’ junior ministers (Thies, Reference Thies2001) or engage in legislative scrutiny (Martin & Vanberg, Reference Martin and Vanberg2005, Reference Martin and Vanberg2011). If, however, ministerial dominance is neither ubiquitous nor precludes inter‐ministerial cooperation (Klüser, Reference Klüser2022), the principal‐agent problem within cabinets disintegrates. In that case, there is no incentive for political actors to engage in general monitoring. Rather, it should predominantly be dominant ministries that are likely to be scrutinized. Hence, we encourage coalition scholars to verify that the ailment – ministerial dominance – indeed exists before they begin to study potential remedies.
Yet, this begs the question of why different levels of ministerial dominance exist in the first place. Future research ought to explore two potential explanations. The difference might be predominantly caused by substantial differences in the policy areas ministries deal with. Particularly, more traditional policy issues such as domestic security or agriculture are likely dominated by one ministry. Governments have been dealing with such issues for decades and often delegated decision making to specialized policy subsystems (Baumgartner & Jones, Reference Baumgartner and Jones1993). Hence, government structures have developed around such policy issues, leaving little room for ambiguity about which ministry is in charge. In contrast, issues that cross‐cut these government structures defy a clear assignment. As a result, policy areas such as environmental policies or energy invite political debates about who may take the lead and are less susceptible to domination.
The reason for differences in the level of dominance might also be political. Coalition government scholars have long regarded portfolios as a fixed asset to be distributed during coalition formation (Bäck et al., Reference Bäck, Debus and Dumont2011; Gamson, Reference Gamson1961). Empirically, however, the government's structure is malleable, as incoming governments regularly create, discontinue or merge existing portfolios to satisfy political needs (Sieberer, Reference Sieberer2015; Sieberer et al., Reference Sieberer, Meyer, Bäck, Ceron, Falcó‐Gimeno, Guinaudeau, Hansen, Kolltveit, Louwerse and Müller2021; Verzichelli, Reference Verzichelli, Strøm, Müller and Bergman2008). Our findings add to this strand of research because they indicate that some ministries, given their involvement in many policy domains, are more valuable than others. Therefore, incumbent parties are likely eager to seize control over ministries with a comparatively broad policy focus, which provides the opportunity to bargain over the allocation of a wider array of government bills.
While the exact nature of this bargaining process still remains to be researched, the results are anything but just a theoretical matter. In parliamentary democracies, where policy formulation is generally commissioned by the ministerial bureaucracy, bureaucratic views and conceptions significantly shape legislation. Depending on their position in the ministerial bureaucracy, bureaucrats possess expert knowledge of specific policy subfields (e.g., Bendor et al., Reference Bendor, Taylor and Gaalen1985; Peters, Reference Peters2018; Wildavsky, Reference Wildavsky1979), which influences their preferred policy designs (Eisner et al., Reference Eisner, Worsham and Ringquist2006, p. 21). Hence, assigning ministerial sponsorship to a legislative project simultaneously defines the set of conceivable policy options and thereby renders the process of bill assignment substantively relevant in terms of policy outcomes. This insight calls for a more dynamic perspective on ministerial governance, especially regarding coalition governments. Our findings indicate that neither the allocation of portfolios to incumbent parties (e.g., Bäck et al., Reference Bäck, Debus and Dumont2011), nor detailed descriptions of policy goals in coalition agreements (e.g., Timmermans, Reference Timmermans2003), settle disputes about policy competences. On the contrary, disagreements on policy really just actualize after a new coalition government has formed.
Acknowledgements
We are grateful for comments and suggestions on previous versions of this article by Christoffer Green‐Pedersen, Carsten Jensen, Ulrich Sieberer, Peter Bjerre Mortensen and Lanny Martin. Furthermore, we would like to thank the participants of the session ‘Electoral Institutions’ at the 2019 APSA Annual Meeting, as well as the three anonymous reviewers. Both authors declare that they have no conflicts of interest.
Open access funding provided by Universitat Zurich.
Online Appendix
Additional supporting information may be found in the Online Appendix section at the end of the article:
Table A1: Ministry Cluster
Figure A1: Denmark. Heatmaps of legislative activity.
Figure A2: Germany. Heatmaps of legislative activity.
Figure A3: The Netherlands. Heatmaps of legislative activity.
Table A2: Percentage of legislation provided by ministry. Ministry of Finance is left out
Table A3: Percentage of legislation provided by ministry. Ministry of Justice is left out
Table A4: Percentage of legislation provided by ministry. Ministry of Domestic Affairs is left out
Table A5: Percentage of legislation provided by ministry. Ministry of Social Affairs is left out
Table A6: Percentage of legislation provided by ministry. Ministry of Finance is left out
Table A7: Percentage of legislation provided by ministry. Ministry of Justice is left out
Table A8: Percentage of legislation provided by ministry. Ministry of Domestic Affairs is left out.
Table A9: Percentage of legislation provided by ministry. Ministry of Social Affairs is left out
Table A10: Percentage of legislation provided by ministry. Ministry of Finance is left out
Table A11: Percentage of legislation provided by ministry. Ministry of Justice is left out.
Table A12: Percentage of legislation provided by ministry. Ministry of Domestic Affairs is left out.
Table A13: Percentage of legislation provided by ministry. Ministry of Social Affairs is left out.


 Open access