
6.1 Introduction
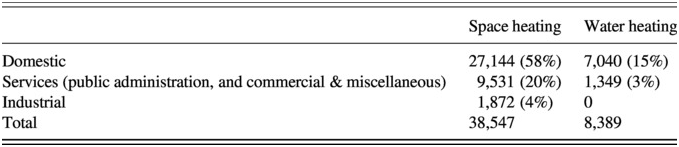
The heat system is relatively localised because heat cannot easily be transported over long distances. The heat system is therefore closely linked to buildings, where heat is used to warm up rooms (space heating) or water (e.g., for showers, baths, laundry). While there are many types of buildings (e.g., homes, offices, factories, schools, shops), the residential sector uses most heat-related energy (Table 6.1). This chapter therefore focuses on the residential sector, and particularly on space heating, which is the largest segment.
UK domestic space heating is dominated by gas-fired boilers, which are used in 85% of homes. Electric storage heating is used in 5% of homes, oil central heating in 4%, other options (e.g., coal) in 4%, and 2% of homes are linked to heat networks (BEIS, 2018a: 20). The UK’s gas-dominated residential heat system has a hybrid centralised-decentralised form, because most heat conversion is done on-site (using individual gas-fired appliances), but fuel is supplied by a national gas distribution infrastructure.
We conceptualise heating and buildings as two ‘orthogonal’ or intertwined systems. On the one hand, energy infrastructures (for gas) or supply chains (for coal, oil, biomass) feed into conversion devices (e.g., gas boilers, coal or biomass stoves, electric heaters, heat pumps) to generate heat. The schematic representation in Figure 6.1 focuses on the dominant gas-based heating system. On the other hand, heat demand is shaped by the building shell (including walls, roofs, windows, doors, floors) and design choices made in the construction industry and its supply chains. Many UK buildings are poorly insulated and draughty, leading to relatively high heat demand (and heat losses).
Schematic representation of the material elements and flows in the dominant UK (domestic) heat system (involving heating and buildings)

Despite increasing numbers of homes, greenhouse gas emissions from residential buildings decreased by 29% between 2001 and 2014 (see Figure 6.2).Footnote 1 These reductions mostly came from incremental efficiency improvements in gas boilers and the thermal performance of buildings (e.g., various insulation measures). Since 2014, emissions have stagnated and slightly increased, leading the Committee on Climate Change to warn that progress is not on track to meet climate change targets: ‘The progress made on buildings remains insufficient even to meet the previous target for an 80% reduction in emissions relative to 1990 levels … In order to go further to meet net-zero ambitions, bold and decisive action is urgently needed from Government’ (CCC, 2019a). Further decarbonisation will require deeper and more fundamental changes in heating and buildings systems (e.g., low-carbon heat sources, very energy efficient buildings).
UK greenhouse gas emissions (in MtCO2e) from buildings 1990–2019

To further explain heat-related emission trends and assess potential options for deeper system reconfiguration, we will analyse the heating system (including fuel supply, distribution, on-site conversion, and heating practices) in Section 6.2 and the buildings system in Section 6.3. These systems are related to different actors, technologies, and policies. We will then address several niche-innovations (heat pumps, biomass heating, solar thermal, greening the grid, heat networks and passive housing) in Section 6.4, and finally assess the speed and depth of low-carbon heat reconfiguration in Section 6.5.
6.2 Heating System
6.2.1 Techno-Economic Developments
Energy supply for UK heating is dominated by natural gas, which is distributed through a dense, centrally operated, piped network established from the 1960s through the integration of local networks and systematically expanded as the UK ‘dashed’ for gas (Arapostathis et al., Reference Arapostathis, Pearson and Foxon2014). Relevant technical operations include gas production (exploration, drilling), delivery and processing (at coastal terminals), gas transport, storage, shipping, supply, and third-party activities. The UK gas network involves (high-pressure) transmission and (medium- to low-pressure) distribution to end-users, though ownership and transport operations have been unbundled.
Domestic (North Sea) gas production peaked in 2000. Since then, gas imports (largely from Norway, but also LNG from further afield) have steadily increased (Figure 6.3). This was accompanied by investments in storage and (LNG) import facilities (Kopp, Reference Kopp2015), and a trend towards the diversification of sources to ensure energy security (Bradshaw et al., Reference Bradshaw, Bridge, Bouzarovski, Watson and Dutton2014), shorter contracts (for LNG), but also increasing dependence on global market fluctuations. The costly expenses associated with the creation of new facilities (storage, pipelines, controls) were passed on to users, but rising gas prices (Figure 6.4) were mainly caused by rising oil prices (to which gas prices are linked).
Gas production, imports, and demand in the UK in million cubic metres, 1998–2020

Evolution of average gas price (in GPB/GJ) for households in the UK, 1991–2019

Heat conversion in the UK is highly decentralised and located at the point of consumption in individual home-based boilers and stoves. Most households are self-contained heating generation and consumption units. Gas-based central heating systems have been installed in 85% of homes, with oil, coal, electric storage, and heat networks making up the remainder (BEIS, 2018b). Biomass (pellets and woodchips), solar-thermal, and heat pumps are slowly emerging as alternatives, but mainly as additional sources of heat for environmental or aesthetical motives (see Section 6.4.2).
The number of homes without a boiler has decreased substantially since the 1970s, which was linked to the diffusion of central heating. Since the 1990s, there have also been shifts towards more fuel-efficient boilers, first from standard to combination boilers, and then towards condensing and condensing-combination boilers (Figure 6.5). These incremental boiler improvements helped to reduce domestic gas use (see Figure 6.6) and greenhouse gas emissions.
Boiler types in the UK, 1975–2017

Domestic energy consumption for space heating and water heating in kilotons of oil equivalent, 1970–2019

Energy use for residential space heating increased from the 1970s to the mid-2000s (Figure 6.6) because of the switch to gas-fired central heating systems (which enabled heating of multiple rooms in houses) and because of increases in the average internal temperature in UK homes (Figure 6.7), which was driven by desires for higher thermal comfort and the heating of multiple rooms (Chappells and Shove, Reference Chappells and Shove2005). From the mid-2000s, energy use for space heating started to decline, with the exception of an unusually cold winter in 2010 leading to a heat consumption spike (Figure 6.6). This decline was driven by a switch to more efficient boilers (Figure 6.5), stabilisation and slight decrease of internal temperatures (Figure 6.7), and domestic insulation improvements (discussed under buildings system). Energy use for water heating has declined steadily since the 1970s, as hot water storage tanks were replaced by other heating appliances.
Average internal temperature in UK homes, degrees Celsius, 1970–2012

6.2.2 Actors
Energy Supply Actors: The actor configuration for gas distribution is like that of electricity distribution; it is fairly concentrated around a large technical infrastructure and a regulated market. National Grid Gas owns the National Transmission System (NTS), while eight regional Gas Distribution Networks (GDNs) are owned by four operators (Cadent, Northern Gas Networks, SGN, and Wales & West Utilities) who, for a fee, distribute gas to households on behalf of gas supply companies. Privatisation and liberalisation processes in the 1990s culminated in the emergence of the ‘Big Six’ suppliers (Centrica/British Gas, E.ON, NPower, SSE, Scottish Power, and EDF), which dominated the domestic gas market (Figure 6.8) in a vertically integrated oligopoly until 2014. Since then, the emergence of new players (e.g., Bulb, Co-operative Energy, Green Star Energy, Octopus Energy, OVO Energy, Shell Energy) has led to increased competition and shrinking market shares of the Big Six (Figure 6.8), notably for British Gas.Footnote 2
Domestic market gas supply market shares in GB, 2005–2020

Gas industry actors face increasing economic pressures from recent decreases in gas demand (for heating and for power generation), substantial infrastructure costs, operational challenges to maintain supply security, and alternative low-carbon heating options that may increase to address climate change (National Grid, 2019). In this context, gas industry actors strategically seek to maintain their position of centrality with regards to heating. Indeed, most of the energy supply actors are strongly attached to the gas-based heating system, because of sunk investments in pipeline infrastructures, business models, market positions, and technical capabilities. Their historic centrality is also proving an important advantage for shaping heat decarbonisation pathways amid significant uncertainties and policy indecision (Lowes and Woodman, Reference Lovio and Kivimaa2020).
For a long time, these actors paid limited attention to climate change. But since the mid-2010s, they have ‘woken up’ to potential threats of climate change and heat decarbonisation (Pearson and Arapostathis, Reference Pearson and Arapostathis2017), because many low-carbon transition scenarios (by the government, Committee on Climate Change, or researchers) envisaged a smaller role for gas in UK heating and a greater role for low-carbon alternatives such as heat pumps, heat networks, or biomass (discussed further later). The Energy Networks Association (ENA), which represents interests of transmission and distribution operators, has therefore started to use lobbying and framing strategies that propose alternative visions of the future, which advocate for a continued role for gas infrastructures, notably around arguments of security and affordability in the face of uncertainties, claiming that ‘Decarbonising gas – reducing the carbon emissions linked to its use – is the least disruptive way of delivering a cleaner, greener future’ (ENA, 2018: 10). These visions and scenarios include continued use of natural gas (via hybrid heat pumps or energy efficiency improvements) but also large-scale distribution of biomethane (which is currently practised in demonstration facilities and requires little to no adjustments to infrastructure and appliances, but poses significant scaling challenges) or hydrogen (which is less developed and more technically challenging) through repurposed gas grids (Lowes et al., Reference Lovio and Kivimaa2020; Richards and Al Zaili, Reference Richards and Al Zaili2020; Speirs et al., Reference Spaargaren, Cohen, Mol, Sonnenfeld and Spaargaren2018, see also Section 6.4.1). An ENA-commissioned report by KPMG (2016) suggested that a heat transition based on the ‘evolution of gas’ relying mainly on conversion of the gas grid to hydrogen would be as much as three times cheaper than other scenarios. These defensive strategies have increased the uncertainties that policymakers face with regard to potential low-carbon heat transition pathways (Lowes and Woodman, Reference Lovio and Kivimaa2020).
Appliance Manufacturers and Installers: Concerning heat conversion, there are many appliance manufacturers (e.g., boilers, radiators, controls) and installers (e.g., plumbers, builders, heat technicians). More than twenty companies supply gas boilers, but four international companies (Baxi, Worcester Bosch, Vaillant, and Ideal) dominate the UK market (DECC, 2013a: 74). While appliance manufacturers have remained committed to gas-dependent heating,Footnote 3 producers of other heat-related products (e.g., cylinders, radiators, controls) are more versatile and hence less resistant to significant changes in the sector (Lowes et al., Reference Lowes and Woodman2018). The Energy and Utilities Alliance (EUA), which represents the appliance manufacturers, ran an advocacy campaign on ‘Green Gas’ that also advocated continued use of existing gas infrastructure:
Rather than rip out heating systems and make the grid obsolete, it makes sense to decarbonise the gas we use; using so called green gases such as Biomethane and bio SNG, in addition to hydrogen, will deliver affordable and sustainable solutions to the challenges the UK faces.
There are also many heating equipment installers in the UK (e.g., builders, plumber, heating engineers) whose skills are mainly tied to conventional gas-fired boilers and central heating systems. While there are 74,000 registered Gas Safe registered businesses (representing over 100,000 gas engineers) in the UK (Gas Safe Register, 2017), the number of installers certified under the Microgeneration Certification Scheme (MCS) never exceeded 4,000, most of which were specialised in the installation of solar PV rather than heat pumps or biomass boilers (Hanna et al., Reference Hanna, Leach and Torriti2018).
The community of gas heating installers is concerned that a transition towards renewable heat or heat networks may disrupt their livelihood and knowhow (Gas Safe Register, 2017) and would require significant re-training to address the skills gap:
Heating engineers are naturally familiar with [conventional gas-fired] technology, meaning that a domestic boiler can be bought and installed in under a day. Low carbon heating technologies do not have these advantages, being relatively new to the market. With greater complexity and longer installation time, such technologies tend to be far more expensive. The high price of alternative heating systems is a clear barrier to uptake.
The existing skills of installers thus help to lock-in the gas-based heating system, while a transition to low-carbon heat systems is hampered by the lack of technical installation skills:
Growth in the low carbon heat sector will lead to new installer jobs, and upskilling of existing jobs as existing gas installers cross-train.
As ‘middle actors’ between appliance manufacturers and users, heating installers play important mediating roles through the advice they provide to users (Wade et al., Reference Wade, Hitchings and Shipworth2016), often in periods of stress when the existing boiler has broken down. Because they know more about gas-fired boilers, and have their own views on the reliability and performance of different brands, they tend to advise households to purchase conventional systems (Wade et al., Reference Wade, Hitchings and Shipworth2016).
Policymakers: Interventionist supply-side heat policies of the 1960s and 1970s, which focused on the transition from coal to gas and central heating (Pearson and Arapostathis, Reference Pearson and Arapostathis2017), were followed by privatisation, liberalisation, and a more hands-off approach in the 1980s and 1990s, focused on increasing competition and lowering prices. British Gas was privatised in 1986 and broken up in 1997 to create Centrica and Transco. Freedom of supplier choice was established for all customers from 1998, leading to more competition, overseen by the regulator (Ofgas, later Ofgem).
Affordability became a salient political issue in the mid-2000s, when rising gas prices and higher heating bills led to critical debates about affordability and energy company pricing strategies. These debates led Ofgem to emphasise its role as maximising access to affordable energy for all (Ofgem, 2019).
Energy security also became an important issue in the mid-2000s (Kuzemko, Reference Kuzemko2014), when increasing reliance on gas imports strengthened concerns about vulnerability (especially when Russia closed gas supplies to Eastern Europe in 2005), price stability, and so on. This led to ‘considerable debate as to whether the UK Government should incentivise new storage, but the current position is to leave it to the market. The net result being that very little new storage capacity has been built’ (Bradshaw, Reference Bradshaw2018: 3).
Energy poverty reduction has been a policy goals since the 1990s, because many vulnerable social groups (e.g., elderly, benefit claimants) struggled to afford decent heating. Winter fuel payments for elderly people were introduced in 1997. Policymakers also introduced the Warm Home Discount (for low-income pensioners) in 2008 and increased Cold Weather Payments (for benefit claimants) in 2009.
Heat remained a relatively unproblematic and invisible part of climate policy until 2008, when the Climate Change Act triggered debates about the decarbonisation of heat. Since then, the strategic policy visions on preferred options and transition pathways have changed several times (Winskel, Reference Winskel, Hawkey, Webb, Lovell, McCrone, Tingey and Winskel2016), focusing initially on heat pumps, then on heat pumps and heat networks, and recently also on hydrogen and biomethane in gas grids.
The various visions were not translated, however, into concrete strategies or plans for action, leading the Committee on Climate Change to lament in 2016 about a lack of direction and delivery: ‘Progress to date has stalled. The Government needs a credible new strategy and a much stronger policy framework for buildings decarbonisation over the next three decades’ (CCC, 2016: 7). In 2019 the Committee still concluded that UK ‘buildings and heating policy continues to lag behind what is needed’ (CCC, 2020: 19) to reach emission reduction targets.
For policymakers, climate change thus appears to have been of less importance than other heat-related issues such as affordability, energy poverty, and energy security.
Users: There are around 29 million homes in the UK, corresponding to a slightly lower number of heating installations, given that a small number of homes are supplied by block- or district-level heat networks. Domestic heating has relatively low cultural visibility and consists of a relatively undifferentiated product, with largely routinised and taken-for-granted practices and low levels of user engagement. The operation of heating systems requires little competence, and basically consists of pushing a button or adjusting a thermostat. Conventional heating practices are passive (Hope et al., Reference Hope, Roberts and Walker2018), and domestic residents primarily demand comfortable, hassle-free, and affordably heated homes regardless of the heat source (CCC, 2016). From a user-perspective, there are few current incentives to shift away from gas:
Surveys report that customer satisfaction with natural gas boilers is extremely high. Gas-fired central heating is affordable, provides very high levels of thermal comfort, responds quickly when customers adjust the required temperature, and is convenient and familiar to both householders and installers.
Users give relatively little thought to their heating systems, which are linked to routine behaviour. DECC (2013a: 82) reports that ‘the majority of homeowners would only consider replacing their heating system if it needed significant repairs or services’. Homeowners who rent their properties to tenants also have limited incentives to upgrade their heating equipment. Nevertheless, households have steadily adopted more energy-efficient boilers (Figure 6.5), which is partly due to public policies that have phased out inefficient boilers (discussed in Section 6.2.3), and partly due to anticipated cost savings associated with reduced gas use. Combined with insulation measures (discussed in Section 6.3.1), this has resulted in average reductions in household gas use.
Concerns over rising costs have led to more user switching between energy providers, which can lead to substantial savings. Since 2014, annual gas supplier switching rates have increased, reaching over 20% of customers in 2019 (Ofgem, 2019).
Most users have few motivations to adopt more radical low-carbon innovations such as heat pumps, biomass boilers, or solar thermal options (Balcombe et al., Reference Balcombe, Rigby and Azapagic2014). The Renewable Heat Incentive (RHI) sought to encourage the uptake of these technologies but has had only limited effect and largely benefited more affluent users and homeowners. Furthermore, user trust with regards to the quality of installers is an additional structural barrier to wider uptake of radical innovations. The industry quality insurance scheme (the Microgeneration Certification Scheme) does not appear to have substantially addressed these concerns (Hanna et al., Reference Hanna, Leach and Torriti2018), notably due to poor inspections and the recurrence of sub-optimal installations.
Wider Publics: Heating is not a highly visible issue in public debates, because it remains rather abstract and technical. If there are societal debates about heating, these are mainly about costs (because of rising energy prices) and energy poverty. There is little discussion about the environmental implications of heating, which is remarkable because households use much more energy for space heating than for electricity.
Civil society activity on heating is primarily oriented towards raising awareness, putting issues on the policy agenda, and maintaining pressure for more ambitious policies. NGOs have been most vocal on the issue of fuel poverty, which is a particular form of inequality and injustice. NGOs dedicated to fuel poverty include National Energy Action, National Right to Fuel Campaign, Fuel Poverty Action, Energy Bill Revolution, and End Fuel Poverty Coalition.
Several more generalist organisations seek to promote low-carbon heating by influencing policy, supporting the development of supply chains, or enabling informed user choices. For instance, the Centre of Sustainable Energy manages sustainable energy projects, and the Association for the Conservation of Energy represents the energy conservation industry and lobbies for more stringent energy efficiency policies. The Green Alliance is a green think tank that published a Manifesto for Sustainable Heat (Green Alliance, 2007), which contributed to raising policy awareness of the need to develop a long-term heat strategy and supporting a wider portfolio of options. The Energy Saving Trust offers information and user advice about low-carbon heating and home insulation options.
6.2.3 Policies and Governance
Formal Policies
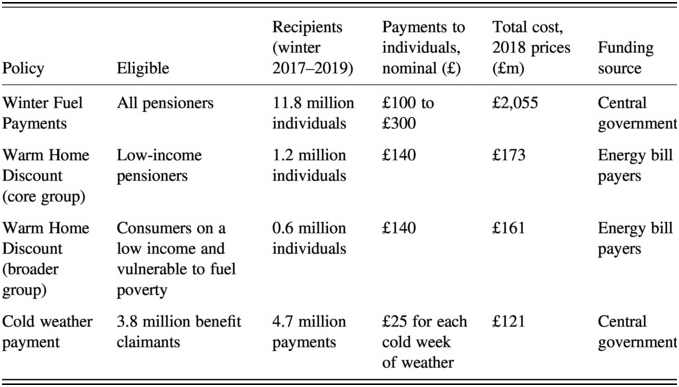
Since the 1990s, successive governments have introduced a range of policy instruments to address fuel poverty and financially assist vulnerable groups in cold periods (Table 6.2).
European and UK policymakers also played an active role in supporting the diffusion of more efficient gas boilers and appliances, which led to substantial yet incremental changes in existing technologies (Figure 6.5). The European Boiler Efficiency Directive (1992), for instance, mandated minimum performance standards, which led to the phase-out of boilers with efficiencies under 70% (G-rated), though it excluded back boilers. Efficiency standards were ramped up in the Building Regulations revision (2000), requiring a phase-out of boilers with efficiencies under 78% (D-rated) by 2002. The 2005 Building Regulations, brought forward by the Energy White Paper of the same year, further raised efficiency standards, requiring a phase-out of boilers with efficiencies under 86% (B-rated). This effectively mandated a switch to condensing boilers. In 2018, the Boiler Plus Standard further mandated new boilers to comply with a minimum efficiency of 92% as well as to include time and temperature controls.
Besides tightening standards, policymakers also used other instruments to stimulate the diffusion of more efficient gas boilers. Between 2009 and 2010, the Boiler Scrappage Scheme provided a £400 incentive for 125,000 households to upgrade from the least efficient, G-rated boilers to new high efficiency boilers (Dowson et al., Reference Dowson, Poole, Harrison and Susman2012). The government also ran several programmes that placed energy savings obligations on energy suppliers, which required them to make energy efficiency improvements in households (Rosenow, Reference Rosenow2012). The third Energy Efficiency Standards of Performance programme (2000–2002), the Energy Efficiency Commitments (2002–2008), the Carbon Emissions Reduction Target (2008–2012), the Community Energy Saving Programme (2009–2012), and the Energy Company Obligations (from 2013 onwards) all stimulated energy suppliers to assist the diffusion of efficient gas boilers as well as other measures (e.g., insulation, lighting, appliances).
Policy engagement with more radical heat innovations has been much more fragmented, patchy, and short-lived, however. The Renewable Heat Premium Payments (2011–2014) offered a single payment to assist households with the purchase of renewable heating technology (e.g., solar thermal panels, heat pumps, biomass boilers). It was replaced by the domestic Renewable Heat Incentive (RHI) (from 2014 onwards), which provides varying subsidies for alternative heating systems based on renewable sources (e.g., biomass boilers, heat pumps, deep geothermal, solar thermal). This scheme has been criticised as ineffective, narrowly targeted, and under-delivering on emission targets (NAO, 2018). It also ‘provided a disproportionate incentive for domestic biomass boilers compared to other technologies’ (CCC, 2020: 100). Although the RHI-scheme offered generous returns, roll-out remained limited and less than £100 million was spent in 2018 (CCC, 2019b: 29). This was because the RHI was ‘not supported by a package of measures to encourage and enable customers to make changes easily’ (CCC, 2020: 96). The reliance on a single (financial) instrument has thus remained ineffective in boosting renewable heat options.
These limited and relatively ineffective instruments have created major discrepancies between actual policy delivery and the far-reaching visions of heat decarbonisation transition that have been advanced since 2009. Already in 2016, the Committee on Climate Change (CCC) warned that: ‘The existing set of policies is not an effective overall package for decarbonising heating’ (CCC, 2016: 13). In 2018, the CCC commended the vision of the 2017 Clean Growth Strategy but also diagnosed that it contained ‘few new specific policies to deliver real emissions reduction’ (CCC, 2018a: 16). And in 2020, the CCC welcomed extensions of RHI and plans for a Green Gas Levy (to support green gas) but also assessed that ‘the current plans are far too limited to drive the transformation required to decarbonise the UK’s existing buildings’ (CCC, 2020: 20). It therefore urgently suggested that ‘policy needs a step change in ambition and delivery this year’ (CCC, 2020: 21).
There have been some recent policy announcements, but these remain relatively limited and do not yet add up to a step change in ambition and delivery. In 2019, the government announced plans for a ban on gas boilers in new homes from 2025, but this does not apply to replacement of boilers in existing homes, which is a far greater market, and has since then been reformulated as a rather vague ambition in the Energy White Paper (HM Government, 2020a):
We will […] consult in early 2021 over new regulations to phase out fossil fuels in off-grid homes, businesses and public buildings, including a backstop date for the use of any remaining fossil fuel heating systems.
In June 2020, the government awarded £14.6 million for the Electrification of Heat Demonstration Project, but the heat pump trial remains limited to 750 homes. There are also plans to replace the non-domestic RHI in 2021 with a Green Gas levy to further support the deployment of biomethane in the existing gas grid. More substantially, perhaps, the government launched the £320million Heat Networks Investment project in 2018 that supports local governments, firms, and third sector organisations in building and operating heat networks in areas of denser heat demand. The first projects to receive funding were announced in February 2020, but overall funding in this round was limited to £40m.
Although incremental boiler improvements in the 1990s and 2000s were achieved with a mix of policy instruments (e.g., efficiency standards, supplier obligations, financial incentives), the governance style with regard to low-carbon heat transitions seems to have narrowed in the 2010s to a technology-neutral, market-based approach (relying mainly on incentives and information): ‘Across all the different heating strands, the Government wants to make progress without prescribing the use of specific technologies. Instead, information for market players, including households and businesses, should be improved to enable effective decision-making’ (DECC, 2013a: 79).
Governance Style
In terms of governance style, heating has largely been approached as a demand-side technical performance problem to be addressed through efficiency improvements at the point of heating. Mandated performance levels and minimum standards have been rather effective in improving the efficiency of fossil heating appliances, but the potential for further incremental improvements is limited. Aside from clarity on performance standards, low-carbon heat policy has been marked by hesitancy and a lack of coherence.
The reliance on isolated market modulation mechanisms (e.g., the RHI) has, so far, been ineffective in driving low-carbon heat transitions, because instruments tended to be fragmented, short-lived, and not part of a wider policy mix. Transition governance has been weak and the successive changes in long-term visions have not provided clear directionality to support innovation, market formation, supply-chain development, or the build-up of relevant skills and competences on the required scale. Strategic visions (e.g., 2012, 2013, 2020), although multiplying in recent years, were also not translated into concrete policies and instruments, leading to lack of delivery. These strategic visions were also shaped by various influence groups, leading to a lack of coherence concerning technological preferences (Broad et al., Reference Broad, Hawker and Dodds2020).
A new Buildings and Heat Strategy was expected in 2020 but has been delayed, and it remains to be seen if this will provide more clarity about future directions of travel and back these up with effective policy instruments. The general heat policy objectives that such a strategy needs to meet have been spelled out in the latest Energy White Paper (HM Government, 2020a) and Ten Point Plan (HM Government, 2020b), but many uncertainties remain concerning delivery on these announcements. Repeated delays in publishing the new Buildings and Heat Strategy are indicative of disagreement about implementation and feasibility.
6.3 Buildings System
6.3.1 Techno-Economic Developments
The demand for domestic space heating is strongly influenced by the insulation properties of the building shell, which are poor in the UK compared to other countries. The UK housing stock is relatively old: most houses were built before 1960 (Figure 6.9). Houses also have high material obduracy and are deeply locked-in: 80% of the current building stock is projected to still be in use by 2050 (Dowson et al., Reference Dowson, Poole, Harrison and Susman2012).
Age profile of UK housing stock, thousands of dwellings

The largest heat loss components in UK homes are walls, ventilation, windows, and roofs. Between 1970 and 2008, the average heat loss per dwelling was reduced by about 33% (Figure 6.10) through a range of incremental improvements in existing houses. Most houses with lofts now have some degree of loft insulation (although the depth of insulation varies). Since the 1970s, the percentage of houses with some degree of double glazing also increased very substantially, to 96% in 2016 (Figure 6.11), although this does necessarily imply that all windows are double glazed. The percentage of houses with some degree of cavity wall insulation increased from close to zero in the 1970s to 69% in 2016 (Figure 6.11). Solid wall insulation, which is expensive and ‘hard to treat’, has been limitedly applied, however. While the diffusion rates of these insulation techniques are impressive, these have often been applied in piecemeal fashion rather than with a whole-house approach, which presents significant limits as to the efficiency improvement potential.
Average heat loss per dwelling in W/°C

Diffusion of different home insulation measure in UK homes, 1976–2018

The number of UK dwellings has increased steadily to 28.9 million in 2018 (Figure 6.12). Between 2014 and 2019, 1,095,870 new dwellings were built (Figure 6.15), representing a 4% building stock increase. Most UK homes are owner-occupied (outright owned and owned with mortgage). Social renting (from local authorities or housing associations) has declined strongly since the 1980s’ Right to Buy policy (Figure 6.12).Footnote 4 Private renting has increased steadily since the turn of the century. Penetration rates of insulation measures vary greatly according to tenure type, with privately rented homes ranking poorer on average. Privately rented homes are less likely to benefit from cavity wall insulation, loft insulation, or double glazing (Figure 6.13), owing to split incentives problems.Footnote 5
Total number of UK dwellings (in millions) and per tenure category, 1980–2018

Insulation measures in English houses by tenure, 2010 and 2019

The deployment of incremental insulation measures in the existing building system (Figure 6.11) helped to reduce heat demand from the early 2000s (Figure 6.6) and contributed to decreasing greenhouse gas emissions from UK buildings (Figure 6.2). Most of the thermal efficiency improvements have, so far, been piecemeal and incremental rather than leading to radical changes in building methods or building stock (e.g., whole-house retrofits). They have also focused on relatively easy and inexpensive measures (so-called low-hanging fruits). This means there is still large potential for further thermal insulation improvements as the government also noted in 2013: ‘There are hardly any homes with no insulation, but more than two thirds of the stock still has insufficient insulation by modern standards’ (DECC, 2013b: 51). Nevertheless, recent policy changes, which are further discussed in Section 6.3.3, have made this problem more acute because they led to a collapse in delivery rates of key insulation measures (Figure 6.14).
Delivery rates of key insulation measures in UK houses, in millions of installations

Since the late 1960s, the housebuilding sector has also experienced substantial decreases in the number of new homes that have been built (Figure 6.15). This is particularly due to major declines in social housing construction by local authorities and a slump in private enterprise construction after the 2008 financial-economic crisis (Figure 6.15), which only recently has begun to recover. These trends helped to create serious housing shortages and limited the role of the public sector in driving low-carbon innovation and renovation. The houses that were built in the past decade do not meet high insulation standards, which not only suggests that the housing crisis has been a more pertinent issue than climate change but also that future adjustments may be needed: ‘Since the Climate Change Act was passed, nearly two million homes have been built that are likely to require expensive zero-carbon retrofits and have missed out on lower energy bills’ (CCC, 2020: 19).
Number of permanent dwellings completed, by sector, United Kingdom, 1949–2019

6.3.2 Actors
Housebuilding Sector: The UK housebuilding sector is diverse and includes contractors, developers, architects, builders and engineers, and many suppliers of specialised materials (e.g., doors, windows, insulation, construction materials). The UK house building sector is economically substantial (Table 6.3).
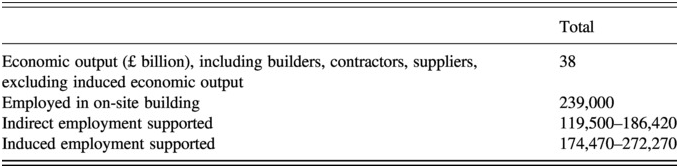
The sector is dominated by volume housebuilders, who minimise risk and maximise profit margins through the use of Standardised Design and Production Templates and the contracting out of physical construction to local builders (Barlow, Reference Barlow1999; Lees and Sexton, Reference Lees and Sexton2014). In 1960 the top 10 housebuilders accounted for about 9% of all new housing production. By 2004 this had increased to 46% (Archer and Cole, Reference Archer and Cole2014). By 2015 large housebuilders (building over 2,000 units per year) had increased their market share to 59% (DCLG, 2017). This increasing concentration in the sector has enhanced the economic and political power of large housebuilders, who also make large profits through ‘land banking’, which is the practice of buying land and getting planning permission but then delaying actual construction to benefit from increasing land prices (Ryan-Collins et al., Reference Ryan-Collins, Lloyd and Macfarlane2017). The structural power of large private housebuilders also increased because of changing market structures, particularly the virtual collapse of local authority commissioned buildings since the 1970s (Figure 6.15), which increased the influence of the private sector.
When building regulations started to address energy saving in the mid-1990s (Raman and Shove, Reference Raman, Shove and Fineman2000), most volume housebuilders took a compliance-only approach, focused on incremental changes that stayed within the Standardised Design and Production Templates (Lees and Sexton, Reference Lees and Sexton2014). Only a few incumbents (e.g., George Wimpey Ltd., Crest Nicholson) experimented with low-energy innovations in the early 2000s, but the experiences did not lead to strategic reorientation or commitment. Measures to reduce energy demand continued to be viewed as an add-on to existing practices rather than encouraging a change in building design (Smith, Reference Smink, Negro, Niesten and Hekkert2007).
When, in 2006, the Labour government introduced the Zero Carbon Homes (ZCH) target (which would see all new homes zero-carbon by 2016), housebuilders responded in two ways. On the one hand, they more seriously started to explore radical technical house designs that would be needed to meet this target. Several incumbent firms investigated the possibility of building to the Passivhaus standard, while others (e.g., Barratt, Stewart Milne) worked with the Building Research Establishment on test houses that met the highest level of the Code for Sustainable Homes (CSH) (Lynch, Reference Lowes, Woodman and Speirs2014).Footnote 7 The industry also funded the Zero Carbon Hub (created in 2008), which engaged in research and technical demonstration, provided advice, hosted events to create forums for discussion, and aimed to strengthen coalitions between industry and government. These learning processes and coalition building efforts were relatively weak, however, and did not generate widespread commitment in the housebuilding sector (Heffernan et al., Reference Heffernan, Pan, Liang and de Wilde2015).
On the other hand, the industry mounted a sustained counter-lobby, which by 2011 succeeded in the watering down of the definition of ‘zero-carbon’, and by 2015 succeeded in the removal of the ZCH target altogether (Gibbs and O’Neill, Reference Gibbs and O’Neill2015). One reason the industry’s lobbying activities succeeded was that the Conservative-Liberal Democrat coalition (2010–2015) and the Conservative (post-2015) government felt less committed to the Labour government’s target. Another reason is that the 2008 financial-economic crisis and subsequent recession and austerity politics changed the economic and political priorities, leading to more concern about growth, business profitability, and reducing regulatory constraints: ‘While the government wanted to speed up house building amid concerns about housing affordability and economic recovery, the ZCH agenda was viewed as a threat to productivity rather than an opportunity to place the UK at the forefront of green building and retrofitting’ (O’Neill and Gibbs, Reference O’Neill and Gibbs2020: 126). Aligning their lobbying strategies to these changed political concerns, ‘industry actors like the Home Builders Federation, as well as some large-scale house-builders, took advantage of an opportunity to attack and unpick the ZCH agenda’ (O’Neill and Gibbs, Reference O’Neill and Gibbs2020: 126). A third reason is that the housing crisis increased the dependency of the government on housebuilders to build more homes. The building industry used this structural dependency to push for scrapping the ZCH (Edmondson et al., Reference Edmondson, Rogge and Kern2020).
Reluctance to engage with the low-carbon agenda characterises not only volume housebuilders but also smaller building firms, contractors, and suppliers who mostly lack the required competences, skills, and building templates. A low-carbon transition in housing would thus require extensive retraining, particularly in support of more energy efficient building and retrofitting (Martiskainen and Kivimaa, Reference Martiskainen and Kivimaa2019), as well as a unified framework for standard setting, monitoring, and enforcement of quality improvements (e.g., insulation) (Bonfield, Reference Bonfield2016).
There are a few organisations that promote the development of low-energy skills and buildings, but these operate mostly at the fringes of the industry. The Association of Environmentally Conscious Building (AECB), for instance, brings together contractors, trades people, architects, and builders to help develop, share, train, and promote sustainable building best practices. The UK Green Buildings Council also promotes greener approaches in the construction sector and lobbies the government to prioritise energy efficiency in buildings. The Energy Saving Trust provides information about low-emission retrofitting standards and practices. And the Zero Carbon Hub, which was disbanded in 2016, developed and disseminated knowledge and information regarding low and zero-carbon new homes.
Policymakers: Housing and housebuilding relate to different policy competences and responsibilities. The Ministry of Housing, Communities & Local Government (MHCLG), formerly the Department for Communities and Local Government (DCLG), has responsibilities for ensuring the safety and quality of buildings (e.g., through regulations and building standards) as well as for driving up housing supply and increasing home ownership. The UK has been characterised as a ‘property-owning democracy’ (Daunton, Reference Daunton1987): home ownership has been an explicit policy goal since the Thatcher government, with a range of policies to encourage user demand (e.g., Right-to-Buy, shared ownership).
Environmental, energy, and climate change issues in relation to buildings are responsibilities of other ministries, for example, DEFRA, DECC, BEIS.Footnote 8 BEIS also aims to drive innovation and improvements in the construction business, notably by encouraging the long-term development of suitable supply chains and skills. Local authorities built many houses in the 1950s and 1960s but their active contribution to construction has shrunk greatly since then (Figure 6.15). One of their main current roles is to inspect new homes to ensure that they meet building regulations and standards.
These split responsibilities not only create coordination challenges but also mean that energy and climate change issues have been layered on top of the Housing Ministry’s core remit. Building regulations and standards are an important policy instrument in the building sector, enabling the coordination of many dispersed actors. Building regulations historically focused on health, safety, and materials. Energy saving was added as an additional consideration in the mid-1990s (Raman and Shove, Reference Raman, Shove and Fineman2000), leading to gradual inclusion of incremental insulation measures in new buildings. Successive energy savings obligations on energy suppliers (further discussed in Section 6.3.3) also led to piecemeal retrofits and incremental insulation measures in existing buildings in the 1990s and 2000s. The 2013 Green Deal policy, which was meant to further accelerate the implementation of housing retrofits, was poorly designed and led to a collapse in the installation of key insulation measures (Figure 6.14), as will be further discussed in Section 6.3.3.
The 2006 Zero Carbon Homes (ZCH) target was a radical top-down policy that was meant to drive more radical low-carbon innovation in new homes. But this policy was first watered down in 2011 and then scrapped in 2015, because of industry counter-lobbying and changing political priorities (due to the financial-economic crisis and changes in government), as discussed previously.
These developments suggest that policymakers (have come to) perceive other issues as more important than climate change. These other issues include the limited supply of new buildings (which underpins the housing shortage crisis), limited availability of affordable housing (affecting younger generation), low quality of (many) new houses, and limited innovativeness in the construction sector. The weakening commitment of policymakers to climate change mitigation has led to less ambitious policies since the mid-2010s, which are presently not driving a low-carbon transition in housing: ‘Policies to support low-carbon measures have been weakened or withdrawn, including Zero Carbon Homes and the Code for Sustainable Homes. This has led to many new homes being built only to minimum standards for water and energy efficiency’ (CCC, 2019b: 11).
Users: Since the 1970s, people have gradually installed piecemeal insulation measures in their homes (Figure 6.11). For people with relatively low incomes, millions of insulation measures have been the result of government policies that required energy suppliers to make energy efficiency improvements in people’s homes (further discussed in Section 6.3.3). Non-subsidised insulation and retrofit decisions have been motivated by household interests in improved thermal comfort, long-run energy cost savings, environmental benefits, addressing immediate problems (draughts, condensation, air quality, health), increased property value, and improved aesthetic appearance (for an excellent summary see Wilson et al. (Reference Wilson, Crane and Chryssochoidis2015)). But these motivations are not pertinent for all households, particularly not for low-income groups and non-homeowners.
Additionally, people may refrain from efficiency measures because of a range of barriers or concerns, including limited interest in energy or environmental issues, lack of money to pay upfront costs (or high interest rates on loans), uncertainty about benefits (e.g., cost savings, improvements in comfort, or health), concerns about contractor reliability and quality, fear of disruption caused by building works, information search costs, cognitive burden to process specialist information, or fear of time-consuming or frustrating dealings with builders or contractors (Wilson et al., Reference Wilson, Crane and Chryssochoidis2015).
This multitude of barriers, which include but go beyond financial ones, helps explain why ‘there are numerous, cost-effective measures that could be installed in many, if not most, houses, but the building owners are not putting them in’ (Boardman, Reference Boardman2007: 41). The balance of motivations and barriers varies significantly across type of insulation measures, type of house, type of household, and type of occupancy. With regard to the latter, private tenancies (19% of the UK housing stock) offer the least motives for efficiency refurbishments due to the principal-agent problem (it is the tenant, not the landlord, who would reap the benefits of investment).
Wider Publics: Environmental movements and NGOs have long advocated for more attention to energy efficiency. National Energy Action, the Green Alliance, and WWF, for instance, have lobbied for more ambitious policy action, while the Association for Environment Conscious Building (AECB), which represents sustainable construction professionals in the UK, has lobbied for the adoption of more ambitious low-carbon home delivery targets and standards. It runs its own self-certification scheme for newbuilds, largely in line with the German PassivHaus standards.
Thermal improvement and comfort also relate to issues such as energy poverty, decent living conditions, and health benefits (Martiskainen and Kivimaa, Reference Martiskainen and Kivimaa2019), which have been recognised as a particular form of social inequality and injustice. Low-energy housing can significantly reduce energy bills, improve thermal comfort, and improve indoor air quality if combined with appropriate ventilation (Chenari et al., Reference Chenari, Dias Carrilho and Gameiro da Silva2016). Several NGOs have advocated energy poverty issues in the UK, such as National Energy Action, the National Right to Fuel Campaign, the End Fuel Poverty Coalition, and the Centre of Sustainable Energy. Other campaigns have been oriented towards information and emergency assistance, such as Beat the Cold, the Big Energy Saving Network, Citizens Advice, or the Energy Saving Trust.
Civil society organisations have also led energy poverty projects such as the Warm Homes for Health project that installed double glazing in social housing in Sunderland; the Warm Zones programme that provided advice and subsidies for household insulations in specific areas; or Green Doctors, who offer simple energy-efficiency measures (e.g., draught-proofing) and advice to energy poor households across London.
6.3.3 Policies and Governance
Formal Policies
Incremental building improvements have been stimulated by a range of policies since the mid-1990s. Part L of the Building Regulations (which relate to conservation of fuel and power) were tightened in 1995, requiring new buildings to meet higher insulation standards. This was complemented by the introduction in 1995 of the Standards Assessment Procedure, which allowed the energy performance of homes to be measured and compared (Mallaburn and Eyre, Reference Mallaburn and Eyre2014). Three successive Energy Efficiency Standards of Performance programmes (1994–1998, 1998–2000, 2000–2002) further required energy suppliers to meet increasing energy-saving targets by making improvements in people’s homes, which were mostly met through insulation measures.
The 2002 European Energy Performance of Buildings Directive (EPBD) increased regulatory pressures, setting minimum energy performance standards for new buildings and requiring owners or landlords to provide Energy Performance Certificates (EPC) when selling or renting existing buildings. UK policymakers introduced EPCs in 2007 (with Energy Efficiency Rating ranging from G to A+++) to provide information to users. The Energy Efficiency Commitments (EEC), the Carbon Emissions Reduction Target (CERT), and the Community Energy Saving Programme (CESP) were further programmes that placed energy savings obligations on energy suppliers, which between 2002 and 2012 led to the installation of millions of insulation measures in existing homes (Table 6.4), focusing particularly on disadvantaged customers.
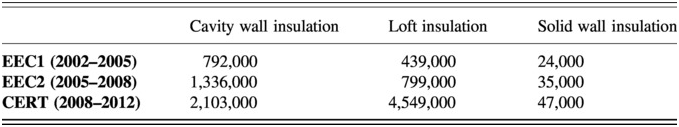
Although these policies stimulated incremental, piecemeal improvements in new and existing buildings, they substantially contributed to reduced heat loss in buildings (Figure 6.10) and reduced greenhouse gas emissions in the 1990s and 2000s. The number of annual insulation improvements collapsed in the 2010s (Figure 6.14), because the Energy Company Obligations (ECO) and the Green Deal policies, both introduced in 2013, were weaker and poorly designed: ‘Insulation rates fell very significantly after installation programmes (i.e., CERT and CESP) ended in 2012, with the replacement obligation (ECO) less ambitious than its predecessors and the Green Deal failing to deliver’ (CCC, 2019a: 84).
The Green Deal, in particular, was a major failure, because it was introduced as the government’s flagship policy to drive a mass rollout of low-energy housing retrofits. The Green Deal was a finance-based energy efficiency policy that deviated substantially from the previous regulatory approach (e.g., energy savings obligations, building regulations). It aimed to stimulate the use of private finance through a pay-as-you-save finance mechanism (in which households would pay back loans with money saved on energy bills). The Green Deal failed because the loan interest rate was too high, because the marketing campaign only emphasised financial savings (and ignored the multitude of other user barriers or motivations), and because policymakers failed to listen to critics and make adjustments (Rosenow and Eyre, Reference Rosenow and Eyre2016): ‘The Green Deal too suffered from a lack of flexibility after initial poor design, which was heavily criticised at the time’ (CCC, 2020: 99).
To stimulate radical innovations and drive a low-carbon transition, the government introduced the Zero Carbon Homes plan in 2006, which mandated that all new buildings from 2016 would be carbon-neutral or -negative (Kern et al., Reference Kern, Kivimaa and Martiskainen2017). This was a radical top-down policy that was introduced rather suddenly, without much consultation. The ZCH-plan was accompanied by the 2006 launch of the Code for Sustainable Homes (CSH), which was a voluntary certification scheme that included performance measures for energy, CO2 emissions, and other sustainability indicators, as part of a commitment towards 100% zero-carbon homes for newbuilds by 2016 (Heffernan et al., Reference Heffernan, Pan, Liang and de Wilde2015). The Code had six levels, with Code 1 representing a 10% energy efficiency improvement over the 2006 building regulations, while Code 6 referred to zero carbon homes.
Policymakers hoped that the ZCH-target, increasingly stringent Building Regulations, and voluntary standards would encourage reorientation of incumbent housebuilders (O’Neill and Gibbs, Reference O’Neill and Gibbs2020). To support this reorientation, the government also helped to create the Zero Carbon Hub (which was primarily funded by industry actors) to investigate, test, and demonstrate various zero-carbon options and create a platform for discussion and network building between industry and government (Edmondson et al., Reference Edmondson, Rogge and Kern2020). As discussed in Section 6.3.2, some housebuilders did indeed start exploring more radical low-carbon building options. But most industry efforts focused on political lobbying, which strategically aligned with changing political priorities in the early 2010s, leading to dilution of the ZCH-target in 2011 and its dismantling in 2015.
The suddenness of policy changes (which characterised both the introduction of the ZCH-policy and its removal) has been characterised as a major policy shortcoming (CCC, 2020). The limited effort to build stakeholder support has also been identified as a weakness:
The creation of the Zero Carbon Hub Task Force may have been intended to create a coalition to support a green building transition, but governments failed to build strong alliances with those groups such as the Royal Institute of British Architects and the Association of Environmentally Conscious Building, which could have supported the policies.
The failures of the Green Deal, Energy Company Obligation, and Zero Carbon Homes policy have left UK housing policy without effective low-carbon policy for new and existing homes. The 2018 progress report from the Committee on Climate Change therefore rightly concluded that: ‘Energy efficiency must urgently be improved across the building stock. Current policy is failing to drive uptake, including for highly cost-effective measures such as loft insulation. Policy needs to incentivise efficient long-term investments, rather than piecemeal incremental change’ (CCC, 2018a: 85). And its 2019 progress report further assessed that: ‘The progress made on buildings remains insufficient … In order to go further to meet net-zero ambitions, bold and decisive action is urgently needed from Government’ (CCC, 2019a: 67).
The 2018 Construction Sector Deal, which was developed together with the building sector, mentions energy-efficient homes in passing, but overwhelmingly aims to ‘transform the sector’s productivity through innovative technologies and a more highly skilled workforce’ (p. 3). BEIS’s heat-oriented clean growth plan (BEIS, 2018a) includes a Buildings Mission that aims to halve the energy use of new buildings by 2030. It also refers to £170m of public money to back the mission, which the government hopes will be matched by £250m of private sector investment (BEIS, 2018a: 110–111). Further operationalisation of this mission-oriented policy is still lacking, however. In its 2019 Spring statement, the government mentioned a Future Homes Standard by 2025 with a possible zero-carbon target for new homes. The technical specifications for the standards are expected to be ready for public consultation in 2023, legislation in 2024, and implementation in 2025. It remains to be seen, however, if this standard will indeed be adopted and what complementary policies will be advanced to reach it.
Governance Style
In terms of governance style, low-carbon building policy has largely been characterised by a satisficing approach to efficiency performance improvements, primarily driven by standards and sporadic demand-side incitation measures. This has delivered incremental but insufficient efficiency improvements, which have not substantially reconfigured the housebuilding sector. Policies supporting low-carbon building and retrofit measures in the UK are therefore not currently set to reach decarbonisation and net-zero objectives.
Until the early 2010s, the governance style largely rested on regulation (such as energy savings obligations and mandatory performance standards for buildings), which delivered incremental efficiency improvements through isolated insulation measures.
More recently, however, efforts to drive innovative housebuilding and retrofitting techniques have failed to deliver, for a range of reasons including lack of consistency over time (e.g., shifting priorities, policy termination), lack of consistency across interventions (e.g., fragmented or single instrument approach), and lack of coordination between policy competences (e.g., BEIS, Treasury, MHCLG), leading to conflicting objectives.
While a more hands-on approach may be needed, the sector is still characterised by a governance style oriented towards regulation and standards, which are presently not stringent enough to drive ambition and have major loopholes (particularly regarding the existing housing stock) due to significant industry influence and counter-lobbying. Low-carbon building and retrofitting has not entered the mainstream of the housebuilding and renovation sector; it lacks dedicated innovation, skilling, and large-scale market roll-out policy components.
6.4 Niche-Innovations
Radical niche-innovations have emerged and to some extent diffused within the heating and buildings systems. This section first provides a general discussion of developments that affect most niche-innovations. The subsequent sections discuss five niche-innovations for heating (heat pumps, biomass heating, solar thermal heating, heat networks, and gas grid repurposing to hydrogen or biomethane) and two for buildings (passive house designs, whole-house retrofits). For each niche-innovation, we first analyse techno-economic developments and then actors and institutions.
Techno-Economic Developments: Although renewable and low-carbon heat technologies have developed quite steadily in a number of European countries (notably Sweden and Denmark), their diffusion in the UK has remained limited.
Although many technologies can be considered “mature” globally, the UK market in low-carbon heat technologies is only just emerging. This is due to the dominance of the gas boiler market driven by the wider availability of natural gas. Low carbon heat technologies remain niche, either because the target market is small or due to immature supply chains and low customer awareness.
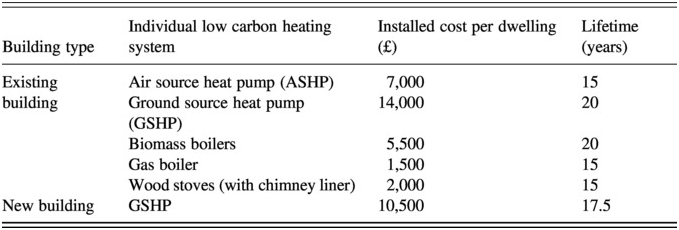
There are significant differences in the installation and equipment costs of various domestic low-carbon heating systems (Table 6.5). The upfront capital costs of heat pumps and biomass boilers are significantly higher than gas boilers, which cost between £500 and £2,500, depending on size, brand, and type. Table 6.5 suggests that 1) heat pumps and advanced biomass boilers involve substantial upfront capital costs, 2) within heat pumps, GSHPs are considerably more expensive than ASHPs, 3) installing GSHPs in new buildings presents important cost savings (over installations in existing buildings).
The various niche-innovations also have different technical characteristics, which means that a low-carbon transition in heat and buildings may well lead to a more diverse overall system.
Heat pumps (Section 6.4.1) require more space than gas boilers and may thus be especially suitable for large, sub-urban houses and off-grid locations.
Heat networks (Section 6.4.5) are more suitable in locations with concentrated heat use (i.e., dense urban areas, tower-blocks, industrial/commercial applications). While they enable significant efficiency gains due to scale advantages accruing from collectivisation, their low-carbon nature is not automatic as it depends on the fuel source (which is presently mostly gas).
Biomass heating (Section 6.4.2) is mostly used as add-on technology in the living room, where people like to enjoy a cosy fire when they relax. Exhaust of particulate matter is, however, contributing to air pollution problems in dense residential areas, leading to increased policy concerns. They are different from advanced biomass boilers, which can be used as primary heat source with high efficiency ratios but are also more expensive.
Gas grid repurposing towards low-carbon energy carriers (e.g., biomethane or hydrogen) makes use of the existing infrastructure (Section 6.4.4).
Low- to zero-carbon housing relates to new building and renovation techniques focussed on radically improved insulation, ventilation, heat exchange innovations, as well as general design principles. While newbuilt zero-carbon housing (Section 6.4.6) enables the applications of such principles to design and delivery, whole-house retrofits (Section 6.4.7) are important because they apply to the existing building stock, which is the vast majority of UK housing.
Since 2007, the uptake of renewable heat technologies has increased to a non-negligible portion of heating in combined sectors (residential, public administration, commercial) (Figure 6.16). Domestic wood combustion is the largest category, but heat pumps and biomass have also started to diffuse more substantially since 2014. Most heat pump deployment, however, has been in the commercial rather than the domestic sector. Regardless of end use and sector, renewable heatFootnote 9 made up just over 9% of overall heat use in 2019 (BEIS, 2020a: 106; Figure 6.16). Despite this rapid deployment, GHG emissions have still grown between 2014–2019 (Figure 6.2), because of increased heat demand (Figure 6.6) consistent with a growing number of heated dwellings (Figure 6.12) and because these renewable sources are not all low-carbon.
Renewable sources to generate heat (all sectors) in kilotons oil equivalent, 1990–2019

Policies: Since the 2008 Climate Change Act, radical niche-innovations have been central in strategic policy visions on long-term transition pathways. The content of these visions changed several times, however, which created deep uncertainties (Winskel, Reference Winskel, Hawkey, Webb, Lovell, McCrone, Tingey and Winskel2016). Initial views, articulated in the Low Carbon Transition Plan (DECC, 2009), 2050 Pathway Analysis (DECC, 2010), The Fourth Carbon Budget analysis (CCC, 2010), and Carbon Plan (DECC, 2011b), primarily emphasised a transition towards electric heat pumps, as part of the wider ‘all-electric society’ vision (in which first the electricity system would be decarbonised and then heat and transport would be electrified through heat pumps and electric vehicles). Winskel (Reference Winskel, Hawkey, Webb, Lovell, McCrone, Tingey and Winskel2016) suggests that: ‘The “all electric” vision for UK energy transition that emerged from these early scenarios was a rather simple blueprint, based on limited techno-economic research and modelling capacities which neglected many social, institutional and behavioural issues’.
Further analyses of the barriers for electric heat pumps (e.g., lack of installer skills, lack of space in dense urban areas, limited user confidence) and better understanding of potentials of other options led to revised visions a few years later. The Future of Heating: A Strategic Framework for Low Carbon Heat in the UK (DECC, 2012d) and The Future of Heating: Meeting the Challenge (DECC, 2013b) envisaged a smaller role for heat pumps than before and a more prominent role for heat networks. While both documents also identified an important transitional role for hybrid heat pumps (using gas and electricity), they envisaged that natural gas boilers would be phased out by 2050. Although some of the modelling still suggested a dominant role for heat pumps by 2050, the overall strategic vision of both documents involved a more diversified range of heat technologies than before.
A few years later, the strategic vision changed again. Both the Clean Growth Strategy (BEIS, 2017b) and its dedicated heat application (BEIS, 2018a) identified not only heat pumps and heat networks as possible low-carbon options but also the decarbonisation of gas grids by substituting natural gas with hydrogen or biomethane. This addition was partly the result of lobbying from gas industry actors (Lowes et al., Reference Lovio and Kivimaa2020), who worried that a low-carbon transition to heat pumps and heat networks might threaten the gas grid. The changing and diversifying visions reflected and created deep uncertainties, leading policymakers to conclude that ‘at present it is not certain which approaches or combination of them will work best at scale and offers the most cost-effective long-term answer. Decarbonising heat is our most difficult policy and technology challenge to meet our carbon targets’ (BEIS, 2017a: 75). The uncertainties and weak policies also hindered industrial and market development in the low-carbon heat sector, jeopardising decarbonisation ambitions (CCC, 2018a; Li and Pye, Reference Levinthal2018; Rosenow and Eyre, Reference Rosenow and Eyre2016).
To stimulate radical niche-innovations, the government introduced the Renewable Heat Incentive (RHI) in 2011, which provided subsidies for the installation of renewable heat technologies in non-domestic buildings. In 2014, the RHI was extended to domestic buildings, which stimulated demand for heat pumps, solar thermal, and biomass systems (Figure 6.17). The spike in 2014 and 2015 was caused by a large volume of ‘legacy applications’, which are RHI applications for systems that were installed between 2009 and 2014. RHI qualification criteria were adjusted after the 2015 Spending Review, leading to the introduction of a spending cap, new sustainability criteria that had to be met (especially for biomass), and a more restricted focus on strategically important technologies such as heat pumps and biomethane. Annual RHI-funded heating systems remained relatively stable after the initial legacy-induced peak, leading to steady growth of cumulative installations. Annual RHI-funded installations markedly increased from 2018, especially of pumps, which reached 21,500/year in 2019 (Figure 6.17). Subsidy levels for the RHI have fluctuated over time, according to policy priorities (Figure 6.18).
Quarterly (left-hand Y-axis) and cumulative (right-hand Y-axis) accreditations (new and legacy) of low-carbon heating installations under domestic RHI (number of installations).

Variations in domestic RHI subsidy levels between 2015 and 2020 (p/kWh), adjusted by the Retail Price Index (RPI) before 1 April 2016 and by the Consumer Price Index (CPI) thereafter

According to recent government proposal for the future of clean heat the policy priority is to ‘provide support for biomethane injection into the gas grid through the Green Gas Support Scheme and provide support for buildings technologies (heat pumps and in limited circumstances, biomass) through the Clean Heat Grant’ (BEIS, 2020b). The main instrument currently considered to support the deployment of low-carbon heating technologies in buildings is an upfront grant (as an alternative to a tariff-based mechanism) at a ‘technology-neutral, flat-rate grant of £4,000 for all technologies eligible under the Clean Heat Grant’ (BEIS, 2020b: 29) for all sizes of installation up to 45kW capacity, to be rolled out as a successor scheme to the domestic RHI from 2022.
In its consultation on ‘Future support for low carbon heat’, BEIS (2020b) spelled out some of the preferred technological options going forward, representing increased enthusiasm for heat pumps and biomethane, unchanged views of heat networks, and downgraded expectation for biomass and solar thermal:
Heat pumps ‘offer the greatest heat decarbonisation potential for the majority of buildings off the gas grid’ and ‘could enable us to almost completely decarbonise heat alongside the decarbonisation of electricity generation’ towards 2050 (BEIS, 2020b: 26–27)
Biomethane injection into the gas grid ‘accelerates the decarbonisation of gas supplies, by increasing the proportion of green gas in the grid. This transition is a necessary step towards meeting our carbon reduction targets’ (BEIS, 2020b: 11)
Heat networks ‘are expected to play a crucial role in the decarbonisation of heat’ (BEIS, 2020b: 42).
Biomass ‘although [it] has a wider strategic role to play in overall UK decarbonisation, its use in heating buildings should be limited’ (BEIS, 2020b: 27)
Solar thermal is no longer a priority, as ‘given current cost data and recent deployment trends, we do not have any strong evidence to suggest that supporting solar thermal water heating through this scheme would prove to be an effective measure for preparing supply chains for the future phase-out of high carbon fossil fuel heating’ (BEIS, 2020b: 40)
Most recently, the Government issued an Energy White Paper (HM Government, 2020a) and a Ten point Plan for a Green Industrial Revolution (HM Government, 2020b). The stated ambitions for domestic heating and buildings in these policy documents are to roll out 600,000 heat pumps per year by 2028, support the delivery of biomethane to 230,000 homes by 2030, initiate demonstration trials for hydrogen heating in selected locations from 2023, and work with Local Authorities to enable the designation of new heat network zones by 2025. The implementation means and policy specifications to deliver these objectives are expected to be articulated in the delayed Heat and Buildings Strategy.
In September 2020, the government launched the £2bn Green Homes Grant scheme as part of the 2020 COVID-19 stimulus package, which would release vouchers for up to £5–10,000 (depending on income) for home insulation and low-carbon heating installations in homes already fitted with at least one primary insulation measure. It included primary insulation measures (solid wall, under floor, cavity wall, loft, flat roof, room in roof, insulating a park home), primary low-carbon heat measures (air or ground source heat pump, solar thermal, biomass boilers), and a range of secondary measures (e.g., draught proofing, double/triple glazing, heating controls).
Subsequent implementation problems with administering and paying out vouchers led to concerns that the scheme would not deliver (Laville, Reference Laville2021). On 22 March 2021, the Environmental Audit Committee (2021: 27) provided a very critical evaluation of the implementation of the Green Homes Grant and its ability to deliver on retrofitting existing homes to higher efficiency levels:
The Green Homes Grant has been rushed in conception and poorly implemented. In its haste to create a scheme to deliver economic stimulus, the Government failed to consult industry adequately on its delivery, set a timescale which was overly short term and has presided over scheme administration which appears nothing short of disastrous. If the ambition for the scheme to retrofit 600,000 homes envisaged completion of the work by the end of the current financial year, then the Government has been wildly optimistic in its scheme planning and industry engagement. The impact of its botched implementation has had devastating consequences on many of the builders and installers that can do the work, who have been left in limbo as a result of the orders cancelled and time taken to approve applications.
A few days later, the Green Homes Grant was cancelled, owing to conflicting objectives between BEIS and the Treasury, which is indicative of a lack of policy coherence and coordination that further weakens supply chains and industry confidence (Institute for Government, 2021), and is ultimately detrimental to driving long-term heat decarbonisation.
Because of repeated problems and U-turns, there is substantial uncertainty about the upcoming Heat and Buildings strategy and the political desire and ability to develop visions and policy instruments that can deliver on decarbonisation and low-carbon heating deployment objectives.
6.4.1 Heat Pumps
Techno-Economic Developments
Heat pumps (HPs) are electrical or gas-powered devices that extract low-temperature heat from the ground, the ambient air, or even water (e.g., pond) to the desired heat sink (Greening and Azapagic, Reference Greening and Azapagic2012). HPs are a mature technology that requires more installation and operational space than gas boilers. They are therefore presently most suited for newbuilt homes and/or off-grid housing. HPs are relatively new to the UK context, which means that many socio-technical dimensions (e.g., supply chains, installation skills, user confidence, standards) are under-developed:
Heat pumps are an established solution in many other countries, but not yet in the UK. Establishing them as a mass-market solution will take some time, with strong progress required during the 2020s. There are particular opportunities in new-build properties, homes off the gas grid, non-residential buildings and for hybrid heat pump systems retrofitted around existing gas boilers.
Heat pumps are not only bulkier than gas boilers but also more expensive to buy and install. Total costs are between £6,000 and £11,500 for ASHPs and between £9,000 and £20,000 for GSHPs, with significant variation depending on size and complexity of installation (BEIS, 2018a). For this reason, HPs require significant support mechanisms and lower costs to be able to compete with gas.
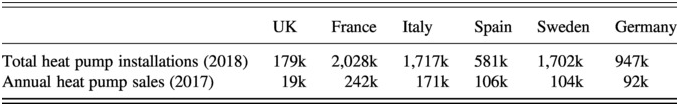
The UK market for heat pumps is small by European standards (see Table 6.6) but has somewhat increased since 2018 (Figure 6.17. Although annual sales have remained relatively small, the cumulative number of domestic HPs has gradually increased. A mass roll-out of heat pumps faces significant barriers related to cost (and incentive mechanisms), the adequacy of supply chains (i.e., scaling up production), skilled installer base (i.e., number of skilled installers, level of consistency, and adequate dimensioning), and user trust and demand.
Actors and Policies
Since 2009, government heat decarbonisation scenarios have envisaged important roles for heat pumps. Policymakers therefore tried to stimulate HP uptake with the Renewable Heat Incentive (RHI), which was introduced in 2011 for non-domestic buildings and extended to domestic buildings in 2014. The RHI subsidy for heat pumps varies according to type and size of heat pump, ranging from 18.8–21.16 p/kWh for GSHPs to 7.3–10.85 p/kWh for ASHPs (Figure 6.18). The actual eligible amount also varies on based on heat demand (itself depending on building size and insulation) and will range between £3,000–10,000 for ASHPs and £6,500–33,000 for GSHPs in different size houses over the eligible seven-year period, covering initial investment costs in most cases.
Under the currently proposed strategy for clean heat, the deployment scenario of the Clean Heat Grant aims for 12,500 new heat pump installations per year by 2024 (BEIS, 2020b: 18), which compares palely to the current 1.7 million yearly gas boiler installations (Rosenow and Thomas, Reference Rosenow and Thomas2020). According to the Energy White Paper, however, this objective has been significantly raised, with intentions to deliver 600,000 heat pumps per year by 2028, and an expected associated 20,000 new jobs (HM Government, 2020a). This objective is, however, unlikely to be met with current trends and policies, as it requires substantial investment as well as the rapid expansion of skills and supply chains.
On the industry side, the Heat Pump Association (www.heatpumps.org.uk) is supporting the tightening of building regulations for newbuilt homes towards greater efficiency requirements and the elimination of current loopholes. It is also keen to see the materialisation of the Future Homes Standard in 2025, the gradual tightening of emissions standards for heat in existing buildings, and the implementation of a successor scheme for the RHI, which is scheduled to end in 2021 but has been extended to March 2022 when it will be replaced by the Clean Heat Grant. If these policies materialise, the industry association says it is ready to drive a mass roll-out of heat pumps, first in newbuilt homes and off-grid retrofits from 2020 to 2025, and then in on-grid retrofits from 2025, to reach 1 million heat pump installations per year from 2030 (Heat Pump Association, 2019), which is more than the objectives set out in the 2020 Energy White Paper. This ambitious deployment trajectory would, however, require a rapid increase in the number of heat pump installers from the current 916 installers to roughly 40,000 by 2030 (Heat Pump Association, 2019), which is a challenge that requires dedicated skills and training programmes.
Additional challenges concern user engagement and acceptance, since HPs require greater user engagement: ‘Given the relative complexity of heat pumps compared to conventional heating systems, good technical support and advice for users is especially important’ (Caird et al., Reference Caird, Roy and Potter2012: 292). Another user obstacle is that HPs require additional space, notably for GSHP that require outdoor underground pipes and are hence more suitable for detached housing (Hannon, Reference Hannon2015).
On the positive side, heat pumps, if properly installed and operated, can improve levels of warmth and comfort in the home. Some, though not all, users may also enjoy a sense of empowerment from greater control over their own heat service provision:
Control and operation of a heat pump positions the user as participating in the provision of their own energy services and redefines their consumer role from “captive consumer” associated with a previous universal mode of service in multiple ways […], creating new possibilities for users not only to unwittingly collaborate in the reproduction of energy systems but to act as “co-providers” of energy services. Consumers turned “co-providers” are able to generate some of their own technological and institutional services.
6.4.2 Biomass Heating
Techno-Economic Developments
Biomass heating includes different types of fuel input (e.g., wood logs, pellets, or chips) and different kinds of appliances ranging from conventional wood stoves and room heaters (which are often used in combination with another heat source) to advanced biomass boilers, which are larger and costlier (around £5,500) and quite rare in the UK. Indeed, most UK domestic biomass heating uses conventional technology: ‘Currently around half of wood grown and used for heating homes in the UK is burnt on open fires (based on the 2014 domestic wood fuel survey), with most of the remainder consumed in wood-burning stoves’ (CCC, 2018b: 19).
Domestic wood combustion is the largest UK source of renewable heat (see Figure 6.16). While domestic wood combustion replaces some coal or oil-fuelled systems in rural, off-grid areas (Jeswani et al., Reference Jeswani, Whiting and Azapagic2019), it is mostly used as additional heat source for reasons of cosiness and ambience:
Today, comparatively few households burn solid fuel as a sole or primary heating source, yet 2.5 million households use open fires, enclosed stoves and range-ovens to heat their home to some degree […] Now relegated to a supplementary role, open fires and other “traditional” technologies are predominantly used for heating a single room in both on- and off-gas properties.
Traditional forms of biomass combustion are rather inefficient and in dense areas contribute significantly to air quality problems. More efficient domestic biomass heating applications involve the combination of technologies, such as in combination with hybrid heat pumps or in local district heating systems (CCC, 2018b).
The total number of domestic biomass stoves has been estimated at around 1 to 1.5 million, with annual sales under 200,000, while the market for biomass stoves with back boilers is estimated at under 20,000 yearly (AEA, 2012). About 13,000 homes use modern biomass boilers (CCC, 2018b). The diffusion potential in urban setting is limited because of air quality regulations and fuel storage limitations.
Actors and Policies
While most woodburning in the UK is currently for power generation and commercial applications, supply chains and actors partly overlap. The Wood Heat Association represents the modern wood heating trade in the UK, bringing together wood suppliers (e.g., wood logs, wood chips, wood pellets, straw, miscanthus), biomass boiler and stove installers, and so on.
Domestic wood burning is popular because it has significant cultural and aesthetic value in the British context. Indeed, cosiness, comfort, and aesthetic value are important explanations for the continued desirability and appeal of traditional biomass heating practices:
Often associated with a welcoming atmosphere, warmth, relaxation, comfort and cosiness; fireplaces, ranges and stoves are deeply valued in Britain and comparable Western contexts, precisely because they are symbols of homeliness […] Within this romanticised understanding of wood heating as part of home-making, the aesthetic and sensory qualities of the fire have been shown to be highly valued […]. As desirable home amenities, the aesthetic qualities of traditional wood-burning technologies – open fireplaces in particular – have been found to override considerations of energy efficiency when thermally retrofitting homes, as greater value is ascribed to the historical significance and appearance of the surrounds and mantelpieces.
Compared to other forms of domestic heating, wood burning requires significant user engagement including wood sourcing (or chopping if using on-site supply), storage, regular refuelling and stoking, stove cleaning (ashes and residues), chimney sweeping, and so on. This does not seem to dissuade people from biomass heating, which suggests that cultural appeal trumps practical considerations.
In recent years, biomass heating has come under significant public pressure, owing to concerns about local air pollution, carbon emissions (which are positive without reforestation efforts), biodiversity impacts from forest clearings, and competition with other land uses such as food production. In response to these concerns, policymakers reduced RHI subsidy levels for domestic biomass heating after 2015 (Figure 6.18). More generally, UK policymakers aim to limit domestic biomass heating unless it is the only possible alternative:
Although biomass has a wider strategic role to play in overall UK decarbonisation, its use in heating buildings should be limited, as the Committee on Climate Change (CCC) says, to maximise the overall carbon abatement that is possible from sustainable biomass. As far as it is proportionate to do so, we propose to introduce eligibility criteria so that biomass is not installed in individual buildings that would be suitable for a heat pump. We propose that support for biomass will not be permitted in urban areas.
Accordingly, only 700 domestic biomass heat installations are foreseen to be supported under the Clean Heat Grant scheme 2022–2024. These policy changes imply that the future potential for conventional residential biomass heating is limited and restricted to off-grid locations. Alternative biomass heating, such as with advanced biomass boilers or in the form of biofuels in suitable boilers, does present a legitimate option looking forward, but it is not a policy priority.
6.4.3 Solar Thermal
Techno-Economic Developments
Solar thermal systems come in different forms, but in essence absorb solar radiation, often in rooftop solar thermal collectors, and transfer the heat via linkages with conventional water or space heating systems (Greening and Azapagic, Reference Greening and Azapagic2014). Owing to uneven daily and seasonal solar radiation, such systems are usually combined with other heat sources. Water heating applications are most common, and the most vibrant markets are in Southern and Central European countries, although applications in higher latitudes are also technically possible.
Although solar thermal technology is a mature microgeneration technology, the UK market has remained small compared to other countries, with only 8.5 kWth per 1,000 inhabitants, while the EU28+ average is 69.2 kWth per 1,000 inhabitants (Solar Heat Europe, 2018). Solar thermal capacity has gradually expanded since the early 2000s, but annual installations and sales have declined significantly since 2011 (Figure 6.19), indicating that this has become a stagnant niche-innovation.
Diffusion of solar thermal in the UK, annual installed capacity, in m2

Actors and Policies
The post-2011 decline of solar thermal systems was largely due to the introduction of Feed-in-Tariffs (2010), which included attractive payments for domestic solar-PV electricity generation. Households subsequently chose solar-PV panels over solar thermal systems, because of much shorter paybacks on the former (Fiorentini, Reference Fiorentini2013). The revision of the RHI scheme at the end of 2015 generated further uncertainty, as it opened up the eligibility of solar thermal for discussion. Although RHI subsidies for solar thermal were maintained, and actually slightly increased (see Figure 6.18), the UK market remained very small, compared to other renewable heat technologies (see Figure 6.17) and compared to significantly more vibrant markets in European countries such as Austria or Greece (Solar Heat Europe, 2018).
Shrinking post-2011 markets negatively affected the installer base (McVeigh, Reference McVeigh2017). Nevertheless, UK manufacturing capacity remained strong, with notable global actors such as AES Solar (flat plate collectors), Kingspan (evacuated tube collectors), or Viridian Solar (integrated rooftop solar panels). The Solar Trade AssociationFootnote 10 promotes the development and deployment of solar energy in the UK (thermal and PV) and abroad. It successfully lobbied government for continued inclusion of solar thermal systems in the domestic RHI scheme (McVeigh, Reference McVeigh2017), and later under the Green Homes Grant scheme (2020), although these were not included in the prior consultation (BEIS, 2020c) and ex ante policy impact assessment (BEIS, 2020b).
6.4.4 Greening the Grid
Techno-Economic Developments
Recently, the repurposing of gas networks for biomethane or hydrogen injection has also been considered as a heat decarbonisation option. This is not only due to increasing recognition of technical, market, and user barriers for heat pumps in the UK context (CCC, 2016; Speirs et al., Reference Spaargaren, Cohen, Mol, Sonnenfeld and Spaargaren2018) but also relates to significant lobbying efforts by incumbent gas supply actors who aim to protect their sunk investments in the existing gas infrastructure (Lowes et al., Reference Lovio and Kivimaa2020). Decarbonised hydrogen and biomethane could both replace (fractions of) upstream natural gas supply but maintain the gas infrastructure, perhaps with some modification.
Decarbonised hydrogen can be produced from fossil fuels or biomass by steam reforming or gasification with carbon capture and storage (which is not yet commercially viable), or through water electrolysis using renewable electricity (which currently accounts for a small portion of UK hydrogen production) (Speirs et al., Reference Spaargaren, Cohen, Mol, Sonnenfeld and Spaargaren2018). The distribution of hydrogen, which has physical and chemical properties that differ from natural gas, would require modifications of gas pipelines, especially at higher concentrations. Unmodified gas pipelines do appear to be able to distribute hydrogen blends of 20% (Murray, Reference Murray2021). At the point of use, hydrogen-based heating would also require modification or replacement of heat appliances such as boilers, especially at higher concentrations.
Decarbonised hydrogen could become part of a hybrid heat decarbonisation strategy (e.g., as back-up for heat pumps in winter months) from 2030, but this would require a dedicated strategy (CCC, 2018c). At present, the hydrogen-for-heating niche does not exist commercially, but does have some presence in visions and through demonstration projects, which have multiplied in Europe over the past 15 years, with Germany leading the way and the UK playing a smaller role (Wulf et al., Reference Wulf, Linßen and Zapp2018). The UK-based H21 programme, launched in 2016, brings together a number of projects exploring the conversion of existing gas pipelines to carry 100% hydrogen. The H21 Leeds City gate project proposes to convert the local gas distribution grid to hydrogen by 2028, with the aim of serving 3.7 million properties in the wider surroundings by 2038 (www.northerngasnetworks.co.uk). In 2017, as part of H21, BEIS invested £25m in the four-year Hydrogen for Heat project (Hy4Heat), led by Arup and involving major industry players to explore the potential and feasibility of hydrogen gas for heating in the UK. This project includes an exploration of possible quality standards, certification, the development and testing of heating appliances, and demonstration facilities.
The injection of biomethane in existing gas grids does not require significant infrastructure modifications, and only minor repurposing of boilers, given that its physical properties are largely equivalent to natural gas. However, biomethane production is costly, potentially displaces land use and available biomass, and its net carbon emissions vary significantly according to conversion technology and biomass source. Biomethane can be produced from different feedstocks and processes (e.g., landfill gas, sewage sludge digestion, anaerobic digestion), and it can serve different kinds of uses (e.g., power, heat, transport, or gas grid injection), which means that intersectoral competition is likely, especially if supply is limited. Currently in the UK, the rapidly growing volume of energy produced from anaerobic digestion (biogas and biomethane) primarily supplies the power sector, while less than 10% is used for heat (DEFRA, 2020).
Biomethane grid injection was demonstrated in 2010 with biogas production from a sewage treatment plant in Didcot. Subsequent commercial scale application started in Dorset in 2012. Since then, biomethane use for heating has gradually increased. By 2017, 81 biomethane plants were accredited under the non-domestic RHI (HoP, 2017), 93 by 2019, and an additional 30 are expected by 2021 (Mieke Decorte et al., Reference Decorte, Tessens, Francisco, Repullo, McCarthy and Oriordan2020). Biomethane from anaerobic digestion has grown considerably in recent years, from a mere 0.2% of renewable heat generation in 2010 to 9.1% by 2019 (Figure 6.16). Landfill gas and sewage sludge digestion respectively accounted for 0.2% and 2.3% in 2019 (Figure 6.16). Total volumes, however, remain low compared to natural gas use and are unevenly distributed. In 2019, biomethane blending in the gas grid represented only 0.4% of total gas distributed, but can be as high as 12% locally in some parts of South-West England, notably North Gloucester, where significant production is concentrated (Regen, Reference Regen2020). CCC (2018a) suggests that raising the proportion of biomethane injection (up to 5%) pertains to cost-effective low-regrets options that should be pursued today. Higher levels of blending are currently limited by supply-side constraints, particularly the limited supply of wet feedstocks for anaerobic digestion and competition for other uses in the case of Bio-Synthetic Natural Gas (HoP, 2017).Footnote 11
Actors and Policies
The development of the UK greening-the-grid niche has been supported by multiple actors. The social networks are larger and denser for biomethane, which substantially contributed to low-carbon heating, than for hydrogen, which mostly exists through visions and demonstration projects.
Incumbent gas suppliers and distributors (including National Grid and regional operators) have strongly advocated and supported greening-the-grid options in recent years to protect their vested interests in the existing gas infrastructure. They have been successful in persuading policymakers to include these options in heat decarbonisation strategies (Lowes et al., Reference Lovio and Kivimaa2020). To defend the gas infrastructure from the threat of becoming a stranded asset in all-electric scenarios, these gas supply actors claim that the greening-of-the-grid is cheaper than a transition to heat pumps or heat networks. The evidence for these claims is spurious, given the significant technical, industrial, and cost uncertainties for both biomethane and hydrogen grid repurposing and alternative options (Speirs et al., Reference Spaargaren, Cohen, Mol, Sonnenfeld and Spaargaren2018).
Gas distributors are trying to develop the green gas market by offering ‘green gas’ tariffs to their customers, who would pay a premium price for gas that contains a percentage of green gas, mostly biomethane. The green gas tariffs, which are led by smaller energy suppliers, show significant variation in terms of proportions of green gas blend and price premiums (see Figure 6.20). To support this market construction strategy (and user confidence in it), the Renewable Energy Association (REA) introduced a Green Gas Certification Scheme that aims to guarantee the origin and quality of biomethane injected in the grid by distribution companies.Footnote 12 For future diffusion, the Energy Networks Association is advocating a cluster-based approach that prioritises biomethane grid injection or hydrogen delivery in regions with strong local supply chains (‘biomethane zones’ and ‘hydrogen zones’) (ENA, 2020a).
Green gas price premium versus blend percentage

Upstream producers of biomethane and hydrogen also support the greening-the-grid niche because of economic and industrial opportunities. The development and expansion of biomethane markets in the last decade has attracted actors from the agricultural and waste sectors (e.g., farmers, landfill site and sewage plant operators) who produce and process biomass resources, often from local supply chains. A rapid expansion of biomethane production projects (2014–2016) was followed by a period of market consolidation and a focus on scale economies and cost reduction (Mieke Decorte et al., Reference Decorte, Tessens, Francisco, Repullo, McCarthy and Oriordan2020). Scale increases were enabled by specialised investors such as Privilege Finance, which invested over £500m in the anaerobic digestion and biogas sector (ADBA, 2020). The UK presently has over 100 biomethane plants that supply into gas grids (ADBA, 2020), operated by about 65 biomethane supply organisations (GGCS, 2020).
The UK biogas industry is represented by two national associations (the Biogas Group and the Anaerobic Digestion and Bioresources Association ADBA), which lobby policymakers, organise knowledge circulation and transfer activities, and facilitate intra-industry dialogue. In 2017, ADBA developed an Anaerobic Digestion Certification Scheme (ADCS) to raise and harmonise industry practices, notably around operational, environmental, and health and safety performance.
The Energy Networks Association, which is ‘the voice of the [energy] networks’, has taken up an important advocacy role for a green gas future, relying on a combination of biomethane and hydrogen in on-grid areas. It has recently set out its vision and strategy to deliver ‘a 100% hydrogen network’ (ENA, 2020b). To support this vision, the current plan is to focus on large-scale 100% hydrogen pilots and up to 20% blending in parts of the network by 2030; scale up hydrogen pipelines between industrial clusters and roll out 100% hydrogen conversion for use in homes during the 2030s; and have a national hydrogen network in place in the 2040s (ENA, 2020b).
The government is more cautious about long-term hydrogen plans, highlighting that ‘exact mix of different end uses for clean hydrogen in 2050 will depend on a variety of factors including cost, availability and technical application’. Nevertheless, it aims for ‘5GW of clean hydrogen production capacity in 2030, equating to 42TWh, and supporting up to 8,000 jobs by 2030 across our industrial heartlands and beyond’ (HM Government, 2020a: 128). Collaboration with industry is an integral part of these plans.
Policymakers also support green gas as part of wider visions for the bioeconomy and the hydrogen economy. The European Commission’s bioeconomy strategy, issued in 2012 and updated in 2018, seeks to further develop bio-based sectors and deploy local bioeconomies across the whole of Europe by 2030. The UK has developed its own bioeconomy strategy (HM Government, 2018) to support the development of bio-based energy and materials, including biomethane supply. The European Hydrogen strategy has gradually emerged in recent years, but accelerated with COVID-related green recovery packages that led several European countries (Germany, France, Spain, UK) to announce billions of euros of investments in hydrogen production and use (Vivid Economics, 2021). While most of these hydrogen investments target transport and heavy industries, the UK strategy also aims to develop hydrogen for domestic heating purposes.
Policy support for green gas has changed over time. The 2012 Heat Strategy did not consider it a priority, stating that ‘Large-scale biomethane injection into the grid at a national level is not a realistic option, especially when efficiency losses are taken into account’ (DECC, 2012d: 53). Since 2014, however, biomethane production has qualified for support under the non-domestic RHI, leading to a relatively unexpected increase in production, which by 2018 accounted for 22% of renewable heat delivered by the RHI (Lowes et al., Reference Lowes, Woodman and Clark2019). The increasing political profile of and policy support for green gas is partly due to lobbying by energy suppliers and requests for more certainty concerning the long-term policy support mechanism (Richards and Al Zaili, Reference Richards and Al Zaili2020). In 2020, the government announced plans for a £150 million Green Gas Support scheme, which aims to further encourage biomethane injection into the grid, to be financed via a levy on gas suppliers.
Users have, so far, been limitedly involved. Most users do not notice that small amounts of biomethane are blended in their gas supplies, and active demand (through the uptake of green gas tariffs) is still small. Hydrogen is not yet commercially used in heating, but there is the potential for social acceptance problems over safety concerns (e.g., explosions, odourless leakage). Users may also be reluctant to replace appliances such as combustion boilers in order to use hydrogen for heating.
6.4.5 Heat Networks
Techno-Economic Developments
There are two types of heat networks: communal heat networks that serve multiple customers in one building (e.g., a flat) from a central gas boiler or heat pump in the basement, and district heating (DH) systems that use more extensive heat distribution infrastructures to serve multiple buildings (e.g., houses, schools, hospitals, office blocks), often in areas with dense heat demand such as city centres. While heat networks cover substantial parts of heat demand in many European countries (e.g., Austria 22%, Germany 14%, Denmark 70%, Finland 49%, Sweden 50%), they only cover 2% in the UK (BEIS, 2018a; DECC, 2012d).
UK heat networks have a long history and saw rapid growth in the 1960s and 1970s, owing to four kinds of deployment: a) in private sector tower blocks (mostly small communal schemes), b) single-owner hospital and university campus estates (medium-size DH), c) social housing blocks (medium-size DH), and d) several larger local authority-led schemes in cities and towns such as Woking, Sheffield, Southampton, and Aberdeen (Karvonen and Guy, Reference Karvonen and Guy2018). Heat network deployment slowed down in the 1980s and 1990s due to energy market liberalisation and the penetration of domestic gas-based central heating. Deployment increased somewhat in the 2000s and 2010s but remained constrained by various barriers (DECC, 2013b).
In 2015, there were 11,908 communal UK heat networks and 2,087 district heating systems. The former provided 7,074 MW heating capacity and the latter 12,288 MW. The majority (90%) of all these systems used natural gas feedstocks (data from BEIS Heat Network Statistics, 2018, tables 1, 4, 5). Other fuel sources are electricity (5%), bioenergy and waste (2%), oil (1%), and coal and unknown (2%).
Heat networks have three main cost components related to: a) installing or adjusting heat interface units in the building, including heat meters, b) creating a heat pipe infrastructure, and c) installing and operating heat generation technology. Building the pipe-infrastructure is the largest cost component (Leveque and Robertson, Reference Lees and Sexton2014), which can be very substantial for district heating systems. The Greater London Authority (GLA, 2014) estimates that large-scale DH-systems, which may involve several tens of kilometres of heat pipe supplying 100,000 customers, can have infrastructure capital costs of £100 million or more. Medium-sized DH schemes (e.g., the Olympic Park and Stratford City project), which can support up to 20,000 homes, public buildings, and commercial users, can cost between £10 and £100 million.
Costs per dwelling can vary by a factor of four, depending on housing density and heat network configuration (Table 6.7). Heat networks for high-rise apartment blocks, which have high housing densities, are the most cost-effective. Costs per dwelling are highest for (semi)detached houses because these require longer pipe infrastructure.
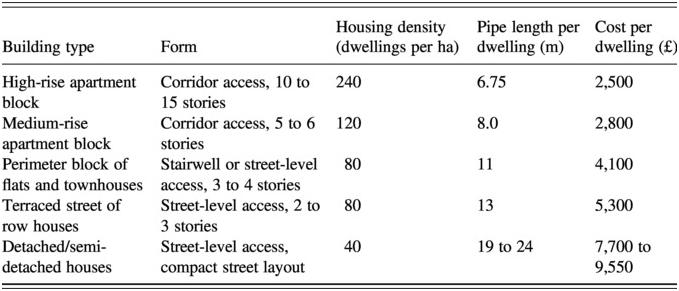
At an aggregate level, DECC (2013a) estimates that heat networks can be cost-effectively applied in areas with heat demand density greater than 3 MW/km2. DECC (2013a) further estimates that about 20% of UK heat demand (in the most populous towns and cities) has this density or more, so there is plenty of growth potential. Although heat networks are more efficient than individual gas boilers, payback periods are long (several decades for larger schemes). The cost-effectiveness of investments in heat networks therefore also depends on the discount rate (or level of return) that financiers require. With a discount rate of 10%, only 0.3% of heat demand can be cost-effectively met by heat networks. With a discount rate of 3.5%, networks may be economic for 6–14% of heat demand (DECC, 2013b).
Actors and Policies
Lead actors for historical heat network construction were local authorities (for application in social housing blocks or area-wide neighbourhoods) and private actors (for tower blocks, offices, campus estates). The construction role of local authorities has declined since the 1980s, as discussed in Section 6.3.1, which has eroded the capabilities for building medium- and large-scale DH-schemes. Limited construction in the 2000s focused mainly on communal heat networks, which ‘remained small-scale, fragmented and hence technically sub-optimal’ (Hawkey and Webb, Reference Hawkey and Webb2014: 1229). Because of the small market size, the ‘number of companies and individuals that specialise specifically in heat networks in the UK is small’ (DECC, 2013a: 44). Engineering consultants, construction workers, plumbers, and energy companies have general skills that are relevant for heat network construction, but they miss more specific skills and knowledge. Consequently, there is a ‘lack of common technical standards … for design, installation, operation, and maintenance of [heat network] schemes’ (DECC, 2013a: 50–51). Some components (like highly insulated district heat pipework) are not domestically produced, and the need to import them may increase material costs by 50% (Leveque and Robertson, Reference Lees and Sexton2014: 56).
Additional barriers for UK heat network deployment are the following:
Limited knowledge and internal resources to instigate larger district heating systems, where local authorities tend to play a substantial role: ‘UK local government is constrained by statutory duties prescribed by central governments, and is principally dependent on central government grant funding rather than local taxation’ (Hawkey and Webb, Reference Hawkey and Webb2014: 1232).
Lack of generally accepted contract mechanisms: ‘There is a lack of standardisation of the commercial arrangements for heat network construction and operation (including models for risk sharing)’ (DECC, 2013a: 49).
Limited technical and economic expertise for initial feasibility and design work, including detailed mapping of heat demand, technical planning, and estimating costs and benefits (Webb and Hawkey, Reference Webb and Hawkey2017).
Obtaining capital funding for heat network construction: This issue is not only challenging because of the large sums involved but also because many uncertainties increase investment risks and the cost of capital: ‘With limited recent experience of constructing heat networks in the UK and little UK-based manufacturing, the costs of developing heat networks are particularly uncertain and there are significant commercial barriers which inflate costs’ (Leveque and Robertson, Reference Lees and Sexton2014: 54). These uncertainties also include low-carbon heat generation options (e.g., bioenergy, large-scale heat pumps, waste heat from power stations), which heat networks are expected to use in future to lower greenhouse gas emissions.
User acceptance: It may be challenging to persuade homeowners to switch from their current gas boilers to heat networks, but ‘there may be less resistance to heat networks in new build’ (DECC, 2013a: 49). Since households may also have concerns about the monopoly of heat network providers, it is concerning that ‘as of December 2018, there is no regulator for heating networks … meaning consumers have less security’ about the quality of heat and pricing (Millar et al., Reference Millar, Burnside and Yu2019: 14).
Policy support for heat networks was piecemeal in the 2000s and fragmented across multiple schemes with ‘none specifically designed for promoting the development of heat networks’ (DECC, 2013a). Policy attention for heat networks increased substantially since the 2008 Climate Change Act. Although the Low Carbon Transition Plan (DECC, 2009) and Carbon Plan (DECC, 2011b) envisaged heat pumps as the main low-carbon heat provision technology, the two successive Future of Heating documents (DECC, 2013b, 2012d) saw a more prominent role for heat networks, potentially providing 20% of UK heat demand.
This new vision triggered further analyses of heat network potential and barriers (DECC, 2013d, 2013e), which was followed by policies to address the barriers. The Heat Networks Delivery Unit (HNDU), for instance, was created in 2013 to support local authorities in heat mapping, technical planning, and feasibility studies. HNDU also aimed to develop technical and commercial standards and templates and ‘encourage knowledge sharing between local authorities who are developing heat networks’ (DECC, 2013d: 5). In 2016, the government launched the £320 million Heat Networks Investment Project (HNIP), which aimed to alleviate the capital funding problem by providing substantial grants to district heating schemes. Following a two-year trial period, HNIP has since 2018 awarded £40m funding to seven projects, including £5.9m for the Gateshead District Energy Scheme, £6.6m for the Cardiff Heat Network, and £14.8m for the Meridian Water Heat Network. By reducing commercial risks, HNIP hopes to leverage £1bn in private funding for heat network investments.
To improve user security, BEIS (2020d) also launched a consultation about giving Ofgem powers to regulate domestic heat networks. The consultation document repeated the vision from the 2017 Clean Growth Strategy that 18% of UK heat could come from heat networks by 2050, which would require up to £16 billion of capital investment. Meeting those goals would require ‘a step-change in the pace of rollout and adoption of heat networks with lower-carbon heat sources to meet our carbon reduction targets’ (BEIS, 2020d: 10). While it is not yet clear how this step-change will be achieved, the policy and implementation momentum of heat networks has substantially increased in recent years and looks set to accelerate further in the near future.
6.4.6 Passive Housing
Techno-Economic Developments
Passive house (or ‘passivhaus’) is a radical whole-house design approach that reduces space-heating demand by more than 90% (Mlecnik, Reference Mlecnik2013). It combines multiple interdependent low-energy innovations such as super-insulated roofs, walls, and floors, triple glazing, mechanical ventilation with heat recovery (MVHR), passive solar design,Footnote 13 and technical solutions that enhance air tightness and reduce thermal bridges.Footnote 14 Focusing on thermal properties of the building shell, passive houses (PH) meet very high performance standards (Pitts, Reference Pitts2017): high thermal insulation values (e.g., U values between 0.6 and 0.15 W/m2K), high air tightness standards (air flow lower than 0.6 air changes per hour at 50 Pc pressure), and very low annual space heating demand (lower than 15 kWh/m2 of net living space). Because of these performance characteristics, PH-designs are seen as one of three possible routes (known as ‘extreme fabric’) to achieve zero-carbon homes (Zero Carbon Hub, 2013).Footnote 15
PH-designs originated in Germany in the 1980s. Since then, about 65,000 PH-buildings have been constructed worldwide (www.passivhaustrust.org.uk/). Since 2009, the cumulative number of certified PH-buildings in the UK has increased steadily, to more than 1,000 in 2018 (Figure 6.21). Compared to mainstream new built homes (of which two million were constructed between 2008 and 2020), PH-buildings are still a very small niche.
Cumulative number of passive house units in the UK

PH-buildings are more costly to build than mainstream homes. For a standard-size Belgium home, PH-designs in the mid-2000s cost about €39.000 (or 16%) more than normal designs (Audenaert et al., Reference Audenaert, De Clyn and Vankerckhove2008). Early PH-buildings in the UK had even higher additional costs because many of the materials and much of the installation expertise had to be imported from Germany, Switzerland, and Austria (Lynch, Reference Lowes, Woodman and Speirs2014). However, as domestic supply chains developed over time, costs of PH-components such as MVHR and triple glazing decreased. In 2015, the UK Passivhaus Trust (Passivhaus Trust, 2015) estimated that PH-buildings cost between 15 and 20% more than mainstream houses, which is between £33,000 and £44,000. Estimates in 2019 suggest that best practice additional costs were 9%, which is about £21,000 (Passivhaus Trust, 2019).
Actors and Policies
Low-energy house designs were pioneered from the 1970s in the sustainable building movement, which in the UK consisted of new entrants such as pioneering architects, developers, specialised suppliers and consultancies, and highly skilled self-builders (Lovell, Reference Lockwood, Mitchell and Hoggett2008; Smith, Reference Smink, Negro, Niesten and Hekkert2007). Many of these actors were motivated by ecological, social, and cultural concerns, critiques of modern architectural practice, and an interest in using natural and local materials. Early designs were developed through small-scale, private projects using personal resources and academic research funding. Niche-actors experimented with construction principles, combining traditional and state-of-the-art materials (Lovell, Reference Lockwood, Mitchell and Hoggett2008; Smith, Reference Smink, Negro, Niesten and Hekkert2007).
While the early sustainable building movement addressed a range of issues (e.g., water, waste, materials, energy, climate), a more narrowly focused low-energy and low-carbon niche emerged by the early 2000s (Lovell, Reference Lockwood, Mitchell and Hoggett2008). This niche was carried by a heterogeneous mix of demonstration projects of competing designs, which varied in scale, actors, and motivations. The award-winning 2000–2002 BedZED project (Beddington Zero Energy Development) in London, for instance, constructed 82 units using both insulation materials and low-carbon technologies (e.g., solar panels, district heating). Focusing specifically on the building shell, PH-designs emerged within this niche in the late 2000s, with the first UK PH-building being completed in 2009 as a self-build project.
The two main application domains for subsequent PH-houses have been self-build by motivated individuals and social housing by local authorities, registered social landlords, and housing associations. Actors in both application domains were willing to accept the higher costs of PH-designs. Since 2009, PH-designs gradually scaled up, moving from single dwelling projects by self-builders to schemes of 30 to 90 homes by social landlords and housing associations (Passivhaus Trust, 2019). These larger schemes comprised low-rise developments of 2–3 bed apartments, and terraced and semi-detached houses, often for a mix of tenures such as ‘social rent’, ‘affordable rent’, or shared ownership. Self-build and social housing are small UK niches, which limits the potential for PH diffusion.
PH-designs have only marginally entered mainstream commercial markets, because of relatively limited interest from homebuyers (who are often deterred by higher PH prices) and volume housebuilders (Lynch, Reference Lynch2014; Pitts, Reference Pitts2017). The introduction of the 2006 Zero Carbon Homes (ZCH) target initially stimulated some industry hedging, because it was complemented in 2007 by the announcement of government plans to build five eco-towns (with 5,000–20,000 homes built to zero-carbon standards), which formed an attractive commercial opportunity (Edmondson et al., Reference Edmondson, Rogge and Kern2020). Incumbent building firms (e.g., Barratt, Stewart Milne) started to explore PH-designs and also funded the Zero Carbon Hub (created in 2008) to engage in relevant research and technical demonstration (Lynch, Reference Lowes, Woodman and Speirs2014). These hedging activities stagnated, however, when the ZCH-regulations were weakened in 2011 and scrapped in 2015. The post-2009 austerity politics also removed funding for the eco-town plans, which weakened the building industry’s belief in the commercial prospects of PH-designs. Mainstream UK homebuilders see higher capital costs, low market demand, and the lack of supply chain skills as major barriers for passive house development, leading to limited engaged with the design concept (Heffernan et al., Reference Heffernan, Pan, Liang and de Wilde2015).
Intermediary organisations such as the Passivhaus Trust, the Passive House Centre, and the Association of Environmental Conscious Builders have continued to develop, share, and disseminate PH-knowledge through workshops, courses, and national conferences, aimed at educating the general public and housing associations (Martiskainen and Kivimaa, Reference Martiskainen and Kivimaa2018). But in the absence of supporting policies and wider industry interest, PH-diffusion is likely to remain relatively slow.
6.4.7 Whole House Retrofits
Techno-Economic Developments
Given the composition of the UK housing stock, which is predominantly made up of old buildings (see Figure 6.9) with around 80% of the current building stock projected to be still in use in 2050 (Dowson et al., Reference Dowson, Poole, Harrison and Susman2012), the potential for an approach to building efficiency based entirely on new builds with Passive Housing standards is limited. Despite significant improvements with the implementation of individual energy efficiency measures over the last decade (see Section 6.3.1), most British houses have relatively low energy performance (see Figure 6.10). For the existing housing stock, whole-house retrofits are therefore crucial to meet carbon reduction targets.
Whole-house retrofitting of existing homes to significantly improve their energy efficiency (i.e., by 50% or even 80%) consists of a systemic approach to housing insulation that mobilises different measures, with particular emphasis on the building fabric and the combined interactions of measures. Whole-house retrofitting is not a technology in the conventional sense, but rather a systemic improvement strategy involving several techniques, insulation technologies, and site-specific considerations.
Retrofitting a home is more difficult than building an energy efficient home from scratch. It requires assessing opportunities for improvement, adapting existing design and building features, negotiating space and systemic constraints, as well as juggling building and conservation regulations. The main strategies seek improved insulation, air tightness, and ventilation. Depending on building characteristics, conventional technical measures may include solid wall insulation,Footnote 16 cavity wall insulation, loft insulation, floor insulation, glazing upgrades (double or triple), draught proofing, and may also be combined with heating measures (boiler improvement, heating controls, hot water tank insulation). Further measures include the replacement of heating and ventilation systems, and renewable energy technologies. However, there are technical barriers to the diffusion of retrofitting: an estimated 40% of the existing housing stock is considered ‘hard-to-treat’ as they ‘possess solid walls, no loft space to insulate, no connection to the gas network or are high-rise’ (Dowson et al., Reference Dowson, Poole, Harrison and Susman2012: 296), and can therefore not easily be retrofitted using conventional techniques. Furthermore, the appropriate construction skills required for high performance retrofits are rare and the supply of high efficiency standard components is underdeveloped in the UK.
Whole-house retrofits are also costly. The Energy Technologies Institute, based on recent experiences, estimates 25% and 50% thermal improvements of a typical semi-detached house to cost an average of £12,000 and £19,000, respectively, and that these costs may be expected to drop to £7,500 and £13,750 in the period 2030–2050, with advances in materials and techniques (ETI, 2016). Looking at deeper retrofits achieving net-zero energy results as put forward by Energiesprong, current costs range between £60–90,000 per unit, with a possible medium-term horizon to bring these costs down to £40,000 (Brown et al., Reference Brown, Kivimaa and Sorrell2019).
Given the complexity of whole-house retrofits, and the eventuality of discovering building defects and surprises in individual projects, these costs provide only a rough estimate, which could be higher in practice for individual houses but also considerably lower per dwelling in tower blocks (IET, 2020). Regardless, for whole-house retrofits to become a credible option in the UK context, these large sums need to be brought down through supply chain improvements but will also require public subsidies as well as innovative ways of accounting for and valuing the added benefits (e.g., comfort, long-run savings). Spontaneous customer demand for energy efficient retrofits in the UK is low and its actual diffusion is hard to estimate:
There are no centralised records of how many sustainability-related renovations projects are carried out, but there is consensus among both practitioners and academics that the rate of such renovations is stubbornly low.
Barriers to the adoption of whole-house retrofits include financial considerations (e.g., costly measures with long payback periods), technical considerations and challenges (e.g., ‘hard to treat’ buildings, uncertainty concerning energy saving calculations), supply-chain considerations (e.g., limited availability of skills and competences, difficult collaborations, and logistics involving multiple contractors), regulatory constraints (e.g., planning restrictions in conservation areas, lack of standards, low level of enforcement), and user considerations (e.g., lack of trust, lack of interest, lack of information, preference for historic features, disruptions) (Martiskainen and Kivimaa, Reference Martiskainen and Kivimaa2019; Yeatts et al., Reference Yeatts, Auden, Cooksey and Chen2017). Yet, as suggested by a number of commentators, whole-house retrofits promise not only to deliver long-term energy savings and GHG emissions reductions, but they could also underpin significant industry and quality jobs: ‘expertise in highly energy efficient buildings also represents an industrial opportunity for the UK’ (CCC, 2019c: 59)
Actors and Policies
Incremental energy retrofits have been an important part of emissions reductions in the UK housing system, notably through the installation of more efficient heating appliances and targeted insulation measures. The period 2004–2012 has been particularly effective, owing to the combination of 1) relatively easy and cost-effective technical options, and 2) an effective dedicated policy framework (Eyre and Baruah, Reference Eyre and Baruah2015). Comparatively, whole-house retrofits stretch current cost-benefit calculations and technical capabilities, and lack a dedicated policy framework (Martiskainen and Kivimaa, Reference Martiskainen and Kivimaa2019). The deployment of whole-house retrofits on a large scale will require innovation in business models, finance mechanisms, and logistics (Brown, Reference Brown2018), as well as a coherent policy mix that addresses regulatory barriers, provides financial incentives for owner and users, and engages contractors in the development of new practices and supply chains.
Advocates of whole-house retrofits include environmental NGOs, architects, and designers seeking to pioneer sustainable building practices, but also increasingly local authorities and councils. However, many non-profit associations, such as the Association for the Conservation of Energy (ACE), the Energy Saving Trust (EST), or the UK Green Building Council (UKGBC), have experienced declining resources in recent years (Kivimaa and Martiskainen, Reference Kivimaa and Martiskainen2018). The UK Green Building Council brings together industry organisations with the mission to ‘radically improve the sustainability of the built environment’ (ukgbc.org), notably by campaigning for higher standards, sharing experience, and developing technical guidance. Concerning the scaling of retrofits in the UK, it is particularly concerned with enabling local authorities to leverage resources and stakeholders to deliver solutions best suited to local needs (UKGBC, 2021). For instance, local authorities have a key role to play with respect to the maintenance and improvement of social housing. Local authority and housing association homes provide a unique setting for demonstrating deep energy retrofits, because they account for 17% of the housing stock, offer opportunities for the development of solutions on a large scale (large individual estates, standardised building design), have an explicit social mission, and because energy retrofits could be combined with required renovation programmes (notably to improve safety standards) (IET, 2020).
In terms of policy, despite ambitious long-term goals and decarbonisation targets for the housing sector, current policy instruments are fragmented and do not add up to a coherent policy mix that can drive innovation, supply chain development, and market uptake of whole house retrofits at the required scale:
In many areas current policy is failing to drive uptake, including for highly cost-effective measures such as loft insulation. Policies have yet to be set out to deliver the stated ambition on home retrofits (EPC band C by 2035), including for those households deemed “able-to-pay”, and a delivery mechanism for social housing minimum standards. Policy needs to incentivise efficient long-term investments, rather than piecemeal incremental change.
Indeed, current policies primarily cover minimum performance standards and regulations (which tend to water down ambitions), incentives for individual measures (which do not really encourage integrated whole-house approaches), and seed-funding for demonstrators.
Standards provide systematic metrics and benchmarks for building performance. The Energy Performance Certificates (EPC), introduced in 2007, provide information on energy performance to potential tenants or buyers, without introducing any specific requirements. The UK’s Buildings Regulations are largely concerned with setting minimal acceptable standards and regulations for new buildings and refurbishments. However, they primarily encourage ‘reasonable’ provisions for energy efficiency and fuel savings within technical, functional, and economic feasibility limits, and so do not actively influence more radical interventions such as whole-house retrofits. The Government launched the Zero Carbon Homes target in 2006 and the Code for Sustainable Homes in 2007, as a voluntary initiative to push the boundaries beyond what is required by regulations, with expectations that it would develop into a hard target for new builds that could also be applied to refurbishment. However, subsequent policy reversals on the Code for Sustainable Homes and the Zero Carbon Homes standard indicate policy reluctance to encourage more ambitious industry norms and standards. More recently, the Clean Growth Strategy set a target to upgrade homes to EPC band C by 2035, but the phrasing remained vague and uncommitting:
We want all fuel poor homes to be upgraded to Energy Performance Certificate (EPC) Band C by 2030 and our aspiration is for as many homes as possible to be EPC Band C by 2035 where practical, cost-effective and affordable.
A number of voluntary standards and certification schemes have been developed, with and without public policy involvement. The Bonfield Review (Bonfield, Reference Bonfield2016) led to a revision of the Publicly Available Specifications (PAS 2030:2017) for ‘the installation of energy efficiency measures in existing buildings’ (Laganakou, Reference Laganakou2019), notably to take account of the need to adopt a ‘whole dwelling’ view on building efficiency by attending to the interaction of measures (e.g., insulation and ventilation). It also paved the way for the higher specifications in PAS 2035:2019 for ‘retrofitting dwellings for improved energy efficiency’, which covers ‘how to access dwellings for retrofit, identify improvement options, design and specify Energy Efficiency Measures (EEM) and monitor retrofit projects’. Voluntary standards and assessment methodologies seek to further push measurable levels of building thermal performance, including:
BREEAM (Building Research Establishment Environmental Assessment Method) is a housing assessment methodology developed by the BRE for new and refurbished buildings
The Passivhaus refurbishment standard (EnerPHit) is set on achieving a heating demand of 25 kWh/m2/year
Energiesprong has pioneered a new build and whole-house retrofit standard based on actual measured energy consumption rather than modelling based on implemented measures. In terms of space heating, it aims for 30 kWh/m2/year for demonstrators but accepts performances of 40 kWh/m2/year for pilots on a case-by-case basis (Energiesprong UK, 2018). Initially launched in the Netherlands, backed by Dutch Government funding, it is being adopted in demonstrations in the UK, including the Nottingham City Council and London Borough of Sutton demonstration programmes. The Energiesprong model, though still reliant on public subsidies to be viable, rests on innovative value and supply-chain propositions: it is specifically oriented towards whole-house retrofits, offers a guarantee of net-zero energy consumption, emphasises the co-benefits of home improvement (e.g., aesthetics and comfort), and seeks to build up an integrated supply chain to address the complication of dealing with multiple suppliers and installers (Brown et al., Reference Brown, Kivimaa and Sorrell2019).
Concerning incentives, funding mechanisms have been introduced in relation to targeted energy efficiency improvements in homes, but few instruments have targeted whole-house retrofits as an integrated and rather radical form of efficiency improvement. The Green Deal, initiated in 2013, was aimed at a mass rollout of energy efficient retrofits by addressing the main economic barrier: upfront costs. Its finance mechanism, making £120m available for private energy efficiency improvement, displaced upfront costs by spreading them over time. However, the Green Deal was ineffective and terminated (see Section 6.3.3). It has, however, been criticised as targeting the low-hanging fruits made up by the easiest retrofits (Rosenow and Eyre, Reference Rosenow and Eyre2016), and it is not clear how less cost-efficient retrofits will be funded in order to meet the targets. The termination of the Green Deal has been detrimental to the development of a homegrown retrofitting industry.
Concerning investments in R&D and demonstration, there are interesting projects being funded, but these remain small, relatively experimental, and involve very little funding and commitment:
the £17m Retrofit for the Future programme (2009–2011), which aimed to demonstrate the feasibility of ambitious (80% reduction) retrofits in UK social housing stock and ‘kick-start’ an industry (Laganakou, Reference Laganakou2019)
Retrofitting British houses to passive house standards remains a challenge for which it is important to multiply demonstration projects and proper evaluation and data collection. In an effort in that direction, the Technology Strategy Board launched the ‘Retrofit for the Future’ competition in 2009, funding over 100 high energy standard retrofit demonstrations in the UK, encouraging collaborations between housing providers, designers, contractors, and researchers. It has helped stimulate new business opportunities in the UK retrofit market.Footnote 17
Recently, the low impact buildings innovation platform secured £60m to support innovation in buildings over 2014–2019.
In 2020, the Government awarded £7.7m to support whole-house retrofit demonstration projects in different settings (London Borough of Sutton, Nottingham City Council, Cornwall Council), each supported by public–private partnerships.
Concerning societal objectives, the main motivations behind retrofits are energy performance improvements to reduce energy use and carbon emissions. Retrofits can also reduce individual energy bills, increase energy independence and so contribute to addressing fuel poverty and excess winter deaths, particularly if deployed on social housing (IET, 2020), and more generally improve comfort and safety. Given the high costs of deep retrofits, advocates have argued for new forms of investment assessments to take into account the wider benefits that they entail.
From the perspective of users, there are major barriers to energy efficiency refurbishment (costs, disruption, uncertainties about long-term return on investment in terms of reduced bills, etc.), which reduce the appeal of whole-house retrofits relative to other options with more immediate benefits and shorter-term investments. Furthermore, the immaturity of the supply chain may lead to unnecessary delays, inexperience, mistakes, and cost increases, which are additional sources of uncertainty discouraging an already small customer base. Indeed, ‘many households find a whole-house approach impractical, and are likely to be more attracted to retrofit measures that take place over time, spreading the cost and disruption’ (Kerr and Winskel, Reference Kerr and Winskel2020: 109778).
6.5 Low-Carbon Transition through Whole System Reconfiguration
Synthesising the analyses of sub-systems and niche-innovations, this section first assesses low-carbon whole system reconfiguration through the three dimensions (techno-economic, actors, policies) and then addresses speed, scope, and depth of change.
6.5.1 Low-Carbon Innovations Driving GHG Emission Reductions
Focussing on the deployment of technical innovations, we conclude that the notable reduction in GHG emissions from residential heating between 2001 and 2014, despite an increasing building stock, resulted primarily from incremental efficiency improvements in existing building and heating systems, as well as some diffusion of renewable heat, which continued after 2014.
The incremental changes included efficiency improvements in existing gas boilers, which were stimulated by gradually tightening standards and energy savings obligations. They also included the diffusion of incremental housing insulation measures, although these remained piecemeal and uneven across the housing stock. These incremental component improvements and piecemeal additions to existing systems only required localised adjustments in the heating and housing systems without affecting their structure, organisation, or reliance on gas infrastructures.
Concerning low-carbon niche-innovations, there are notable differences between the heating and buildings systems. In the heating system, renewable heating sources increased substantially to over 9% of water and space heating (all sectors) in 2019, supplied by a variety of renewable sources (e.g., biomass heating, heat pumps) (Figure 6.16). Domestic wood combustion, which has some negative sustainability effects such as air pollution, diffused farthest. Wood combustion is only carbon-neutral when abated, and since this was often not the case, the diffusion of renewable heat did not translate into equivalent GHG emissions reductions. Heat pumps, biomethane, and plant biomass (for industrial use) also started diffusing after the introduction of the non-domestic RHI in 2011 and domestic RHI in 2014. But markets and supply-chains for these more recent niche-innovations are still uncertain and fragile.
In the housing system, niche-innovations such as passive house and whole-house retrofits have remained very small, owing to the detrimental effect of policy reversals (e.g., Zero Carbon Homes, Green Deal) on adoption and market development, creating further difficulties for fragile supply-chains.
6.5.2 Techno-Economic Reconfiguration
To further interpret the pattern of heat and building system reconfiguration, we use summary Table 6.8, which positions the various low-carbon innovations in the techno-economic mapping framework that we developed in Section 2.2.1. Combining this table with the dynamic analyses in the previous sections, we identify the following pattern.
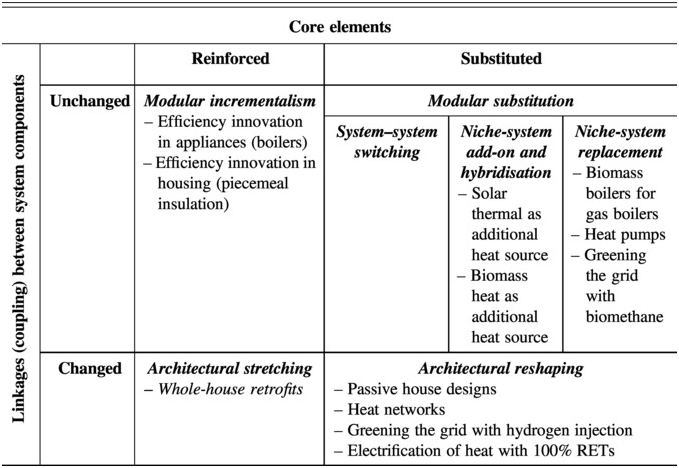
Modular incrementalism (in the form of incremental boiler or piecemeal insulation improvements) has been the dominant type of change for much of the studied period. Although these ‘low-hanging fruits’ are relatively easy and cheap to implement, they are not sufficient to deliver deep decarbonisation. In fact, GHG emissions from heat and buildings have slightly increased since 2014 (Figure 6.2).
In recent years, political debates and future visions have started to focus more on modular substitutions that may enable deep decarbonisation but are largely compatible with existing infrastructures and only require add-on or substitution in isolated components of heat systems. Some of these options, such as conversion to biomass boilers, heat pumps, or greening the grid with biomethane involve niche-system replacement and substitution of heat generation devices and energy carrier. Other options, such as add-on heating options (e.g., solar thermal or domestic wood combustion) that are used besides gas boilers, involve niche-system hybridisation since they offer reconfiguration pathways whereby existing components are not abandoned but complemented. By 2019, niche-system add-on and hybridisation options were larger than niche-system replacement options:
domestic wood combustion, which represented 36.9% of renewable heat, generated 5% of total heat in 2019 (Figure 6.16)
grid-injected biomethane, which represented 9.1% of renewable heat, generated 1.1% of total heat in 2019 (Figure 6.16)
heat pumps, which represented 17.4% of renewable heat, generated 1.6% of total heat in 2019 (Figure 6.16).
Whole-house retrofits can be considered an architectural stretching option because they keep the main element (existing buildings) unchanged but involve a systemic modification of linkages between building envelope, ventilation, and energy use to maximise thermal efficiency and comfort, through the integrated introduction of refurbishment measures. While whole-house retrofits are a promising option with significant potential, they have not diffused significantly to date due to high costs, a poorly understood value proposition, and weak supply-chains.
There are also several niche-innovations with architectural reshaping potential, which require changes in both components and system architectures.
Passive-house designs involve changes in roofs, walls, floors, windows, ventilation, and overall design parameters to minimise heat losses and optimise solar heating.
Heat networks involve both infrastructural changes and a shift towards a heat service business model. Architectural changes would be even larger if heat networks also use renewable inputs (which would be needed to achieve deep decarbonisation).
Greening the grid with hydrogen involves changes in upstream inputs and technical production processes, new or adjusted pipeline infrastructures, and changes in end-use appliances (because hydrogen has different chemical and physical properties than natural gas). Delivery visions and strategies seek to minimise associated disruptions by advocating a cluster-based approach.
All of these architectural niche-innovations have significant decarbonisation potential, but are currently very small, because they face significant hurdles. Current barriers include infrastructural and cost challenges (e.g., large proportion of old buildings unlikely to be retired from the market, significant costs of heat networks and hydrogen transmission infrastructure), technical challenges (particularly for hydrogen), regulatory challenges (e.g., building codes and standards for passive housing, long-term multi-partite contracts for heat networks, safety standards for hydrogen production, storage, delivery, and appliances), and capabilities challenges (e.g., shortage of skilled installers for passive housing). While hydrogen injection is a long-term option, the gradual scaling of heat networks and passive housing is possible today (as evidenced by successes in other countries), provided significant financial incentives are provided (to cover start-up and scale-up costs) and new policy mixes reduce barriers and uncertainties.
6.5.3 Actor Reconfiguration
For existing heating and housing actors, we conclude that there have been significant developments towards greater acceptance of climate change and energy efficiency as guiding principles, but that these mostly remain layered on top of other considerations (e.g., keeping costs down, reducing regulatory burdens) and are framed as competing with other issues (e.g., fuel poverty, access to affordable energy and housing, energy security, reliability). Accordingly, most change has been incremental, aimed at preserving existing market positions, infrastructure, business models, and skillsets. This has hampered more radical reconfiguration pathways and innovations.
However, we also observe the emergence of new actor coalitions, articulating more radical visions around new technologies, developing new skills and competence bases. These coalitions have remained rather small in the housing system, where passive house designs and low-carbon retrofits remain on the margins of a powerful construction sector dominated by volume housebuilders.
In the heating system, however, we see a more dynamic picture, with more vibrant but still small new coalitions forming to develop and deploy renewable heating technologies (e.g., heat networks, heat pumps, biomethane), stimulate user awareness, and lobby for favourable policies. There is, however, only limited user interest in alternative heating options, and a reluctance to pay more. Under current circumstances (higher costs relative to conventional technology, even with RHI subsidies), diffusion has therefore remained limited to adoption by green consumers. Furthermore, current policy uncertainties and conflicting signals tend to leave strategic planning decisions up to market competition and the influence of industry lobby groups, which has exacerbated existing power dynamics and inertial tendencies as well as increased entrepreneurial risks for more radical alternatives. Policymakers have provided some support for alternative heat options through incentives (notably the RHI), which stimulated the emergence of niche-innovations but are not enough to drive large-scale diffusion or the development of strong supply chains.
Tables 6.9 and 6.10 systematically summarise and interpret actor reconfigurations in the heating and building systems. For the heating system, Table 6.9 shows that the actor reconfigurations that support low-carbon transitions have been ‘low’ to ‘medium’, while the lock-in mechanisms and competing issues that constrain actors’ engagements with low-carbon transitions have been ‘medium’ or ‘large’. This helps explain why low-carbon reconfiguration in heating has been mostly incremental, with some recent shift towards modular substitutions, but hardly involves architectural reshaping. For the building system, Table 6.10 shows that the actor reconfigurations that support low-carbon transitions have been mostly ‘low’, while the lock-in mechanisms and competing issues that constrain actors’ engagements with low-carbon transitions have been ‘large’ or ‘medium’. This helps explain why radical low-carbon reconfiguration options have been very slow. Even incremental building improvements, which used to be important, have slowed to a trickle in recent years due to weak and fragmented policies.
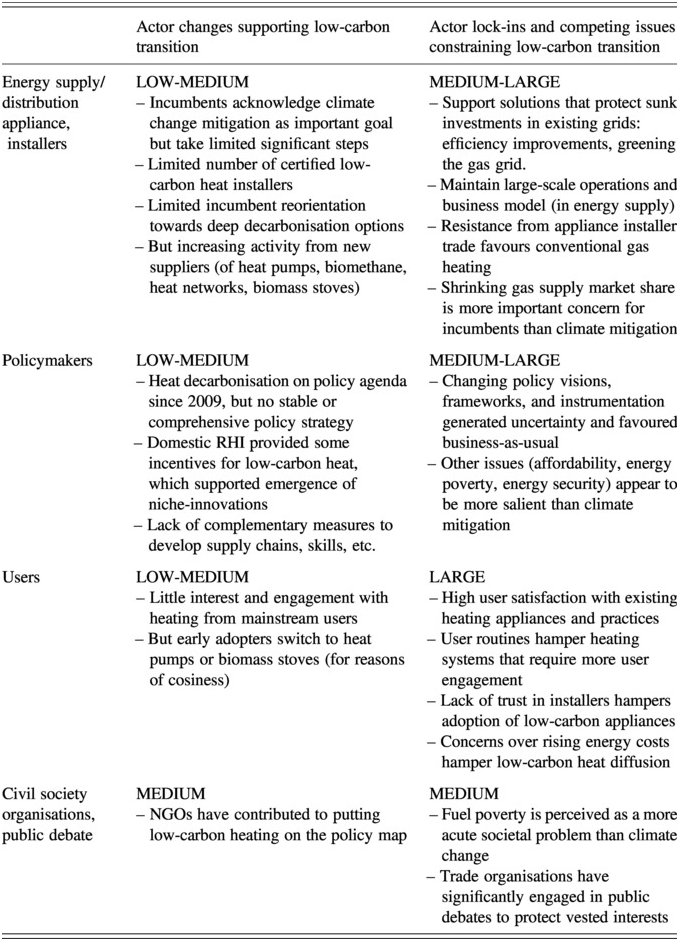
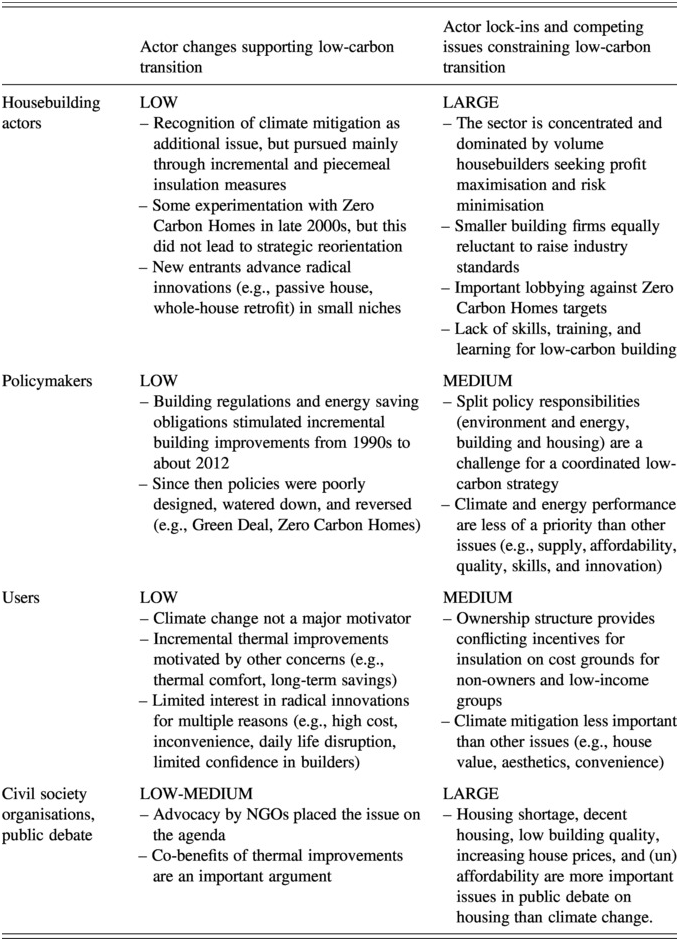
The overall picture is that existing heating and housing systems are still relatively stable due to the dominance of large incumbents, limited user interest, infrastructural inertia (gas grid, housing stock), and lack of coherent or stable policy frameworks, which generates uncertainty for reconfiguration. At the fringes of the heating system, several niche-innovations have emerged and secured a foothold in small (subsidised) markets. These innovations are small, but gradually growing. Radical niche-innovations in the housing system have remained very small and marginal, because incumbents have successfully lobbied to reverse support measures such as the Zero Carbon Homes policy. These niche-innovations are struggling to develop a toehold and have unclear future scaling pathways.
Concerning low-carbon heating options, two main visions co-exist, supported by different actor groups: 1) emerging actor coalitions support the deployment of low-carbon substitutes, and 2) established coalitions favour preserving pathways (e.g., efficiency improvements, appliance replacements, and greening of the gas grid). Given important uncertainties and competition between these visions, we currently observe the multiplication of niche dynamics (low-carbon innovations developing in spaces presenting favourable conditions) with unclear scaling pathways ahead.
There are two manifestations of this niche phenomenon in low-carbon heating. One manifestation is that low-carbon heating options are deployed by particular social and demographic groups such as households with significant disposable income and green interests, social housing residents benefiting from dedicated (pioneering) programmes, or households in off-grid locations with few alternatives. The second manifestation involves localised niches around specific regional innovation ecosystems, such as with the development of biomethane production in the south-west, which is paving the way for ‘cluster’ approaches to grid injection, or as can be witnessed for large-scale district heating schemes around pioneering urban development areas. What we are seeing in these latter cases is significant experimentation but also struggles with standardising approaches (e.g., long-term heat contracts and fragile collectives around heat networks) and market uncertainties (e.g., unviable biomethane production followed by a consolidation phase).
Concerning low-carbon housing, we currently observe significant inertia (more than in the heating sub-system), despite some exploratory diversification from incumbent actors between 2006 and 2011 (after the ZCH policy), which receded after policy weakening and reversal. This inertia results from resistance by the concentrated housebuilding industry against tighter building standards and an effective lobby against a shift towards low-carbon building codes. The inertia also has an infrastructural dimension, because the UK has a relatively old housing stock which is particularly hard to thermally improve.
The role of users is also problematic for low-carbon transitions in the heating and building systems, where the adoption of many options needs to be done by and in households (district heating and gas grid repurposing are different in this respect), which makes it different from the electricity system where adoption is done upstream and costs then passed on (often unknowingly) to users. The adoption of low-carbon options has so far been a slow process because: a) few households think much about their heating system or associate it with climate change, b) households mainly contemplate replacement when the heating device breaks down, c) costs are moderately high (in the hundreds or thousands of pounds for boilers and heat pumps, and in the tens of thousands for comprehensive low-carbon housing measures), d) installation disrupts daily household life and is therefore perceived as a nuisance, and e) there is much uncertainty and doubt about the suitability of low-carbon options and the skills and reliability of installers. These challenges for significant household adoption may have stimulated the government to explore with significant vim and vigour the possibility of working with incumbents (in gas supply and distribution) on upstream decarbonisation options that largely maintain the existing infrastructure (greening the gas grid).
6.5.4 Policy Reconfiguration
Policymakers only gradually recognised heat as an important domain for decarbonisation, evidenced by the development of high-level policy strategies in two distinct stages (2012–2013, 2017–2021). We also observe increasing awareness of the considerable challenges of heat decarbonisation. Policy reconfiguration has so far mostly consisted of broad outline strategies and policy visions with a limited arsenal of coherent policy instruments, which has led to a pattern of over-promising and under-delivering.
Formal Policies
Heat-related policies in the 1990s and 2000s mobilised a range of instruments, including regulations and obligations, which led to incremental but substantial improvements in boiler efficiencies. Since the early 2010s, policy focussed on supporting the deployment of low-carbon heat sources, but the instruments are narrower than before and mostly focused on market-based interventions (the Renewable Heat Incentive) with little technological prescription or innovation support. This strong reliance on market modulation has not been very effective, because it is fragmented, lacks a systemic strategy and complementary instruments (notably to develop supply chains and key competences for the delivery of large-scale roll-out of alternative heat appliances), and therefore denotes a lack of policy consistency. Visions and objectives, though ambitious, have not been translated into concrete and effective measures, leading to a delivery gap marked by over-promising and under-delivering. Policy signals and instruments also changed over time, which created a lack of policy coherence and an uncertain context for the development of supply-chains, which ultimately limited on-the-ground delivery.
Concerning policies targeting the buildings system, current interventions to support low-carbon buildings and retrofit measures are less developed than for heating appliances, and are insufficient to reach decarbonisation objectives. Until the early 2010s, regulatory instruments (e.g., energy savings obligations and performance standards) stimulated incremental efficiency improvements through piecemeal insulation measures. More recently, building decarbonisation policy has focussed on driving innovation in building and retrofitting techniques (e.g., Green Deal and Zero Carbon Homes plan). However, policy terminations, policy reversals, and a fragmented approach relying on isolated policy instruments has created policy incoherence and inconsistency, which has led to disappointing results such as plummeting deployment of key insulation measures since 2013.
Lobbying from the construction industry succeeded in watering down regulations and standards. Significant loopholes (e.g., the existing housing stock is not the object of stringent objectives) and the postponements of objectives further weaken the signals for the significant changes required. Currently, low-carbon building and retrofitting are only pursued by a small fraction of pioneering industry actors (and committed clients) who bear the associated risks. What is needed to deliver a large-scale decarbonisation of buildings is a more coherent and consistent approach, including tighter standards and regulations, innovation and market deployment support, and an industry-wide training and skilling strategy.
We conclude that heat decarbonisation is a relatively new policy concern that has risen on the mainstream policy agenda from 2012 but is facing significant hurdles. We also observe policy tensions and changing orientations, which generate uncertainties for deep low-carbon heat reconfigurations. These uncertainties relate both to the formulation of transformation visions and strategies and to the design of concrete instruments and policies.
The formulation of heat decarbonisation pathways and related visions has changed significantly over time. From 2011, future scenarios initially relied strongly on the electrification of heat and continued efficiency improvement, which a few years later was complemented with heat network visions. More recently, we observe policy interest in exploring the repurposing of existing gas infrastructure (in addition to electrification and heat network pathways). This change in the portfolio of options and pathways is not necessarily problematic. Indeed, technological variety may increase the likelihood of future transformations, and it is also largely plausible that the decarbonisation of heating in the UK will rely on a wide range of options, adapted to different settings (which in itself represents a major break from the current quasi-universal gas-based system).
On the one hand, changes in transformative visions are thus to some extent inevitable and can be an important marker of policy learning. On the other hand, however, there are also significant costs associated with delaying decisions about the preferred pathway: financial costs of investing in multiple options, policy legitimacy and credibility costs, as well as over-exposure to the influence of vested interests who may interpret policy indecision as opportunities for advocacy. Although the recent interest in options that preserve existing infrastructures has short-term cost advantages (such as avoiding stranded assets), it may lead to future lock-ins that hamper more radical and effective decarbonisation options.
The design of concrete interventions and formal policies has thus far primarily relied on single instruments (market incentives such as the RHI or more regulatory approaches such as ZCH). This fragmented approach has not been effective in delivering robust and vibrant markets and supply chains, because it tends to target only one element of the system, is vulnerable to policy reversals, and fails to provide an adequate degree of policy coherence and consistency. Policy interventions to support low-carbon heat have so far lacked an integrated perspective enabling the joint development of user demand, supply-chains, and skills. Beyond single instruments such as the RHI, the government is yet to deliver a consistent policy framework for heat and buildings, leading the CCC to conclude that: ‘Over ten years after the Climate Change Act was passed, there is still no serious plan for decarbonising UK heating systems or improving the efficiency of the housing stock, while no large-scale trials have begun for either heat pumps or hydrogen. The low-carbon skills gap has yet to be addressed’ (CCC, 2019a: 66). Delivering low-carbon heating and housing will require a more diverse set of interventions, articulated in a policy mix, as well as safeguards against policy swings over time.
Governance Style
The governance style in the past 10 years has primarily followed a hands-off, neo-liberal intervention logic, characterised by strong reliance on market mechanisms and incentives with limited technological prescription, a preference for voluntary standards (as opposed to regulatory prescriptions for industry), and a reluctance to interfere with user preferences through behaviour change policies. This deviates from the preceding period (mid-1990s to 2010), when a regulatory style (e.g., energy savings obligations and performance standards) was reasonably effective in driving the uptake of more efficient appliances and insulation measures. Attempts at a more interventionist style (e.g., Zero-Carbon Homes policy for buildings, Green Deal for demand-side responses involving users) were short-lived because they faced significant opposition and disappointment, which seemingly confirmed the preference for a hands-off approach.
While this style is deeply engrained in current policymaking, we also note that this is not inevitable and may change in the future, given that policymakers in the UK have had significant influence over heat system transitions in the past (Hanmer and Abram, Reference Hanmer and Abram2017) and have new opportunities to do so, notably with raised urgency and public concerns around climate change, and greater acceptance of more hands-on interventionist governance since the COVID-19 crisis.
Owing to this hands-off style, but also because of the relative novelty of policy interest in heating and buildings as a target area for decarbonisation, we also observe a deficit of policy expertise and coordination. Indeed, the UK currently lacks a dedicated body with oversight over heating systems and fuels (Connor et al., Reference Connor, Xie, Lowes, Britton and Richardson2015) (despite Ofgem playing a de facto role), and there is only limited policy coordination concerning low-carbon housing, which intersects multiple policy portfolios and responsibilities. The Committee on Climate Change therefore called for a change in governance style, providing more leadership and coordination: ‘Approaches based on heat pumps, hydrogen and heat networks will only be realised with strong Government leadership at both local and national levels because all of these solutions will require coordination’ (CCC, 2016: 10).
In parallel, we also observe a tendency for working closely with incumbent actors for decisions concerning heating (e.g., renewed interest for biomethane injection and grid repurposing) and housing (e.g., attention to building industry concerns about imposing regulatory constraints). This is a double-edged sword, however. On the one hand, working closely with incumbents may lead to policy pathways with more buy-in from key actors, who may be willing to mobilise their own resources (e.g., finance, expertise, infrastructure, research) towards implementation. On the other hand, this may lead to policy capture by dominant actors (especially when relatively weak sectorial public expertise does not offer the appropriate means to evaluate industry proposals), a lowering of overall ambitions towards what is deemed ‘cost-effective’ rather than in line with long-term policy objectives, as well as policy legitimacy problems if policymakers are seen as catering exclusively to ‘big business’ interests.
A notable governance style problem relates to policy coherence over time, which we see as symptomatically lacking in the UK heat policy landscape. Indeed, there have been multiple significant direction changes, policy reversals, and failures. These are linked to poor policy design but also to a tendency for grand strategising, reliance on abstract modelling, and comparatively little attention to detailed implementation or reliance on sector-level expertise. These difficulties in setting out a systemic and temporally consistent approach to heat policy have tended to exacerbate market uncertainties, creating a negative environment for supply-chain development. More generally, uncertainty with energy policy directions is emerging as a British syndrome (Keay, Reference Keay2016; Kuzemko, Reference Kuzemko2016; Rosenow and Eyre, Reference Rosenow and Eyre2016).
Since 2017, we observe steps towards the formulation of an industrial strategy concerning heating (and a lack thereof for buildings), notably through funding of demonstrations and trials and a shift towards more technology-oriented policy (e.g., biomethane production, hydrogen production, electrification of heat). One-shot demonstration investments should not, however, detract from the need to develop a coordinated policy framework and long-term coherence. Indeed, considerable uncertainties remain regarding the delivery of such an approach, notably in the absence of a more integrated policy mix (e.g., targeting skills and supply-chain development) and long-term policy coherence, as well as in the absence of targeted deployment measures beyond trials. The upcoming Heat and Buildings Strategy may be an opportunity to put forward such an approach, particularly as it is oriented by ambitious objectives set out in the Ten Point Plan for a Green Industrial Revolution (HM Government, 2020b) and the Energy White Paper (HM Government, 2020a), and as it may benefit from recent cash injections from the COVID-related recovery package. Nevertheless, very serious concerns remain about the feasibility of implementation under current circumstances (Institute for Government, 2021).
6.5.5 Scope, Depth, and Speed of Reconfiguration
Low-carbon reconfigurations in the UK heating and building systems are rather limited to date. There are differences, however, in terms of the scope, depth, and speed of reconfigurations.
The scope of the unfolding reconfiguration in the heating system is moderate, because only a subset of low-carbon innovations is being supported and experiences some diffusion. These innovations represent modular incremental and modular substitution options, which require only limited adaptation of established actors. The more radical innovations (which require more substantial system and actor reconfigurations) are less developed and stuck in small niches.
The depth of reconfiguration in the heating system is limited, because market niches remain small and have not yet led to substantial reorientation of established actor activities and business strategies (within the energy supply and conventional appliance trades), despite some noticeable activity from new entrants (e.g., biomethane production, and heat pump and biomass stoves suppliers).
The speed of reconfiguration is limited to moderate because diffusion of most renewable heat technologies (e.g., wood combustion, plant biomass, biomethane, heat pumps) has remained limited. While, cumulatively, renewable heat reached about 9% of overall heat production in 2019 (across all sectors), up from negligible contributions before 2007, this is far from enough to support significant GHG emissions reduction given that many renewable heat options are not low-carbon if unabated and given that domestic energy consumption for heat has increased since 2014 (Figure 6.6). The most recent deployment targets for heat pumps seem over-optimistic under current policy conditions, and the deployment of biomethane remains at an experimental demonstration stage.
The scope of reconfiguration in the building system is limited, with few radical alternatives diffusing to deliver substantial low-carbon improvements (passive housing and whole-house retrofits), despite some more success with deploying incremental improvements with piecemeal insulation measures.
The depth of reconfiguration in the building system is limited, because radical alternatives are only supported by small new entrants with weak supply-chains, and because the established building sector remains committed to established practices and has successfully lobbied against more ambitious programmes.
The speed of reconfiguration in the building system is very limited, with radical innovations remaining at the demonstration stage with poorly developed market niches. The road ahead for deep decarbonisation of the building system remains uncertain and currently uncommitted, despite significant urgency to find workable pathways for a highly inertial system.
6.5.6 Future Outlook
The UK heating and housing systems are not on track to meet decarbonisation targets. Significant efficiency improvements have stalled over recent years, owing to a lack of consistent and coordinated policy interventions. Ambitious long-term transformative policy visions have been developed (e.g., mass roll-out of heat pumps or greening of the gas grid), but these have not (yet) been complemented with implementation policies and instruments. The unfolding low-carbon system reconfiguration thus has limited depth, scope, and speed, and does not qualify as a Great Reconfiguration.
Existing heating and building systems remain dominated by inertial forces (e.g., hard to retrofit building stock, gas grid as potential stranded asset), limited momentum of low-carbon alternatives (due to limited demand and user engagement, lack of skills, poorly developed supply chains), and strong influence of incumbent actors (e.g., energy suppliers, volume housebuilders) who are interested in maintaining exiting system configurations and thus mostly enact incremental changes.
To achieve deeper decarbonisation, future heat reconfiguration is likely to involve a mixture of options in housing, appliances, and supply/infrastructure. Continued reliance (above 10%) on the existing natural gas-based system beyond 2030 is incompatible with deep decarbonisation objectives, unless CCS is implemented on a massive scale (Mcglade et al., Reference McGlade, Pye, Ekins, Bradshaw and Watson2018). Because the various low-carbon heat and building options have different characteristics, multiple reconfiguration pathways should be pursued (Watson et al., Reference Watson, Lomas and Buswell2019). We thus expect that future low-carbon reconfiguration will be from one dominant system (national gas distribution and individual gas boilers) towards a more diverse system with options that may vary according to locality, network access, and supply-chain location: heat networks in denser areas, heat pumps and biomass boilers in off-grid areas, and biomethane injection in regional networks related to production clusters.


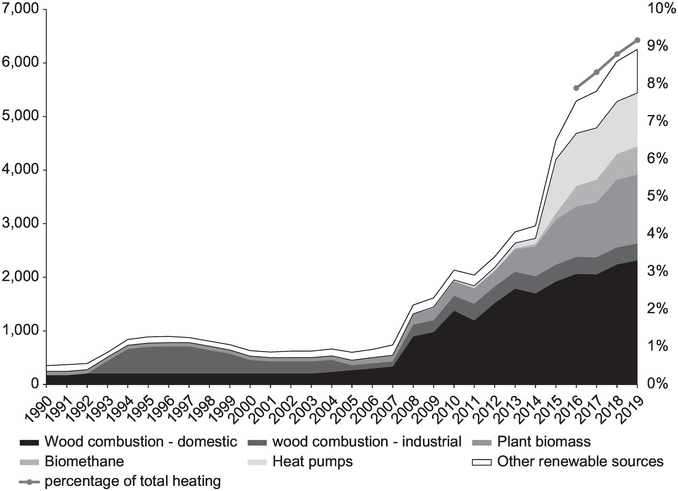


 Open access