

Introduction
The post-expert era, fuelled by rapidly expanding communication pathways, raises many challenges for communicating science to the public (Iyengar & Massey, Reference Iyengar and Massey2019; Luers & Kroodsma, Reference Luers and Kroodsma2014), with climate science being at the focal point. Misinformation and partisan perspectives on the drivers of the changing climate make it difficult to reach social and political consensus (Pepermans & Maeseele, Reference Pepermans and Maeseele2016) even though the time has long since passed when the science of human-induced climate change was uncertain.
Polar research, however, often sidesteps the roadblocks inherent in this debate, possibly because its connections to the Heroic Era of exploration early in the twentieth century gives it an intrinsic value, perhaps not easily attained in regionally − and geographically − specific impacts such as hurricane-induced flooding, wildfires or drought (Hansen & Sato, Reference Hansen and Sato2016). In much of the discussion about changing climate, there is an element of preaching to the converted (Landrum & Lull, Reference Landrum and Lull2017). So then, what are alternate pathways for communicating the key issues of climate science to the un-converted (Crossman, Reference Crossman2014), or gaining the attention of young people who are, and possibly could remain, unaware of the issues? This is not so much to explicitly “convert” them – but rather, to make them aware that they have the potential to be part of the dialogue.
Connecting art and science is one approach to the challenge of engaging with the unconverted through addressing a new audience or connecting with young learners. The interdisciplinary interface between art and science goes by a number of labels, usually reflecting the perspective of the author; SciArt, ArtSci, Sci+Art, STEAM, Art-v-Sci. Here we use the mathematical cross-correlation operator * to denote the nonlinear and multi-scale responses to the interaction between art and science in Antarctica − Science*Art. This is to separate the approach from representational paintings of field samples, sounds generated from digital data or spectral analysis of paintings. It is a merging and cross-fertilisation of the two overarching disciplines, somewhere between interdisciplinary and transdisciplinary approaches (Zeigler, Reference Zeigler, Corbin and Eckert1990).
Here we report on some results from a six-year-plus evolving collaboration developing new modes of communication using the interconnections between art, science and education in the context of climate science in a polar setting. The connection has different interdisciplinary facets including embedding the artist in Antarctic field teams (O’Connor & Stevens, Reference O’Connor and Stevens2018) and, conversely, getting scientists to assist with art production (Stevens & O’Connor, Reference Stevens and O’Connor2016). This also has an educational thread by entraining students to aid in the art production themselves (O’Connor & Stevens, Reference O’Connor and Stevens2015). These works provide a unique way into the science for a variety of audiences, and help to build new audiences. In addition, the approach challenges the scientist to re-evaluate what, why and how, they work.
Here we review selected examples of how art has connected to Antarctic exploration and science over the past several centuries (see also Fox, Reference Fox2005 and Shepherd, Reference Shepherd, Liggett, Storey, Cook and Meduna2015 for expanded reviews). Then we explore the interaction between art and science by looking at work produced in a scientific field camp by an artist asked to collect scientific and art “data”. The outcomes of the collaborative work are discussed in terms of (i) the contribution to science knowledge; (ii) the benefits to education and science communication; and (iii) a reflection on how scientists look upon their own processes.
Art in Antarctica and the connections to science
Joseph Banks employed two artists as part of his retinue for Captain James Cook’s first voyage (1768−1771) to the Pacific but, not uncommonly, both died during the voyage. Despite this, they provided now iconic depictions of new lands and species. Cook must surely have seen the impact of Banks’ attention to publicity and the power of the artist in assisting this. Cook’s second voyage (1772−1775) was the earliest documented expedition into Antarctic waters and he observed that “the Admiralty showed no less attention to science in general, by engaging Mr. William Hodges, a Landscape Painter, to embark in-this [sic] voyage, in order to make drawings and paintings of such places in the countries we should touch at, as might be proper to give a more perfect idea thereof, than could be formed from written descriptions only” (Cook, Reference Cook1777). The British Admiralty needed to provide evidence of the fantastic claims of the journals. The illustrations were literally of new worlds, as novel and fascinating as pictures of Mars are to us now.
Hodges, a former scenery painter for stage, produced large-scale oil paintings of the South Seas voyage that have become symbols of Cook’s expeditions. Works such as A View of Cape Stephens in Cook’s Straits New Zealand with Waterspout and View in Pickersgill Harbour, Dusky Bay, New Zealand hold iconic status in maritime and exploration art. The two, artist and captain, spent much time in each other’s company as Cook directed aspects of the voyage he wanted recorded. A number of Hodges’ works were found in the Cook family collection. Hodges generally produced his large oil colours after the voyage from sketches and watercolours (Hodges, Reference Hodges1777). However, very little of the work that resulted was of polar scenes. While one might think that the unique landscapes would have excited the public, one might ask: Were the scenes of ice were deemed to be so fantastic as to be unbelievable? Possible evidence of this is that at least one large-scale iceberg painting was recycled (van der Merwe, Reference van der Merwe2018). X-ray examination has revealed that the well-known View in Pickersgill Harbour, Dusky Bay, New Zealand was painted over a finished painting of icebergs produced during the voyage (Fig. 1).
Hodges’ icebergs as revealed by X-ray. (ca. 1776, oil on canvas, 665 mm x 745 mm © National Maritime Museum, Greenwich, London.)
While Hodges was a professional artist, so many Antarctic artists that followed brought their art skills as one of several roles. This was either due to all-too-common mortality in early voyages, through to the modern need to have highly compressed teams. When the artist commissioned for Jules Dumont d’Urville’s voyage of 1837−1840 died very early on in the voyage, he was replaced in the role by the physician Louis le Breton who produced a number of works capturing the ice of the Southern Ocean, typically in the context of the ships (Duyker, Reference Duyker2004). At the same time, James Clark Ross sailed HMS Terror and HMS Erebus south into what is now the Ross Sea. John Davis, who was aboard Terror, sketched the fantastic, impenetrable Ice Barrier and the active volcano Mount Erebus. Engravings of his depictions of erupting volcanos and seals on ice floes provided the first glimpses of scenes familiar to us now, but at the time must have been amazing. Thus, these highly representational works were in effect abstract to most viewers.
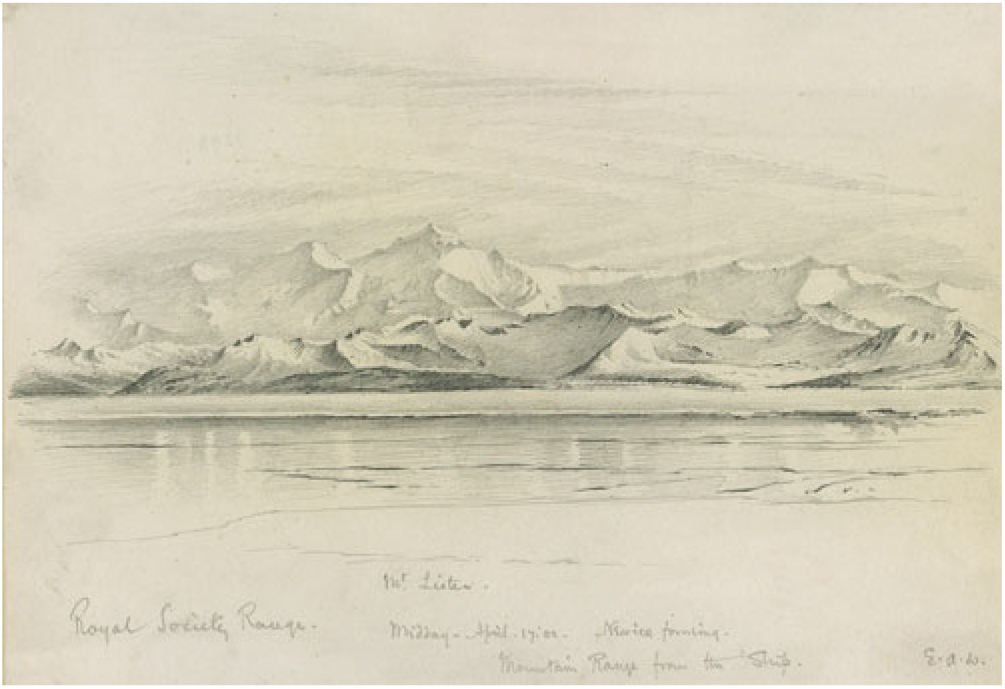
A half century after Ross and Dumont d’Urville opened our eyes to the southern continent, Edward Wilson, physician and accomplished (albeit amateur) water colourist, successfully applied for a position on Scott’s first expedition (1901−04), despite being in recovery from tuberculosis. Engaged as both second surgeon and artist, his adherence to detail and veracity brought a unique combination to his work that spanned the art−science interface. He produced over 1000 paintings and sketches during this expedition alone. Notably, he produced a geographically accurate 30 m long panorama of the Victoria Land coast from Cape Adare to Ross Island (Fig. 2).
Royal Society Range. Mt. Lister. Midday. 17 April 1902. New ice forming. Mountain range from the ship. Edward Wilson, Pencil and ink drawing, 1902, 255mm x 192mm, https://www.spri.cam.ac.uk/museum/catalogue/article/n1293/) permission given.
As well as again including Wilson, Scott’s second expedition (1910−1913) employed the photographer Herbert Ponting. The photographer’s pioneering work in travel photography and motion pictures was at the start of the era of portable photography. Importantly, expeditions to the Arctic (Wamsley & Barr, Reference Wamsley and Barr1996) had proven the technology viable in cold climates. The location of Ponting’s darkroom along the end wall of the Terra Nova hut at Cape Evans gives a sense of the importance placed on photographic records. This could be viewed as the time when photography displaced the need for an “expedition artist” (Yusoff, Reference Yusoff, Naylor and Ryan2010). However, Wilson’s watercolours remain well known, and the work of Ponting (Fig. 3) – as well as his contemporary Frank Hurley who sailed with Shackleton (Dixon, Reference Dixon2012) − has obvious artistic value and merit (Glasberg, Reference Glasberg2007). Finally, it was Wilson, not Ponting, who accompanied Scott to the pole − and beyond.
Ponting’s “The cavern in the iceberg without figures. Terra Nova in distance. Jan. 8th 1911”. (permission given https://www.spri.cam.ac.uk/picturelibrary/catalogue/article/p2005.5.1399/).

For a period during the first half of the twentieth century, art in Antarctica was dominated by “war artists” or at least connected with military-supported programmes such as the 1946−1947 US Navy Operation Highjump (Dietz, Reference Dietz1948). These practitioners typically came with a prescribed agenda and highly representational styles. Peter McIntyre is a New Zealand example who started out as a war artist, known for his oil on board works, but then travelled to Antarctica after this role had finished. This mid-century period coincided with ever more functional, and portable, photographic equipment further displacing the need for a dedicated artist in the field. These days, every member of a modern science field team bristles with cameras, well able to document what they view to be relevant. What, of course, is missing is the artist’s well-developed, and external, view of the proceedings. One might argue that this artistic view deviates from the so-called scientific method, but the field of science is littered with advances built on the intuition of very clever people.
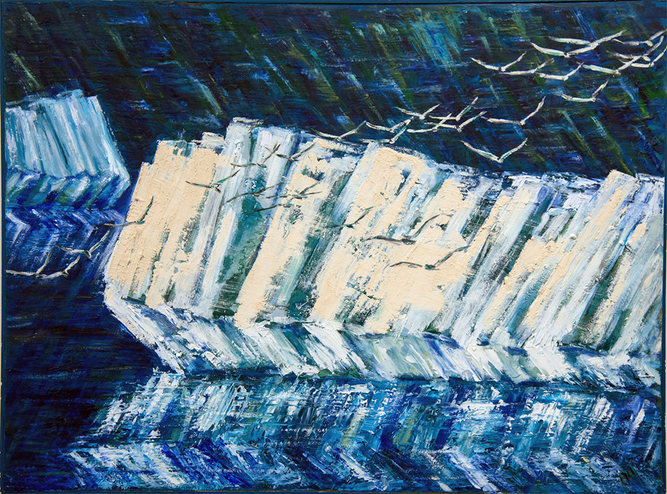
By the 1980s, artist participation had become formalised within most Antarctic programmes including the USA, Australia and New Zealand (Boyer, Reference Boyer2012). However, artists outside the accepted norm, like Nel Law, the first Australian woman to travel to Antarctica (1960−1961), literally needed to stow away. Despite this, she produced a range of works spanning traditional landscapes to abstract representation of ice-forms. Her drawings, and oil on masonite works like “16 tubular icebergs” (Fig. 4), combine colour and structure that sits on the boundary between representative and abstract. This connects with the scientific process as it reduces a scene to structural and often repeating elements.
16 tubular icebergs (Nel Law: permission granted, oil on wood, © Image courtesy of Australian Antarctic Division https://data.aad.gov.au/aadc/artefacts/display_artefact.cfm?artefact_id=2164).
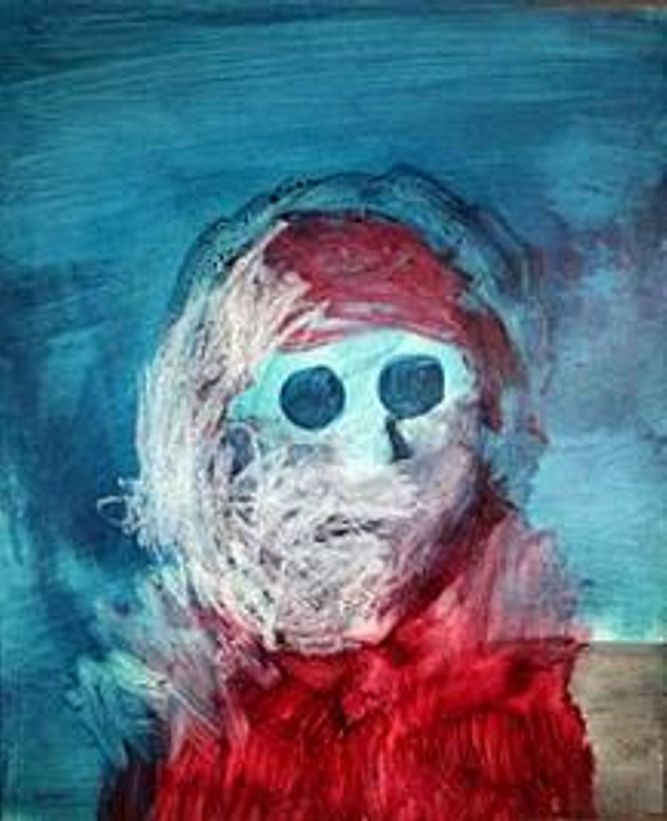
Several years later in 1964, Sidney Nolan, probably the highest profile artist to ever visit Antarctica, did so at the behest of the US Navy as part of Operation Deep Freeze. Despite only visiting for eight days, he made use of watercolour on blank postcards as sketch boards for later oil works (notable in that much of his well-known work used enamels). His highly luminescent and textured representations were in keeping with a theme of placing the human (Fig. 5) in a landscape and continued to do so in an Antarctic context. It gives the knowledgeable viewer pause to see the combination of familiar Antarctic views represented in a way one normally associates with doomed bushrangers or desert colours.
“Scientist” (Sidney Nolan, Reference Nolan1964) permission granted.
In the present millennium there has been a significant growth in the number and variety of Antarctic-focused art−science studies and collaborations (Shepherd, Reference Shepherd, Liggett, Storey, Cook and Meduna2015). While these activities typically result in temporary exhibitions that are hard to document, there are a growing number of papers describing such collaborations. Terhune et al. (Reference Terhune, Quin, Dell’Apa, Mirhaj, Plötz, Kindermann and Bornemann2008) included a sound artist in a conventional science study, while Roberts and Nicol (Reference Roberts and Nicol2011) captured an art−science dialogue and explored the role art plays in communicating science. Shepherd’s (Reference Shepherd, Liggett, Storey, Cook and Meduna2015) review of “Creativity at the Frozen Frontier” goes beyond the visual art that is the focus here and relates the contributions made by researchers working with the written word, sound art, dance and textiles.
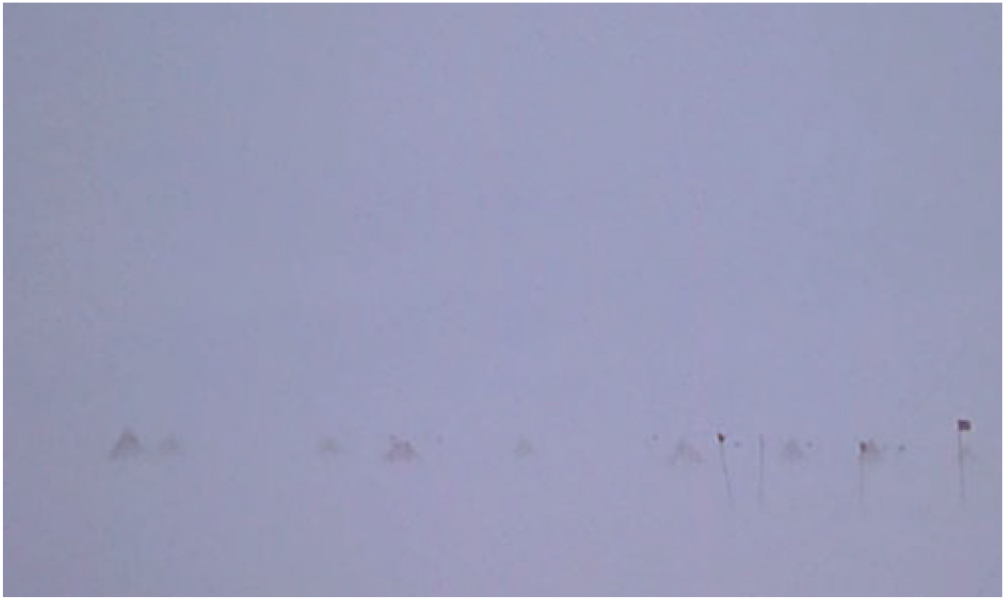
New Zealander Anne Noble’s photographic works, supported by both the New Zealand and US Antarctic programmes, was notable in that, like a science event, she specified what she wanted to do and where. As well as documenting the machines that make survival possible (Noble, Reference Noble2014), and human-scale impacts (“pee” flags), she also had a focus on the environment. Her “white-out” images documented the sheer impenetrability of zero-contrast, zero-colour conditions where you can walk into a metre-high snow berm with no forewarning. While the disconcerting, almost totally white/blank, images confuse the non-initiate, they are highly relatable to anyone who has been in a snow-storm/white-out. In this way, the art inspires the scientist to record scenes that otherwise would have passed unnoticed (see Fig. 6 for author’s own interpretation). Fox (Reference Fox2005) suggests that it was no surprise antipodean artists led the way in pathfinding new perspectives on the polar continent. Australia and New Zealand are geographically close and act as staging posts for a significant proportion of people travelling south for science. Furthermore, landscape and a sense of place continue to figure heavily in their respective art scenes.
Whiteout, an image by a scientist (one of the authors, CS) inspired to look at a scene differently by the photographic artist Anne Noble.
Ice−ocean interaction science as a setting for art
Collaboration and cooperation is a key element of some wide-scale interdisciplinary work. The International Geophysical Year (IGY, 1957−1958) was an early example of global scientific cooperation and captured the attention of a wide swath of people at the same time – in a pre-internet era. A landmark occurred during IGY when the photographer Emil Schulthess combined photojournalism and art perspectives to document the interface between science, human and environment (Schulthess, Reference Schulthess1960). He employed new developments in lens technology so as to go well beyond representation, instead seeking to evoke a sense of place and combined environment and human perspectives (Pyne, Reference Pyne1986).
A half-century later the International Polar Year (IPY, 2007−2009) returned to this concept of international collaboration in order to consolidate, update and accelerate polar research. One IPY experiment was a winter-over project carried out in southern McMurdo Sound, Antarctica, looking at the interaction of oceanic outflows from beneath ice-shelf cavities, and how this influenced growth of sea ice (Mahoney et al., Reference Mahoney, Gough, Langhorne, Robinson, Stevens, Williams and Haskell2011). A key focus of this work was the examination of production of ocean water so cold it initiated the formation of crystals within the ocean and on the underside of any sea ice. Layers of these crystals then influence a range of processes such as heat transfer from the ocean, ice growth rate, strength of the sea ice and, importantly, the ability of the sea-ice thickness to be reliably measured by satellite-borne instruments. A sequence of experiments followed on from the IPY work seeking to answer remaining research questions. A major result was the quantification of the roughness of the crystal-coated sea-ice underside, indicating it was over an order of magnitude rougher than the paradigm (Robinson, Stevens, & McPhee, Reference Robinson, Stevens and McPhee2017).
The effect of the crystals doesn’t figure in present large-scale models of Antarctic ice−ocean behaviour. Only the newest of predictive simulations include their effect, despite the obvious influence they can have on heat exchange. When included, the scientific focus on the ice crystals has been primarily at the large scale. For example, a typical regional ocean model might have “cells” 5 km x 5 km. These studies necessarily treat the crystals in integrative form so that the presence and effect of the crystals is constant over the entire cell, with several studies looking at how the crystals can meaningfully be represented at this scale (Langhorne et al., Reference Langhorne, Hughes, Gough, Smith, Leonard, Williams and Haskell2015). While this focus on the larger, integrated scale makes sense from the perspective of the need to predict future climate, there is no getting away from the fact that actual heat transfer, energy dissipation and phase changes all take place at the small scale.
Despite a decade of science looking at implications of the crystals, by 2014 there still had been no serious attempt to catalogue them at the scale of the individual crystal. It was within this setting that the present project took place. The focus here is on work in response to a challenge by the scientist who tasked the artist with a scientific objective that the artist then met using art and science approaches. The crystals beneath sea ice needed to be sized and categorized. The artist extended the science brief of recording basic dimensions by developing a more individual-focused approach, to the extent of making “portraits” both of individuals and groups that contextualised the crystals in terms of how the samples and data were collected (cf. Barnett and Whittle’s (Reference Barnett and Whittle2006) examination of an art−science perspective on the fruit fly). As well as generating scientific data, the artist developed two exhibitions, titled Studio Antarctica and Data Days. This approach enables us to examine the evolution of the nature of an art-science collaboration as a case study for the connections between art, science, climate change, education, science communication and Antarctica.
Science*Art: Studio Antarctica to Data Days
In a divergence from the “artist’s programme” approach, and more in keeping with collaborative research, a polar oceanography science event embedded an artist in their field team (O’Connor & Stevens, Reference O’Connor and Stevens2018). A four-person team (with the call-sign “K131” – K for kiwi; Stevens, Langhorne, & Robinson, Reference Stevens, Langhorne and Robinson2018) was based in a small, isolated, sea ice field camp, conducting scientific in situ experiments over several weeks through holes melted in the sea ice of McMurdo Sound in the Ross Sea. Objectives for the work included science, art and Science*Art themed tasks. The scientific measurements captured the water column hydrography, the nature of the ice crystal structure and the interaction between the two, seeking to better define heat transfer between ocean and ice (Robinson et al., Reference Robinson, Stevens and McPhee2017). The art component involved producing representational and non-representational art (paintings, sketches, video and photographs – O’Connor & Stevens, Reference O’Connor and Stevens2018) with art being developed (by one of the authors – O’Connor) alongside the science (Fig. 7).
The artist working in the on-ice “science” laboratory.
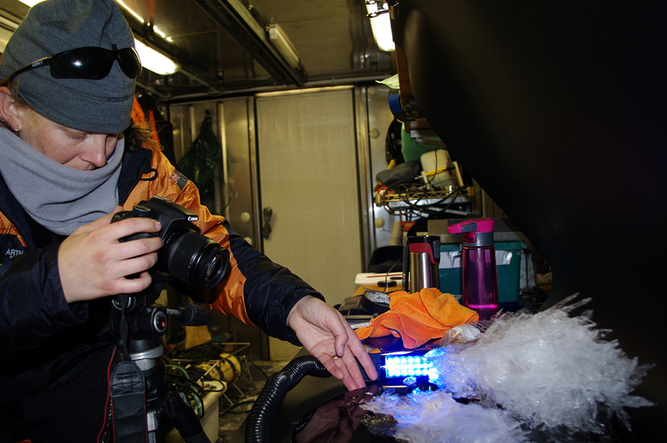
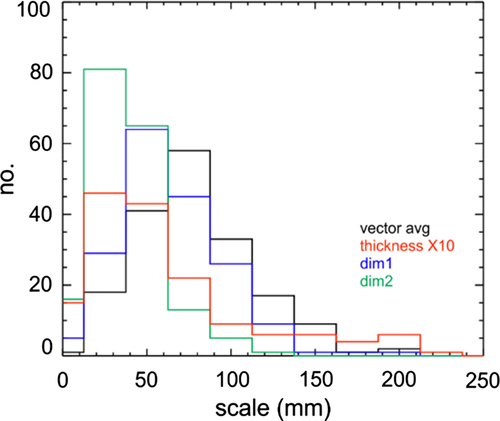
The interdisciplinary Science*Art task involved the artist being charged with documenting ice crystals at an individual level – essentially manually measuring the dimensions of 100 crystals each roughly 5−10 cm in diameter. This yielded scientifically valid and useable results sufficient to inform scientific modelling (Fig. 8). This first expedition developed ways of identifying and measuring the key properties of each crystal. The most useful of these being the physical dimensions as the crystal lay flat on the light stage, as well as its thickness. As with a science measurement, it required interpretation, background research and some experimentation. The crystals had to be extracted from the floating assemblages on the water surface in a way that did not damage them. Further, as soon as they were brought into the atmosphere of the field laboratory they would start to melt, or grow, depending on the ambient air temperature. A suitable lighting stage was developed using non-heat-emitting light sources. In addition, the crystals were laid next to a scale bar. While this enabled the specifics of the science brief to be met, the art research added extra facets to the sampling. Each crystal was sketched, and some notes made around its structure. These sketches also had to be produced quickly, with watercolours made from the sketches later, but still on-site.
Ice crystal size distribution showing various dimensions as captured during the art making process.
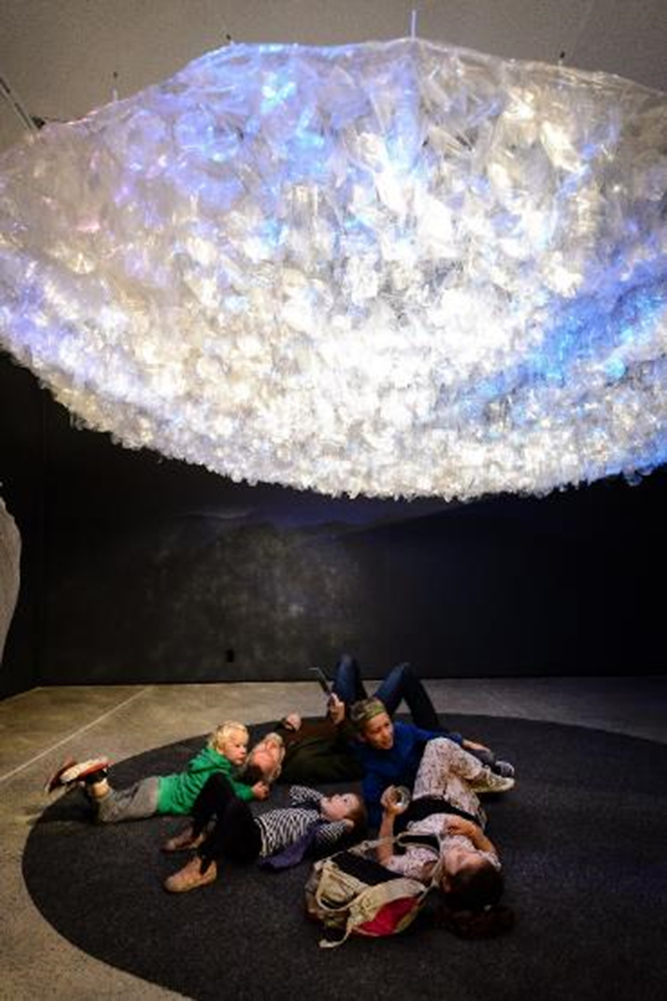
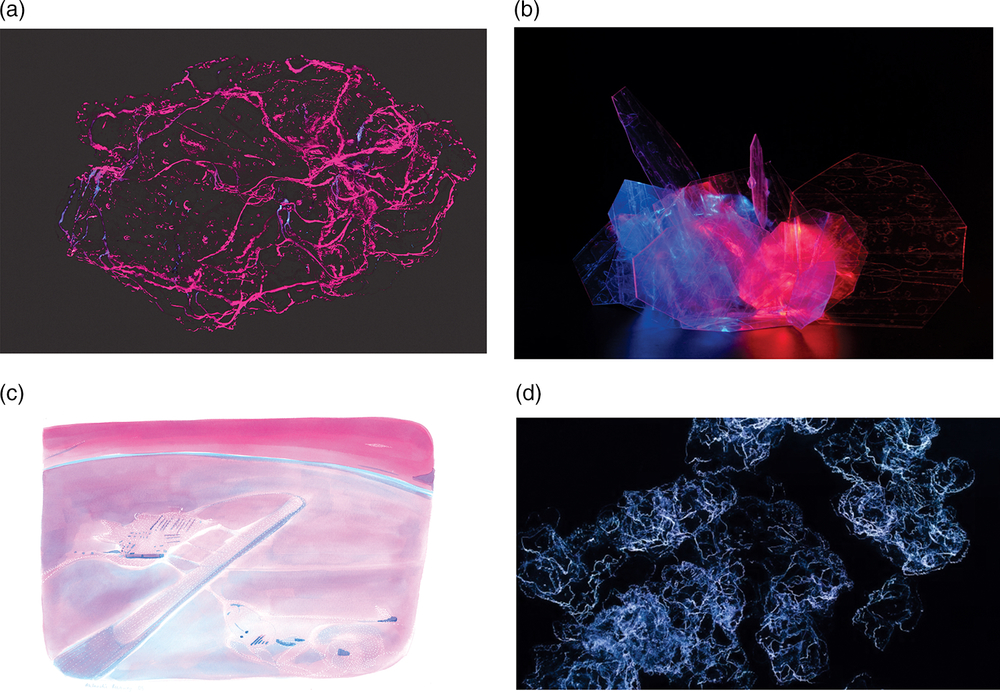
This work produced a quantitative distribution of crystal size, as well as a collection of photographs, sketches and paintings and these formed parts of the Studio Antarctica exhibition (O’Connor, Reference O’Connor2016; O’Connor & Stevens, Reference O’Connor and Stevens2018. See Fig. 9). The central piece from this exhibition, a 4 m diameter suspended disc of ice crystals made from tape, was large enough to be immersive for groups of school children, the public and scientists alike. Other parts of the exhibition featured individual portraits of crystals, parts of crystals (Fig. 10a) and crystal proxies (Fig. 10b). This provides the viewer with a connection between the large-scale climate issues they are hearing about in a variety of media channels and an individual, personal scale. Viewers are aware that “no two snowflakes are the same” and here the ice crystal equivalent also proves to be true. There is a natural tendency for viewers to look for recognisable shapes and form in the individual crystals. The work provided the intermediate step illustrating how these individuals aggregate to form a larger entity – this larger work builds its own identity (Fig. 9).
Studio Antarctica main piece, a 4 m diameter ice crystal disc made from crystal proxies set above a padded floor to aid viewing (image: M. Tantrum).
(a) individual crystal from Data Days, (b) proxy crystal formation from Studio Antarctica, (c) water colour landscape from Studio Antarctica and (d) family portrait from Data Days exhibition, image 150 mm across.
The work functions as an introduction to ideas around climate, environment and collaboration at the same time as being a contemporary art exhibition. The associated artist talks, media and published material provide background details on climate change and climate science. Within the exhibition itself, the connection to climate is made implicitly and seeks to give Antarctic ice, in different forms, personality. The gallery guides took it upon themselves to act as intermediaries to connect people to the work and so became part of the storytelling. In a similar way, students who participated in the art production also acted as intermediaries. Visitors to the exhibition leave with an enhanced understanding of what ice is, its beauty and complexity, and so probably interpret and engage with information on climate with new perspectives.
The exhibition is experiential and participatory. The works included watercolours of both the abstract (individual ice crystals) and the recognisable (aircraft-landing strip, for example Fig. 10c), some of which were painted in the containerised artists’ workshop in the field camp, in keeping with Edward Wilson’s legacy. The blues and pinks in the watercolours would seem out of place to the casual observer but are a logical response to some of the more striking views possible at such high latitudes. Over 20,000 visitors attended the three-month long show. Notably, the gallery where Studio Antarctica was shown places a significant emphasis on Māori and Pasifika culture. This is significant in the New Zealand context as there are government initiatives to enhance communication to these audiences and also for the scientists to better understand different cultural perspectives on the value and use of science (Broughton et al., Reference Broughton, Te Aitanga-a-Hauiti, Porou, McBreen, Waitaha and Tahu2015).
The activity, like most science experiments, was not an end-point but instead generated new ideas. A second field campaign a year later with similar science goals enabled an evolved Science*Art approach to documenting the crystals, as well as expanding the numbers of crystals examined. One of the advances beyond the Studio Antarctica expedition was that it was found that different colour lighting penetrated the ice in different ways. Another was the use of a fabric backdrop that had a scale-bar printed on it allowing easy measurement as well as stopping melting crystals sliding off the stage. With the greater number of crystals being measured, the artist sought to find ways to efficiently capture the data and the story of the crystals. The idea was developed of capturing portraits – both individual and “family” portraits (Fig. 10d).
Probably the biggest change in the art from the first to second K131 expedition was driven by the science. The format of the scientific sampling during the second expedition had evolved from the first ice camp. Because the ocean beneath the ice evolves with distance from the nearby Ross Ice Shelf, the field sampling included day trips by vehicle to various stations to make measurements. In this way, the data (ice-crystal family portraits) became connected to individual sampling days – the Data Days. This connects the abstract physical dimensions to the real-world challenges of weather conditions, vehicle breakdowns, meals and the personnel involved in any particular sampling day. This connection was made all the stronger because it meant the previously static photographic stage and documentation process had to be made portable and rugged. These group images can be interrogated through digital analysis, dramatically increasing the size of the dataset. The resultant Data Days exhibition (O’Connor, Reference O’Connor2017) was more constrained by gallery limitations than Studio Antarctica, but still had multiple media with video projections, a soundscape and iceberg sculptures echoing an earlier project at the start of the Science*Art collaboration (O’Connor, Reference O’Connor2011). Attendances were around 3,000 people for the week-long exhibition.
In hindsight, the scientist can suggest how these measurements could have been automated. However, these suggestions would reduce the concept of the individual crystal. The fact that the artist spent a greater amount of time examining individual crystals and asking questions about how they form, merge and dissolve provides them with a unique perspective and authenticity. The ideas and questions that emerged from this close inspection then motivated further scientific examination of available data and generated ideas for gathering of new data.
Discussion
It remains uncertain as to whether the ideas discussed here can be explicitly linked to improvements in the scientific process and outcomes. In other words, can art contribute to scientific knowledge? There are examples of clear improvement in scientific outcomes such as when a phenomenon photographed by Schulthess (Reference Schulthess1960) spawned a scientific analysis (Tricker, Reference Tricker1972). In the present situation the contribution was possible because the artist was able to commit the time and focus on a specific question in a way that the scientists had not. Beyond this, there are obvious parallels in how some artists and scientists work and, importantly, there is a place for using one’s intuition as a skilled and experienced practitioner.
Perspectives on what constitutes the “value of the art” ranges from purely representational (“come and paint my field site”) through to the supposedly abstract (photographs of a white-out). Yet these one-sided approaches miss out on a key aspect of present-day science and that is collaboration − the development and sharing of ideas, language, questions and perspectives. This is the fundamental element of Data Days. Successful collaborations typically being built around respect, shared language, and separate but connectable goals.
It is worth cross-comparing parallels between expedition types. Hodges’ work with Cook was essentially on equal footing with the science − they were on a voyage of discovery into the unknown and literally everything was new for both art and science. They simply needed to look out the porthole and observe. The work and legacy of Edward Wilson is where the art and science perspectives meet in the one person and become inseparable. Nolan’s whirlwind eight-day tour is different to Hodges’ experience as, while everything was new to him, it was against a backdrop of nascent science at a large scale. In a way it was the blueprint for some of the structured artist programmes to follow in that they provided a prescribed, repeated, set of opportunities. This is perhaps like an advanced field course where a set menu of challenges is met and experienced (cf. Glasberg, Reference Glasberg2007). Noble’s work de-coupled the art and science so as to give the art the widest possible envelope. The present work is arguably more focused, constrained and detailed than any of its predecessors. Much like the science it was twinned with, it was small-scale work looking to make discoveries that would then inform larger-scale descriptions.
Considering the Data Days exhibition in the context of mid-century Antarctic art by Law and Nolan, as well as the more recent work by Noble, O’Connor has on occasion noted she “doesn’t do people, everyone does people”. Nolan’s perspective on personality remained unknowable, hidden in a hood and sunglasses (Fig. 5), whereas Noble removed the scientist entirely, but made human residue glow. O’Connor’s Data Days works (O’Connor, Reference O’Connor2017) are, instead, a commitment to the personality of ice crystals, to their grouping and families of shapes − their idiosyncrasies. As such it has comparability with works focusing on individuals and their variability and similarity (Barnett & Whittle, Reference Barnett and Whittle2006). The viewer focuses on the continuum and interrelationships of structure.
When considering the benefits to education and science communication, the impact on audiences of the two exhibitions, Studio Antarctica and Data Days, makes for useful comparison. The Studio Antarctica exhibition was longer in duration and had a public focus with school tours and talks by both the artist and scientists. The second Data Days exhibition was shorter and initiated primarily as an opening event for a scientific conference. As such it was viewed more by scientists than by the lay public. Consequently, as well as informing the public about some of the wide variety of science that goes into understanding and predicting future science, it laid a foundation stone for educating the science community about ways to extend their own communication reach and so help normalise what is, after all, a substantial step-change in term of approach.
The educational outcomes described by O’Connor and Stevens (Reference O’Connor and Stevens2015) utilised postcards that were filled out with comments and drawings by participating students. This is an echo (that is, the student’s cards were a summary of knowledge learned after the experience) of Nolan’s use of postcards and water colour as a diary for his rapid-fire tour around Antarctica during Operation Deep Freeze. It is also at once a reflection and a counter to social media. While both are concise and multi-faceted (text and graphics), a postcard is personal, physical and limited in distribution. A social media comment is the exact opposite, impersonal (sometimes dangerously so), and relatively limitless in distribution pathways.
Given the present-day emphasis on big science and clear, achievable goals, it is useful to reflect on how scientists work and how they manage expectations around the pathway to discovery of new knowledge and also how the discoveries relate to the initial goals. In a similar way, the art works being developed here evolved from a basis of uncertain plans and how they might relate to the science that was seeking to determine how the ocean flows around an Antarctic continent ringed by ice shelves and sea ice. It is worth considering that the ice and its meltwater being studied flows north − a return journey that Edward Wilson never got to make. A return journey that follows the line of his latitudinal sketch of the Victoria Land coast (Fig. 2) – a work simultaneously containing artistic and scientific value, by an explorer who held both art and science at the core of who they were.
Author ORCIDs
Craig Stevens 0000-0002-4730-6985; Natalie Robinson 0000-0002-7837-7911
Acknowledgements
The authors thank Tim Haskell, Brett Grant, Pat Langhorne, Blake McDavitt, the New Zealand Antarctic Research Institute, Deep South and Sustainable Seas National Science Challenges, and Antarctica New Zealand. In addition, the authors acknowledge the efforts of two anonymous reviewers and the editors who provided constructive comments on earlier versions of this work as well as Pieter van der Merwe. We also thank the Australian Antarctic Division, Royal Museums Greenwich, the Nolan Trust and Scott Polar Research Institute for approval to use their archived imagery.


 Open access