

INTRODUCTION
Q fever is a widespread zoonosis caused by the bacterium Coxiella burnetii, isolated from a wide range of animals (mammals, birds and arthropods) [Reference Lang and Marrie1–3], while domestic ruminants (goats, sheep and cattle) are considered the most common animal reservoir for human infection [Reference Georgiev4]. Infected animals are often asymptomatic, but infection may cause late abortion, stillbirth, premature delivery or delivery of weak offspring [3]. Abortions are associated with the shedding in placentas and birth fluids of large amounts of bacteria [2, 3], which when inhaled in aerosol form are the main route of transmission to humans. In favourable epidemiological and weather contexts, this transmission route can lead to clustered human cases. This was highlighted by the major Q fever outbreak observed in the Netherlands from 2007 to 2010, which resulted in more than 4000 reported human cases with an obvious link to proximity to infected goat farms [Reference Schneeberger5].
The frequency of Q fever in humans is poorly known in France, but the French National Reference Centre estimates that, on average, the annual incidence of acute Q fever cases is 2·5 per 100 000 inhabitants. The main episodes of acute Q fever outbreaks in humans identified in France revealed the involvement of small ruminant infected herds with abortive episodes [2]. Furthermore, the areas with the highest incidence of acute Q fever cases in humans are those with the highest number of cattle, sheep and goats [Reference Frankel6].
As in many European countries, Q fever is not a notifiable disease in ruminants in France [2]. National recommendations on Q fever diagnosis and control were formulated in 2007, allowing farmers with clinically infected herds to voluntarily implement a control program. Nevertheless, when clusters of human cases are identified, the veterinary authorities can impose suitable control measures in herds with shedder animals, including sanitary (e.g. effluent processing) and medical (e.g. vaccination of replacement females) measures.
The epidemiological situation regarding Q fever in ruminants is poorly known in France. The few available data originate from local and heterogeneous studies based on various sampling protocols and laboratory methods [2, 3, Reference Guatteo7]. Taking into account the epidemiological role of ruminants and given the lack of reliable epidemiological data, the French Ministry of Agriculture decided to carry out a study to increase knowledge of the epidemiological situation of Q fever in domestic ruminants – cattle, sheep and goats. The study was designed and implemented by collaborative multi-stakeholder groups within the framework of the French platform for animal health surveillance (ESA Plateform).Footnote 1
The aim of this study was to estimate the serological prevalence of Q fever and the potential clinical incidence of Q fever, estimating the frequency of abortive episodes potentially related to C. burnetii, in cattle, sheep and goats, upon which public health risk assessments might be based.
METHODS
The study was based on the French mandatory surveillance of brucellosis that requires the declaration and investigation of abortions, as well as yearly serological screening. The event-driven surveillance system for brucellosis relies on the mandatory notification of abortions and the testing of aborting females for brucellosis. In the event of abortion(s), farmers have to call their veterinarian who collects specific data and blood sample from the aborting females(s) [Reference Bronner8].
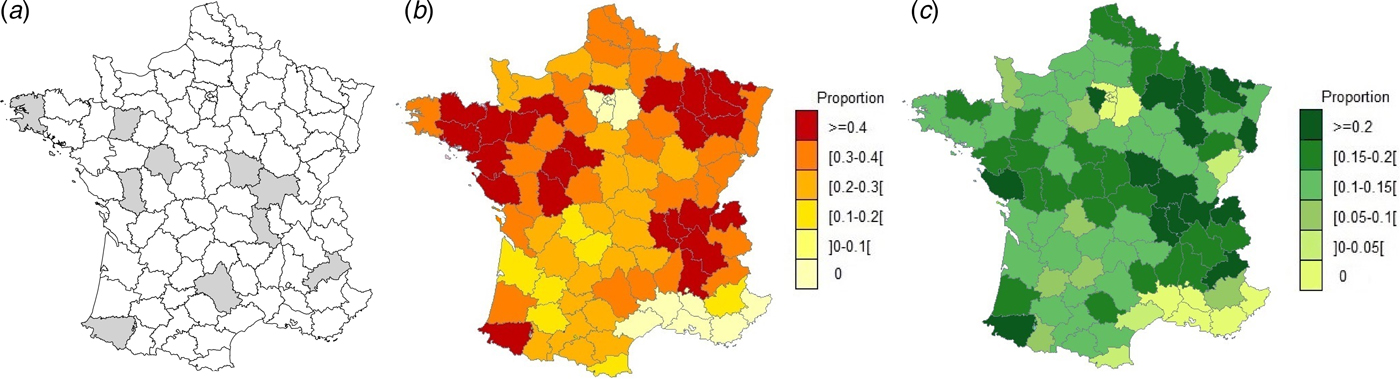
The study was carried out in 10 voluntary départements (French administrative units) having a higher than average mandatory reporting rate for abortions in cattle (Fig. 1a–c ) as this rate in small ruminants is homogenously very low in France [Reference Perrin9]. These 10 départements were also selected in order to cover various livestock systems for the three species. The study included a serological survey and a 3-year abortion surveillance scheme.
(a) Geographical location of départements included in the study, (b) departmental distribution of the proportion (mean = 0·37) of farmers having notified abortions in 2014 in dairy and (c) departmental distribution of the proportion (mean = 0·16) of farmers having notified abortions in 2014 in beef cattle farms (Data: Perrin et al., 2015).
Serological survey
The survey was designed to estimate, in each species and département, Q fever seroprevalence in non-vaccinated parous females in dairy, meat and mixed herds. The survey included randomly sampled herds having at least 20 parous females for cattle and goats and 50 parous females for sheep with no Q fever vaccination history in the past 5 years. In French herds, first parturition occurs at between 2 and 3 years of age for cattle and at around 18 months for small ruminants.
Because the performance of commercial Q fever enzyme-linked immunosorbent assay (ELISA) tests is not well known due to the absence of reference test [3], the optimal sample size was calculated assuming perfect test sensitivity and specificity. Expected between-herd seroprevalence of 50%, with precision of 20% and within-herd seroprevalence of 20%, with an acceptable α error of 5%, were targeted according to the available funding, expert opinion and literature review of serological Q fever prevalence studies [Reference Ruiz-Fons10–Reference van den Brom16]. Including a 10% margin, this resulted in the random sampling of 19–106 herds in order to include 18–96 herds per species and département (Table 1).
Results of the serological survey: sample size, testing rate and variations in average between- and within-herd seroprevalence per species
a Minimum number of herds needed to reach a precision of 20% for a target of 50% between-herd seroprevalence.
b Minimum and maximum values observed for the 10 départements; 95% CI: 95% confidence interval.
Depending on the total number of parous females in each herd, the veterinarian collected blood samples from 11 to 15 parous females conveniently selected among females that had never been vaccinated against Q fever regardless of any reproductive disorder. When possible, the blood samples were collected at the same time as those required for the mandatory surveillance of brucellosis and infectious bovine rhinotracheitis to limit the cost of the study. Samples were individually analysed by the Departmental Veterinary Laboratories (DVLs) using the LSIVet™ Ruminant Q Fever ELISA kit (ThermoFisher Scientific). Results of tested samples (S) were expressed as optical density (OD) percentages using the OD of the negative (N) and positive (P) controls: % OD = (S − N)/(P − N) × 100. As recommended by the kit's producer, samples with % OD > 40% were considered positive. A herd was considered seropositive when at least one of the 11–15 screened females showed a positive result. Individual results (positive/negative/inconclusive) as well as herd status (seropositive/seronegative) were recorded in the French national animal health information database (SIGAL, Information System of the Directorate General for Food).
Abortion surveillance scheme
Abortion surveillance aimed to estimate the frequency of abortive episodes that could be potentially related to C. burnetii and also obtain an evaluation of the potential clinical incidence of Q fever in domestic ruminant herds. Abortive episodes in herds were defined respectively as two abortions over 30 days or less for cattle and three abortions over 7 days or less for sheep and goat herds. The choice to focus on abortive episodes rather than isolated abortions was motivated by the fact that multiple abortions represent a higher risk of environmental contamination and transmission to humans. The study was performed so as to depict field conditions. It was based on the mandatory abortion reporting system for clinical brucellosis surveillance and consisted in proposing Q fever diagnosis upon the reporting of abortions for herds experiencing abortive episodes. According to the study protocol, endocervical (cattle), vaginal (sheep and goats) or placenta swabs had to be sampled from dams that had aborted within the last 8 days; for cattle, endocervical swabs were sampled at each abortion and stored by DVLs to be analysed for Q fever in case of the occurrence of second abortion within 30 days. Endocervical and vaginal swabs were preferred because placentas are not always found (notably when animals are on pasture) and can be soiled or improperly stored. Moreover, the use of endocervical or vaginal swab improves the reproducibility of the sampling method and reduces the risk of bacterial contamination by the environment. Additionally, the protocol required a specific antibody research on blood samples (six cows, 10 goats/sheep) that had to be collected from herdmates either aborted some 15 days earlier (timeframe for seroconversion) or showing reproductive disorders (metritis, infertility…) [2].
Q fever diagnosis was based on the detection and quantification of C. burnetii by real-time polymerase chain reaction (qPCR) targeting the IS1111 gene in individual or pooled analyses (pooled analyses were conducted for placentas samples (three swabs of the same placenta, swabbed by DVLs) and could be carried out in small ruminants for vaginal swabs (mix of three swabs from three different females)). The study protocol limited to two the number of qPCR analyses for each abortive episode: either two individual analyses, either two pooled analyses, either one individual analyse or one pooled analyses. The quantitative results were expressed in number of bacteria (or copies genome equivalent) using quantitative standards calibrated with the Nine Mile reference strain (containing 20 IS1111 copies). Briefly, the qPCR method was validated to detect C. burnetii for bacterial loads greater than 2 × 10² or 3 × 10² bacteria per swab (limit of detection (LD), depending on the method used) and allow absolute quantification of C. burnetii between 2 × 10² and 5 × 10² bacteria per swab (limit of quantification LQ, depending on the method used) and 2 × 10⁶ or 4 × 10⁶ bacteria per swab (maximum limit of quantification LQmax, depending on the method used) in accordance with the new French U47-600 standards [Reference Rousset17]. Previous to the study, the French National Reference Laboratory (NRL) coordinated a work to provide a standard method and determine its performance. Two qPCR commercial methods and one in-house method for a total of seven standard operating procedures (taking into account the different DNA extraction protocols) were validated. Before routine analysis, assays were achieved in each DVL for method adoption [Reference Rousset17]. Finally, the maintain of performances was monitored using control chart based on a common bacterial control calibrated at 4·0 log10 and considering the accuracy limit of 0·70 log10 bact./ml. In the absence of references enabling to correlate the levels of postpartum excretion on days 0–8 with the cause of abortion [2, 3], we estimated that abortive episodes could be ‘potentially related to C. burnetii (clinical threshold) when the number of C. burnetii bacteria detected per swab was equal or above 104 bacteria per swab for individual analyses and 103 bacteria or above for pooled analyses [18]. Serum samples were tested for specific antibodies by ELISA. All analyses were performed by DVLs, whose qPCR and serological methods for Q fever diagnosis had been approved by the Ministry of Agriculture and the NRL.
Results of laboratory analyses were interpreted at herd level depending on the qPCR and serological results [Reference Dubuc-Forfait19]: herds were classified as ‘suspected for Q fever with high excretion level’ (and the abortive episode ‘potentially related to C. burnetii’), ‘not-suspected for Q fever’ (and the abortive episode ‘not-related to C. burnetii’) or ‘suspected for Q fever with low excretion level or inconclusive results’ (and the abortive episode ‘inconclusive’) (Fig. 2).
Interpretation scheme of qPCR and ELISA results for the abortion surveillance scheme. (A) Herd classified as ‘suspected for Q fever with high excretion level’ and abortive episode potentially related to C. burnetii; (B) herd classified as ‘suspected for Q fever with low excretion level or inconclusive results’ and abortive episode inconclusive; (C) herd classified as ‘not-suspected for Q fever’ and abortive episode not attributed to C. burnetii.
RESULTS
Serological survey
Twenty-three herds were excluded because the number of tested females was below the specifications of the study. A total of 10 040 cows, 7776 ewes and 5246 goats were screened in 731 cattle (271 dairy, 460 beef), 522 sheep (148 dairy, 374 meat) and 349 dairy goat herds. Among the sampled herds, participation rate was over 75% in the three species, with high variability from 38·8% to 108·3% depending on the département and species (Table 1).
The age of sampled cows was extracted from the National Cattle Register.Footnote 2 The average age of sampled cows was around 6 years with a significant difference between dairy and beef cows (5·0 vs. 6·5, Student's t-test, P < 0·001) but no differences between départements for both production types (Kruskal–Wallis tests, P = 0·4373) (Table 2). Similarly, the proportion of sampled cows over the age of 5 years was significantly lower in dairy than in beef herds (42·4% vs. 61·8%, χ 2, P < 0·001) with no differences between départements (Kruskal–Wallis tests, P = 0·4373) (Fig. 3). For small ruminants information on age of animals was not available.
Average proportions of cows over 5-years-old sampled in dairy and beef herds per department.
Distribution of the average age (years) of cows sampled for the serological survey
Overall, between-herd seroprevalence was significantly lower (χ 2, P < 0·001) for cattle herds (mean: 36·0% (95% confidence interval: 32·5%–39·6%)) than for sheep (55·7% (51·4%–60·1%)) and goat herds (61·0% (55·7%–66·2%)) (Table 1). It was significantly higher for dairy than meat herds, for both cattle (n = 176, 64·9% (58·9%–70·6%) vs. n = 87, 18·9% (15·4%–22·8%), (χ 2, P < 0·001)) and sheep (n = 99, 75·6% (67·3%–82·7%) vs. n = 68, 39·8% (34·1%–45·7%), (χ 2, P < 0·01)) (Fig. 4b ). Between-herd seroprevalence varied between départements from 6·4% to 75·5% for cattle, 11·4% to 84·4% for sheep and 25·0% to 82·6% for goat herds (Fig. 4a ). All possible situations were observed among the départements: high (low) seroprevalence for all three species, or high (low) for cattle and conversely low (high) for small ruminants, or low for cattle and sheep but high for goats (Fig. 4a ).
Average between-herd seroprevalence (%) and 95% confidence interval (vertical black line) per species and département; (a) for all production types, (b) per production type for cattle herds (b1), and sheep flocks (b2). Mix type corresponds to herds in which dairy and beef animals are mixed.

Among seropositive herds, within-herd seroprevalence was significantly higher (χ 2, P < 0·001) in goat herds (41·5% (37·5%–45·4%)) than in cattle (22·2% (20·0%–24·3%)) and sheep herds (25·7% (23·4%–27·9%)) (Table 1). The results were similar at département level, with average within-herd seroprevalence ranging from 10·2% to 56·2% for goats, 7·0% to 36·5% for sheep and 12·2% to 30·5% for cattle. Nevertheless, the distribution of within-herd seroprevalence showed high variability (Fig. 5).
Distribution (boxplot) of the within-herd seroprevalence per species and département.
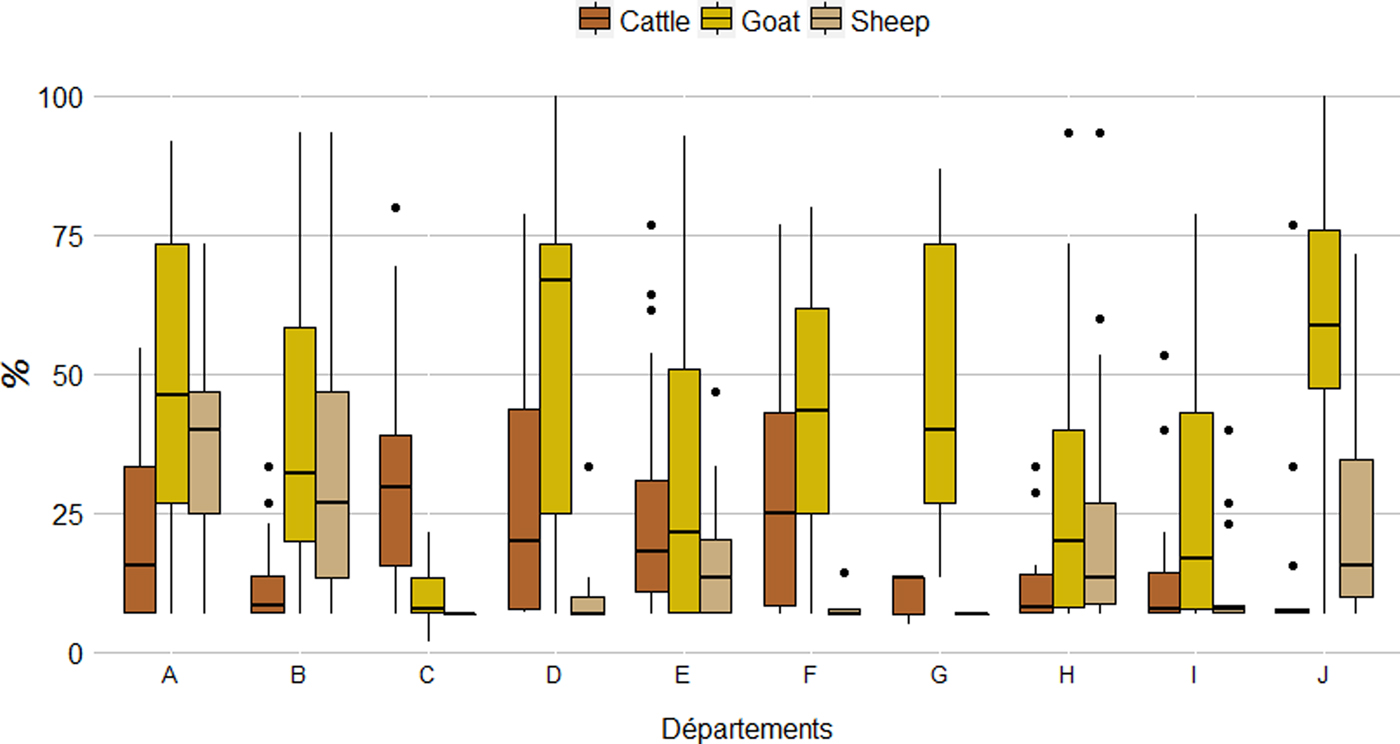
Interestingly, between- and within-herd seroprevalences at département level were not correlated whatever the species (Wilcoxon signed rank test, P = 0·013 for cattle, P = 0·002 for sheep and P = 0·001 for goats) (Figs. 4a and 5).
Abortion surveillance scheme
A total of 3324, 776 and 114 abortive episodes were investigated respectively, in 2695 cattle, 658 sheep and 105 goat herds, with a median of one abortive episode investigated per herd during the study period (maximum of seven in cattle, four in sheep and two in goat herds). The participation rate in herds having at least one abortive episode recorded in SIGAL during the period of the study was high, with 90·1% herd participation and 76·9% of abortive episodes included for cattle and 76·5% herd participation and 76·3% of abortive episodes for small ruminants.
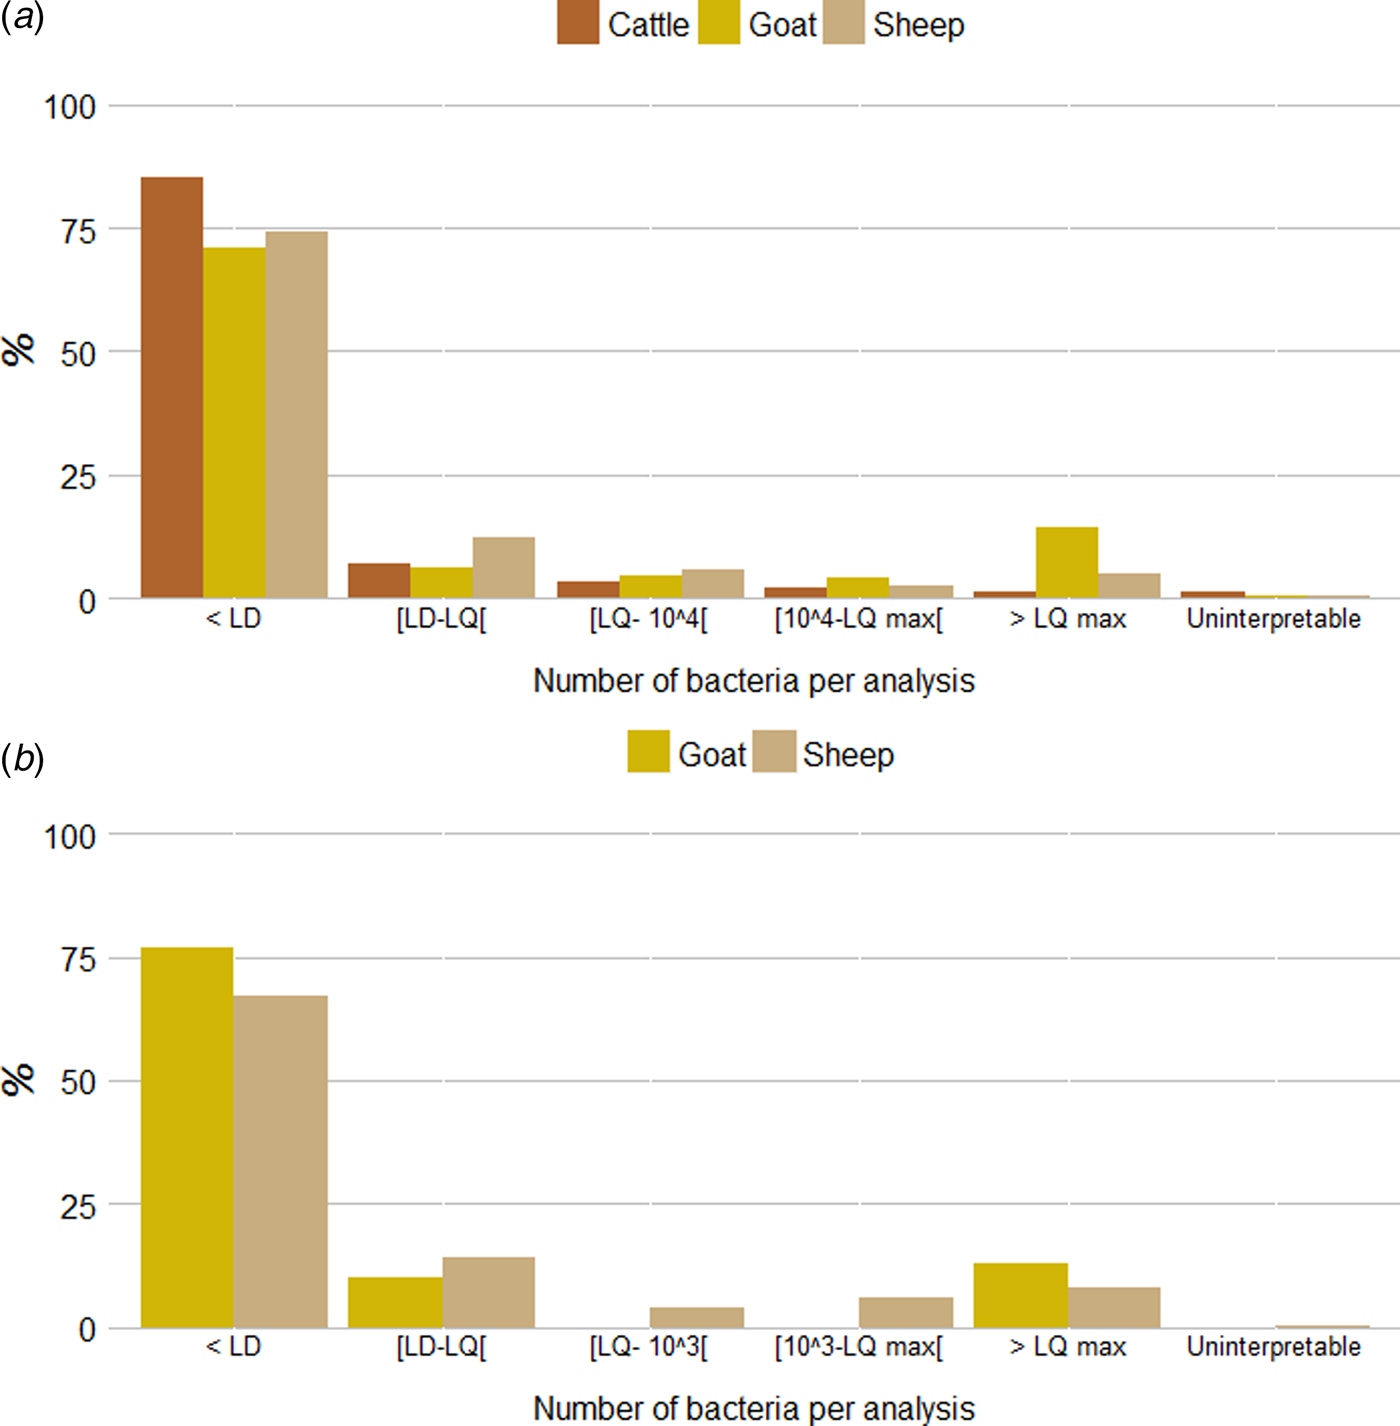
The vast majority of samples received in DVLs were endocervical or vaginal swabs (respectively from 6675 cattle, 1695 sheep and 229 goat herds). Analyses were also carried out for the few placentas received (from respectively 143 cattle, 34 sheep and 17 goat herds). Among the individual qPCR analyses realized from endocervical or vaginal swabs (6675 individual cattle, 1450 individual sheep and 199 individual goat qPCR analyses), the proportion of qPCR results below the LD was 85·2% (n = 5689) in cattle, 74·3% (n = 1077) in sheep and 70·9% (n = 141) in goats while the proportion of results above the clinical threshold (104 bacteria per swab) was 3·4% (n = 226) in cattle, 7·2% (n = 105) in sheep and 18·1% (n = 36) in goats. Lastly, the proportion of results above the maximum limit of quantification was 1·2% (n = 79) for cattle, 4·8% (n = 70) for sheep and 14·1% (n = 28) for goats (Fig. 6a ). A similar pattern was observed for the pooled qPCR analyses realized from vaginal swabs obtained from the 245 pooled sheep analyses and 30 pooled goat analyses (Fig. 6b ): the proportion of qPCR results below the LD was 66·9% (n = 164) in sheep and 76·7% (n = 23) in goats while the proportion above the clinical threshold (103 bacteria per pool) was 14·3% (n = 35) in sheep and 13·3% (n = 4) in goats. Lastly, the proportion above the maximum limit of quantification was 8·2% (n = 20) for sheep and 13·3% (n = 4) for goats (Fig. 6b ).
Quantitative results for (a) individual and (b) pooled qPCR analyses per species (from endocervical or vaginal swabs). LD: limit of detection (2 × 10² or 3 × 10² bacteria per swab, depending on the method used); LQ: limit of quantification (2 × 10² or 5 × 10² bacteria per swab, depending on the method used); LQmax: maximum limit of quantification (2 × 10⁶ or 4 × 10⁶ bacteria per swab, depending on the method used).
Overall, among the abortive episodes investigated, we estimated that 2·7% (n = 90), 6·2% (n = 48) and 16·7% (n = 19) could be potentially related to C. burnetii in cattle, sheep and goat herds, respectively. For herds having more than one abortive episode investigated during the study period (482 cattle, 97 sheep and 10 goat herds concerned), the conclusion among the episodes (putative implication of Q fever) was coherent for 407 cattle, 73 sheep and six goat herds.
At herd level, 3·3% (n = 90) of the included cattle herds were considered as ‘suspected for Q fever with high excretion level’ at least once over the study period; this proportion was 6·8% (n = 45) for sheep and 18·1% (n = 19) for goat herds (Table 3). By applying interpretation scheme of laboratory results for the abortion surveillance scheme (Fig. 2), serological results were used (besides qPCR results) to conclude on herd status in a small proportion of abortive episodes investigated: 1·4% (n = 48) in cattle, 0·9% (n = 7) in sheep and 0% (n = 0) in goats.
Q fever imputability at abortive episode and herd levels according to the abortion surveillance scheme per species
a Minimum and maximum values for the 10 départements included in the study.
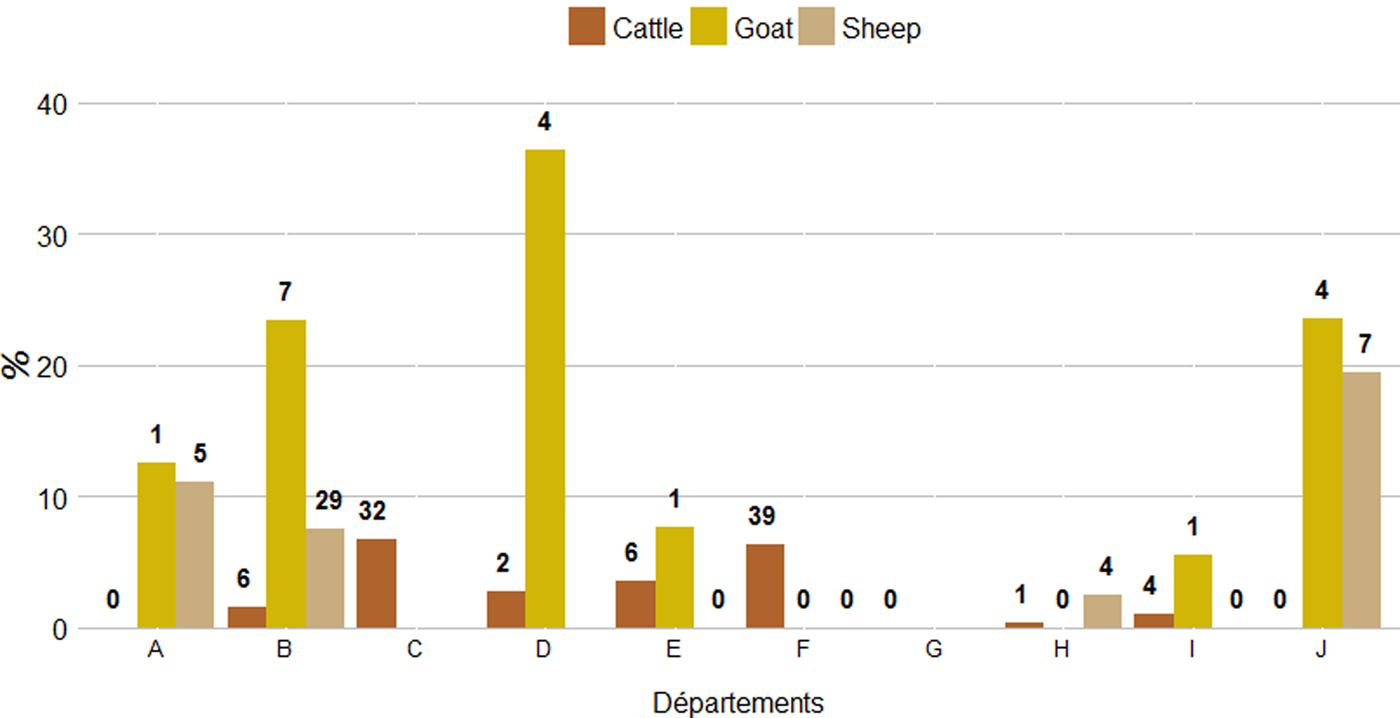
The proportions of abortive episodes ‘potentially related to C. burnetii’ and herds ‘suspected for Q fever with high excretion level’ were both significantly higher in goat than in sheep herds, and higher in sheep herds than in cattle herds (χ 2, P < 0·05). The proportion of abortive episodes ‘potentially related to C. burnetii’ varied strongly among départements, from 0% to 5·1% (standard deviation (SD) = 2·0%) in cattle herds, 0% to 17·9% (SD = 6·8%) in sheep herds and 0% to 36·4% (SD = 13·4%) in goat herds. Accordingly, the same pattern was observed for the proportion of herds ‘suspected for Q fever with high excretion level’, which varied from 0% to 6·7% (SD = 2·6%) for cattle, 0% to 19·4% (SD = 7·4%) for sheep and 0% to 36·4% (SD = 13·8%) for goats (Fig. 7).
Proportion and number (in bolded numbers) of herds ‘suspected for Q fever with high excretion level’ per département and species.
DISCUSSION
This is the first time in France that a large-scale study on the frequency of abortive episodes that could be potentially related to C. burnetii and seroprevalence of Q fever was conducted simultaneously in the three main domestic ruminant species and considering both dairy and meat herds. The participating départements were representative of the diversity of French farming practices but not of all French départements. Thus, the results of this study cannot be extrapolated to overall French ruminant populations.
High participation rates for both the abortion surveillance scheme and the serological survey
The participating départements had a higher than average mandatory reporting rate for abortions and farmers were therefore much more motivated to participate in the study. Moreover, the costs of veterinary and laboratory analyses were largely funded by the French Ministry of Agriculture and the National Animal Health Farmers’ Organization (GDS France). This could explain the high participation rates for both the abortion surveillance scheme and the serological survey. Furthermore, the fact that Q fever-infected herds are not required by law to implement mandatory management measures and the commitment to the confidentiality of results, likely facilitated the involvement of farmers. However, the under-reporting of abortions appear frequent (around 75% in cattle and even higher in small ruminants) because most farmers and veterinarians perceived the risk of brucellosis outbreak as negligible [Reference Bronner8]. Therefore, it is probable that a non-negligible part of abortive episodes escaped the abortion surveillance scheme.
Domestic ruminants frequently exposed to Q fever in France
The serological survey results suggested that domestic ruminants are frequently exposed to Q fever in France. The average between-herd seroprevalence in the 10 investigated départements (36·0%, 55·7% and 61·0%, respectively for cattle, sheep and goats) may seem high compared with the results of most recent serological surveys in European countries [Reference Ryan11, Reference Schimmer14, Reference van den Brom16, Reference Anastacio20–Reference Ohlson24]. Only three studies revealed higher between-herd seroprevalences: 43% and 74% of Spanish cattle and sheep herds were seropositive in the study by Ruiz-Fons [Reference Ruiz-Fons10] while this figure was 48·4% for Northern-Ireland cattle herds [Reference McCaughey13] and 72·3% for dairy herds in Germany [Reference Bottcher25]. Nevertheless, the results of these studies should be compared with caution due to methodological differences concerning the serological methods used, the sampled animals (number, age, production type) and the geographical location of the herds. In particular, differences in the age structure of the samples could partly explain the seroprevalence differences, as age has been identified as a risk factor of seropositivity in previous studies [Reference Anastacio20, Reference Taurel26]. Indeed, lower between-herd seroprevalences were reported in younger populations, including non-parous females: 6·9% in Irish cattle [Reference Ryan11], 14·5% and 17·9% in Dutch sheep and goats [Reference van den Brom27] and 5·0% and 11·1% in Swiss sheep and goats [Reference Magouras23]. Conversely, in our study, only parous females were sampled, i.e. females over 18 months of age with a median age of cows over 5 years (Table 2). This was consistent with the results of studies based on the analysis of bulk tank milk, which considered only parous females and showed higher between-herd seroprevalences both for cattle (37·0% in Ireland [Reference Ryan11] and 59·0% to 78·6% in the Netherlands [Reference Agger28, Reference Muskens29]) and goats (67·6% in Spain [Reference Garcia-Perez15]). Besides, higher between-herd seroprevalences are usually observed in dairy herds, for the three species [Reference McCaughey13, Reference van den Brom16]. The French situation did not differ, with between-herd seroprevalence two to three times higher for dairy than for meat sheep and cattle herds respectively, despite a lower average age for sampled cows. Farming practices, including more intensive systems and larger herd sizes, are usually cited as the main explanation for this difference [Reference Schimmer14, Reference Anastacio20].
Strong regional variability has been found in various countries and is generally related to local variations in animal densities [Reference Lambton22, Reference Ohlson24]. Accordingly, in our study, the highest between-herd seroprevalences were mainly observed in the departements with the highest herd densities. Besides, in France, local farming practices, such as mixing species in the same herd or mixing herds and species in mountain pastures, may explain the high between-herd seroprevalence observed in some départements. The influence of environmental conditions is also possible as evidenced for human Q fever incidence [Reference van Leuken30].
Concerning within-herd seroprevalence, our results were consistent with those of other studies that described median within-herd seroprevalences that were generally low and always below 50% [Reference Ruiz-Fons10, Reference Ryan11, Reference Schimmer14, Reference Lambton22]. The higher within-herd seroprevalence observed in seropositive goat herds (Fig. 4) has also been observed in other countries, in accordance with the higher level of bacterial shedding in the event of abortions observed for goats in our study.
It is worth noting that, although vaccination was an exclusion criterion, we cannot completely rule out the hypothesis that several vaccinated females may have been included in the study due to recall bias in farmers. The main reason is that a bivalent vaccine against Chlamydia and C. burnetii was commonly used in France, particularly in small ruminant herds, even when Q fever was not specifically targeted by the farmers. Therefore, both between- and within-herd seroprevalences may be slightly overestimated, especially for small ruminants for which the use of preventive vaccination against Chlamydiosis and Q fever is more frequent than for cattle. The sampling of potentially vaccinated females over 5-years-old, in herds having stopped vaccination for more than 5 years, did not probably strongly affect our prevalence results. Indeed, in French small ruminants herds, few goats and ewes reaches the age of 5: we estimated that the proportion of females over the age of 5 years is around 10% and 18% in goat and sheep herds, respectively. Additionally, the between-herd prevalence in dairy and beef cattle herds was not correlated with the proportion of sampled females over 5-years-old (Spearman tests, P = 0·623 for dairy and P = 0·387 for beef herds).
Low to moderate frequency of abortions potentially related to Q fever
The 3-year study revealed that the proportion of abortive episodes potentially related to C. burnetii varied greatly between species. Indeed, in our study we estimated that, in cattle herds, only 2·7% of the abortive episodes investigated could be potentially related to C. burnetii; this low proportion is consistent with other studies, which concluded that C. burnetii is an infrequent cause of abortion in cattle [Reference Agerholm31–Reference Muskens34]. In our study, we estimated that 6·2% and 16·7% of the abortive episodes in sheep and goat herds could potentially be related to C. burnetii, respectively. Previous studies in sheep and goat herds showed contrasted results across countries with frequency varying from 1% to 11% [Reference Magouras23, Reference Chanton-Greutmann35–Reference van den Brom38]. Nevertheless, it is difficult to compare our results with other studies due to methodological differences regarding sampling strategies and diagnostic tests. In particular, we drew conclusions on the etiology of abortive episodes at herd level but not of each abortion. Moreover, the results of laboratory analyses were interpreted based on both qPCR and serological results and we suggested a clinical threshold to define herds ‘suspected for Q fever with high excretion level’ while, in most studies, the diagnosis of Q fever was limited to C. burnetii detection. Interestingly, Hazlett et al. [Reference Hazlett39] also highlighted the relevance of defining a clinical threshold to improve the differential diagnosis of endemic abortive diseases. Lastly, because swabs were sampled until 8 days post abortion, the proportion of abortive episodes which we estimated potentially related to C. burnetii may be slightly underestimated; indeed, several publications have underlined that levels of excretion rapidly decrease over time in cattle [Reference Guatteo, Joly and Beaudeau40], goats [Reference Arricau Bouvery41] or sheep [Reference Joulie42], therefore highlighting the need to collect samples as soon as possible after abortion to limit false negative results.
In our study, clinical thresholds were set at 104 bacteria per swab for individual and 103 for pooled analyses. This point is questionable. Studies describing excretion levels both in animals that abort due to C. burnetii and in animals that just excrete the bacterium post-partum would be useful to check the relevance of such thresholds. Besides, the level of shedding probably differs over time between species, individual animals and probably between circulating strains [Reference Joulie42].
In our study, the proportions of abortive episodes potentially related to C. burnetii and herds ‘suspected for Q fever with high excretion level’, as well as the proportion of qPCR analyses above the maximum limit of quantification were significantly higher in goat than in sheep herds and higher in sheep than in cattle herds. These results should be considered in relation to different farming practices between small ruminants and cattle; in particular, the grouping of births in small ruminants without the isolation of parturient females could increase the exposure of females in the event of bacterial shedding.
CONCLUSION
Our study showed that whenever Q fever circulates in a population (inducing high seroprevalence), the overall frequency of abortive episodes which we estimated being potentially related to C. burnetii remains nonetheless low to moderate. In this context, setting up a nationwide Q fever abortion surveillance scheme should not be relevant. However, as Q fever is highly significant for both public and veterinary health, C. burnetii has been included as a first-priority pathogen tested in the differential diagnosis of abortions, for which harmonized national protocols were recently finalized within the framework of the ESA Platform. Additionally, the harmonization of the large-scale diagnosis of Q fever abortion is a key step to improve the performance of the surveillance of infectious abortions in ruminants.
ACKNOWLEDGEMENTS
This study was funded by the Directorate General for Food (DGAL) of the Ministry of Agriculture and the National Animal Health Farmers’ Organization (GDS France). In addition, the authors would like to thank the farmers who participated in this study, the veterinarians who collected the samples, the Departmental Veterinary Laboratories that performed the analyses and the Animal Health Farmers’ Organizations that coordinated the study locally.
DECLARATION OF INTEREST
None.


