




Introduction
Silage maize (Zea mays L.) is one of the most widely cultivated crops in Central Europe and holds the second largest share of arable land after winter wheat in Germany (Eurostat, 2025). However, silage maize yields vary considerably between regions (Statistisches Bundesamt, Reference Bundesamt2024), due to distinct soil and climate conditions, as well as year-specific factors such as delayed sowing dates caused by adverse weather conditions in spring. Given its importance in animal nutrition and energy supply and with regard to increasing climate variability and drought risk, reliable prediction of silage maize yield is highly relevant. Being able to incorporate effects of the environment and to provide better insights into the underlying processes of plant growth, crop simulation models are important tools for forecasting food security and yield gaps under changing climate conditions (Gavasso-Rita et al., Reference Gavasso-Rita, Papalexiou, Li, Elshorbagy, Li and Schuster-Wallace2023; van Wart et al., Reference van, J, Peng, Milner and Cassman2013).
Distinct modelling efforts in process-based maize simulation started with CERES-Maize (Jones and Kiniry, Reference Jones and Kiniry1986), which was later incorporated into the DSSAT cropping system framework as CSM-CERES-Maize and continuously further developed. Subsequently, alternative modelling approaches such as HYBRID-Maize were developed, focusing on hybrid-specific parameterization and improved representation of root growth and water deficit responses (Yang et al., Reference Yang, Dobermann, Lindquist, Walters, Arkebauer and Cassman2004, Reference Yang, Dobermann, Cassman, Walters and Grassini2016, Reference Yang, Grassini, Cassman, Aiken and Coyne2017). Australian researchers developed a modelling framework named APSIM adjusted to their respective site conditions, building on concepts from earlier models such as CERES-Maize (Holzworth et al., Reference Holzworth, Huth, deVoil, Zurcher, Herrmann, McLean, Chenu, van Oosterom, Snow, Murphy, Moore, Brown, Whish, Verrall, Fainges, Bell, Peake, Poulton, Hochman, Thorburn, Gaydon, Dalgliesh, Rodriguez, Cox, Chapman, Doherty, Teixeira, Sharp, Cichota, Vogeler, Li, Wang, Hammer, Robertson, Dimes, Whitbread, Hunt, van Rees, McClelland, Carberry, Hargreaves, MacLeod, McDonald, Harsdorf, Wedgwood and Keating2014; Keating et al., Reference Keating, Carberry, Hammer, Probert, Robertson, Holzworth, Huth, Hargreaves, Meinke, Hochman, McLean, Verburg, Snow, Dimes, Silburn, Wang, Brown, Bristow, Asseng, Chapman, McCown, Freebairn and Smith2003). These models are widely used and have proven their applicability across different environments (Bassu et al., Reference Bassu, Brisson, Durand, Boote, Lizaso, Jones, Rosenzweig, Ruane, Adam, Baron, Basso, Biernath, Boogaard, Conijn, Corbeels, Deryng, de Sanctis, Gayler, Grassini, Hatfield, Hoek, Izaurralde, Jongschaap, Kemanian, Kersebaum, Kim, Kumar, Makowski, Müller, Nendel, Priesack, Pravia, Sau, Shcherbak, Tao, Teixeira, Timlin and Waha2014). However, maize growth models were primarily developed for grain maize production systems, where yield formation is largely determined by kernel number and grain filling. In contrast, silage maize production targets total above-ground biomass at earlier harvest date. Furthermore, breeding efforts for grain maize and silage maize diverge already since decades (Barrière et al., Reference Barrière, Alber, Dolstra, Lapierre, Motto, Amando Ordás Pérez, Vlasminkel, Welcker and Monod2006), leading to differences in biomass formation, canopy development and dry matter partitioning.
As a consequence, existing maize models may not adequately represent silage maize systems. This limitation has been demonstrated by recent efforts to adapt APSIM for silage maize under Northern European conditions, where biomass production was systematically underestimated (Morel et al., Reference Morel, Parsons, Halling, Kumar, Peake, Bergkvist, Brown and Hetta2020). The discrepancies have been attributed to radiation regimes and day length at high latitudes, but they may also reflect structural limitations in the representation of biomass allocation. Hybrid-specific parameterization of Morel et al. (Reference Morel, Parsons, Halling, Kumar, Peake, Bergkvist, Brown and Hetta2020) was solely implemented via phenological parameters (e.g. thermal time and phyllochrons). Taube et al. (Reference Taube, Vogeler, Kluß, Herrmann, Hasler, Rath, Loges and Malisch2020) have shown that there is a constant yield progress in silage maize in Northwest Europe that can be traced back to improved physiological properties of new hybrids facing increased temperature due to climate change, such as a higher radiation use efficiency. Thus, for a permanently usable model, it is necessary to analyse which growth parameters have to be adaptable to provide reliable results in future.
The current study presents HUME-Maize (Hannover University Modelling Environment), a process-based model specifically tailored to silage maize systems, expanding the HUME framework which has already demonstrated its success in simulating yield formation for winter wheat (Henke et al., Reference Henke, Böttcher, Neukam, Sieling and Kage2008; Johnen et al., Reference Johnen, Boettcher and Kage2014; Ratjen and Kage, Reference Ratjen and Kage2015; Ratjen et al., Reference Ratjen, Lemaire, Kage, Plénet and Justes2018), winter oilseed rape (Böttcher et al., Reference Böttcher, Weymann, Pullens, Olesen and Kage2020) and winter sugar beet (Stephan et al., Reference Stephan, Böttcher, Sieling and Kage2020) under Northern European climate conditions. It offers an object-orientated, component-based and highly adaptable modelling environment that allows a more direct integration of crop-specific processes and trait-based parameterization. The framework integrates and combines established process representations from different modelling approaches, allowing individual components to be adapted, replaced or further developed depending on the research question. For model development, this flexibility is particularly relevant as the focus lies not only on yield prediction but on analysing physiological differences between hybrids in biomass partitioning and radiation use efficiency.
In the current study, data from a field trial at two German locations conducted in 2007–2008 with a hybrid released in 2006 and a field trial at three locations conducted in 2021–2022 (Schwarz et al., Reference Schwarz, Kayser, Bukowiecki, Herrmann, Isselstein, Kage and Komainda2025) with a hybrid released in 2018 are used for the development of the silage maize-specific growth model HUME-Maize. Besides the development of a baseline model with the older hybrid, the current study aims to identify (I) which hybrid-specific physiological traits need to be adjusted to capture genotype-related differences in yield formation and canopy development, (II) the model’s ability to predict silage maize final yield at a larger scale. The latter is validated using an extensive German-wide evaluation dataset (n: 264) from 2006–2021 including both previously studied hybrids.
Material and methods
Data sets
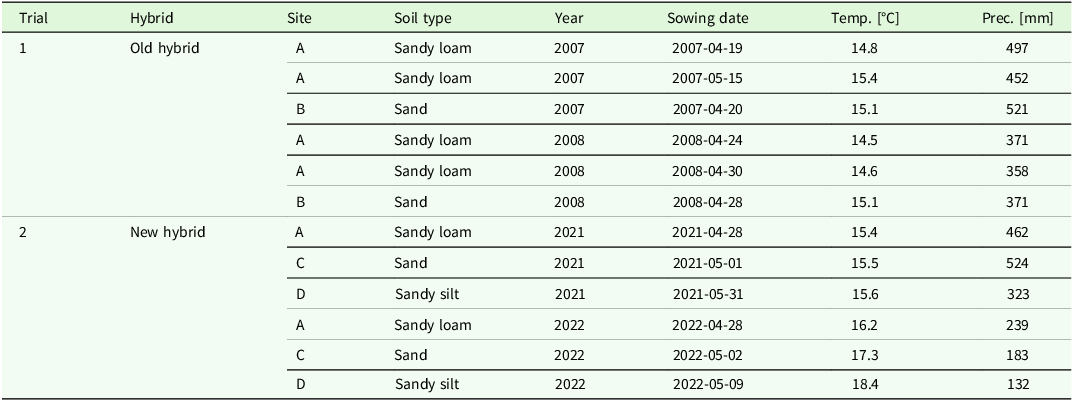
As basis for the development of the baseline model with crop-specific modifications for the older hybrid served a dataset of a field trial conducted in 2006 and 2007 at two sites in Northern Germany (Hohenschulen and Karkendam, experimental farms of Kiel University). The data base for the evaluation of possibly necessary genotype-specific adaptations consists of field trials conducted over two years (2021, 2022) at three distinct sites in Northern to Central Germany under maritime to temperate agro-climatic conditions (Schwarz et al., Reference Schwarz, Kayser, Bukowiecki, Herrmann, Isselstein, Kage and Komainda2025). The grown hybrids are both mid-early hybrids, KWS Ronaldinio in 2006–2007 (release year 2006, ‘old hybrid’) and KWS Gunnario in 2021–2022 (release year 2018, ‘new hybrid’). A third data set of one site and two years (2021–2022) was used for root parameterization only (further detailed in Appendix A, ‘Root growth’) using hybrid KWS Stefano. All trials had a randomized block design with 4 replications per treatment. The nitrogen (N) fertilization was high enough to exclude N stress with N rates ≥180 kg N/ha. Geographical positioning, soil texture, year of study and sowing dates varied across trial sites, as detailed in Table 1. Meteorological data were retrieved from the German Meteorological Service (Wetterdienst, Reference Wetterdienst2023), using R code of the Institute of Crop Science and Plant Breeding of Kiel University (https://github.com/AgronomyKiel/Weatherfunctions), exhibiting notable discrepancies between sites and across different years (Table 1).
Overview of datasets used for baseline model build (Trial 1) and genotype-specific adaptation (Trial 2). Site A: experimental farm Hohenschulen of Kiel University (54.18°N, 9.58°E, 18 m a.s.l.), Site B: experimental farm Karkendamm of Kiel University (53.55°N, 9.56°E, 18 m a.s.l.), Site C: experimental farm Wehnen of the Agricultural Chamber of Lower Saxony (51.49°N, 9.93°, 8 m a.s.l.), Site D: experimental site at Bad Hersfeld, managed by the Hessen Department of Agricultural Affairs (51.59°N, 9.85°E, 202 m a.s.l.). Temperature (Temp.) is averaged and precipitation (Prec.) is summed up from sowing till harvest date

Table 1. Long description
The table presents data for two trials involving different hybrids. Trial 1 focuses on an old hybrid and includes data from 2007 and 2008 at sites A and B, with soil types sandy loam and sand. Trial 2 involves a new hybrid and includes data from 2021 and 2022 at sites A, C, and D, with soil types sandy loam, sand, and sandy silt. The table lists the year, sowing date, average temperature in degrees Celsius, and total precipitation in millimeters for each trial. Notable trends include variations in temperature and precipitation across different sites and years.
Biomass production was consistently measured sequentially over several dates of the growing season by means of destructive manual sampling. For this purpose, at least 10 plants per plot were harvested and weighted fresh and dry. In order to assign the dry matter weights to a specific area, lengths of harvested maize rows were determined to form a parallelogram and determine its area. An aliquot of the harvested plants was fractionated into the organs, leaf, stem and cob (DMleaf, DMstem, DMcob). The dry matter of the small generative organs, husk and panicle, was assigned to cob dry matter. For all organs, DM was determined and summarized to DMshoot. For each sampling date, green area index (GAI) was determined by scanning the leaves (LAI) and stems (SAI) using the LAI-3100 (LI-COR, Inc., Lincoln, NE, USA). In the field trials in 2021–2022, GAI was additionally monitored by drone-based multispectral measurements with a SequoiaTM camera (Parrot Sequoia, Parrot Drones SAS, 143 Paris, France), applying a corresponding GAI calibration for silage maize (Bukowiecki et al., Reference Bukowiecki, Rose, Holzhauser, Rothardt, Rose, Komainda, Herrmann and Kage2024). Crop height was measured in all field trials, just as BBCH growth stage (Lancashire et al., Reference Lancashire, Bleiholder, van den Boom, Langelüddeke, Strauss, Weber and Witzenberger1991). The number of leaves was only determined frequently during the growing season 2008.
The prediction of final yield with the baseline model and the hybrid-specific parameters was evaluated using a large dataset (n: 287) comprising silage maize yield data of the two regarded hybrids. The dataset consists of 67 sites distributed all over Germany (Figure 1), collected during a time span of 14 years (2006 to 2021). The data were sourced from national hybrid trials published by the agricultural chambers and institutions of the federal states of Germany on https://www.isip.de/versuchsberichte. Soil textures were derived from the German soil map (BÜK200, Bundesanstalt für Geowissenschaften und Rohstoffe) from 0–200 cm, summarized in up to four different soil layers.
Trial sites (n = 68) of calibration (triangles) and evaluation data (crosses). Colours indicate the two tested hybrids (blue: old hybrid; KWS Ronaldinio, red: new hybrid; KWS Gunnario).

Figure 1. Long description
Trial sites (n=68) of calibration (triangles) and evaluation data (crosses). Colors indicate the two tested hybrids (blue: old hybrid; KWS Ronaldinio, red: new hybrid; KWS Gunnario).
Development of the HUME-Maize model
The silage maize crop growth model was built in the modelling environment HUME (https://github.com/AgronomyKiel/HUME, Kage and Stützel, Reference Kage and Stützel1999b). Within HUME, there are several components depicting different parts of the soil-water-atmosphere-plant continuum. The components of this library used for the maize crop growth model (dry matter production, dry matter partitioning) are briefly described in the following, with focus on the crop-specific changes and possible adjustment screws for hybrid-specific differences. Model equations can be found in the supplementary material Appendix A, eq. A 1–A 49, as well as the full descriptions of the general components, plant development, root growth, evapotranspiration and soil water balance. A list of all parameter values can be found in Appendix B – List of model parameters (Table B1). Crop- and hybrid-specific fits of parameters were either derived by chosen scientific studies or computed by linear regression based on the trial data (Table B1).
Dry matter production
Within season, daily dry matter production ( ${{\rm dDM}_{{\rm tot}} \over {\rm dt}}$
) is driven by absorbed photosynthetic radiation (Q, MJ/m2d) and potential light use efficiency (LUEpot g/MJ PAR) (1):
${{\rm dDM}_{{\rm tot}} \over {\rm dt}}$
) is driven by absorbed photosynthetic radiation (Q, MJ/m2d) and potential light use efficiency (LUEpot g/MJ PAR) (1): ${{\rm dDM}_{{\rm tot}} \over {\rm dt}}={\rm Q^{*}}LUE_{pot}{\rm ^{*}{\rm f}}_{{\rm T}}{\rm ^{*}{\rm f}}_{{\rm SWDF}}$
With fT, a temperature weight factor for photosynthetic activity [-], ranging between 0 to 1 and calculated with a trapezoidal function (Porter and Gawith, Reference Porter and Gawith1999) (A 14) and the soil water deficit factor (fSWDF). The Q is calculated according to the Beer–Lambert law (Monsi, Reference Monsi1953), using the photosynthetically active radiation (PAR, MJ/m2d) and green area index (GAI, m2/m2) as input variable. Thereby, utilized PAR is an approximation, as it is commonly referred to as half of global radiation (GR, MJ/m2d, Szeicz, Reference Szeicz1974): ${\rm Q}={{\rm PAR}^{*}}\left(1-{\rm e}^{{-{\rm k}_{{\rm PAR}}}{\rm *GAI}}\right)$
with a constant extinction coefficient kPAR [-], which is set to 0.654 (Rose et al., Reference Rose, Rose and Kage2023). The GAI [m2/m2] is an external value provided by the dry matter partitioning component. The LUEpot decreases linearly with increasing Q, describing the effect of light saturation of the single leaf photosynthesis with higher irradiance at the canopy level (Kage, Alt, and Stützel Reference Kage, Alt and Stützel2001a; Kage, Stützel, and Alt Reference Kage, Stützel and Alt2001b). In contrast to many crop growth models, where radiation use efficiency is assumed to be constant or only indirectly affected by environmental stress factors, this approach explicitly accounts for the decline in efficiency at high radiation levels. ${\rm LUE}_{{\rm pot}}={\rm LUE}_{0}-{\rm LUE}_{{\rm slope}}{\rm ^{*}{\rm PAR}}$
with LUE0 [-] and LUEslope [-] as regression parameters, which were optimized by the model internal Levenberg-Marquard algorithm. In case of drought stress, LUEpot is reduced by the fSWDF [-], originally proposed in a peanut growth model (Ferreyra et al., Reference Ferreyra, Dardanelli, Pachepsky, Collino, Faustinelli, Giambastiani, Reddy and Jones2003), describing the effects of water stress as non-linear function. This formulation allows for a more gradual decline in LUEpot under moderate stress and a stronger limitation under severe drought conditions, which was not accounted in another maize model. ${\rm f}_{{\rm SWDF}}=1-{{\rm T}_{{\rm act}} \over {\rm T}_{{\rm pot}}}^{SWDF}$
with the ratio between actual transpiration (Tact, mm/d) and potential transpiration (Tpot mm/d) and a power value SWDF [-] describing the non-linear relation of fSWDF. The parameter SWDF was set to 1.6 after model internal optimization.
Dry matter partitioning
In the first step, the daily produced DMtot is divided into shoot dry matter (DMshoot) and root dry matter (DMroot, eq. A 15, A 16). The DMshoot is further distributed between the leaf dry matter (DMleaf), the stem dry matter (DMstem) and the cob dry matter (DMcob, A 20) by dry matter allocation factors fleaf [-]and fcob [-]. These factors describe the growth of the leaf and cob fractions over the numeric development stages, named XStage (translated BBCH stages, for further information see Appendix A, ‘Plant development’):
 \[{{\rm{f}}_{{\rm{leaf}}}} = {\rm{ }}\left\{ {\begin{array}{*{20}{c}}
{{\rm{XStage}}\;{\rm{*}}{{\rm{f}}_{{\rm{leafslope}}}}{\mkern 1mu} {\rm{ + }}{\mkern 1mu} {{\rm{f}}_{{\rm{leaf0}}}}} \hfill & {{\rm{|}}\;{\rm{XStage > 1}}} \hfill \\
{{\rm{deca}}{{\rm{y}}_{\rm{a}}}\;{\rm{*}}\;{\rm{XStag}}{{\rm{e}}^{{\rm{deca}}{{\rm{y}}_{\rm{b}}}}}} \hfill & {{\rm{|}}\;{\rm{GAI > GA}}{{\rm{I}}_{\max }}} \hfill \\
\end{array}} \right.\;\]
\[{{\rm{f}}_{{\rm{leaf}}}} = {\rm{ }}\left\{ {\begin{array}{*{20}{c}}
{{\rm{XStage}}\;{\rm{*}}{{\rm{f}}_{{\rm{leafslope}}}}{\mkern 1mu} {\rm{ + }}{\mkern 1mu} {{\rm{f}}_{{\rm{leaf0}}}}} \hfill & {{\rm{|}}\;{\rm{XStage > 1}}} \hfill \\
{{\rm{deca}}{{\rm{y}}_{\rm{a}}}\;{\rm{*}}\;{\rm{XStag}}{{\rm{e}}^{{\rm{deca}}{{\rm{y}}_{\rm{b}}}}}} \hfill & {{\rm{|}}\;{\rm{GAI > GA}}{{\rm{I}}_{\max }}} \hfill \\
\end{array}} \right.\;\]
The fleaf [-] is assumed to decrease across the XStages starting at emergence, described by the regression parameters fleafslope [-] and fleaf0 [-]. Due to translocation processes from leaf to stem and cob, DMleaf [g/m2] is assumed to turn negative after silking (XStage = 3) or if the maximum GAI (GAImax, m2/m2) has been reached. This decay is described by a decreasing power function with two parameters decaya [-] and decayb [-].
 \[{{\rm{f}}_{{\rm{cob}}}} = {\rm{ }}\left\{ {\begin{array}{*{20}{c}}
{{\rm{XStag}}{{\rm{e}}^{\rm{*}}}{{\rm{f}}_{{\rm{cobslope}}}} + {{\rm{f}}_{{\rm{cob}}0}}} \hfill & {|\frac{{{\rm{D}}{{\rm{M}}_{{\rm{stem}}}}}}{{{\rm{D}}{{\rm{M}}_{{\rm{shoot}}}}}}{{\rm{f}}_{{\rm{stemmin}}}}} \hfill \\
1 \hfill & {{\rm{|}}\frac{{{\rm{D}}{{\rm{M}}_{{\rm{stem}}}}}}{{{\rm{D}}{{\rm{M}}_{{\rm{shoot}}}}}} \le {{\rm{f}}_{{\rm{stemmin}}}}} \hfill \\
\end{array}} \right..\]
\[{{\rm{f}}_{{\rm{cob}}}} = {\rm{ }}\left\{ {\begin{array}{*{20}{c}}
{{\rm{XStag}}{{\rm{e}}^{\rm{*}}}{{\rm{f}}_{{\rm{cobslope}}}} + {{\rm{f}}_{{\rm{cob}}0}}} \hfill & {|\frac{{{\rm{D}}{{\rm{M}}_{{\rm{stem}}}}}}{{{\rm{D}}{{\rm{M}}_{{\rm{shoot}}}}}}{{\rm{f}}_{{\rm{stemmin}}}}} \hfill \\
1 \hfill & {{\rm{|}}\frac{{{\rm{D}}{{\rm{M}}_{{\rm{stem}}}}}}{{{\rm{D}}{{\rm{M}}_{{\rm{shoot}}}}}} \le {{\rm{f}}_{{\rm{stemmin}}}}} \hfill \\
\end{array}} \right..\]
with slope and intercept of the linear cob dry matter growth, fcobslope [-] and fcob0 [-], respectively. The fstemmin [-] is the calculated average dry matter remaining in the stem at harvest. If fcob [-] exceeds 1, dry matter is translocated from stem to cobs. As soon as DMstem accounts for less than 24.8 % (fstemmin) of the DMshoot, fcob is set to 1. Compared to approaches such as in CERES-Maize, where grain filling is commonly represented using a sink-limited formulation, the present model links cob growth more directly to phenological development and biomass availability. The proportion of stem growth results as a residual value from the total shoot growth.
The GAI expansion and its growth rate are calculated as the sum of its compartments (LAI, SAI, A 27) and their growth rates (A 28), respectively. In many crop growth models, canopy development is represented using a constant SLA. In contrast, the present approach applies an allometric formulation in which SLA dynamically declines with increasing LAI, thereby accounting for self-shading and structural changes within the canopy (Ratjen and Kage, Reference Ratjen and Kage2013). Growth rate of LAI is the product of the specific leaf area (SLA) and DMleaf (A 29, A 33). Thereby, SLA [m2/g] is assumed to be the negative exponential function of LAI [m2/m2].
 ${\rm{SLA}} = {\rm{ }}\left\{ {\begin{array}{*{20}{c}}
{\begin{array}{*{20}{c}}
{{\rm{SL}}{{\rm{A}}_{{\rm{ini}}}}} \hfill \\
{{\rm{SL}}{{\rm{A}}_{\rm{a}}}{\rm{*}}\;{\rm{LA}}{{\rm{I}}^{ - SL{A_b}}}} \hfill \\
{{\rm{SL}}{{\rm{A}}_{\min }}} \hfill \\
\end{array}} \hfill & {\begin{array}{*{20}{c}}
{|{\rm{SLA}}\; \ge {\rm{SL}}{{\rm{A}}_{{\rm{ini}}}}} \hfill \\
{|{\rm{SL}}{{\rm{A}}_{{\rm{ini}}}}{\rm{ > SLA > SL}}{{\rm{A}}_{\min }}} \hfill \\
{|{\rm{SLA < SL}}{{\rm{A}}_{\min }}} \hfill \\
\end{array}} \hfill \\
\end{array}} \right.$
${\rm{SLA}} = {\rm{ }}\left\{ {\begin{array}{*{20}{c}}
{\begin{array}{*{20}{c}}
{{\rm{SL}}{{\rm{A}}_{{\rm{ini}}}}} \hfill \\
{{\rm{SL}}{{\rm{A}}_{\rm{a}}}{\rm{*}}\;{\rm{LA}}{{\rm{I}}^{ - SL{A_b}}}} \hfill \\
{{\rm{SL}}{{\rm{A}}_{\min }}} \hfill \\
\end{array}} \hfill & {\begin{array}{*{20}{c}}
{|{\rm{SLA}}\; \ge {\rm{SL}}{{\rm{A}}_{{\rm{ini}}}}} \hfill \\
{|{\rm{SL}}{{\rm{A}}_{{\rm{ini}}}}{\rm{ > SLA > SL}}{{\rm{A}}_{\min }}} \hfill \\
{|{\rm{SLA < SL}}{{\rm{A}}_{\min }}} \hfill \\
\end{array}} \hfill \\
\end{array}} \right.$
The same applies for SAI [m2/g] and specific stem area (SSA, A 30, A 32, A 34). The proportion of senescent leaf area is depicted by the factor fsen, increasing exponentially from the time of silking (XStage3, A 35, A 36). Parameters for fsen computation are sena, senb (A 36). Thereby, it is assumed that the ratio of the measured GAI values towards the highest measured GAI is the proportion of senescent leaf area.
Hybrid-specific parameterization
The baseline version of HUME-Maize is based on the dataset with the older hybrid KWS Ronaldinio. An analysis with regard to the necessity of hybrid-specific adaption was conducted for the parameters of dry matter partitioning component. Consequently, the parameters necessary for the calculation of the green area expansion (SLAa, SLAb, SSAa, SSAb) as well as those for leaf and cob growth (fleaf, fcob) were tested by linear regression with hybrid as factor (Table 3).
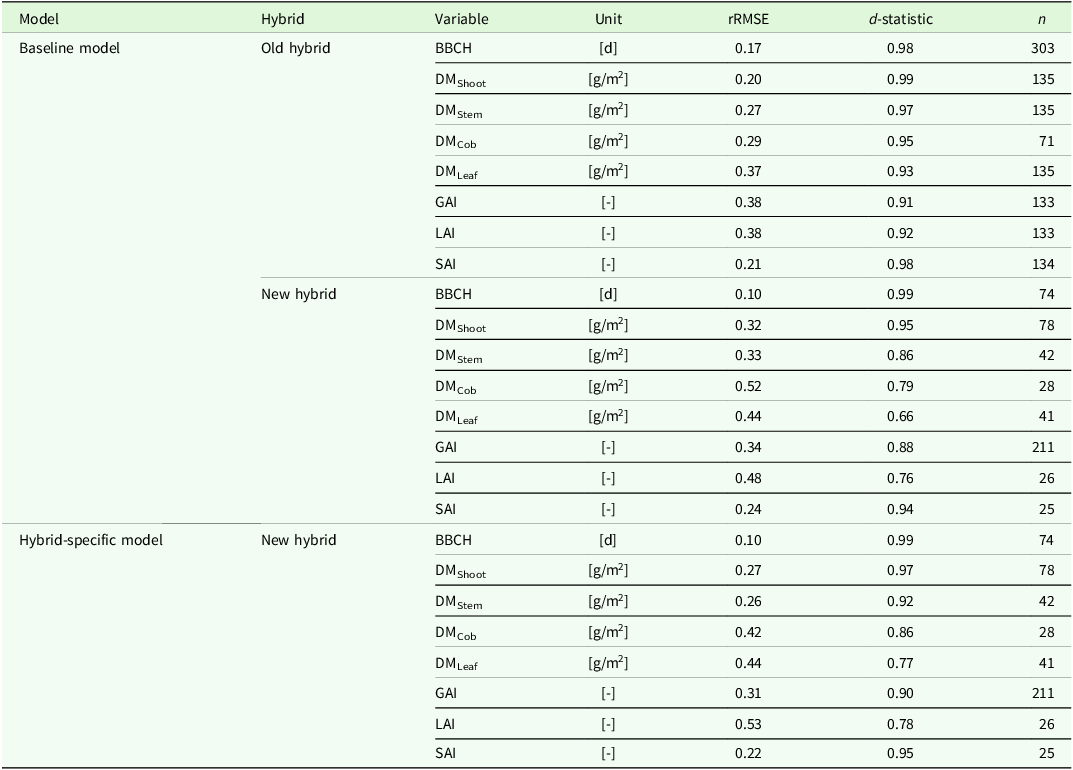
Model performance of the baseline model (parameterization for old hybrid) and the crop-specific model (parameterization adapted for the new hybrid), regarding development (BBCH), aboveground dry matter production (DMshoot), dry matter partitioning into plant organs and the green area index components (DMleaf, DMstem, DMcob, GAI, LAI, SAI). Performance was assessed using the index of model agreement (d-statistic) according to Willmott (Reference Willmott1981) and the relative root mean square error (rRMSE). n is the number of measurements (mean out of four replications)
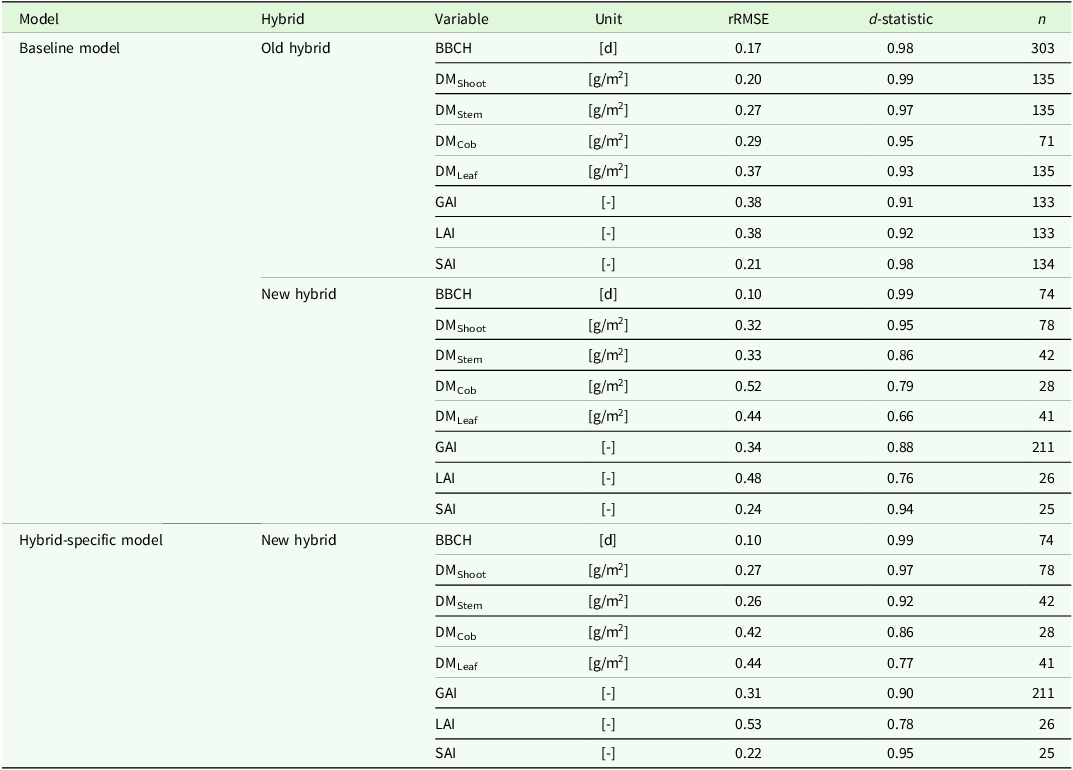
Table 2. Long description
The table presents a comparison of model performance for old and new hybrids, focusing on various agricultural metrics. It includes columns for the model type, hybrid type, variable measured, unit of measurement, relative root mean square error (rRMSE), d-statistic, and the number of measurements (n). The variables assessed include BBCH, DMshoot, DMstem, DMcob, DMleaf, GAI, LAI, and SAI. The baseline model for the old hybrid shows lower rRMSE values and higher d-statistic values compared to the new hybrid. The crop-specific model for the new hybrid shows improved performance in some variables but higher rRMSE in others. Notable trends include lower rRMSE and higher d-statistic for BBCH in the new hybrid models, indicating better performance in development stages. The table provides a detailed comparison of model performance across different metrics and hybrids.
Hybrid-specific parameterization of dry matter partitioning variables – including specific leaf and stem area (SLA, SSA), leaf and cob growth (fleaf, fcob) – and potential light use efficiency (LUEpot), for the older and newer hybrid. The table provides hybrid-specific equations for each variable, along with the p-values indicating the significance of hybrid-specific differences

Table 3. Long description
The table presents a comparison of hybrid-specific parameterization of dry matter partitioning variables for an old hybrid and a new hybrid. It includes specific leaf area (SLA), specific stem area (SSA), leaf growth (fleaf), cob growth (fcob), and potential light use efficiency (LUEpot). The table has four columns: Variable, Old hybrid, New hybrid, and p-Value. Each variable is described by an equation for both the old and new hybrids, along with a p-value indicating the significance of the differences. Row 1: SLA, Old hybrid 0.023 * LAI^-0.143, New hybrid 0.020 * LAI^-0.132, p-Value <0.0001. Row 2: SSA, Old hybrid 0.0005 * SAI^-0.425, New hybrid 0.0004 * SAI^-0.438, p-Value <0.0001. Row 3: fleaf, Old hybrid 1.0318 - 0.2934 * XStage, New hybrid 0.714 - 0.165 * XStage, p-Value 0.00127. Row 4: fcob, Old hybrid -1.095 + 0.569 * XStage, New hybrid -1.087 + 0.431 * XStage, p-Value 0.95502. Row 5: LUEpot, Old hybrid 4.9 - 0.13 * PAR, New hybrid 5.1 - 0.07 * PAR, p-Value NA.
1 Optimisation within the model.
Significance code: ***0.001 **0.01 *0.05.
The SLA models were based on a nonlinear power-law relationship between SLA and LAI (A 8), which was linearized through logarithmic transformation to enable parameter estimation via ordinary linear regression: $\log ({\rm SLA})\sim \log ({\rm LAI})\, {}^*\, {\rm Hybrid}$
Hybrid-specific differences in SLA were assessed by including the hybrid as an interaction term with log-transformed LAI. The estimated coefficients were used to derive the hybrid-specific parameters SLAa and SLAb, by back-transforming the intercepts and slopes. This allowed for the estimation of distinct allometric scaling parameters for each hybrid. The same approach was applied analogously to model the relationship between SSA and SAI.
Within the component of dry matter production, calculation of LUEpot was optimized hybrid-specifically by model internally optimization, as the processes influencing the variable within the model (e.g. fSWDF) cannot be depicted by measured data.
Data processing and statistical analysis
All data processing, creation of model input and figures, derivation of parameters by regressions and statistical analyses were conducted in the R statistical environment (R Core Team, Reference Team2024).
Relative root mean square error (rRMSE) accounts for the increasing variability in crop growth over developmental stages while maintaining sensitivity to larger deviations between measured and simulated values. Furthermore, the Index of Model Agreement according to Willmott (Reference Willmott1981) – also known as d-statistics – was used to evaluate the model accuracy.
Model internal optimization was carried out with the Levenberg–Marquardt algorithm (Press et al., Reference Press, Flannery, Teukolsky and Vetterling1989) implemented within the HUME component library. An effect was considered as significant below a p-value of 0.05.
Results
Baseline model performance across hybrids
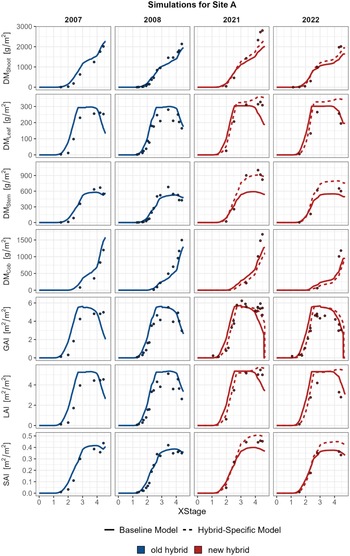
The baseline model showed a high level of agreement between simulated and observed DMShoot, with d-values of 0.99 and 0.95 for the old and the new hybrid, respectively. However, for the new hybrid, DMShoot was consistently underestimated, particularly at final harvest (Figure 3). This bias is reflected in an rRMSE of 0.32 (Table 2).
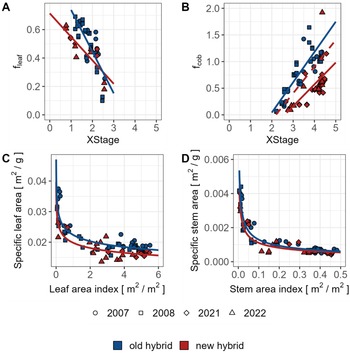
Panels A and B show the variables fleaf and fcob, representing the dry matter growth rates of leaves and cobs, respectively, as functions of developmental stage (XStages). Dashed line in Panel B represents the model internal optimization of fcob development. Panels C and D illustrate specific leaf area (SLA) and specific stem area (SSA), which are modelled to decrease with increasing leaf area index (LAI) and stem area index (SAI), respectively. The data are presented for the old and the new hybrid across the trial years 2007, 2008, 2021 and 2022. The corresponding model parameters used to describe these relationships are provided in Table 3.

Figure 2. Long description
Panels A and B show the variables fleaf and fcob, representing the dry matter growth rates of leaves and cobs, respectively, as functions of developmental stage (XStages). Dashed line in Panel B represents the model internal optimation of fcob development. Panels C and D illustrate specific leaf area (SLA) and specific stem area (SSA), which are modeled to decrease with increasing leaf area index (LAI) and stem area index (SAI), respectively. The data are presented for the old and the new hybrid across the trial years 2007, 2008, 2021, and 2022. The corresponding model parameters used to
Simulated (lines) and observed (points) values of biomass growth (DMShoot, DMLeaf, DMStem, DMCob; in g/m2) and green area expansion (GAI, LAI, SAI; in m2/m2) across phenological stages (XStages) for the old (blue) and the new hybrid (red) for site A across the two respective trial years. Depicted are the two model approaches, baseline model (solid line, parameterized by the old hybrid) and the hybrid specific model (dashed line, parameterized for both hybrids individually). Simulations for sites B, C and D can be found in Appendix C Figure C1.
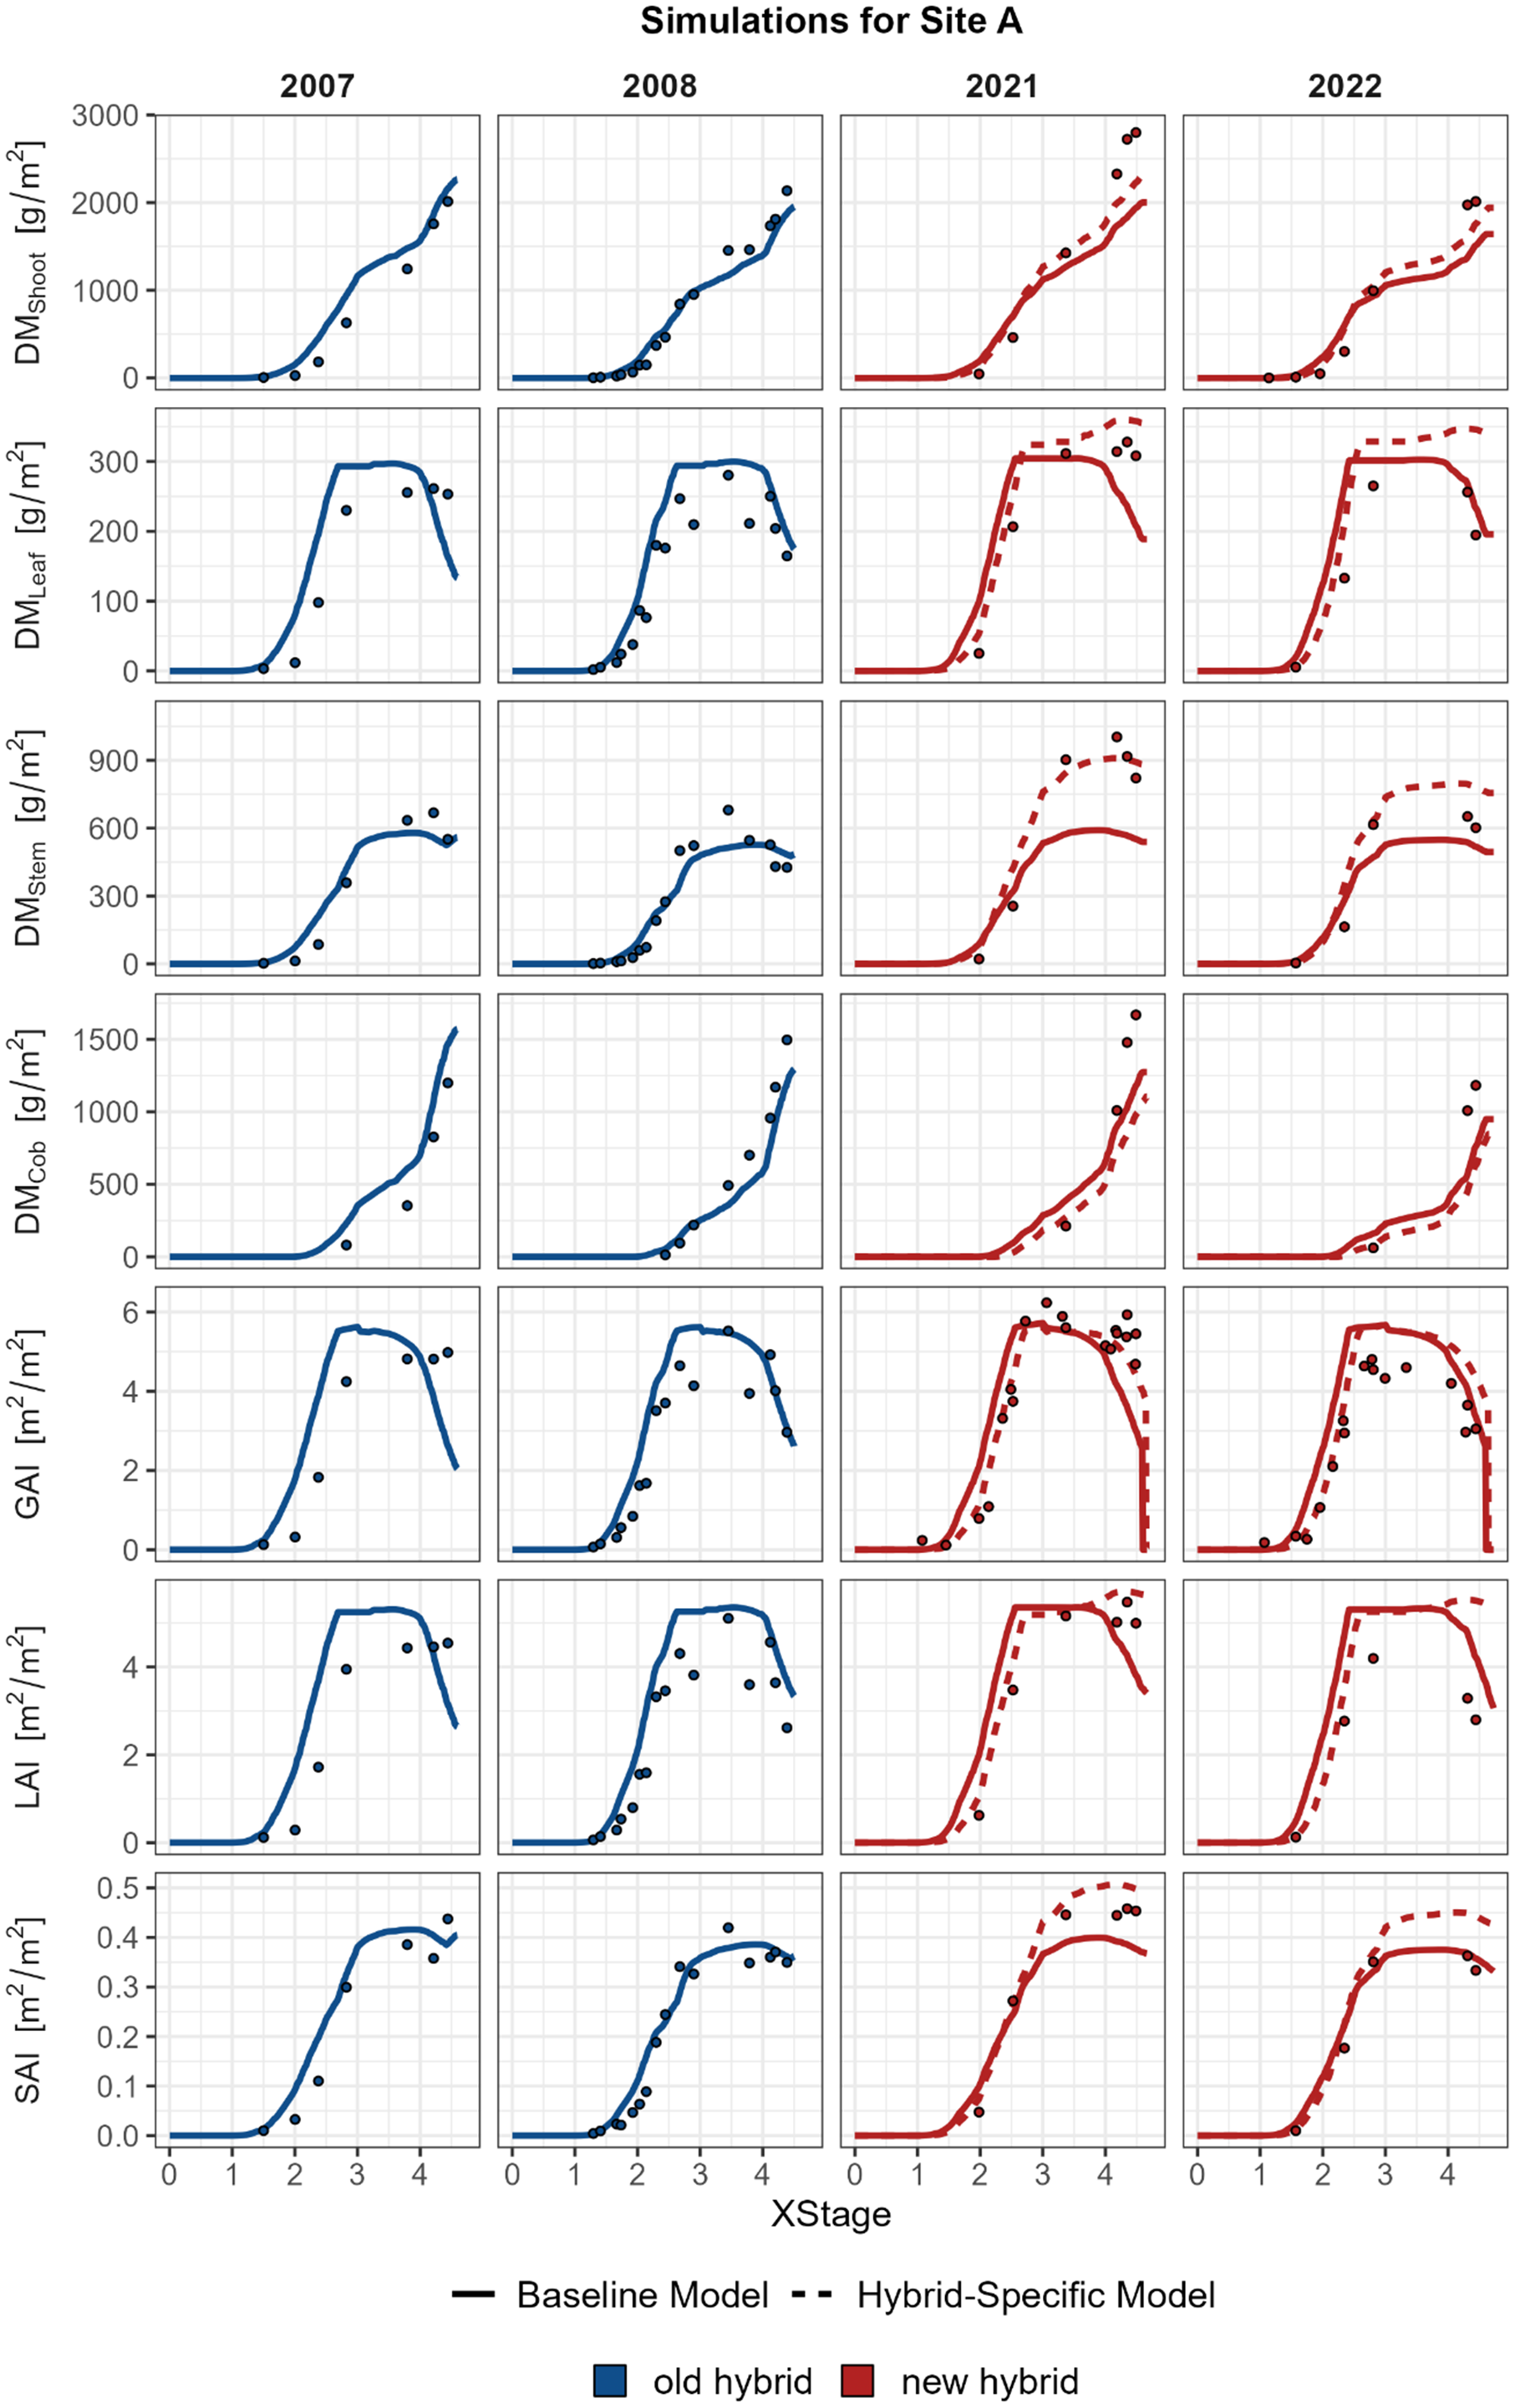
Figure 3. Long description
Simulated (lines) and observed (points) dynamics of biomass and canopy variables over crop development stages (XStage) for Site A for the old (blue) and the new hybrid (red) across two trial years, respectively. Lines represent model simulations using the baseline (solid line, which is based on old hybrids traits) and hybrid-specific parameterisations (dashed line). Colours distinguish maize hybrids (old vs. new), and line types indicate the modelling approach. Panels show different variables with individual y-axis scaling.
This underestimation appears to be related to dry matter partitioning. While the simulation of development stages showed a high level of agreement (d ≥ 0.98), the allocation of biomass to individual organs (DMLeaf, DMStem, DMCob) varied in accuracy (Table 2). For the old hybrid, organ-level simulations showed good agreement (d = 0.93–0.97, Table 2). In contrast, predictions on organ level for the new hybrid were less precise for leaves, stems and cobs, with rRMSEs of 0.44, 0.33 and 0.55, respectively. Thereby, for the new hybrid dry matter partitioning to stems was underestimated (Figure 3). While LAI showed a reasonable fit for the old hybrid (d = 0.92, Table 2), model performance decreased for the new hybrid (d = 0.76). Nevertheless, the overall GAI simulation for the new hybrid remained stable, with a d-value of 0.88 based on a large dataset (n = 211, Table 2).
Hybrid-specific parameterization
The analysis revealed distinct hybrid-specific shifts within the relationships at dry matter partitioning (Table 3, Figure 3A). Significant differences between hybrids were found for SLA, SSA and fleaf. Thereby, the older hybrid showed a higher but faster decreasing allocation of dry matter into leaves. In the newer hybrid, both SLA and SSA showed a stronger exponential decline over the respective GAI and SAI. Furthermore, the model internal optimized LUEpot parameterization revealed a noticeably lower intercept and a faster decrease of LUEpot at higher irradiance for the old hybrid (Table 3). These parameters were directly implemented into the hybrid-specific model for the new hybrid.
For fcob, no statistical difference was observed between the hybrids (Table 3). However, the baseline parameterization as well as the hybrid-specific parameters of fcob led to model inaccuracy for simulation of the organs cob and stem of the new hybrid. As a result, this parameter was not adopted in its empirical form, but optimized within the model (Figure 2, dashed line in Panel B).
The hybrid-specific parameterization showed a notable improvement in model performance for the new hybrid compared to the baseline model (Table 2). Whereby, the overall model agreement for DMShoot improved only slightly (d = 0.92), clear improvements were observed for the simulation of dry matter in shoot, stem and cob, as indicated by reduced rRMSE values. Similarly, the simulation of green area components improved, reflected in increased d-values (e.g. of the GAI from XX to XX).
Yield prediction performance in a large-scale evaluation
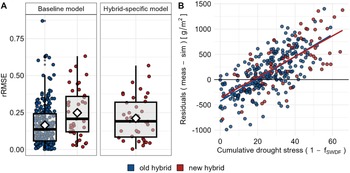
The large-scale evaluation for the prediction of final silage maize yields of the baseline model resulted in a prediction error rRMSE of 0.16 and 0.24, for the older and the newer hybrid, respectively (Figure 4 A). Overall, d-statistic was 0.61, with a 0.62 for the old and 0.60 for the new hybrid. By the hybrid-specific parameterization, the rRMSE for the newer hybrid was reduced to 0.21 and the d-statistic to 0.69.
(A) Large-scale evaluation of the HUME-Maize model approaches, utilizing 287 datapoints of final silage maize yields across Germany from 2006–2021. Diamond depicts the mean of relative root mean square error (rRMSE). (B) Residual analysis of the hybrid-specific model for both, old and new hybrids, showing the residuals (measured-simulated) across cumulative drought stress, which is the sum of (1−fSWDF) throughout the season.
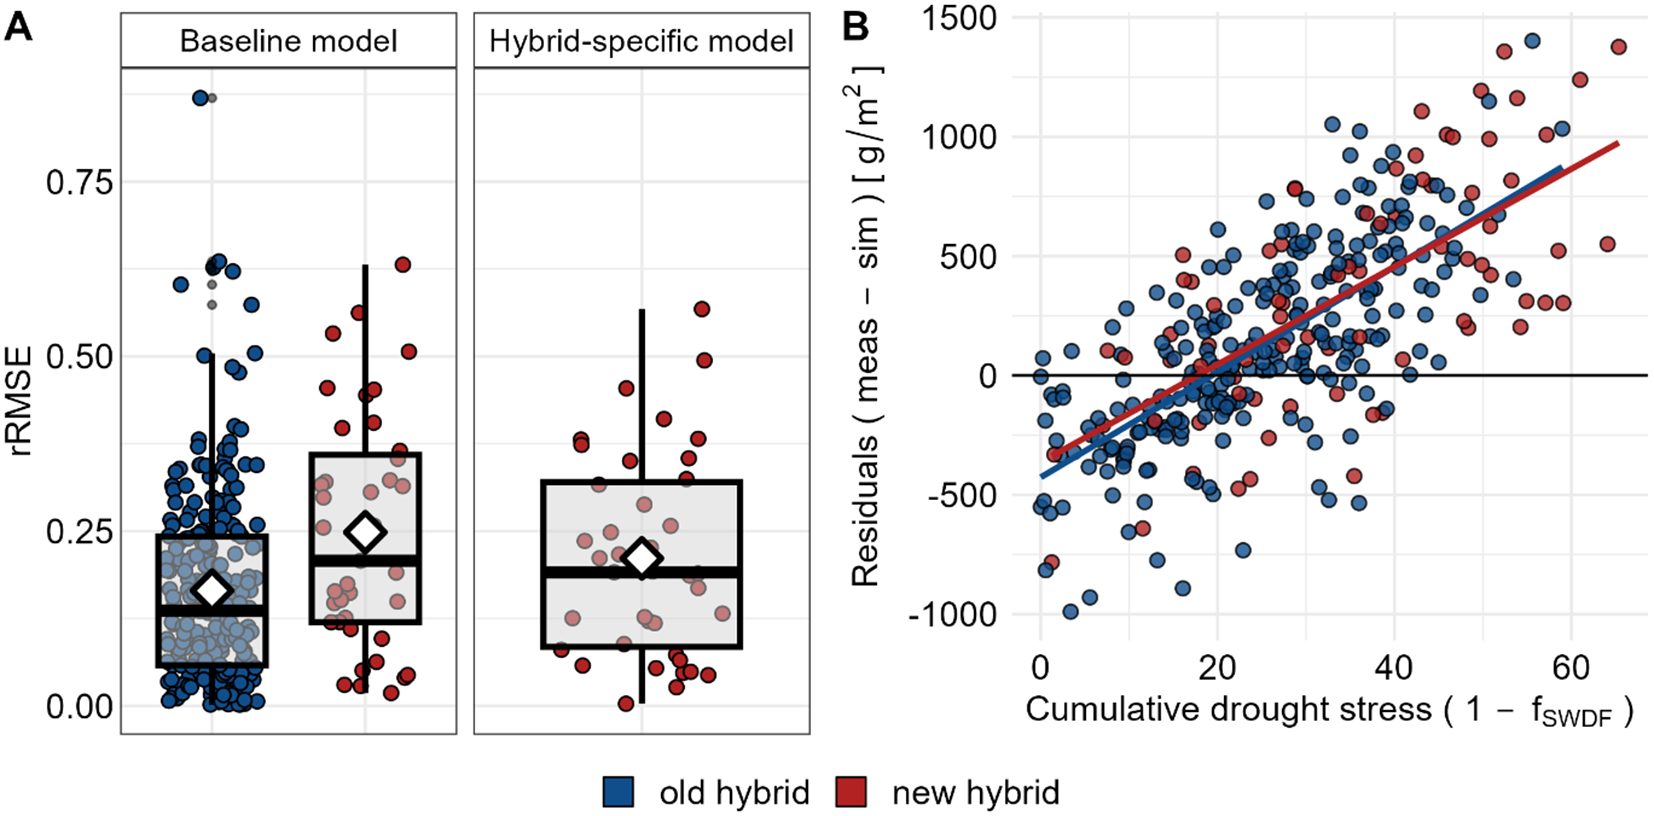
Figure 4. Long description
Simulated (lines) and observed (points) values of biomass growth (DMShoot, DMLeaf, DMStem, DMCob; in g/m²) and green area expansion (GAI, LAI, SAI; in m²/m²) across phenological stages (XStages) for the old (blue) and the new hybrid (red) for Site A across the two respective trial years. Depicted are the two model approaches, baseline model (solid line, parameterized by the old hybrid) and the hybrid specific model (dashed line, parameterized for both hybrids individually). Simulations for Sites B, C and D can be found in Appendix C Fig. C 1.
The comprehensive dataset enabled a further residual analysis of parameters affecting yield prediction accuracy. Thereby, a significant influence of drought stress was detected, which is computed by fSWDF (Equation 4), with yields being tendentially underestimated. Without drought stress, the residuals declined below 0 (Figure 4 B).
Discussion
Performance of baseline model
The baseline model depicted phenological development of both hybrids with high accuracy, with d-statistics of 0.98 for the older and of 0.99 for the new hybrid. These model accuracies are distinctly higher than the results achieved obtained by Morel et al. (Reference Morel, Parsons, Halling, Kumar, Peake, Bergkvist, Brown and Hetta2020) refitting APSIM for silage maize growth under North European conditions (R 2 = 0.81). This high accuracy was obtained by adapting the phenology approach of XStages for grain maize from the HYBRID-Maize model (Yang et al., Reference Yang, Dobermann, Lindquist, Walters, Arkebauer and Cassman2004) by a parameterization more specific for silage maize cultivation in Europe. Therefore, the base temperature (T1) was lowered from 8 or 10 °C (Jones and Kiniry, Reference Jones and Kiniry1986; Yang et al., Reference Yang, Dobermann, Cassman, Walters and Grassini2016) to 6 °C, following European studies on maize phenology (Bonhomme et al., Reference Bonhomme, Derieux and Edmeades1994; Pagès and Pellerin, Reference Pagès and Pellerin1994). Additionally, growing degree days (GDDs) to calculate the growth rates to reach the XStages were derived from the results of Bignon (Reference Bignon1990) for mid-early hybrids, harvested at a dry matter content of 35 %. As Bignon (Reference Bignon1990) also provided GDDs for early and late hybrids, extending the model for further maturity groups should be feasible. The baseline model also showed high accuracy for dry matter formation of both hybrids (d = 0.99 and 0.95). Comparisons with previous studies are limited by differences in statistical metrics. For example, Vogeler et al. (Reference Vogeler, Kluß and Taube2025) reported an R 2 of 0.77 for silage maize biomass simulations using APSIM for various soil and climate conditions in Northern Germany and Denmark. While R 2 reflects the strength of linear association, it does not necessarily capture agreement in magnitude, which is explicitly addressed by the index of agreement used in the present study. Further challenges in accurately simulating silage maize biomass have been reported by Morel et al. (Reference Morel, Parsons, Halling, Kumar, Peake, Bergkvist, Brown and Hetta2020), who observed a distinct underestimation of silage maize biomass in Southern Sweden when utilizing APSIM. This bias was attributed to an inadequate representation of the combined effect of LUE, kPAR and row spacing within the model. Thus, the higher accuracy of HUME-Maize could be due to the approach of optimizing LUEpot model internally by the Levenberg-Marquard algorithm, thereby taking into account drought stress. Furthermore, a linear relationship between LUEpot and PAR is assumed, including a saturation effect of the single leaf photosynthesis with higher irradiance at canopy level (Kage et al., Reference Kage, Stützel and Alt2001b).
Key parameters for hybrid-specific adaptions identified
Final dry matter yield of the new hybrid was underestimated when parameterizing on the old hybrid. This bias can be traced back to a change of partitioning into the plant organs between the two analysed hybrids of differing release year. Over the 14-year time lag between the release years of the tested hybrids, maize breeding has led to significant changes in plant architecture and biomass allocation strategies (Perez et al., Reference Perez, Fournier, Cabrera-Bosquet, Artzet, Pradal, Brichet, Chen, Chapuis, Welcker and Tardieu2019; Taube et al., Reference Taube, Vogeler, Kluß, Herrmann, Hasler, Rath, Loges and Malisch2020). It was demonstrated that integrating these effects of breeding progress, particularly those related to green area expansion and dry matter partitioning, distinctly improves model accuracy.
A significant difference between the hybrids was found in the daily leaf growth rate as a proportion of total biomass growth (f leaf ). It was found to be higher and to decrease faster for the older hybrid (Figure 2). This means for the newer hybrid that the proportion of biomass allocated to leaves is initially smaller, but remains more stable throughout development. These findings are in line with observations from Taube et al. (Reference Taube, Vogeler, Kluß, Herrmann, Hasler, Rath, Loges and Malisch2020), who reported that newer maize hybrids exhibit increased LAI, higher leaf number and larger individual leaves. Vogeler et al. (Reference Vogeler, Kluß and Taube2025) similarly highlighted the need to adjust hybrid-specific parameters for leaf number in crop models like APSIM to better capture phenotypic variation across hybrids with different release years.
The shift and prolonged phase of higher GAI into summer months enable the newer hybrid to display enhanced light interception. This matches the stronger exponential decline of SLA of the newer hybrid, indicating that leaf tissues are thinner while covering more surface area, especially in later developmental stages. A reduction of SLA with breeding progress was also identified by Taube et al. (Reference Taube, Vogeler, Kluß, Herrmann, Hasler, Rath, Loges and Malisch2020). This anatomical shift likely serves functional purposes: thinner leaves with higher surface area facilitate improved light interception and transmission within the canopy. This interpretation is supported by findings from Perez et al. (Reference Perez, Fournier, Cabrera-Bosquet, Artzet, Pradal, Brichet, Chen, Chapuis, Welcker and Tardieu2019), who demonstrated that the vertical distribution of leaf area has become more homogeneous over time in maize, with fewer leaves concentrated in the upper canopy and a more even distribution across canopy layers. This architectural change enhances light transmission through the canopy and improves overall radiation use. In line with these findings, Chen et al. (Reference Chen, Kumudini, Tollenaar and Vyn2015) found that newer maize hybrids not only allocate more biomass to leaves but also maintain higher leaf N content, reinforcing their photosynthetic capacity. In this context, the more stable leaf biomass development observed in the newer hybrid can be interpreted as a breeding-driven adaptation aimed at maximizing LUE and, consequently, total dry matter accumulation. In the presented study, this is reflected in a higher LUEpot of the newer hybrid, decreasing slower with increasing PAR.
For the stem, the steeper decline in SSA of the newer hybrid implies a higher amount of biomass per unit surface area, which translates into thicker or structurally stronger stems (Table 3, Figure 2). This investment in stem biomass – evidenced by thicker stems, as well as lower proportional growth of leaves and cobs (fleaf, fcob) compared to the older hybrid – may reflect breeding efforts aimed at improving standability of the stem or an increased capacity for storing assimilates for grain filling. Zhang et al. (Reference Zhang, Gu, Wang, Xu, Zhao, Liu, Wang and Huang2023) reported that higher allocation to the stem does prevent lodging damage induced yield losses. It can thus be assumed that the breeding aim of increased yields favours hybrids with more stable stems, as they enable the formation of more robust canopies.
Dry matter partitioning driven by coefficients depending on thermal time (fleaf, fstem and fcob), as the XStages used here (Jones et al., Reference Jones, Hoogenboom, Porter, Boote, Batchelor, Hunt, Wilkens, Singh, Gijsman and Ritchie2003; Keating et al., Reference Keating, Carberry, Hammer, Probert, Robertson, Holzworth, Huth, Hargreaves, Meinke, Hochman, McLean, Verburg, Snow, Dimes, Silburn, Wang, Brown, Bristow, Asseng, Chapman, McCown, Freebairn and Smith2003) was long considered as standard simulation method. An alternative approach for calculating the partitioning into the plant organs, leaf, stem and cob, is the allometric concept (Fukuyama and Sakurai, Reference Fukuyama and Sakurai2019). Kage and Stützel (Reference Kage and Stützel1999a) developed and successfully tested an allometric algorithm in a cauliflower growth model. Ratjen et al. (Reference Ratjen, Lemaire, Kage, Plénet and Justes2018) found a satisfactory allometric relation between leaf and stem biomass in silage maize utilizing the current calibration data set. However, the approach of Ratjen et al. (Reference Ratjen, Lemaire, Kage, Plénet and Justes2018) was tested by implementing it as an alternative option in HUME-Maize (not shown), but did not overpass the results presented here which are based on the linear regressions for growth fractions of all organs depending on the XStages. The possibility for far-reaching parameter and process adaption on the one hand, and of model internal optimization of more complex parameters on the other hand, can be regarded as one of the key strengths of the HUME-Maize model.
Large-scale evaluation highlights future potential of the model
The model was evaluated on a broad spatial and temporal scale, encompassing 67 sites and a time span of 14 years, with diverse soil types and climatic conditions, resulting in a total of 287 observations. Despite the inherent variability across these environments, the relative prediction errors for final yield were comparatively low −16 % for the older hybrid, and 21 % for the newer hybrid (hybrid-specific model). Furthermore, the evaluation dataset stems from hybrid trials by agricultural chambers for which yield data may be of varying quality and soil and weather data had to be received from coarser online platforms. For silage maize, to the best of current knowledge, no model evaluation with a dataset of similar composition and size is available.
The moderate d-values observed in this large-scale evaluation can primarily be attributed to the characteristics of the dataset. In contrast to the calibration dataset (d ≥ 0.95), which was based on time series including early growth stages, the evaluation relied solely on final yield data with a comparatively narrow range of variation. In such cases, even small absolute deviations between simulated and observed values can result in reduced agreement statistics.
Considering yield data under irrigated conditions, Ban et al. (Reference Ban, Ahn and Lee2019) demonstrated a distinctly increased R 2 and a reduced prediction error. This matches to the increased residuals with drought stress identified with the present HUME-Maize simulations and indicates a general problem of properly depicting yield reaction to drought stress with process-based models. This can be traced back to the diversity of effects underlying the modelling of drought stress, such as soil water movement and root water uptake, as well as the physiological response to drought, such as delayed senescence and partial grain filling. These are currently underrepresented in model structures. An additional drought stress-related effect may have the reduced root-driven nitrogen remobilization at lower soil moistures, as the HUME-maize model assumes optimal nitrogen availability. This observation highlights a potential avenue for future model refinement, including the explicit integration of stress-adaptive processes and resource limitation.
Conclusion
The current study demonstrates that process-based crop models, although built on established modelling approaches, can be adapted within the HUME framework to analyse genotype-specific differences in biomass formation. The results highlight systematic shifts in key physiological traits between silage maize hybrids, underlining the importance of representing genotype effects in crop models beyond phenological differences. Besides canopy structure and radiation use efficiency, root growth represents an additional trait requiring further investigation, while the integration of nutrient limitations will be essential to extend the model towards more comprehensive genotype × environment analyses.
Supplementary material
The supplementary material for this article can be found at https://doi.org/10.1017/S0021859626100719
Acknowledgements
The authors thank the technical staff Karin Jung, Cordula Weise, Kirsten Schulz and Doris Ziermann, as well as the entire staff of the involved experimental farms and numerous student helpers for their dedicated field and lab work. The authors used ChatGPT (OpenAI) to assist with language refinement and editing of the manuscript. All scientific content, analysis and conclusions were developed by the authors.
Author contributions
Conceptualization: K.H., J.B.; Methodology: K.H., B.W., H.K., J.B.; Software: H.K.; Validation, K.H.; Formal analysis, K.H.; Investigation, K.H., B.W., J.B.; Resources: B.W., J.B. K.H.; Data curation: K.H., J.B.; Writing – Original draft: K.H.; Writing – Review and editing: M.K., A.H., H.K., J.B.; Visualization: K.H.; Supervision: J.B.; Project administration: M.K., A.H., I.Z., M.D., S.S., H.K., J.B.; Funding acquisition: M.K., A.H., I.Z., M.D., S.S., H.K.; All authors have read and agreed to the published version of the manuscript.
Funding statement
This study was financially supported by the European Regional Development Fund (Biogas-Expert project: 122-09-016), the German Federal Ministry of Food and Agriculture (NEffMais project: 2220NR112A) and the German Federal Ministry of Education and Research (RootWayS project: 031B0911A), which were gratefully acknowledged.
Competing interests
The authors declare no conflict of interest.




 Open access

