


Introduction
For a half-century, opposition to Communism created a stable coalition in the Republican Party. Antagonizing both free markets and the free exercise of religion, the Communist threat united an economic libertarian wing with a socially conservative wing that, under different circumstances, would not see eye-to-eye. Since the fall of the Soviet Union, however, the Republican coalition has been fracturing (Continetti Reference Continetti2022; Saldin and Teles Reference Saldin and Teles2020). Scholars predicted this change before the Trump presidency opened wide the divisions between business elites and populists, as issues such as trade and immigration have caused tension in the coalition for some time (Berry Reference Berry2013; Hertel-Fernandez and Skocpol Reference Hertel-Fernandez and Skocpol2016; Miller and Schofield Reference Miller and Schofield2008). However, before the Trump presidency, scholars may have still thought of ‘big business’ unambiguously as a prototypical core constituency – an ‘intense policy demander’ – of the Republican Party (Cohen et al. Reference Cohen, Karol, Noel and Zaller2016; Grossmann and Dominguez Reference Grossmann and Dominguez2009; Noel Reference Noel2016).
The place of business in the Republican Party coalition is no longer obvious (Zacher Reference Zacher2023). CEOs have increasingly taken public stances on political issues and have done so mostly on left-leaning issues (Larcker et al. Reference Larcker, Miles, Tayan and Wright-Violich2018). Groups like the Business Roundtable have shifted away from a focus on the narrow self-interest of CEOs (Hacker and Pierson Reference Hacker and Pierson2016) toward ‘stakeholder capitalism’, with a focus on community, diversity, and the environment.Footnote 1 Public opinion has shifted, such that Republicans in the mass public are no more likely to think that ‘big business’ has a positive effect on the country than Democrats do. Democrats are much more favourable toward the technology sector specifically, one of the more influential sectors in contemporary American business.Footnote 2 The business community seems to have shifted its position away from the Republican Party.
Or has it? The dominant narrative among social scientists still maintains that companies’ occasional activism on liberal social causes and bipartisan donation behavior are something of a mirage, masking a persistent alignment with the Republican Party (see Hersh (Reference Hersh2023), Grumbach and Pierson (Reference Grumbach and Pierson2019), Cohen et al. (Reference Cohen, Hazan, Tallarita and Weiss2019), Page et al. (Reference Page, Seawright and Lacombe2018)). Recent studies of CEOs of major publicly-traded companies suggest they are predominantly Republican, whether measured by their party registration (Fos et al. Reference Fos, Kempf and Tsoutsoura2022) or by their campaign contributions (Cohen et al. Reference Cohen, Hazan, Tallarita and Weiss2019). And while many companies signed onto the Business Roundtable’s public endorsement of stakeholder capitalism, scholars have found little evidence that these companies have adopted practices consistent with their stated ideals (Raghunandan and Rajgopal Reference Raghunandan and Rajgopal2022). In this view, corporate America can strategically and symbolically present itself as liberal when it suits its interests, but this should not be mistaken for any real realignment with respect to the political parties.
The tension between the narrative of corporate realignment and the narrative of stability in coalitions is the inspiration for the present study. We test hypotheses related to corporate realignment by offering a new theoretical perspective on institutional cross-pressure and a new survey of economic leaders that we conducted in 2022. Surveying hundreds of wealthy businesspeople (a large sample for this elite population), we measure perceptions of the relationship between companies and political parties. Unlike other recent studies of similar elites, our study is not focused on the personal policy attitudes or partisan preferences of business leaders. Our focus is on where elites see the placement of business, both major US companies and their own, relative to the political parties and why they think, in either case, business is or is not changing its party coalition. For a key set of questions, we also survey a comparison sample of the mass public.
Across a range of industries, business leaders see their companies as moving toward the Democratic Party. They see major businesses across the country moving toward the Democrats as well. The mass public does not perceive a similar partisan shift. Those who perceive their companies as Democratic-aligned believe that the company’s core policy priority is not economic or particularistic but relates to broader social and environmental policies prioritized by the Democratic Party.
Whether and why business constituencies are moving away from the Republican Party are critical questions. While the American two-party system is stable in its party labels, the policy-demanding constituency groups that pressure political parties shift over time. If the Republican Party continues to embrace more populist leaders and messages and draw support among working class conservatives, and if the Democratic Party continues to develop into a party of socio-economic elites, this would represent a major, perhaps the major, American political development of the twenty-first century. While this study offers only one modest attempt to conceptualize and measure this change, it adds to a body of evidence suggesting the change is real, with profound implications for the future of American politics.
Cross-Pressure and Coalition Shifts
Company leaders may see their firm as aligned with one party or another for a number of reasons. They may simply project their own views onto their perceptions of their business. They may think about historic ties between their firm, or their firm’s business sector, and a political party. But perhaps the two clearest reasons why a leader might think of their firm as aligned with a party relates to a) stakeholders and b) public policy. A firm’s stakeholders, such as executives, employees, or shareholders, might be mostly composed of Democrats or Republicans. If one or more of the stakeholders is one-sidedly partisan, a business leader may perceive the firm as aligned with a party. Or, if stakeholders in a firm are a mix of Democrats and Republicans, corporate leaders may see the firm as bipartisan or nonpartisan. Separately, a firm may have public policy goals connected to its business interests, and one political party might support those policy goals more than the other party. This, too, could lead to a business leader believing the firm is aligned with a party.
In this paper, we are interested in how business leaders see their firm’s partisan alignment at the present time and how they see that alignment changing over time. If a business leader perceives his or her firm shifting partisan camps, it may be because of changes in stakeholders or in policy goals. Perhaps a key stakeholder, such as a CEO or employees, has changed political alignment over time. Or perhaps the firm’s key policy goal has changed. A business leader may also perceive a change in his or her firm’s alignment without a change in any policy goal or stakeholder attitude. For instance, at one point in time, a firm’s policy goals could be at odds with the preferences of employees, but corporate leaders pay little attention to the attitudes of employees. At another point in time, a business leader could decide to prioritize a policy or a stakeholder differently than in the past. In other words, a firm’s partisan identity could change over time on account of how leaders navigate cross-pressure inside the firm.
To add to the complexity, companies could have stable political worldviews – both in their policy goals and in the composition of stakeholders – but the parties could change over time. A company that was once aligned with one party could shift to the other because of changes in a party’s platform or legislative priorities. What’s more, a company may manufacture a public image of alignment with a political cause if doing so serves a narrow business goal, such as boosting employee morale or generating goodwill with customers (Crilly et al. Reference Crilly, Zollo and Hansen2012). In that case, the firm’s perceived alignment (or realignment) could be strictly symbolic.
Measuring whether and why a company aligns with a party or re-aligns with another party is thus incredibly complex. We cannot hope to make a full accounting here. But we aim to make headway on this question by taking an important slice of this question. We ask corporate leaders a series of questions about the partisan alignment of their firms, their firms’ stakeholders, and their firms’ policy goals. We seek leaders’ perspectives on present partisan alignment and the trajectory of the firm’s alignment over time.
A company is not a natural person who is able to self-identify its political preferences. But it turns out that the vast majority of business leaders, when asked, can indicate a partisan identity of their firm. What do they mean? Below, we unpack the meaning of the partisan identity described by business leaders by showing how this relates to the policy goals of the firm and the partisan identity of stakeholders such as employees. Furthermore, we ask business leaders whether, and why, they perceive their firm re-aligning with respect to the political parties.
In the next section, we will explain why a survey of business leaders, and not another methodology, is the right research tool for testing our hypotheses. In the remainder of this section, we further develop the questions and hypotheses we study.
Cross-Pressure in Corporate Stakeholders
Many Americans are cross-pressured on political issues, siding sometimes with the Democrats and other times with the Republicans (Fowler et al. Reference Fowler, Hill, Lewis, Tausanovitch, Vavreck and Warshaw2023; Hillygus and Shields Reference Hillygus and Shields2008). But more than any one individual, a complex business organization is likely to experience cross-pressure as well, with some stakeholders aligned with one party and others aligned with the other party (Benton and Cobb Reference Benton and Cobb2019). In our survey, we ask business elites about whether they see their company as aligned more with Democrats or Republicans or neither. We also asked about the partisan alignment of stakeholders within the business organization: the CEO, other executives, employees, customers, boards of directors, and suppliers and vendors. We test whether the perceived alignment of one or more stakeholders predicts the business leader’s view of the company overall. For instance, suppose that some firms have very Democratic-leaning employees and others have very Republican-leaning employees. The perceived alignment of the employees may predict or not predict how the business perceives the firm’s overall alignment.
We expected that leaders, especially those in white-collar industries, would perceive employees as Democratic-aligned even if they perceive other stakeholders and the company overall as neutral or conservative. After all, young college-educated workers have been voting overwhelmingly Democratic in recent years.Footnote 3 And while firms might have both college-educated and non-college educated workers, the typical executive at a large company likely has more exposure to their college-educated employees. We asked elite respondents about the current alignment of their firms, about whether their firms have moved more in one party’s direction or another, and about which stakeholders, if any, are pushing the firm toward a partisan camp. We anticipated that while business leaders may see their firms as politically neutral, they would perceive the firms as moving toward the Democrats and attribute this movement to employees. That is, we expected that regardless of the firm’s overall partisan alignment, business leaders would perceive the firm moving toward the Democrats and doing so at least in part because employees are pushing the firm in this direction.
In testing this hypothesis, we want to be mindful of factors other than stakeholder pressure that are likely to impact whether an elite respondent thinks their company is aligned with Democrats or aligned with Republicans. Individual-level factors, company-level factors, and industry-level factors can all affect respondents’ judgments of where their company stands politically. Some industries are more Democratic- or Republican-aligned, so an executive in the tech sector, for example, may be more likely to perceive his company as Democratic than an executive in the real estate sector. Larger firms, which tend to be the target of accusations of ‘woke capitalism’, may be perceived as more Democratic-aligned than smaller firms.
Business leaders who are themselves Democrats and those who are Republicans likely have divergent perceptions of their companies. Even controlling for industry, Democratic and Republican business leaders may be sorted into companies that match their partisan affinities. However, we do not think this is likely, as past research suggests companies and their executives are quite politically heterogenous (Bonica Reference Bonica2016), though Fos et al. (Reference Fos, Kempf and Tsoutsoura2022) measure increasing partisan sorting. More likely is that when thinking of their company’s political alignment, Democratic business leaders could have in mind social or environmental political values and may see the company as aligned on those values, whereas Republican business leaders may have in mind the company’s economic values and see the company as aligned on those values. Of course, the opposite pattern could theoretically emerge just as well, driven by a form of backlash. For instance, Republican businesspeople may see their company as championing liberal social values and thus believe their company to be more Democratic than either Democratic or Independent elite respondents would believe. In reality, our evidence is inconsistent with this conceptualization of backlash, as we find that it is Democrats who most perceive companies shifting toward the Democratic Party.Footnote 4
A ‘false consensus’ bias may lead business leaders to think that their company writ large shares their own values (Furnas and LaPira, Reference Furnas and LaPira2023). That form of bias is consistent with our evidence showing that Democratic, Republican, and independent business leaders believe the alignment of their company is aligned with their own values. However, respondents generally believe that their firms are moving in the same direction (toward the Democrats), regardless of their own personal ideological commitments, a finding inconsistent with a ‘false consensus’ theory.
Cross-Pressure in Policy
A chief reason why businesses face organizational cross-pressure is that they have policy views that cut different ways politically. For instance, a company might endorse affirmative action, health care reform, and investments in public education. Company leaders may see these positions as Democratic-aligned. The same company might also endorse low corporate taxes, limits to regulation, and other positions that are more Republican-aligned. This cross-pressure is distinct from stakeholder cross-pressure as all stakeholders may well agree that there are policy issues pulling the company in two political directions.
At the heart of the question of whether businesses are in the Republican or Democratic coalition (or neither) is whether a cross-pressured company sees its main policy objectives as the ones aligned with the Democrats or the ones aligned with the Republicans. We asked corporate elites what they think is the domestic policy issue that is their company’s highest priority. And we asked whether they think on this issue the company is more aligned with the Democrats or the Republicans. Following the research on corporate PACs (Grossmann and Dominguez Reference Grossmann and Dominguez2009), a clear hypothesis from the literature is that elite respondents whose company has a policy priority would articulate an economic policy priority, and on that priority, they would see their company as aligned with the Republicans. Even for executives who think of their company as Democratic-aligned (perhaps on social or environmental issues or due to the culture of the stakeholders), they may nevertheless say that on the issue dearest to the company, they are aligned with the Republicans. If this expectation from the literature is correct, then a liberal corporate culture may not signal that a company is in a liberal party coalition. The liberal social expression would be mainly symbolic. If, however, corporate executives who see their companies as Democratic believe the company’s core policy priorities are aligned with Democrats, then this would provide evidence of a more durable partisan realignment. This is indeed what we find.
Stepping back from our survey, what are the stakes of this analysis? Whether a business is aligned with one party or another matters for how a business as an ‘intense policy demander’ navigates its political environment (Saldin and Teles Reference Saldin and Teles2020). If the business is squarely in the camp of one party – if it believes its destiny is tied up with one party – then it will behave differently than if it is flexible with respect to coalition partners. A firm, or industry, being in one camp or being flexible between partisan camps, has downstream consequences for how executives and PACs make political campaign contributions (Li Reference Li2018; Li and DiSalvo Reference Li and DiSalvo2022) and for how firms lobby for the passage or defeat of policies promoted by their aligned party (Swenson Reference Swenson2019).
Data
Scholarship on business and politics often begins with studying firms’ revealed preferences through campaign finance data, seemingly hard evidence of the relationship between corporations or corporate leaders and political entities. While there is great value in studying campaign contributions, campaign finance data cannot offer a satisfactory answer to the questions at the heart of our research project.
When individuals who are associated with companies donate money to candidates and to parties, past scholarship finds that these individuals are not donating as representatives of their companies’ interests but based on their own personal ideological values (Barber Reference Barber2016; Bonica Reference Bonica2016; Broockman and Malhotra Reference Broockman and Malhotra2020). Scholars cannot draw obvious conclusions about the preferences of business leaders from the activities of their corporations, nor can they draw obvious conclusions about the priorities of a firm from the political activities of its leaders (Burris Reference Burris2001). A company with Democrats in management may donate to Democratic lawmakers, and a company with Republicans in management may donate to Republican lawmakers, but that may not tell us about the company’s alignment.
Data on corporate political action committees (PACs) and corporate-aligned interest groups can illuminate a company’s coalitional position. Some studies have shown business as a core constituency of the Republican Party (Grossmann et al. Reference Grossmann, Mahmood and Isaac2021; Grossmann and Dominguez Reference Grossmann and Dominguez2009). Other studies show business groups reflect a centrist, or balanced, position in politics (Bonica Reference Bonica2016; Crosson et al. Reference Crosson, Furnas and Lorenz2020; Gimpel et al. Reference Gimpel, Lee and Parrott2014). Recent work, however, has challenged the use of PAC data, suggesting ‘strong reasons to question whether PAC spending offers an unbiased window into corporate preferences’ (Grumbach and Pierson Reference Grumbach and Pierson2019). Among the reasons is that PAC activity is publicly disclosed, and companies may want to shield their true preferences from being publicly disclosed, even if disclosure may please certain stakeholders (Werner Reference Werner2017). (See Schnakenberg and Turner (Reference Schnakenberg and Turner2021) and Jia et al. (Reference Jia, Markus and Werner2023) for models of disclosure requirements and political activity.) With the rising tide of dark money – that is, funds used for political expenditures with no identifiable source (Mayer Reference Mayer2017) – PACs and interest groups may give us only a limited window into a company’s core political values. Dark money exceeded more than $1 billion at the federal level during the 2020 election, which may systematically bias ideal-point estimates of contributor ideology derived from just PAC contributions (Oklobdzija Reference Oklobdzija2019).Footnote 5
Due to limitations such as these, scholars turn to other data sources that complement campaign finance data, including surveys of economic elites (Furnas and LaPira Reference Furnas and LaPira2023). Here, we survey business elites and ask how they see their company and its partisan alignment. We do not think of this survey as the uniquely superior way to study the relationship between companies and political parties; however, the methodology employed here has a number of strengths that complement other work in this field. By targeting a survey to corporate leaders and promising not to identify them or their companies, the survey can elicit answers in ways that might not emerge from mandatory public disclosures. By surveying a range of wealthy businesspeople across the country, we have a broader scope than typical studies that focus on the political attitudes just of national political donors or just of those who work for publicly traded companies. At the same time, of course, our study has all the limitations typical of survey-based analyses, such as perceptual biases that come along with any self-reported attitude and response bias that comes from not having universal participation among those solicited. We have the added challenge of trying to target a survey to a group of elites (‘individuals who are in decision-making roles in businesses’) that is difficult to operationalize (Kertzer and Renshon Reference Kertzer and Renshon2022). As described below, we try to compensate for those limitations as best we can, given the data.
What does a corporate leader’s subjective perception of political alignment actually measure? Scholars have long investigated individual-level subjective partisan identity – the extent to which partisanship is a proxy for social, economic, and foreign policy views, the extent to which it is a reflection of incumbent approval or a social identity, and so on. Very little is known about what a person means when they say their company is Democratic- or Republican-aligned. Here, by asking questions about policy priorities of the firm, dispositions of key stakeholders, and the leaders’ own demographics, we begin to learn what businesspeople mean when they say their firm is more Democratic or more Republican. But as a measurement exercise, this is only a first step. Because our survey is anonymous, we do not observe the relationship between subjective partisanship and political outcomes; however, the steps we take in measuring subjective partisan attitudes will help future scholarship connect the subjective perception of partisan alignment with objective measures of the firm’s activity.
The sampling frame for this study was constructed through the use of Catalist’s microtargeting database, which contains records of all registered voters in the USA to which Catalist appends hundreds of demographic, behavioral, and geographic fields (Hersh Reference Hersh2015). We asked Catalist to identify all individuals who are registered to vote in the wealthiest Census block groups in the USA (median household income at least $250,000) and for whom microtargeting records suggest are in the top 5 per cent of earners nationally.Footnote 6 We further restricted the set of Americans to individuals who are in single-family homes with six or fewer registered voters at the address and for whom mailable addresses are available. From these households, we selected the oldest registered voter between the ages of 35 and 65 (to exclude those likely to be retired or too young to be leaders in their firms). If Catalist had information from public records that this individual had a professional license (for example, physician’s license, teacher’s license), the person was excluded, and the next oldest person was selected (to concentrate the target group to businesspeople). These restrictions led to an initial listing of 61,130 registered voters across the country for whom we have their home addresses and other personal data.Footnote 7
The 61,130 individuals in the initial sampling frame are located in twenty-six states (plus Washington, DC). That is, half of the states have zero individuals who meet the criteria for inclusion, namely because they do not have well-to-do Census block groups. More than half of the 61,130 are located in four states: New York, California, Connecticut, and Texas.
From the list of 61,130, we sampled a target set of 10,000 who would receive survey solicitations. We sampled different states at different rates so as to survey a broad range of individuals in different kinds of places. We oversampled individuals in states such as Nebraska, Utah, and Arizona and undersampled individuals in states such as New York, New Jersey, and Virginia. In the analysis below, as noted, we weight the sample to be representative of the population of 61,130 individuals who fit the study’s criteria.
Individuals in the study were solicited by an initial postcard in June 2022. The postcard alerted them to the study and that they would receive a larger packet with a questionnaire in the coming weeks. The postcard also provided a link to a website where the recipient could learn more about the survey, read an informed consent document, and take the survey online. Two weeks later, the paper survey materials arrived with a pre-paid return envelope. Several weeks later, a follow-up postcard arrived, offering a final reminder to take the survey. Data was collected from June to October 2022.
Representativeness, Response Rate, and Response Bias
Precisely defining ‘business elites’, as with precisely defining many categories of elites, is a fraught task (Kertzer and Renshon Reference Kertzer and Renshon2022). Our strategy was to target a set of wealthy Americans that, based on age and other public records, was likely to contain a high concentration of individuals who are in positions of authority in private sector companies. The survey materials explicitly described this as a survey of economic leaders, and that the person was targeted for the survey because ‘your demographic profile suggests you work in a business or other organization and you may have some insights into how leaders do, and should, interact with the political process’. The cover letter and questionnaire can be found in the Appendix. Because the sampling design does not ex ante exclude individuals who are not business elites, we use the questions on the survey to further isolate the group of business leaders. As detailed below, this strategy successfully yielded a sample of economic elites who have a window into corporate culture and corporate decision-making.
This sampling frame offers some advantages and some disadvantages compared to possible alternatives. For instance, one could identify records of managers of public firms, but the vast majority of businesses in the United States are not public firms. One could identify the records of political donors, but most people never donate politically: in 2020, about 4 million Americans made a political donation of more than 200 dollars, which compares with about 12 million citizen adults who are in the top 5 per cent of income earners, and one need not be in the top 5 per cent to donate 200 dollars.Footnote 8 In other words, most high-earners coming from the private sector are not contributing even modest political donations.
In the appendix (see Table SI1), we discuss a comparison between the zip codes of the 10,000 individuals we targeted versus the zip codes of Fortune 500 executives who are also political donors. While two-thirds of the zip codes of executives in our survey are the same zip codes as Fortune 500 executives, the differences are instructive. Because of our focus on single-family houses, we lack coverage of executives in Manhattan. Because of our focus on wealthy areas, we lack coverage of executives who live in areas with high degrees of income inequality (such as Las Vegas). On the other hand, because we are not restricted to the small set of individuals who are both donors and Fortune 500 executives, we survey a more diverse set of individuals, including those who live in Salt Lake City, Miami, Redmond, Washington and more, who are wealthy businesspeople who live in ZIP codes that don’t happen to host Fortune 500 executives.
Here, the sampling frame excludes certain kinds of business leaders, such as those who are not 35-65 and those who do not live in single-family homes in well-to-do neighborhoods. For example, the sampling frame excludes individuals who might be small business owners and leaders in business civic organizations but who live in middle-class neighborhoods or in poor states. However, compared to studies that are restricted to public companies, individuals working at smaller and medium-sized firms are better represented here. An alternative, but similar, methodology to the one taken here is to work with firms that identify business leaders based on their publicly listed titles and recruit them to participate in surveys. In the recent article by (Furnas and LaPira Reference Furnas and LaPira2023), this approach yielded a sample of 266 business leaders, primarily focused on executives in large firms.
Though our design may lead to an unknown over-representation of Democrats or Republicans among business leaders writ large, our analysis assesses respondents by party. Under the assumption that Republican/Democratic business leaders not in our sample would respond similarly to Republican/Democratic leaders in our sample, we can still learn about how Democratic versus Republican business leaders understand the political values of their company and its stakeholders. For instance, on some questions below, we see that Democratic and Republican business leaders answer the same way (but distinctly from the mass public). On other questions, Democratic and Republican business leaders diverge. Where they diverge and where they agree informs us of how the broader set of business leaders in the population would likely answer these questions.
Elite studies always involve tradeoffs that affect representativeness. For example, studies that use political donors as a proxy for wealthy people must contend with the fact that most wealthy people do not make donations; studies that examine publicly traded companies must contend with the fact that most companies are not publicly traded. Here, the limitations are the assumption that the for-profit businesspeople who took the survey are sufficiently representative of the target population of ‘individuals who are in decision-making roles in businesses’ and that the self-reported information from these business leaders reflects their true understanding of their firms.
Altogether, 9,998 individuals were solicited. Of these solicitations, 187 were returned to sender as undeliverable. We received 699 responses, yielding a response rate of 7 per cent. This response rate is not atypical for elite surveys or mass surveys (Broockman et al. Reference Broockman, Kalla and Sekhon2017). For instance, it is the same as Broockman and Malhotra (Reference Broockman and Malhotra2020).
Table 1, Column 1, shows gender, race, partisanship and age information for the unweighted sample of 9,998 individuals who were solicited to take the survey. Column 2 weights this population to be nationally representative (that is, concentrated in states such as Texas, California, and New York). Notably, in both Columns 1 and 2, the target population leans Democratic. That is, the typical registered voter of working age in a single-family home in the richest neighborhoods is more likely to be a Democrat than a Republican. Column 3 shows the demographics of the raw set of respondents to the survey. Comparing Column 1 to Column 3 reflects on response bias to the survey. The fourth column shows the sample characteristics after final weights are employed. The weights first account for the state oversamples and then account for response bias by calibrating to the target population on age, gender, race, and partisanship. While we can measure and address these forms of response bias, of course, there may be other more subtle elements of response bias that would be difficult to assess, as is the case in all surveys of this kind.
Demographics of Target Sample and of Survey Respondents
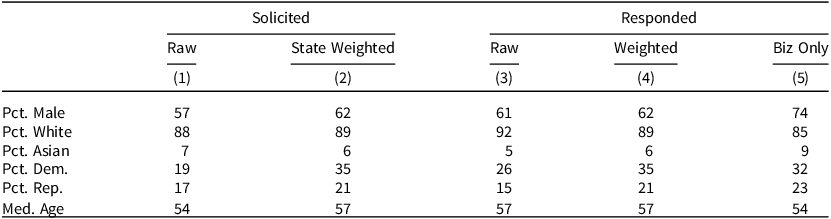
Note: The target sample includes 9,998 wealthy Americans. Of the 699 respondents, demographic data is available for 695 of them. Gender, Age, and Partisanship originate primarily from state voter files and otherwise are predicted by Catalist. Racial information comes primarily from a Catalist prediction of race except in states where race is a public record. The final column is weighted and restricted to the 317 respondents who work in businesses.
Of all respondents, 25 per cent are either retired, disabled, not currently employed, or government workers. Twenty percent are self-employed or independent contractors, and 9 per cent work in the non-profit sector. This leaves about half of the sample (47 per cent, or 320 individuals) who work at for-profit companies. We restricted our study to these individuals.Footnote 9
While this sample size of for-profit leaders is small relative to typical survey samples of the mass public, it is relatively large for elite surveys of this kind. By comparison, Page et al. (Reference Page, Bartels and Seawright2013) surveyed eighty-three wealthy individuals in one city, Rothman and Black (Reference Rothman and Black1999) surveyed 242 upper and middle management, and Nownes and Aitalieva (Reference Nownes and Aitalieva2013) surveyed ninety-two business leaders. Column 5 in Table 1 shows demographics for the subsample. The business people in the sample are similar on most dimensions to the weighted target population (Column 2) except they are far more likely to be male, which is expected given that those in corporate leadership positions are disproportionately male.Footnote 10
The private-sector respondents who took our survey report job titles consistent with our goal of reaching business elites. As Table 2 shows, the most common title is a C-Suite title, such as chief operating officer. Also common is vice president and manager. Ten percent of the responses come from CEOs and 6 per cent from presidents. In a separate question, we asked if the respondent manages others in their company: 84 per cent said yes. We asked about income level. The typical respondent who was willing to report income earns $250,000–$500,000 from their job (that is, just their share of a family income). The median respondent reports working fifty hours a week and having worked for their current company for ten years.
Title and Industry of Private Sector Respondents
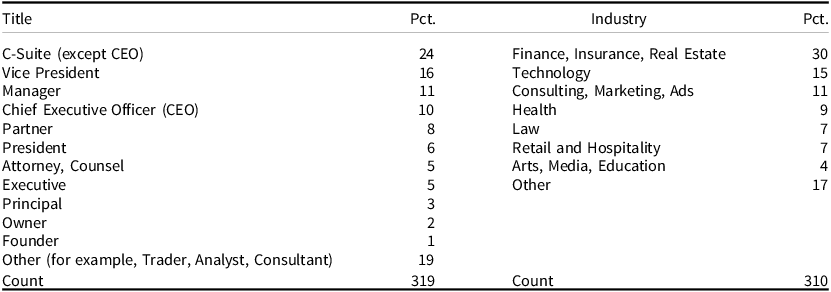
Note: Re-coding of open-ended response for job title and industry. Some respondents fall into multiple categories of titles.
The survey captures individuals in a wide range of companies. Almost half (47 per cent) work for companies with more than 1,000 employees, with a third working at companies with more than 10,000 employees. But a third (32 per cent) work for companies with fewer than 100 employees.Footnote 11 As Table 2 notes, the business leaders are distributed across several broad categories of industry, with the largest shares in the ‘FIRE’ industries of finance, insurance, and real estate and in technology. About 1 in 5 respondents selected industries not individually listed, such as aerospace, agriculture, automotive, construction, government contracting, logistics, manufacturing, oil and gas, shipping, and utilities. These miscellaneous industries tend to have the highest concentration of Republican identifiers. We do not have a clear baseline to assess the representativeness of industries in our sample.
In addition to the survey of economic leaders, we also fielded parallel questions to ordinary Americans, which was part of a module of the 2022 Cooperative Election Study (CES). Where appropriate and as noted below, we restrict the mass sample to individuals who work in companies.
Analysis
Elite vs. Mass Perceptions
Before investigating our core question about stakeholders and policy preferences, we start our analysis with a preliminary question of whether the notion of companies moving left is a mirage, a national news drama that is detached from the reality of what business leaders are seeing in their own companies and across major companies in the USA. To test for this, we asked both the mass public and business leaders about whether a) major companies in the USA, b) major companies in their own state, and c) their own company have moved politically to the left or the right or neither in recent years. If the public perceives that companies are moving left but business leaders do not see it that way, then this would suggest that the perception of a major coalitional shift is the result of media hype rather than something more durable. Similarly, if mass or elite respondents imagine that national companies are shifting politically but not their own company, this too would signal that a political shift is more an image than a reality. However, if elites perceive a Democratic realignment in their very own company, this would suggest a real coalitional shift of companies moving toward the Democratic Party, a shift in perception not merely attributable to a mass media narrative.
We asked both the mass public and our sample of business leaders whether, in the last decade, the business community in [the USA/your state] has become more aligned with the Democrats or Republicans or neither. We also asked business leaders (and a subsample of the mass public who are employed in businesses) about their own companies.
In Figure 1 (and in the analyses below), we recode answers so that ‘more Democratic’ equals 1, ‘about the same’ equals 0, and ‘more Republican’ equals −1. The benefit of this scale is that it summarizes responses in a single number: a number close to 1 means that nearly everyone answers ‘Democratic’, and an answer close to −1 means that nearly everyone answers ‘Republican’. The drawback of this scale is that it loses some information. For instance, a value of 0.5 could result from 75 per cent of respondents selecting ‘Democratic’ and 25 per cent selecting ‘Republican’, or it could result from 50 per cent of respondents selecting ‘Democratic’ and 50 per cent selecting ‘about the same’. For key analyses, we include tables in the Appendix that show statistics for all response categories.
Perceptions of Corporate Political Realignment.
Note: Means with 95 per cent confidence intervals are shown on the −1 to 1 scale. For the mass survey (2022 CES module), 681 respondents answered the national business question, and 647 answered the state business question. The question about one’s own business is restricted to respondents who are currently working for for-profit companies (N = 146). The elite survey is restricted to those working in for-profit businesses. N = 210, 215, and 195, on national, state, and one’s own business, respectively. Independents who lean toward one party or another are coded as partisans.
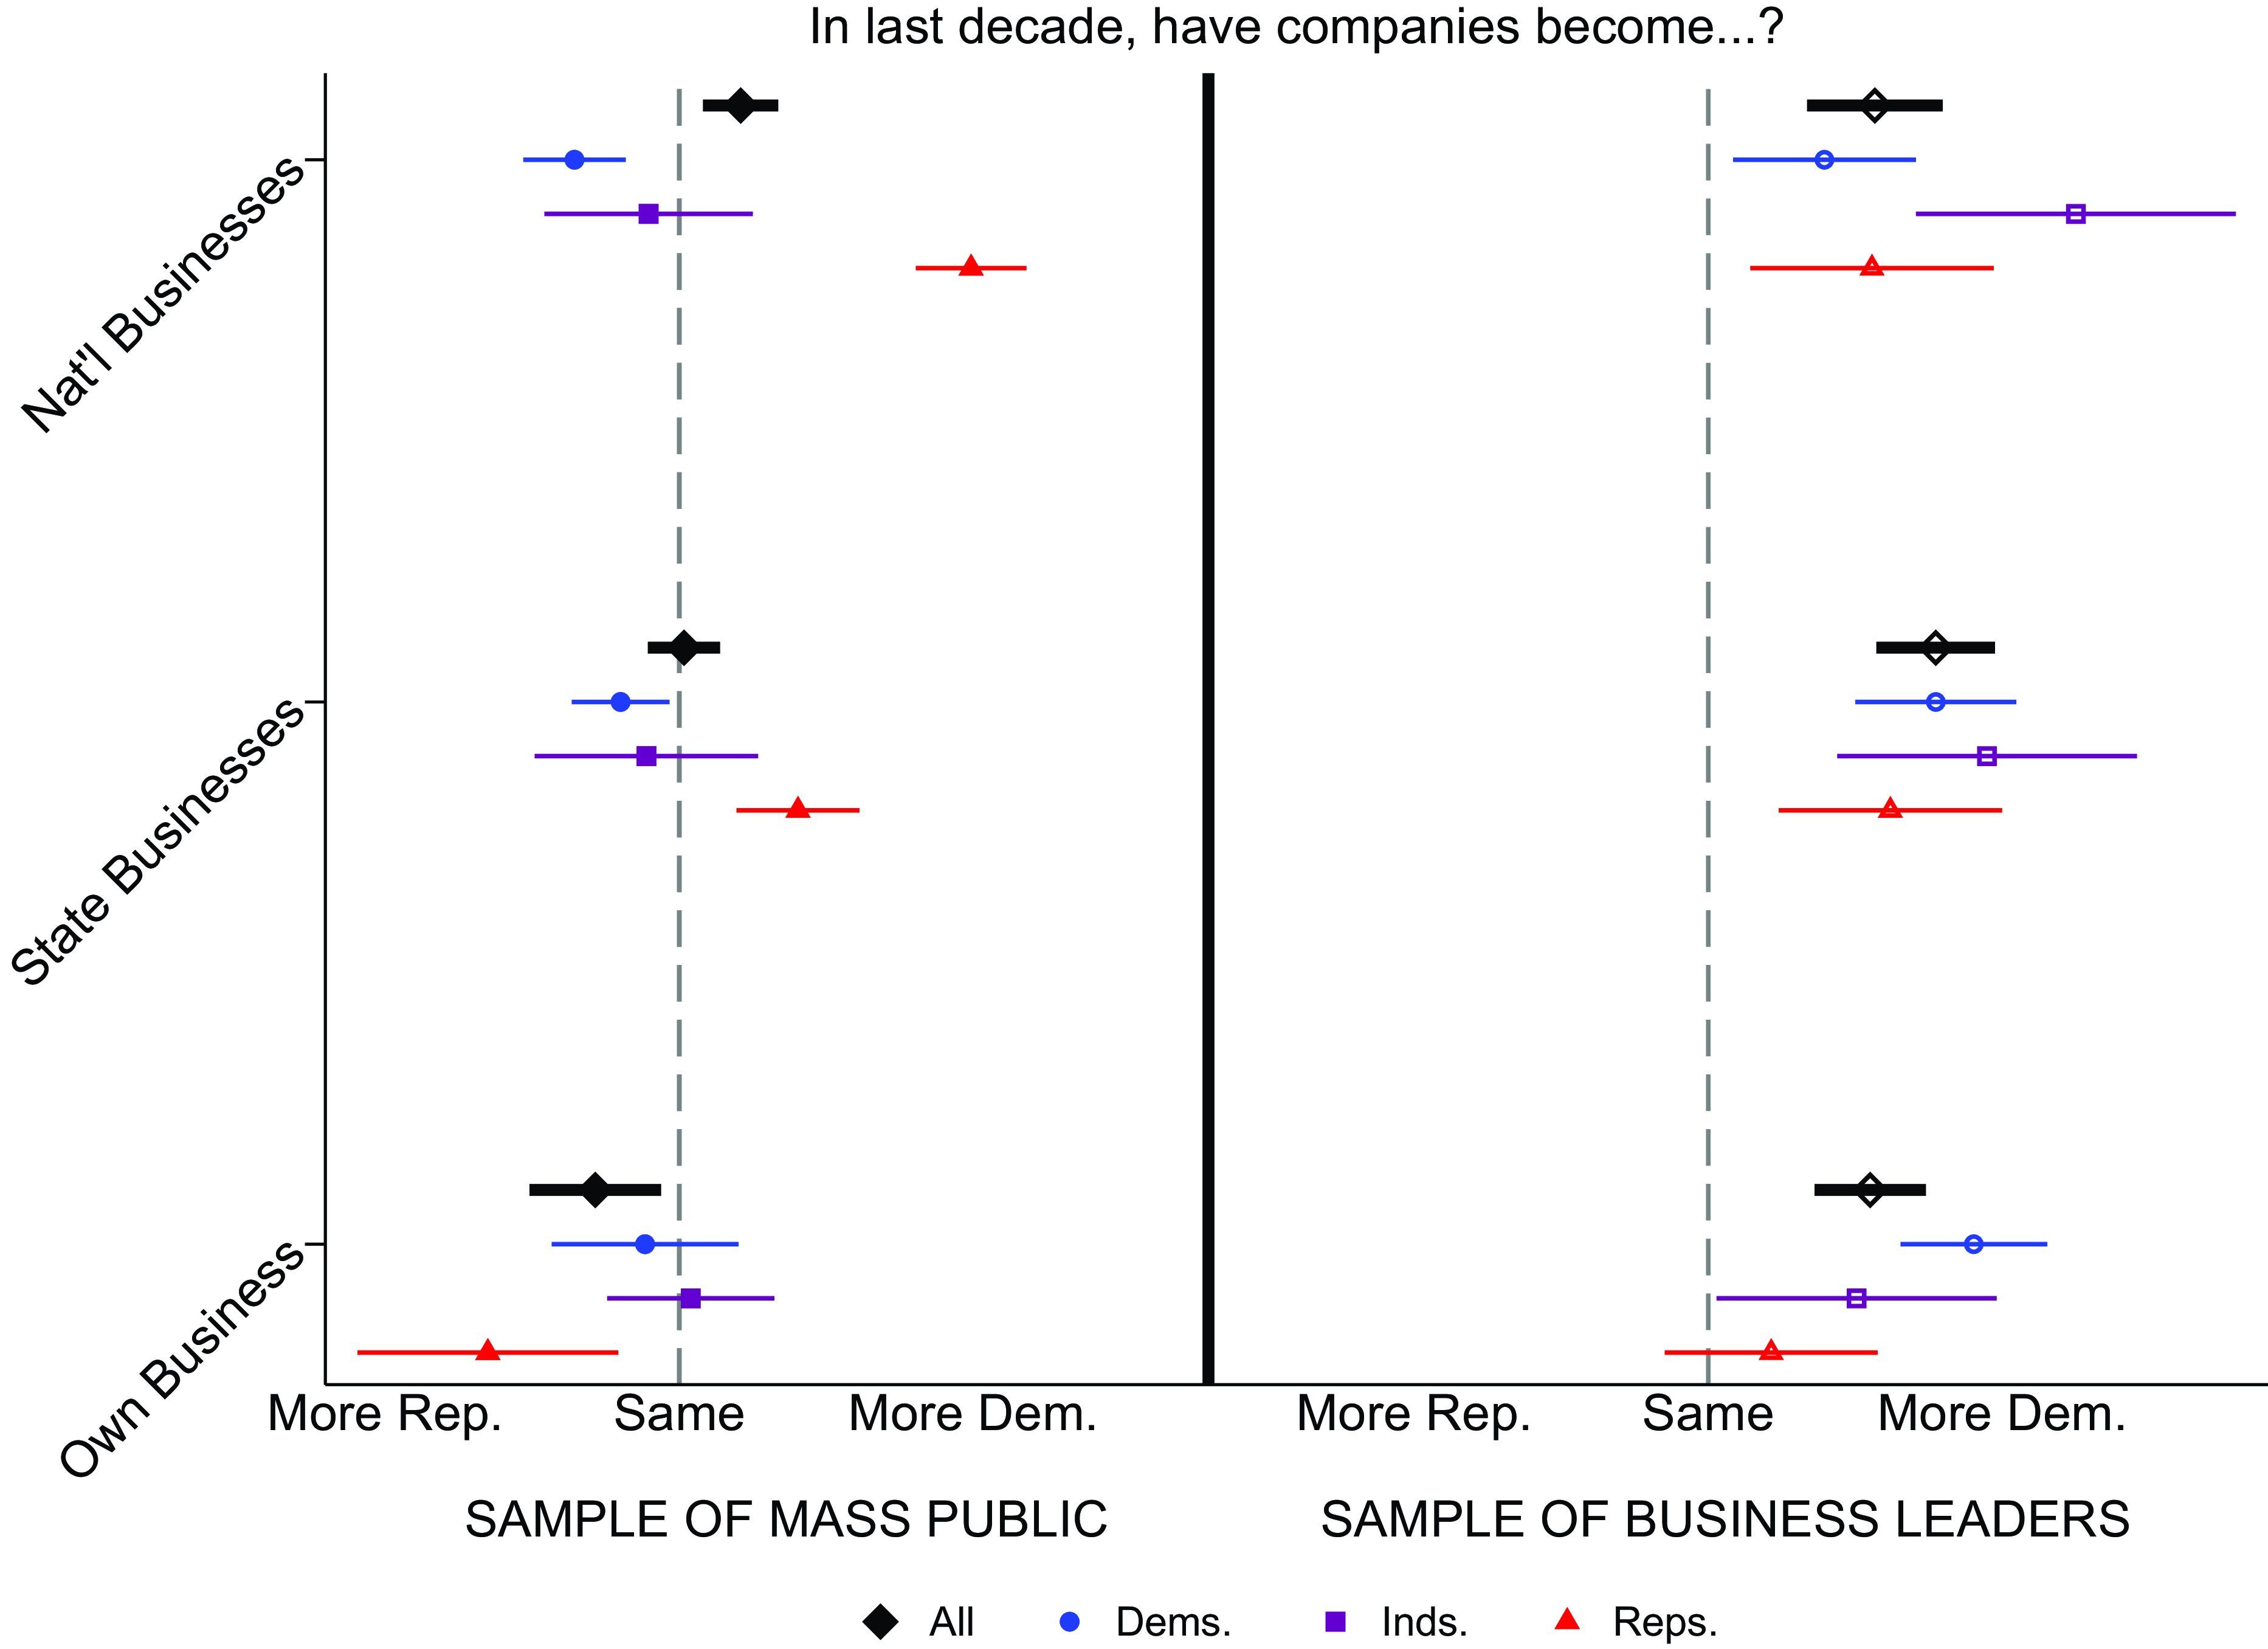
Figure 1 reveals remarkable differences between the mass public and business elites. Across the whole sample of the mass public, respondents do not overwhelmingly think that business has moved coalitions over the last decade. They are slightly more likely to think national companies have moved toward the Democrats and that their own company has moved toward the Republicans. What is hidden in these averages is that Republican identifiers in the mass public see businesses in their state and especially businesses nationally moving toward the Democrats. The evidence is consistent with the idea that Republicans in the mass public receive information from elite influencers (for example, media personalities) reporting that major businesses are becoming aligned with the Democrats. As Appendix Figure SI1 shows, ‘strong Republicans’ are especially likely to perceive this realignment. Democratic and independent identifiers in the mass public do not see things that way.
The right side of Figure 1 reveals that business leaders essentially think that the Republican identifiers are correct. Business leaders in general, and within every partisan group, believe that the national business community, the state business community, and their own business have become more aligned with the Democrats in the last decade. With regard to their own companies, it is the Democratic business leaders who are most likely to perceive a Democratic shift. This evidence is inconsistent with the notion that the story of ‘woke corporations’ is something merely in the heads of strong Republicans and conservative pundits. Business elites of all parties sense a change is underway.
Stakeholder Cross-Pressure
To begin to understand why business leaders might see their companies as increasingly aligned with the Democrats, we ask about the partisan leanings of the company and of a set of stakeholders. Specifically, we asked, ‘Do you perceive your company or organization as more aligned with the Democrats or the Republicans?’ This is different from the question previously observed about whether the company has changed over the last decade. We will return to that ‘change’ question below. Here, we ask about the company’s current alignment overall, as well as about the alignment of six stakeholders: the CEO, other executives, employees, suppliers and vendors, customers, and boards of directors. We exclude suppliers and vendors in our main analysis, as most respondents have no insight into the partisan leanings of this stakeholder. We code companies and stakeholders that lean Democratic as 1, those that lean Republican as −1, and those that lean neither as 0. To see the full set of responses from which this variable is recoded, see Appendix Table SI2.
In Figure 2, we plot the respondents’ evaluation of the partisanship of five key stakeholders as well as the company overall. Overall, companies are viewed as leaning Democratic, and this is driven by Independent as well as Democratic elite respondents. Later in the paper, we employ a regression analysis to measure the extent to which partisan differences in evaluating one’s company is merely standing in for the fact that Democrats and Republicans are in different kinds of companies. While some industries (for example, technology) and firms with larger workforces are associated with Democratic alignment, the strong relationship between individual partisanship and perceptions of the firm’s politics is robust when accounting for these controls.
How Business Leaders Perceive Corporate Stakeholders.
Note: Means with 95 per cent confidence intervals are shown on the −1 to 1 scale. The analysis is restricted to those working in for-profit businesses. Sample sizes vary as some business leaders did not know how to place certain stakeholders, or these stakeholders were not applicable to their businesses. Observation counts range from 256 (overall evaluation) to 135 (board evaluation).
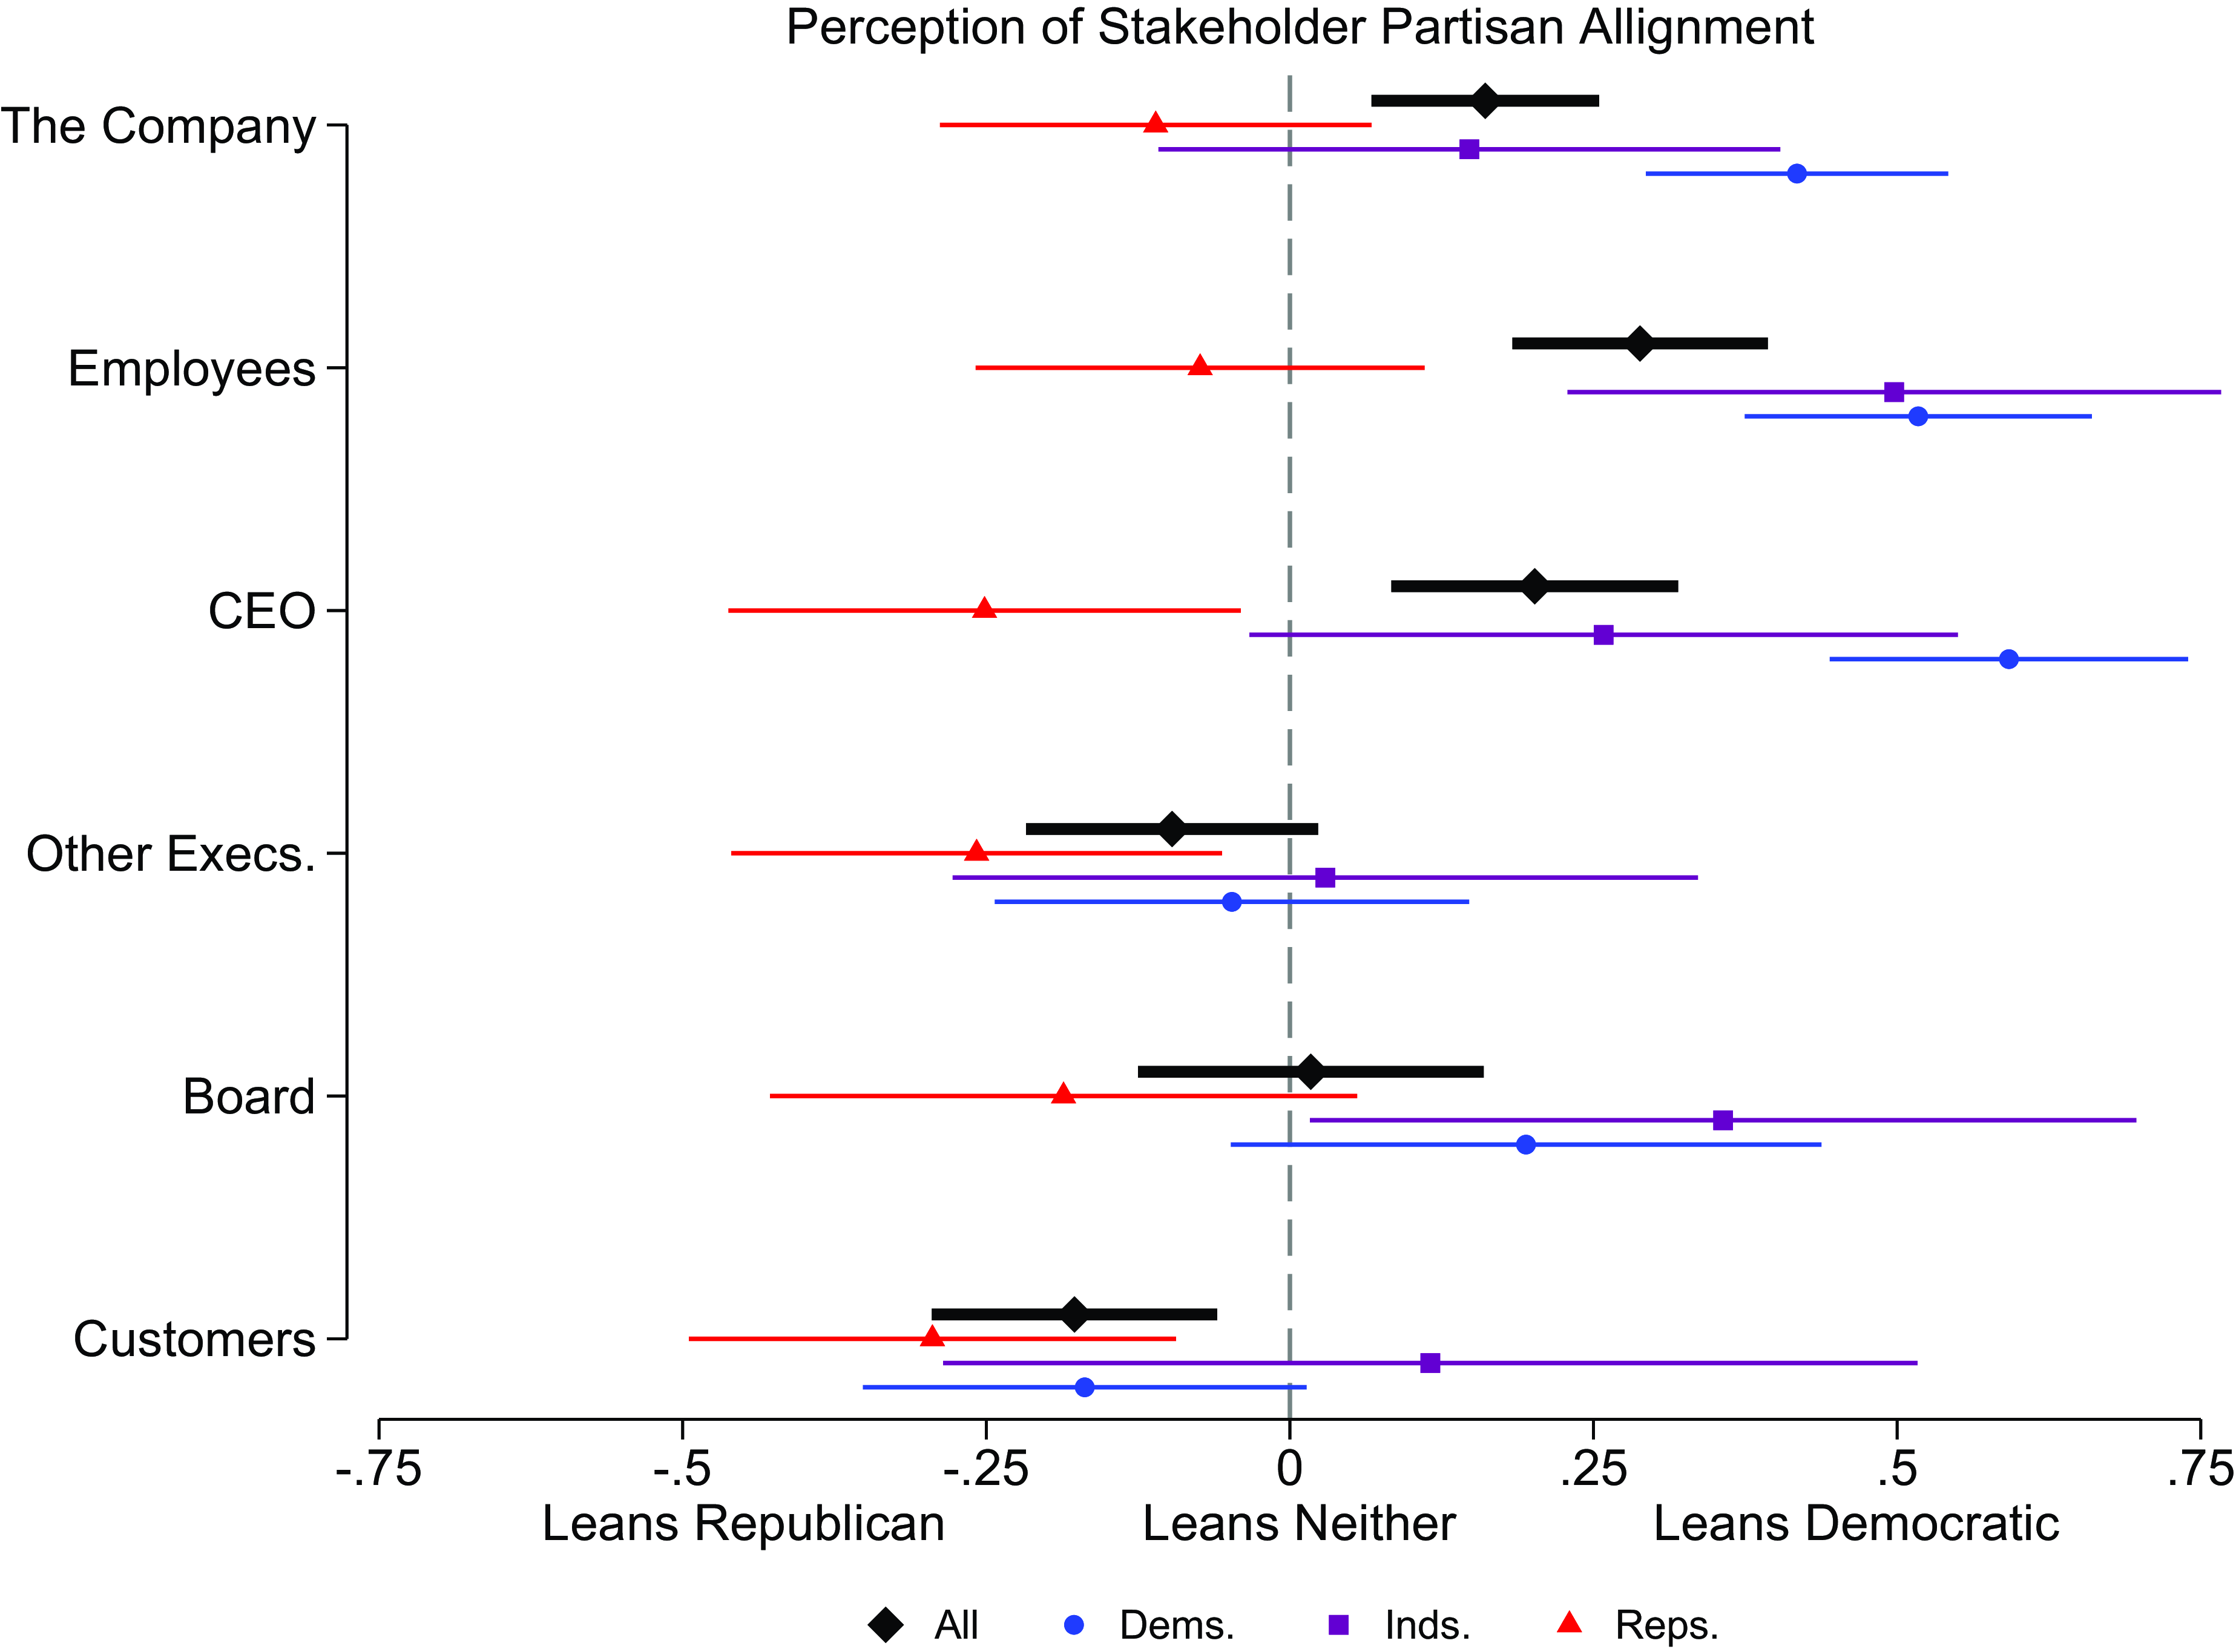
Republican respondents do not appear to differentiate very much between the stakeholders in Figure 2. The company and its employees and board are indistinguishable from leaning toward neither party. The other stakeholders have similar point estimates but have 95 per cent confidence intervals all on the ‘leans Republican’ side. Independents, and especially Democrats, see things differently in their firms. On average, they rate the company, its employees, its board, and its CEO as leaning Democratic, but the other executives and customers are perceived as neutral or Republican.
The evaluations of each of the stakeholders are highly correlated with the overall rating of the company. The correlation coefficients range from 0.56 (the relationship between employee evaluations and the company overall) to 0.79 (the relationship between board of directors evaluations and the company overall).
But what happens when stakeholders are perceived as politically at odds? How does that affect a business leader’s evaluation of their company? Given the small sample, particularly once we look at respondents who perceive internal division in their firms, our first pass at answering this question focuses on just two stakeholders: the CEO and employees. These are the stakeholders about which the most respondents had an opinion about their partisan leanings.
In Table 3, we focus just on the joint evaluation of the partisanship of the CEO and of employees. In this table, we show the means for the overall rating of the company. About half of the respondents are in the upper-left and lower-right corners. That is, they either think both the employees and the CEO lean Republican (upper-left) or that both the employees and the CEO lean Democratic (lower-right). In these cases, there is no stakeholder cross-pressure that pits employees and CEOs against each other. In the upper-left case, nearly all respondents see the company overall as Republican (a mean of −0.97 on a −1 to 1 scale). In the lower-right case, nearly all respondents see the company overall as Democratic (0.88 on a −1 to 1 scale).
Employee vs. CEO Cross-Pressure and the Evaluation of Democratic or Republican Leaning of Company

Note: Each cell shows the mean of the −1 to 1 scale of the overall partisanship of the company. Observations in parentheses. For instance, the first cell shows that among 26 respondents who think the CEO of the company and employees of the company lean Republican, they nearly all believe the company overall also leans Republican in that the average score for the company evaluation is −0.97.
When the stakeholders are seen as at odds, an interesting phenomenon emerges from Table 3. It is not that one stakeholder matters more than the other, but that there is a partisan asymmetry in the evaluations. If either the CEO or the employees are perceived as Democratic (third row or third column), then the overall evaluation of the company tends to be Democratic. But if either the CEO or employees are perceived as Republican (first row or first column), the company is not necessarily perceived as Republican. While the sample sizes here are small, this initial analysis suggests an idea we had not anticipated: that stakeholders belonging to one party (the Democratic Party) are more salient to a leader’s understanding of his or her firm.
To quantify this beyond the example in Table 3, we create scales based on the five stakeholders we study. The Democratic scale counts the number of stakeholders whom a respondent thinks are aligned with the Democrats. The Republican scale counts the number of stakeholders whom a respondent thinks are aligned with the Republicans. At each position on the scale, from 0 to 5, we calculate the average rating of the company overall, which ranges from −1 (Republican company) to 1 (Democratic company).
In Figure 3, the blue line shows the Democratic scale. A zero on this scale means the respondents thought that 0 out of 5 stakeholders were aligned with Democrats. At this position, the company overall is viewed as Republican (hence the position of the first blue dot well below the dashed line). But when just one stakeholder is considered Democratic, the overall evaluation of the company now tends to be Democratic. The Republican line is not quite symmetric. When zero stakeholders are thought to be Republican-aligned, clearly, the overall company evaluation is that it leans Democratic. But when one or even two stakeholders are thought to be Republican, the company is still not thought of as Republican. Only when the majority of identified stakeholders are thought of as Republican do respondents identify the company overall as Republican.
Stakeholder Cross-Pressure and the Evaluation of the Partisan Alignment of the Firm.
Note: The blue line corresponds to the number of stakeholders that the respondent perceives of as Democratic-aligned. The red line corresponds to the number of stakeholders that the respondent perceives as Republican-aligned. Means and 95 per cent CIs are shown on the -1 to 1 scale for the evaluation of the company’s overall partisan alignment. If just one stakeholder is viewed as Democratic (blue line), the company overall is viewed as Democratic. But the majority of stakeholders have to be viewed as Republican (red line) in order for the respondent to consider the company overall as Republican.

How do we make sense of this finding? Of course, the asymmetry we measure is modest, and this finding is not one we anticipated, so caution is warranted. But one possible explanation of the apparent phenomenon is that businesspeople may generally feel that the natural alignment of their company is either non-partisan or Republican, as for many decades the business community was considered Republican-aligned. So, when any stakeholder in their firm is overtly Democratic, whether it’s a CEO or employees or the board of directors, that carries outsized weight in the mind of the business leader in identifying his or her company’s political home base. Another possibility is that Democratic stakeholders may be more open about their political views than Republican stakeholders are, and that openness affects the overall assessment of the firm.
To sum up the evidence in this section, we see that a) Democrats and Independents tend to view their companies as Democratic and to specifically view CEOs and employees as Democratic aligned; b) there is a strong correlation between labeling each stakeholder as aligned with a party and labeling the company overall as aligned with a party; c) business leaders appear to navigate cross-pressure through an asymmetric party evaluation, in which any one stakeholder seeming as Democratic-aligned corresponds to labeling the whole company as Democratic-aligned.
Policy Cross-Pressure
We asked business leaders, ‘What domestic policy issue do you think is your company or organization’s highest priority?’ Three-quarters of business leaders (76 per cent, N= 316) named a priority. We coded their answers into 11 categories. The most popular categories are economy (32 per cent), diversity, equity, and inclusion (DEI) (20 per cent), regulations (14 per cent), healthcare (10 per cent), and environment (9 per cent). Smaller categories include guns/crime (3 per cent), security (2 per cent), immigration (2 per cent), democracy (1 per cent), education (1 per cent), housing (<1 per cent), and all others (6 per cent).
Clearly, how a business leader perceives the company’s highest policy priority can vary with the position of the leader: a government relations executive might think more of regulations, an in-house counsel worried about lawsuits might think of DEI, and so on. A leader’s own partisanship may also influence his or her judgment, with Republicans pointing to more economic issues such as inflation or taxes and Democrats pointing to more social and environmental concerns.
We had anticipated that most respondents would consider policies related to the economy or regulations to be the company’s highest priority. Our results show that almost half (46 per cent) of respondents chose one of these two categories. Examples of answers classified as economic are those mentioning taxes, inflation, competition, workforce shortages, and growth. The regulation category is broader in that it incorporates a variety of particularistic answers – bank regulations, FDA regulations, FTC regulations, ‘procedure reimbursement’, regulations of ‘engineered plants’, tort reform, and so on.
After asking respondents about their policy priority, we then asked, ‘On the issue listed in the question above, is the company more aligned with Democrats or Republicans?’ They could choose Democrats, Republicans, or neither.
If a respondent wrote down a policy that is classified as economic or regulation (N $ = $
101), they were almost four times more likely to say that the company is aligned with the Republicans on the issue as aligned with the Democrats: 57 per cent selected Republicans versus 15 per cent selected Democrats, and 28 per cent said neither. If a respondent wrote down a policy in any other category (N
$ = $
101), they were almost four times more likely to say that the company is aligned with the Republicans on the issue as aligned with the Democrats: 57 per cent selected Republicans versus 15 per cent selected Democrats, and 28 per cent said neither. If a respondent wrote down a policy in any other category (N $ = $
131), they were seven times more likely to say the company was aligned with Democrats on the issue as aligned with Republicans: 64 per cent selected Democrats versus 9 per cent selected Republicans, and 27 per cent neither.
$ = $
131), they were seven times more likely to say the company was aligned with Democrats on the issue as aligned with Republicans: 64 per cent selected Democrats versus 9 per cent selected Republicans, and 27 per cent neither.
The literature on corporate lobbying would suggest that business leaders who perceive their company as Democratic-aligned might say that the company’s general policy stances are more aligned with the Democratic Party on account of the political preferences of their workforce but that this ostensible alignment is unrelated to the core policy priorities of the firm. On their policy priorities, in practice, the firm is perhaps more clearly aligned with the Republican Party. If this is the case, then even business leaders who believe they work in Democratic-aligned firms would articulate a Republican-aligned policy priority.
As Table 4 shows, this is not the case. Three-quarters of respondents who believe their firms are Democratic-aligned also believe that the firm’s core policy is aligned with Democrats (third row). This is the mirror image of respondents who believe their firm is aligned with Republicans; 77 per cent believe the core policy is Republican (first row). The company’s alignment and the policy alignment are highly correlated. Few business leaders believe there is cross-pressure such that their company leans one way but the core policy priority is another way.
Firm Partisan Orientation and Policy Priorities
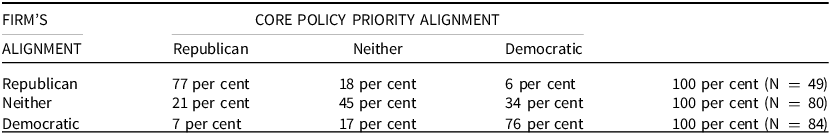
Note: Row percentages show whether respondents believe the core policy priority is aligned with Democrats or Republicans (or neither), depending on whether they think the firm overall is Democratic or Republican aligned.
Perhaps, though, these results are driven by the fact that Republican identifiers tend to think their firms are Republican and Democratic identifiers tend to think their firms are Democratic. And maybe one’s personal political alignment leads one to believe that the company’s core priority is aligned with their own values. To assess this possibility, we use a simple OLS regression model where the dependent variable is the political alignment of the firm’s core policy priority, and the explanatory variables are a) perceptions of the firm’s alignment and b) indicator variables for Democratic and Republican identification. Regardless of whether we control for partisan identification of the respondents, there is a strong, statistically significant relationship between the assessment of the firm’s political alignment and the assessment of the main policy priority of the firm. See Table SI3.
To sum up this section, about half of the business leaders believe the core policy priority of their business relates to the economy or to regulation. These respondents believe that on this core priority, the company is aligned with Republicans. They tend to believe the company overall is aligned with Republicans. The other half of business leaders think the core policy priority is something like diversity, health care, or the environment. These leaders tend to think that on this policy, the company is aligned with the Democrats and that overall, the company is aligned with the Democrats. In other words, the Democratic aligned companies consider their core policy priority to be Democratic aligned. They, like the Republican aligned companies, exhibit a lack of policy cross-pressure. Or, put another way, to the extent these companies have policy cross-pressure, they have resolved the cross-pressure, at least in the minds of the business leaders, by aligning the policy priority with the party coalition with which they identify.
Realignment Pressure
Our survey reached the homes of business leaders at one particular snapshot in time, but the questionnaire asked about the past and the future: how their companies have changed from a decade ago and where the companies are heading. As previewed in Figure 1, we asked respondents, ‘Over the last decade or so, has your company become more aligned with the Democrats or with the Republicans?’ We also asked about each of the core stakeholders and whether they have shifted their alignment. Figure 4 has the summary plot. Appendix Table SI4 has the raw response statistics.
How Business Leaders Perceive Corporate Stakeholders Changing.
Note: Means with 95 per cent confidence intervals are shown on the −1 to 1 scale. The analysis is restricted to those working in for-profit businesses. Sample sizes vary as some business leaders did not know how to place certain stakeholders, or these stakeholders were not applicable to their businesses. Observation counts range from 195 (overall evaluation) to 112 (board evaluation).
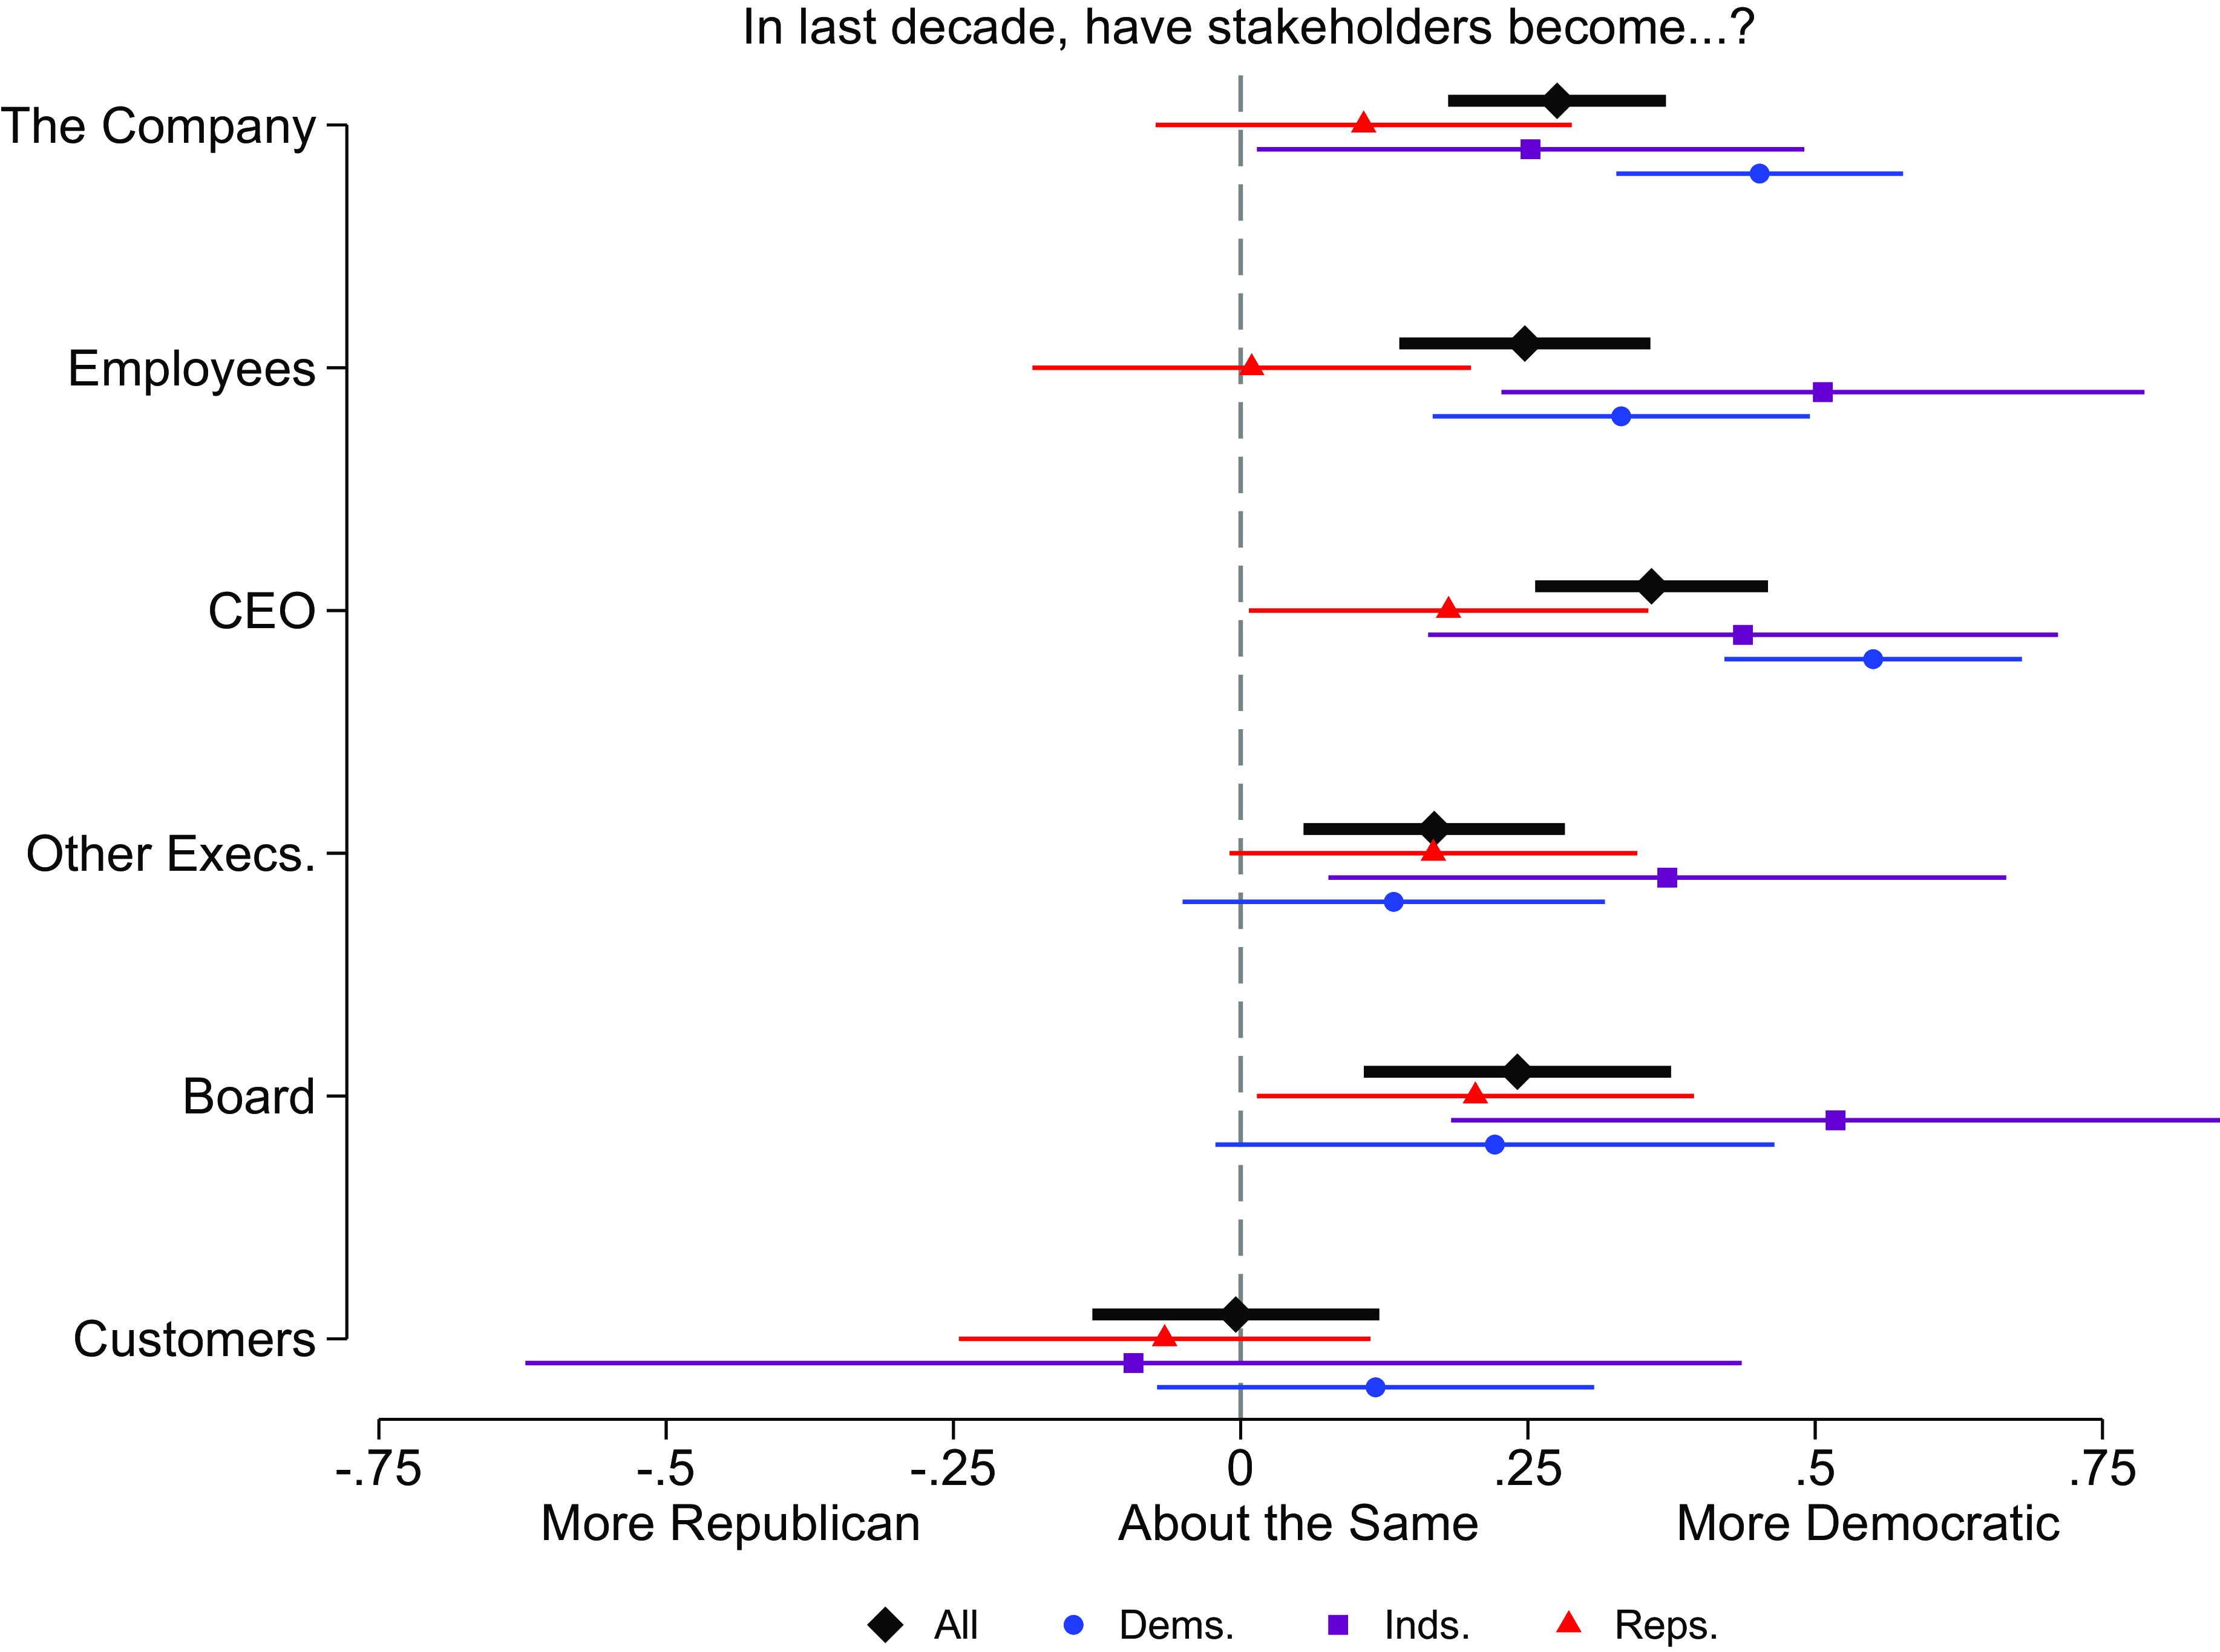
While Democrats and Republicans might bring different perceptual biases to this survey, the similarity in responses to these questions across partisan identity in Figure 4 is notable. Compare Figure 4 to Figure 2. In Figure 2, Republican and Democratic business leaders have different perspectives on the partisan orientation of their companies and their stakeholders, with Democrats thinking their firms are Democratic-aligned and Republicans thinking their firms are Republican-aligned. Moreover, stakeholders are viewed differently from one another: CEOs and employees are viewed more Democratic-aligned, while other executives and boards of directors are viewed more neutrally. In Figure 4, there is less variance by stakeholder and by political identity of the business leaders. That is, respondents were much more consistent in the view that firms were moving toward the Democrats rather than toward the Republicans. The consistency of this result across respondents may signal its robustness. As already discussed, when business leaders describe their firms’ politics, they may be projecting their own views. When Democratic business leaders say their firms lean Democratic and Republican leaders say their firms lean Republican, it is hard to know how much of their perception is just a function of their own projections. But here, Republican and Democratic respondents are answering in similar ways. This makes the trend they are describing more believable – that firms really are re-aligning toward the Democrats.
In Table 5, we employ a regression model to measure the evaluation of the company’s overall partisan leaning (Model 1) and change in its partisan leaning (Model 2). We measure how individual-level partisanship, company size, and industry correspond to these evaluations. Whereas the partisanship of respondents predicts perceptions of the partisan position of the company in Model 1, the point estimates in Model 2 are smaller and not statistically significant. In other words, there appears to be less of a difference between how Democrats, Independents, and Republicans evaluate the change in their companies than in how they identify the current status in the companies. The current status is viewed differently by party identity, but the change is not: all see a move happening toward the Democrats. The coefficient on large companies (greater than 1,000 employees) is double the size in Model 2, suggesting that business people working in large companies are especially likely to think their companies have become more Democratic-aligned over time.
OLS Regression Estimating Company’s Partisan Leanings

Note:
The dependent variable in Model 1 equals 1 if the company is considered Democratic-aligned, −1 if Republican-aligned and 0 if neither. The dependent variable in Model 2 equals 1 if the company has become more Democratic in the last decade, −1 if more Republican, and 0 if it has stayed the same. Political independents are the excluded partisan category. Finance, Insurance, and Real Estate (FIRE) is the excluded industry category. ** p $\lt$
0.05, * p
$\lt$
0.05, * p $\lt$
0.1.
$\lt$
0.1.
Our study cannot distinguish between perceived partisan shifts that are attributable to changing positions of stakeholders, changing positions on policy, or changes in what it means to identify as Democratic or Republican. However, from our data, we can see that the respondents to our study seem to have shifted toward the Democrats over time. We can see this because each respondent is linked to a voter registration record, on which party registration is a public record. However, respondents may have registered to vote years or decades ago. Meanwhile, we asked the respondents directly about their party affiliation when they took their survey. Of the business leader respondents who were registered Democrats, 90 per cent of them on our survey identified as Democrats, whereas only 67 per cent of those registered Republican identified in the survey as Republican. Thus, part of the explanation for the perception that companies are moving toward Democrats reflects that the business elites responding to our survey seem to have moved toward the Democrats themselves.
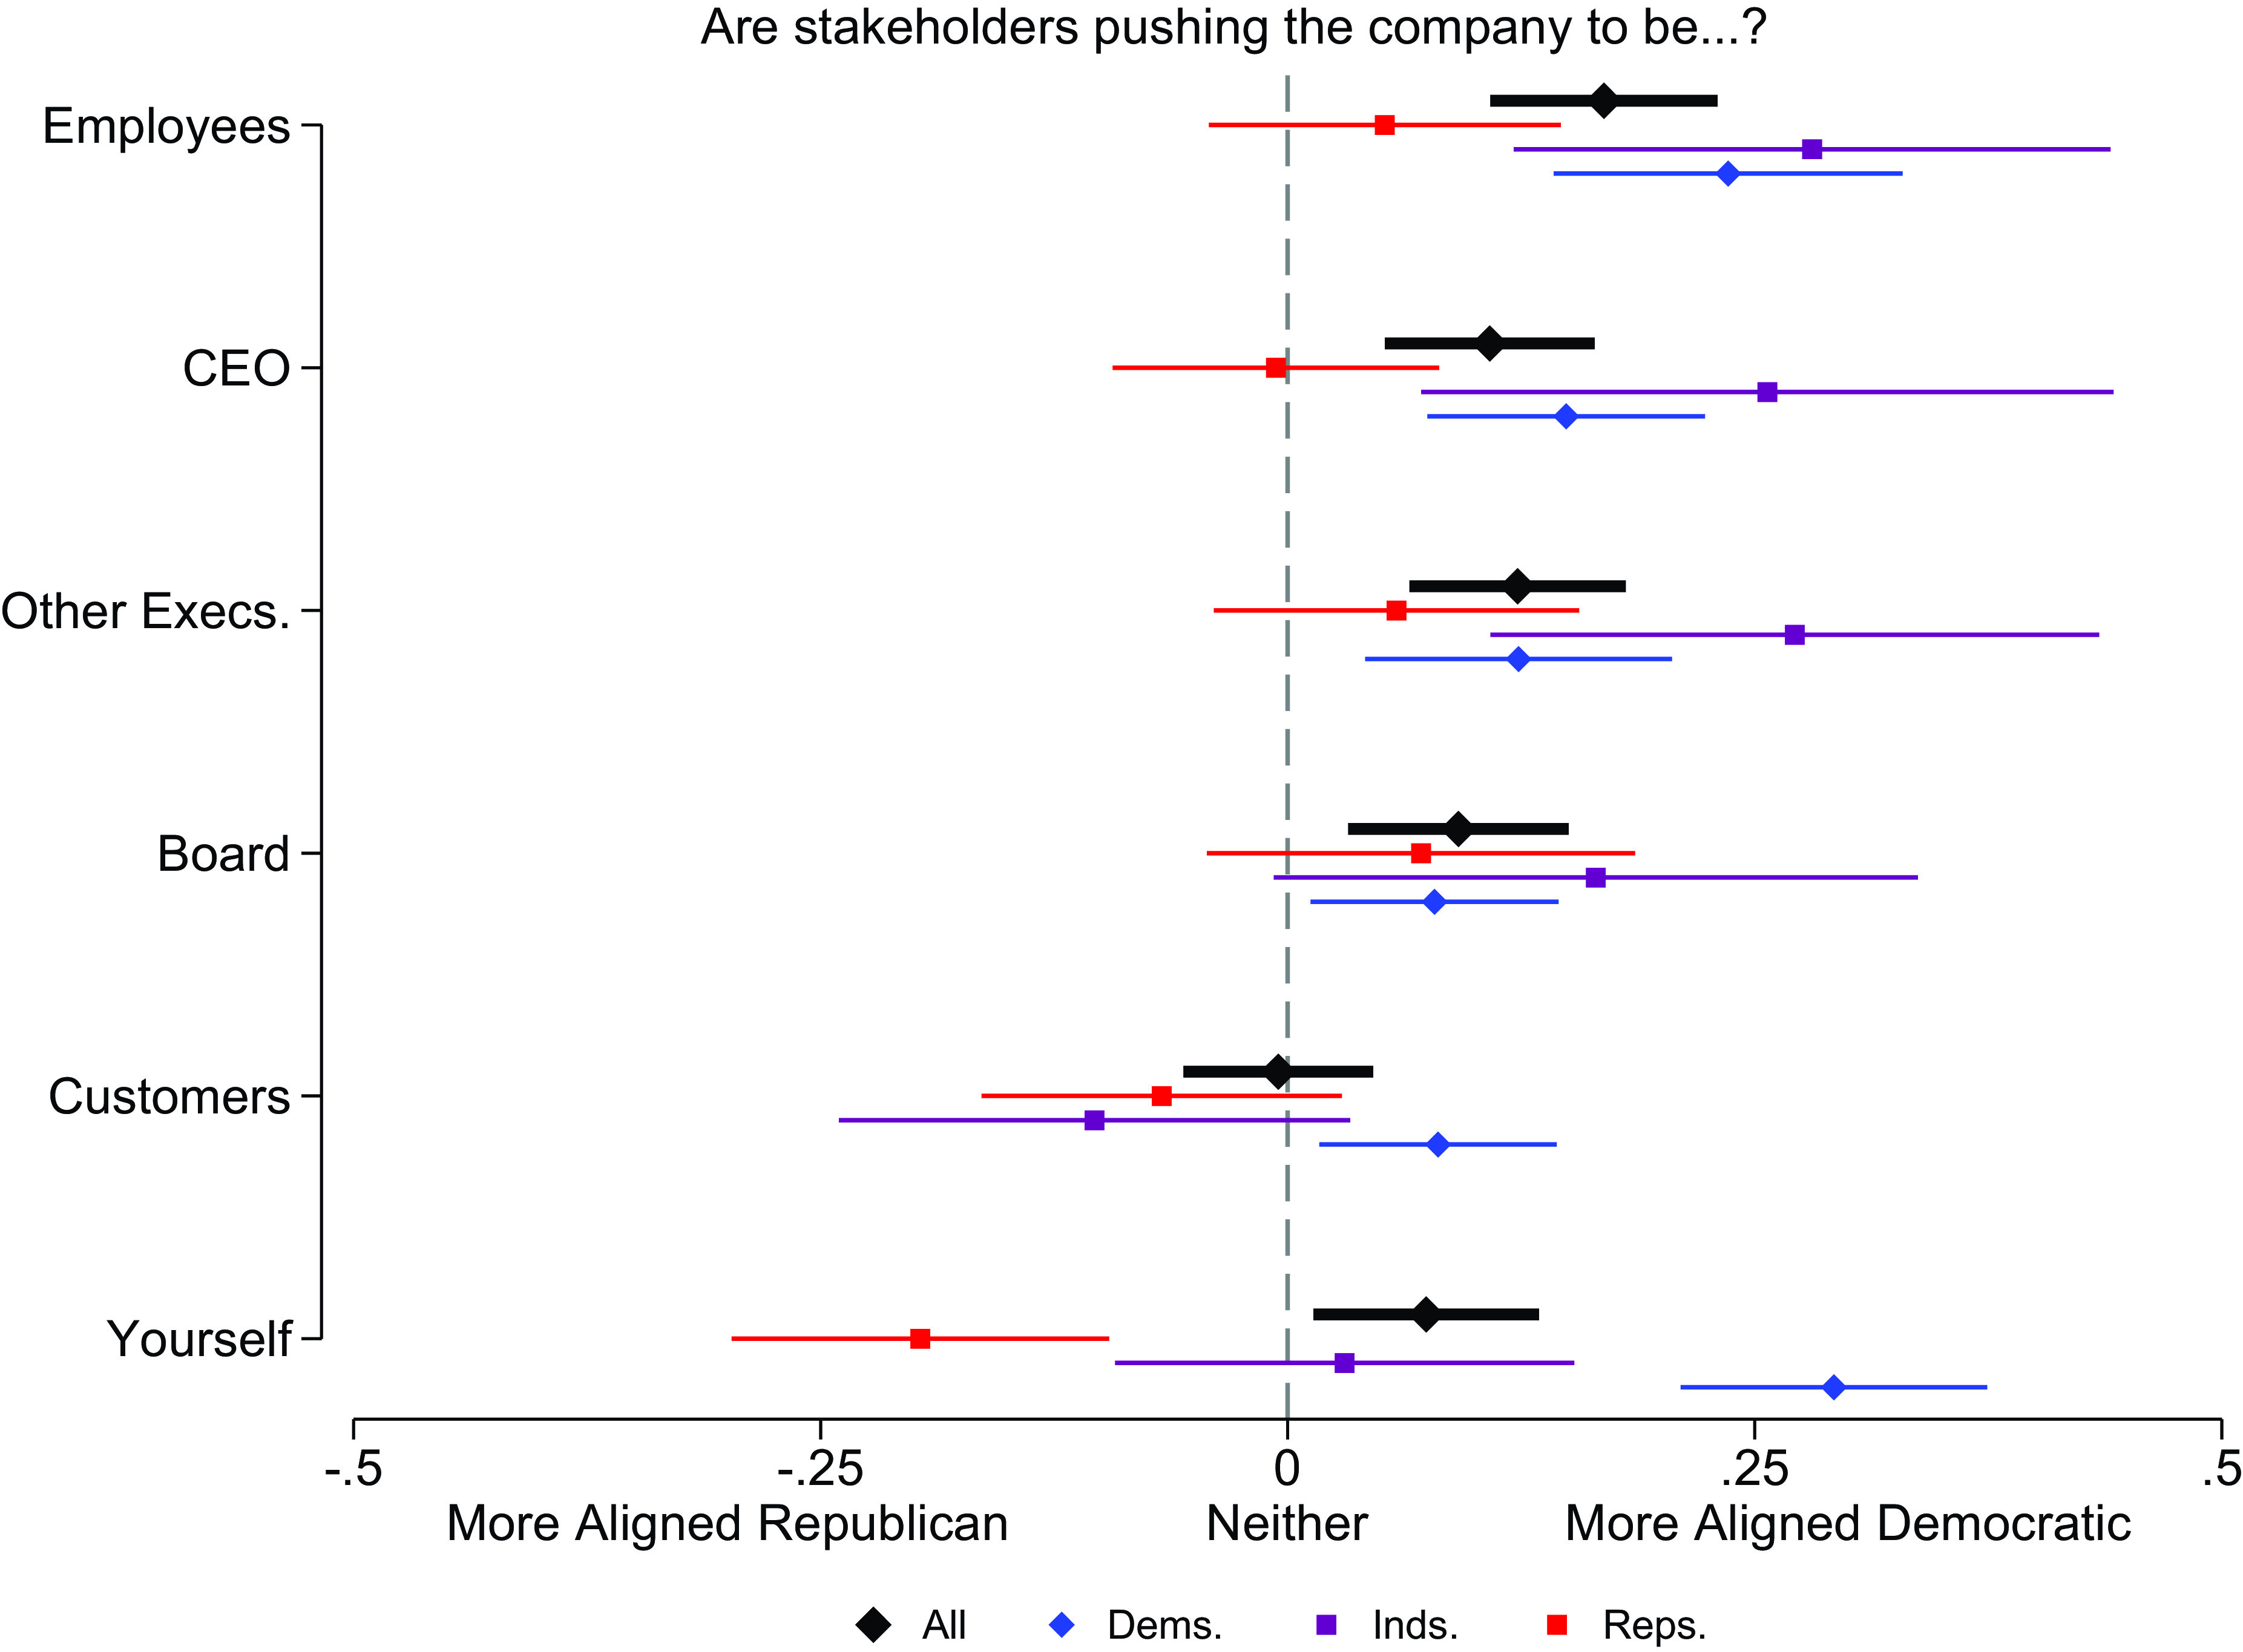
Our final analysis is in Figure 5. We assess which are the stakeholders that leaders think are pushing the company one way or another. Table SI5 shows the full set of responses to this question. We had expected employees to stand out as the stakeholders seen as pushing the company toward the Democrats. But, as Figure 5 shows, while employees indeed have the highest point estimate, CEOs, other executives, and boards of directors are also seen as pushing the company toward the Democrats. Customers are the only stakeholders not appearing to push the company. Interestingly, the respondents who are aligned with a party are willing to say that they, themselves, are pushing the company toward their own political orientation. It is also worth noting, as reflected in Table SI5, the majority of respondents do not think that these stakeholders are pushing the company one way or another. However, of those who do perceive stakeholders pushing, they perceive this mostly coming from the Democratic side.
Alignment of Company.
Note: Means with 95 per cent confidence intervals are shown on the -1 to 1 scale. The analysis is restricted to those working in for-profit businesses. Sample sizes vary as some business leaders did not know how to place certain stakeholders, or these stakeholders were not applicable to their businesses. Observation counts range from 252 (own self evaluation) to 192 (board evaluation).
To sum up this section, the belief that companies are moving toward the Democratic Party is widespread among business leaders. No matter their own party affiliation, in most industries, business leaders think that the company itself and most of its stakeholders have moved toward the Democrats. The stakeholders are seen as pushing the company toward the Democratic coalition. This is especially the case in larger companies. Before seeing these results, one might have imagined that the perception of a partisan realignment is isolated just among one partisan group of business leaders (for example, Republicans worried about ‘woke capitalism’) or just focused on one stakeholder group (for example, employees agitating for politicization). But that’s not what we find. The perception of change extends to nearly every stakeholder and is common among businesspeople of every political stripe.
Discussion
These findings are inconsistent with the dominant narrative in political science that corporations remain a Republican interest group and that public displays of progressivism are merely symbolic ploys. Business leaders see not just national companies and not just liberal employees but their own companies, including most of their stakeholders, as moving toward the Democrats. Few executives think their corporate culture is Democratic-aligned but that their core policy area is Republican-aligned. Of the business leaders who consider their company Democratic-aligned, they tend to believe that their company’s highest priority is an issue such as climate change, diversity, or healthcare on which their position lines up with the Democrats. This realignment has been long predicted by scholars observing the fissures in the Republican Party coalition in the last few decades and the corresponding elite turn in the Democratic coalition (Berry Reference Berry2013; Miller and Schofield Reference Miller and Schofield2008). But never before has the realignment been so apparent in the attitudes of business elites themselves.
Understanding the Differences with Prior Work
Having seen these results, it is worthwhile to revisit a couple of examples of recent research that seem to demonstrate conflicting results. One example is Cohen et al. (Reference Cohen, Hazan, Tallarita and Weiss2019), who measure political donations from CEOs of publicly traded companies. Publicly traded companies altogether represent less than 1 per cent of business organizations and employ fewer than a third of American workers. The authors collect data from just 31 per cent of publicly traded firms.Footnote 12 The data show that CEOs tend to be Republican donors.
Not only is the sample reflective of a small subset of business leaders, but these data reflect on answers to different questions than the ones we study. The personal donation behavior of executives can be unrelated to the political identity of a firm. Consider a firm like Oracle. Its leaders (for example, former and current CEO) are prominent Republicans. But the firm’s PAC is bipartisan, and the employees who make political contributions are overwhelmingly Democrat.Footnote 13 As another piece of seemingly countervailing research, consider Fos et al. (Reference Fos, Kempf and Tsoutsoura2022), matching executives at S&P 1500 firms to voter registration records. They find the executives in a non-representative subsample to be overwhelmingly registered Republican (70 per cent to 30 per cent). Of course, the same point holds for party registration as political giving. We here are not interested in the personal party affiliation of business leaders, but rather we’re interested in the identity of the firms. Furthermore, as noted above, our research indicates that a significant number of registered Republican business leaders no longer identify as Republican.
An important contribution of this essay is in the analysis of a firm’s political identity that is defined neither by the personal preferences of the CEOs nor by the PAC activity of the firm. When business leaders are asked about the partisan identity of their firm, most (85 per cent) can respond that the firm either leans Democratic, leans Republican, or leans neither. What do they mean when they say this? We have shown that their responses are highly correlated with their perceptions of the political alignment of stakeholders, such as executives and employees. We have also shown that their responses are highly correlated with the perceptions of the firm’s chief policy priority. But just as it is difficult to sort out the basis for which an individual aligns with the party (policy? group identification? vibes?), it is all the more difficult to define precisely the factors that lead to a perception of a firm’s alignment with a party. We hope this research encourages more work in this area.
Conclusion
Business leaders perceive that their firms are changing. What are the implications? Here are two. First, our mass survey shows that the public has not yet perceived the change that is underway (See Figure 1). We suspect that public attitudes toward the political parties and their candidates will be shaped by a growing awareness that one of the Republican Party’s pre-eminent interest groups may be joining the other side. Our findings call for continual monitoring of the public’s perceptions of which interest groups are aligned or not aligned with their preferred party. The esteem of business in the eyes of the public may rise if they perceive business as more independent of political parties. The perceptions may also be polarized, where Republican voters increasingly have negative sentiments toward business and Democratic voters have increasingly positive sentiments toward business.
Second, to the extent that companies are moving toward the Democrats, they will likely face policy issues that conflict with the Democratic Party’s other interest groups. We suspect that Democratic Party officials will attempt to pressure businesses to negotiate exclusively with their side. To the extent that corporate stakeholders such as employees aid the Democratic Party in this effort – by applying pressure on companies not to engage with Republicans whom they deem extremists — then the companies may settle fully into the Democratic Party’s orbit. Democratic lawmakers will then need to manage the demands of business with the demands of their other coalitional members, some of whom are overtly antagonistic to corporations.
Our study comes from surveying several hundred business leaders at one snapshot in time. The study’s methodology is innovative in how the business leaders were identified and recruited. The survey design – asking respondents about the political alignment of their company and its stakeholders – is innovative too; as far as we know, it is the first survey to ask questions of this sort. The limitations of our study are as clear as its upsides. We must make the assumption here that the respondents are representative of business elites generally and that they provided honest answers to our questions. We do not know the extent to which the timing of our survey influenced results such that replicating the study in the future would generate different answers. We envision this study, as with all studies, as being in conversation with other scholarship in this research agenda, filling in a few pieces of a complex puzzle. By using a survey and digging into perceptions of policy priorities and cross-pressured stakeholders, we hope that future surveys and future work using other research methods can build on this theoretical and empirical contribution.
One future direction for research is to redouble efforts to measure the alignment (and realignment) of firms and to do so consistently over time. Our survey was conducted in 2022. Perhaps this timing identified a different pattern than would emerge in 2024 or 2028 or beyond. Just as it is valuable to regularly take the pulse of ordinary citizens through periodic surveys of the public, it would also be valuable to regularly take the temperature of firms through surveys like this one. Second, a deep underlying question of this study is the extent to which the perceptions of realignment are attributable to changing attitudes in firms and among business leaders or to the changing positions of the political parties themselves. A direction for future studies may include experimenting with how populist messages and populist politicians affect the judgement of businesspeople of their support for one party or the other.
Supplementary material
The supplementary material for this article can be found at https://doi.org/10.1017/S0007123425000304
Data availability statement
Replication data for this paper can be found at https://doi.org/10.7910/DVN/SWPFL8.
Acknowledgements
For helpful comments on drafts, we thank Jeffrey Berry, David Broockman, Joshua Hochberg, Thomas Hershewe, David Hopkins, Max Kagan, Zoe Kava, Nathan Kelly, Jesse Rhodes, Nick Rishi, Laura Royden, Brian Schaffner, Jael Strell, Vineeta Vijayaraghavan, Timothy Werner, and Sam Zacher. Eitan Hersh was a 2022 Emerson Collective Fellow and thanks Emerson Collective for the time, community, and feedback that came via the fellowship. Eitan Hersh also thanks Leadership Now Project for financial support for this project.
Financial support
This work was supported by the Leadership Now Project.
Competing Interests
None.
Ethical standard
This research was approved by Tufts University’s Institutional Review Board (STUDY00002491; MOD-01-STUDY00002491)


 Open access