


Introduction
Amphetamine extended-release oral suspension (AMPH EROS; Dyanavel XR, Tris Pharma, Inc., Monmouth Junction, NJ) was approved by the US Food and Drug Administration (FDA) in 2015 for the treatment of symptoms of attention-deficit/hyperactivity disorder (ADHD). At initial approval, the product was approved for use in children 6 years of age and older. The labeled indication was later expanded to include adults. 1 The basis for this FDA-approved label change was a clinical bioavailability study comparing equal doses of AMPH EROS to an extended-release mixed amphetamine salt product that is approved for use in adults with ADHD.
ADHD is a common adult disorder with a worldwide prevalence estimated at 4.4% to 9.2% in adults aged 18 to 44 yearsReference Kessler, Adler and Barkley 2 – Reference Ustun, Adler and Rudin 5 and 2.85% to 3.5% in adults aged 50 years or older,Reference Goodman, Mitchell and Rhodewalt 6 with an overall US prevalence of 4.4%.Reference Kessler, Adler and Barkley 2 Extended-release, long-acting psychostimulants are the most commonly prescribed pharmacotherapy for adults with ADHD.Reference McGough 7 Adults with untreated ADHD experience functional impairmentsReference Biederman, Faraone and Spencer 8 and an overall lower quality of life, including problems with physical and mental health functioning,Reference Goodman, Mitchell and Rhodewalt 6 poor work performance and financial difficulties,Reference Goodman, Mitchell and Rhodewalt 6 , Reference Kessler, Adler and Ames 9 , Reference DeGraaf, Kessler and Fayyad 10 and a reduced income and participation in labor markets.Reference Biederman and Faraone 11 Adults with untreated ADHD are at an increased risk of accidents while driving and operating heavy machinery,Reference Cox, Merkel, Kovatchev and Seward 12 , Reference Barkley and Cox 13 and experience difficulties with interpersonal relationships and social interactions.Reference Eakin, Minde and Hechtman 14 , Reference Friedman, Rapport and Lumley 15 Several long-acting stimulant treatment options exist for patients, yet adherence to treatment is a major issue with ADHD. Over half of all ADHD patients, including adults, do not adhere to treatment,Reference Ferrin and Taylor 16 or worse, discontinue treatment within a few years of initiating drug therapy.Reference Garjia, Lu and Sikirica 17 – Reference Garbe, Mikolajczyk and Banaschewski 19 Garjia and colleaguesReference Garjia, Lu and Sikirica 17 examined patient persistence and adherence to ADHD medication by conducting a systematic literature review of 91 original studies published from 1990 to 2013. This analysis confirmed that adherence and persistence are generally poor among patients with ADHD, and it also revealed several factors that contribute to medication discontinuation; among the chief reasons were adverse events and dosing inconvenience. That report also indicated that the use of extended-release stimulant appeared to be a contributing factor to greater persistence to therapy.Reference Garjia, Lu and Sikirica 17 An amphetamine extended-release tablet that can be chewed or swallowed whole may help with treatment compliance by providing a treatment option for adult patients, especially those who prefer to not swallow a capsule or tablet.
The efficacy and safety of AMPH EROS in treatment of symptoms of ADHD in children aged 6 to 12 years were demonstrated in a 2014 laboratory classroom study.Reference Childress, Wigal and Brams 20 The primary efficacy endpoint was change from predose SKAMP-Combined score at 4 hours postdose, and the key secondary endpoint was change from predose SKAMP-Combined scores at intervals from 1 to 13 hours postdose. The primary and secondary endpoints were all found to be statistically significantly improved with AMPH EROS treatment versus placebo at all time points.
An extended-release amphetamine tablet formulation (AMPH ER TAB) has been developed. Both AMPH EROS and the AMPH ER TAB are racemic amphetamine formulations and utilize the proprietary LiquiXR drug delivery technology, which utilizes an ion-exchange resin that complexes with amphetamine or any other active moiety that can be protonated and is water-soluble.Reference Herman, King, Kando and Pardo 21 The amphetamine drug product forms a complex with ion-exchange polymers contained in the resin, which is then formed into micron-sized particles. Some of these particles are coated with an aqueous, pH-independent polymer designed to provide immediate or sustained release of active drug product. The polymer coating applied to the ion-exchange resin particles is of varying thickness, allowing for programmed, extended release of amphetamine. Solid, coating-free particles provide for immediate release of active drug product.
The micron-sized particles are formulated into an appropriate dosage form (solid or chewable tablet, liquid suspension, orally disintegrating tablet, film, or capsules). Amphetamine is subsequently released from the dosage form in millions of particles, with the release driven by a combination of ion exchange and diffusion. After amphetamine release, the ion-exchange resin is excreted in the feces.
The purpose of this study was to evaluate the relative bioavailability of a 20 mg AMPH ER TAB administered swallowed whole or chewed and AMPH EROS following a single dose in healthy adult subjects under fasted conditions, and to evaluate the effect of food on the pharmacokinetics of AMPH ER TAB.
Methods
Subjects
This study enrolled healthy, nonsmoking male and female subjects aged 18 to 55 years with a body mass index (BMI) ≥19.0 and ≤33.0 kg/m2. Exclusion criteria included known history or presence of any clinically significant medical condition, known or suspected malignancy, history or presence of cardiovascular disease, history or presence of clinically significant psychiatric disease, marked anxiety or tension, diabetes, or any other clinically significant disorder. The presence of any medical condition requiring periodic, regular systemic drug therapy was considered as exclusionary. Subjects who were on a special diet (liquid, protein, raw food, etc.) within the previous 30 days prior to drug administration were excluded. Subjects who used any enzyme-modifying drugs known to induce/inhibit hepatic drug metabolism or alter gastrointestinal pH/movement (eg, omeprazole, ranitidine), or any drugs known to inhibit cytochrome P (CYP) enzyme drug metabolism, or any monoamine oxidase inhibitor within 30 days prior to drug administration were excluded.
Study design
This comparative bioavailability and food-effect assessment study utilized an open-label, single-dose, single-site, randomized, 4-period, 4-treatment, 4-sequence, crossover design (Table 1). The study was conducted in accordance with the principles of the Declaration of Helsinki, and in compliance with International Council for Harmonization Guidelines for Good Clinical Practice. All subjects provided written informed consent prior to engagement of any study procedures. The protocol and informed consent documentation were approved by an Institutional Review Board (Salus IRB, Austin, TX). The clinical facility where drug administration and study procedures were administered was Pharma Medica Research, Inc. (St. Charles, MO). All subjects provided written informed consent prior to engagement of any study procedures. The study design consisted of 4 dosing periods separated by 7-day (±3 hours) washout periods. Subjects were randomly assigned to a treatment sequence (Table 1) according to a predetermined computer-generated randomization scheme (PLAN in SAS) and received a single dose of study treatment (AMPH ER TAB or AMPH EROS) per the assigned sequence. Study medications were (A) 1 dose of AMPH ER TAB chewed (20 mg, administered after an overnight fast of 10 hours); (B) 1 dose of AMPH ER TAB chewed (20 mg, administered 30 minutes after the start of a high-fat, high-calorie breakfast); (C) 1 dose of AMPH ER TAB swallowed whole (20 mg, administered after an overnight fast of 10 hours); and (D) AMPH EROS (8 mL of a 2.5 mg/mL suspension) administered after an overnight fast of ≥10 hours). The high-fat, high-calorie breakfast consisted of: 2 eggs, 0.5 oz butter for cooking eggs, 2 slices of toast, 0.5 oz butter for toast, 4 oz of hash brown potatoes, 8 oz of whole milk, and 2 slices of bacon. Subjects remained at the testing facility from at least 10.5 hours prior to drug administration until at least 24 hours postdose.
Treatment sequence.

Note: (A) One dose of AMPH ER TAB chewed (20 mg, administered after an overnight fast of 10 hours); (B) 1 dose of AMPH ER TAB chewed (20 mg, administered 30 minutes after the start of a high-fat, high-calorie breakfast); (C) 1 dose of AMPH ER TAB swallowed whole (20 mg, administered after an overnight fast of 10 hours); and (D) Reference AMPH EROS 20 mg (8 mL of a 2.5 mg/mL suspension) administered after an overnight fast of ≥10 hours).
Prior to drug administration, subjects were instructed not to touch or spit out the study drug. For Treatments A and B, designated clinic staff placed a single (20 mg) AMPH ER TAB into the subject’s mouth and onto the subject’s tongue directly from the dosing vial at the specified time and instructed the subject not to swallow the tablet whole. Subjects then chewed the tablet thoroughly in an up-and-down motion for 20 seconds. Subjects then drank approximately 2 oz (±0.2 oz) of water to help in consumption of any remaining disintegrated tablet in the mouth. Clinic staff performed a mouth check after approximately 20 seconds to confirm no residual medication was in the subject’s mouth. Subjects were then instructed to swish and swallow the remaining drinking water. For Treatment C, prior to drug administration, subjects were instructed not to chew, break, or touch the study drug. A single 20 mg dose (1 AMPH ER TAB) of the assigned drug product was administered according to the randomization scheme with 8 oz (±0.2 oz) of room temperature water. For Treatment D, single 20 mg (8 mL [2.5 mg/mL]) dose of AMPH EROS was administered with the subject in a seated position, using an oral syringe followed by 8 oz of drinking water. The oral syringe was placed facing downward in the subject’s mouth. Subjects were instructed to close their mouth tightly around the oral syringe and drug product was expelled in 1 continuous push into the mouth. Subjects were instructed to swallow the entire contents of the suspension followed by the drinking water.
A hand and mouth check was performed immediately after all drug administration to ensure that the study drug had been swallowed. Subjects remained seated for 4 hours following drug administration (unless required to ambulate for study specific procedures or use the restroom) and were permitted to resume normal activity thereafter, did not engage in any strenuous activity throughout the study period, and were instructed to lie down if they experienced drowsiness, dizziness, or any other adverse event requiring such a position.
There was no formal statistical evaluation of safety or tolerability. Safety monitoring and reporting was based on documentation of frequency and severity of adverse events, which were tabulated by treatment for all subjects in the safety dataset. Blood pressure and pulse rate were measured during screening, prior to drug administration, and at 1, 2, 3.5, 6, 8, 12, and 23 hours (±20 minutes) postdose.
Analytical methods
In each period, 19 samples were collected: prior to dosing (0-hour) and 0.5, 1, 2, 3, 4, 5, 6, 7, 8, 9, 10, 12, 14, 16, 24, 36, 48, and 60 hours after drug administration. The predose sample was collected within 60 minutes prior to dosing. Subjects were required to return to the clinic for the 36-, 48-, and 60-hour samples. Within 30 minutes of collection, the blood samples were centrifuged at approximately 4°C for approximately 10 minutes at 3000 rpm. The plasma was then divided into 2 equal aliquots in polypropylene tubes and stored frozen at −25°C ± 10 until shipment for analysis at the analytical laboratory (Pharma Medica Research Inc., Bioanalytical Division; Ontario, Canada).
Plasma concentrations of l -amphetamine and d-amphetamine in subject samples were measured utilizing Analyst Software Version 1.6.2, according to a chiral, liquid chromatographic tandem mass spectrometric detection (LC–MS/MS) method developed and validated at the Bioanalytical Laboratory of Pharma Medica Research, Inc. The method involved a liquid–liquid extraction followed by derivatization and another liquid–liquid extraction. The standard calibration range was from 0.200 to 80.0 ng/mL for each enantiomer using a plasma sample volume of 0.100 mL. Plasma samples were extracted under alkaline conditions with an organic solvent; the organic phase was dried and then reconstituted using buffer followed by derivatization. The derivatized samples were then extracted under alkaline conditions with a mixture of organic solvents; the organic phase was dried, reconstituted, and transferred for LC–MS/MS analysis. Sample analysis was conducted using reversed phase chromatography. Derivatized l -amphetamine and d -amphetamine were analyzed in the SCIEX API 4000 mass spectrometer using positive ion scan mode with a parent–daughter mass to charge ion transition of 418-91. Similarly, the derivatized internal standards for l -amphetamine and d-amphetamine were analyzed using a parent–daughter mass to charge transition of 42897. The expected retention time for both l -amphetamine and its internal standard is approximately 3.5 minutes and the retention time of d -amphetamine and its internal standard is approximately 3.9 minutes. Calibration standards were prepared by spiking blank human plasma with known amounts of each d- and l-amphetamine to create 1 set of 9 nonzero calibration standards (0.200, 0.400, 1.00, 2.50, 5.00, 12.5, 25.0, 50.0, and 80.0 ng/mL). To assess method performance, quality control (QC) samples containing known amounts of d- and l-amphetamine were prepared: 0.600 ng/mL, 40.0 ng/mL, 65.0 ng/mL, and 15.0 ng/mL. Calibration standards were to be within 15% of their nominal value and within 20.0% of lower limit of quantitation. Seventy-five percent of quality control samples were to be within 15.0% of their respective nominal values. The coefficients of determination from the reported batches were ≥0.9966 and ≥0.9972 for l -amphetamine and d-amphetamine, respectively. Interday precision and accuracy of the calibration standards for d -amphetamine ranged from 1.3% to 3.9% and 94.0% to 104.0%, respectively. Interday precision and accuracy of the calibration standards for d -amphetamine ranged from 1.3% to 4.6% and 93.0% to 104.0%, respectively. For l-amphetamine, intraday precision and accuracy of the quality control samples ranged from 0.0% to 15.5% and 97.2% to 203.8%, respectively, with the statistical outlier included in the calculations and 0.0% to 11.9% and 97.2% to 203.8%, respectively, without the statistical outlier. Interday precision and accuracy ranged from 1.7% to 6.4% and 102.3% to 107.0%, respectively, with the statistical outlier included in the calculations and from 1.7% to 4.6% and 102.0% to 106.0%, respectively, without the statistical outlier. For d -amphetamine, intraday precision and accuracy of the quality control samples ranged from 0.0% to 17.6% and 93.0% to 206.2%, respectively. Interday precision and accuracy ranged from 1.6% to 9.0% and 102.3% to 106.0%, respectively, with the statistical outlier included in the calculations and from 1.6% to 7.5% and 102.3% to 106.0%, respectively, without the statistical outlier.
Statistics
Descriptive statistics for the pharmacokinetic (PK) parameters of d-amphetamine and l-amphetamine were calculated. Descriptive statistics included number of observations, arithmetic mean, standard deviation (SD), geometric mean (where applicable), coefficient of variation (CV), median, minimum, and maximum. Statistical analysis was performed on quality assured data, with unbalanced groups if necessary, from subjects in the statistical dataset. The PROC GLM procedure from SAS (Version 9.4) was used.
Analysis of variance (ANOVA) was performed on log-transformed AUC0-5, AUC5-t , AUC0-t , AUC0-∞, and C max parameters. The significance of the sequence, period, treatment, and subject (sequence) effects were tested. Using the same statistical model, the least-square-means, the differences between the treatments least-square-means and the corresponding standard errors of these differences were estimated for log-transformed AUC0-5, AUC5-t , AUC0-t , AUC0-∞, and C max parameters. Based on these statistics, the ratios of the geometric means for treatments and the corresponding 90% CIs were calculated for the following comparisons: relative bioavailability versus the reference formulation (AMPH ER TAB chewed, fasted versus the reference AMPH EROS; AMPH ER TAB fasted, swallowed whole versus reference AMPH EROS); food effect (AMPH ER TAB fed versus AMPH ER TAB fasted); and relative bioavailability of AMPH ER TAB chewed versus swallowed whole (AMPH ER TAB chewed, fasted versus AMPH ER TAB swallowed whole, fasted).
Data indicated a CV for l-amphetamine AUC of approximately 12%. Assuming a 16% intrasubject variability and a difference between the treatment means of 10% or less, the necessary sample size for a 90% probability of the 90% confidence interval (CI) of the treatment means ratio to be within the 80.00% to 125.00% range was determined to be 33 subjects. Three extra subjects were included into the study to account for potential dropouts; therefore, 36 subjects were enrolled into this study. Only volunteers who were dosed were considered enrolled.
Results
Disposition and baseline characteristics
Thirty-six subjects were enrolled in the study and 32 subjects completed the study. Thirty-three subjects received Treatment A, 34 received Treatment B, 33 received Treatment C, and 33 subjects received reference product (Treatment D). Four subjects discontinued prematurely from the study. One subject was discontinued after period 2 dosing due to an adverse event (chest discomfort). A second subject was discontinued at period 2 check-in due to noncompliance with protocol restrictions (subject had Valtrex in their possession). A third subject was discontinued at the period 2 check-in due to a positive test for cannabinoids, and a fourth subject was discontinued at period 2 check-in due to a positive test for opiates. Therefore, the safety dataset included 36 subjects who were exposed to study drug, and for the PK dataset, data were included from the following subjects (32 total): subjects from whom the estimation of C max and AUC parameters was possible for 2 periods (where a statistical comparison of interest was made); and subjects who complied with all protocol requirements, or had protocol deviations that did not impact the estimation of the PK parameters.
Demographic characteristics for all 36 enrolled subjects are listed in Table 2. There were an equal number of males and females enrolled, and most subjects were Black (75%) with a mean height of 173 cm, a mean weight of 79 kg, and a mean BMI of 26.5 kg/m2.
Baseline demographic characteristics of the study subjects.

Abbreviations: BMI, body mass index; PK, pharmacokinetic; SD, standard deviation.
Relative bioavailability (AMPH ER TAB swallowed whole versus AMPH EROS fasted)
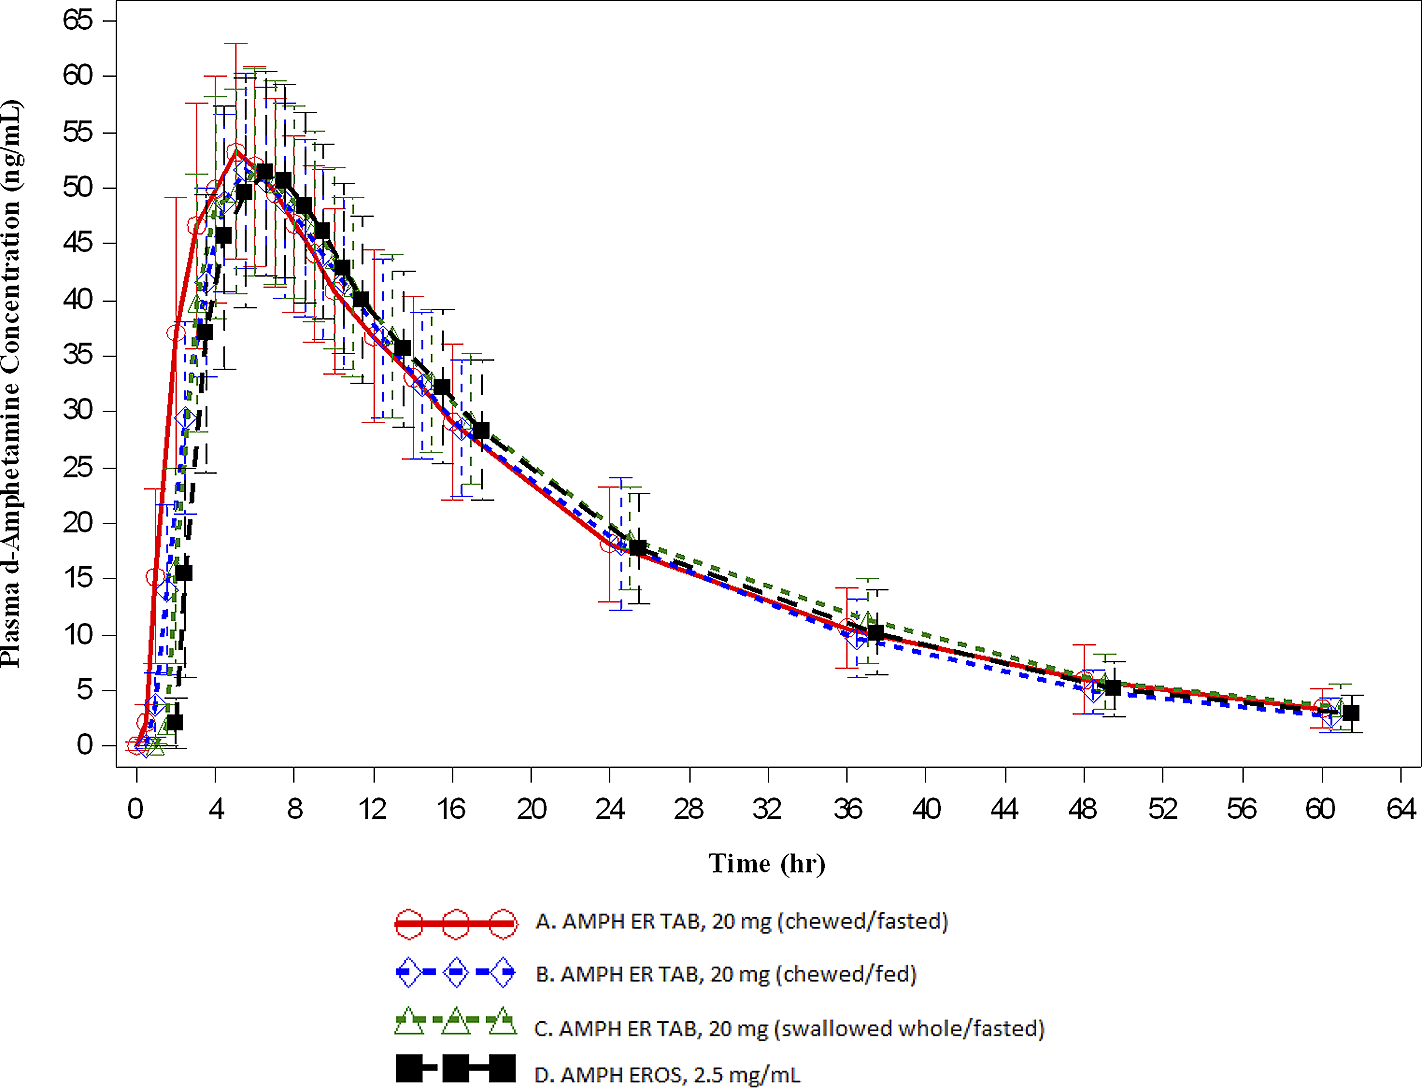
Key PK parameters are summarized in Table 3 and the overall time-concentration profiles are depicted in Figures 1 and 2. For d- and l -amphetamine, the total and peak systemic exposure, as measured by the 90% CIs of the ratios of geometric means for AUC0-t , AUC0-∞, and C max were similar. In addition, the systemic exposure for both d - and l-amphetamine for the first 5 hours (AUC0-5), and the systemic exposure measured beyond 5 hours (AUC5-t ) were similar between AMPH ER TAB swallowed whole compared with AMPH EROS fasted.
Key pharmacokinetics parameters (fasting state).

a Measured as 90% confidence intervals of the ratios of geometric means.
b Median (range).
Abbreviations: AMPH EROS, amphetamine extended-release oral suspension; AMPH ER TAB, amphetamine extended-release tablet; AUC, area under the curve; C, concentration.
Mean (±SD) plasma d-amphetamine concentration-time profiles (A: n = 31; B: n = 31; C: n = 32; D: n = 32).
Mean (±SD) plasma l-amphetamine concentration-time profiles (A: n = 31; B: n = 31; C: n = 32; D: n = 32).

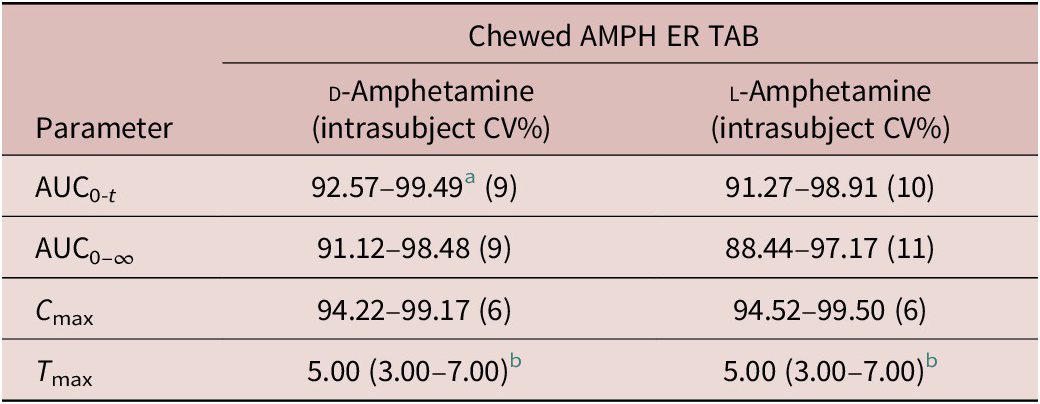
Relative bioavailability (AMPH ER TAB chewed, fasted versus AMPH EROS, fasted)
For d-amphetamine, the total and peak systemic exposure, as measured by the 90% CIs of the ratios of geometric means for AUC0-t , AUC0-∞, and C max were similar. In addition, the systemic exposure for both d- and l -amphetamine over the first 5 hours (AUC0-5), and the systemic exposure measured beyond 5 hours (AUC5-t ) were similar between AMPH ER TAB chewed compared with AMPH EROS fasted.
Food effect (AMPH ER TAB, chewed, fed versus AMPH ER TAB, chewed, fasted)
For d - and l -amphetamine, the total and peak systemic exposure, as measured by the 90% CIs of the ratios of geometric means for AUC0-t , AUC0-∞, and C max were similar for the fed and fasted conditions (Table 4).
Food effect.
a Measured as 90% confidence intervals of the ratios of geometric means.
b Median (range).
Abbreviations: AMPH EROS, amphetamine extended-release oral suspension; AMPH ER TAB, amphetamine extended-release tablet; AUC, area under the curve; C, concentration.
Relative bioavailability (AMPH ER TAB chewed, fasted versus AMPH ER TAB swallowed whole, fasted)
For d-amphetamine, the total and peak systemic exposure, as measured by the 90% CIs of the ratios of geometric means for AUC0-t , AUC0-∞, and C max were similar. In addition, the systemic exposure for both d- and l-amphetamine over the first 5 hours (AUC0-5), and the systemic exposure measured beyond 5 hours (AUC5-t ) were similar between AMPH ER TAB chewed, fasted compared with AMPH ER TAB swallowed whole, fasted.
The concentrations of AMPH ER TAB following administration of Treatments A, B, and C were consistent with those associated with once daily dosing. Furthermore, the arithmetic mean (±SD) for d-amphetamine at the scheduled 24-hour time point was similar for the test product compared with the reference, which has established once daily dosingReference Herman, King, Kando and Pardo 21 : 18.193 ± 5.141 ng/mL, 18.154 ± 5.986 ng/mL, 18.622 ± 4.641 ng/mL, and 17.751 ± 4.852 ng/mL for Treatments A, B, C, and D, respectively. This trend was also observed for l-amphetamine: 7.086 ± 2.031 ng/mL, 6.985 ± 2.180 ng/mL, 7.336 ± 1.770 ng/mL, and 7.034 ± 2.089 ng/mL for Treatments A, B, C, and D, respectively.
For l-amphetamine, the total and peak systemic exposure, as measured by the 90% CIs of the ratios of geometric means for AUC0-t , AUC0-∞, and C max, were similar.
For measures of d-amphetamine, a significant treatment effect was detected by ANOVA for AUC0-5 (p = 0.0105), AUC0-t (p = .0463), and AUC0-∞ (p = .0102) parameters. Despite the statistical significance, the 90% CIs of the test to reference ratios were all contained within the 80.00% to 125.00% range.
A statistically significant difference (α = 0.05) was detected between the study periods in the analysis of AUC0-5 (p = .0065) for d-amphetamine. All clinical procedures were under strict control and kept the same between the study periods. Hence, it is possible that the observed effect is due solely to chance. The least-square means of the formulation effect were adjusted for the period effect. Correspondingly, for measures of l -amphetamine, a significant treatment effect was detected by ANOVA for AUC0-5 (p = .0181), AUC0-t (p = .0241), and AUC0-∞ (p = .0031) parameters. Despite the statistical significance, the 90% CIs of the test to reference ratios were all contained within the 80.00% to 125.00% range.
A statistically significant difference (α = 0.05) was detected between the study periods in the analysis of AUC0-5 for l-amphetamine (p = .0068). All clinical procedures were under strict control and kept the same between the study periods. Hence, it is possible that the observed effect is due solely to chance. The least-square means of the formulation effect were adjusted for the period effect.
Safety
No serious adverse events or deaths were reported during the study. Overall, 17 subjects (47.2% of subjects dosed) reported one or more treatment-emergent adverse event (TEAE) in this study. Fourteen subjects (38.9% of subjects dosed) reported one or more treatment-related TEAE.
The most common treatment-related TEAE was tachycardia, which was reported by 6 subjects (16.7%). One subject (2.8%) was dismissed from the study by the primary investigator due to a treatment-related chest discomfort TEAE, which was mild in severity and resolved. There were no unexpected significant findings related to vital signs, ECGs, or physical examinations in this study.
Increased heart rate is an expected reaction and a common side effect of amphetamine administration, as indicated in the reference listed drug product label. Amphetamine is a noncatecholamine sympathomimetic amine that stimulates CNS activity. CNS stimulants accordingly cause both an increase in blood pressure (mean increase of about 2-4 mmHg) and heart rate (mean increase of 3-6 bpm). 1
None of the pulse rate measurements in the study was higher than 120 bpm. Furthermore, all treatment-related tachycardia TEAEs were mild in severity, limited in duration (approximately 1.5-4.7 hours), and resolved without any drug therapy.
Discussion
In this study, the bioavailability of a 20 mg amphetamine extended-release tablet was compared with an equivalent dose of the currently marketed formulation of an AMPH EROS DYANAVEL XR (Tris Pharma, Inc., Monmouth Junction, NJ). Some patients may swallow a chewable tablet whole, and there is a risk of impact on drug delivery mechanism and subsequent dissolution and absorption, and consequently the PK profile of a swallowed chewable tablet.Reference Cattaneo, Baldelli and Cerea 22 The presence of a food effect with the AMPH ER TAB was also assessed using a standard fed/fasted state methodology. By standard means of pharmacokinetics assessments and the resulting parameters used in this study, the bioavailability of AMPH ER TAB was confirmed by test product to reference formulation ratios of 90% confidence intervals to be within the predefined range of 80% to 125%. Using the same methodological approach, the absence of a food effect with the AMPH ER TAB was confirmed.
The concentrations of AMPH ER TAB following administration of Treatments A, B, and C were consistent with those associated with once-daily dosing as concentrations at the scheduled 24-hour time point were measurable for all subjects (both analytes). Furthermore, the arithmetic mean (±SD) for d-amphetamine at the scheduled 24 hour time point was similar for the test product compared with the reference-listed drug (AMPH EROS), which has established once daily dosing. Additionally, the data presented in this study confirm that there is no impact on exposure to amphetamine should the AMPH ER TAB be swallowed whole, and that no dosing modifications would be required should that occur. The tablet formulation used in this study was shown to have a relatively benign safety profile with no severe adverse events recorded. Tachycardia is a known and anticipated side effect of amphetamine use. In this study, the increases in heart rate and blood pressure associated with the test products were mild in severity and limited in duration. The importance of careful consideration of the use of stimulant therapy in adult patients with pre-existing cardiac conditions is reinforced by this finding.
There are some important limitations to note with the study. Study subjects with any history of difficulty with swallowing or chewing were excluded. Also, subjects with dentures, braces, dental appliances, or any other alterations to healthy oral anatomy were also excluded. Therefore, no new information about the impact of these conditions on the administration and absorption of AMPH ER TAB was revealed from this study.
Conclusion
Bioavailability of single dose of 20 mg AMPH ER TAB for both d- and l-amphetamine was comparable, swallowed whole or chewed, to an equivalent 20 mg dose of the reference product AMPH EROS 20 mg (2.5 mg/mL) fasted, and showed equivalent peak and overall exposures. No food effect was observed for AMPH ER TAB administered chewed. All AEs were mild in severity and AE profiles were found to be comparable between formulations, with no unanticipated safety concerns identified in either formulation.
Acknowledgments
The data presented herein were previously presented at the American Academy of Child and Adolescent Psychiatry Annual Meeting; October 2018. The study that produced data presented in the manuscript was sponsored by Tris Pharma, Inc.
Disclosures
Drs. Pardo, Kando, Mr. King, and Drs. Rafla and Herman are all paid employees of Tris Pharma, Inc. They neither have relevant financial relationships beyond employment with Tris Pharma, Inc. to report, nor do they hold any patents or copyrights broadly relevant to this manuscript. They report no other relationships or activities that readers could perceive to have influenced, or that give the appearance of potentially influencing what was written in this manuscript.


 Open access