


1. Introduction
Fast radio bursts (FRBs) are highly energetic astrophysical phenomena characterised by millisecond bursts at radio frequencies (e.g. Lorimer et al., Reference Lorimer, Bailes, McLaughlin, Narkevic and Crawford2007; Thornton et al., Reference Thornton, Stappers and Bailes2013) whose nature is still unclear. Most FRBs are known to be extragalactic because their dispersion measures (DMs) are greater than the expected values from the Milky Way. In 2020, CHIME/FRB Collaboration et al. (2020) and Bochenek et al. (Reference Bochenek, Ravi and Belov2020) detected a bright millisecond-duration radio burst from a Galactic magnetar (SGR 1935+2154), albeit with a lower luminosity compared to other FRBs, which suggests that magnetars at least are one source of FRBs. The precise localisation and the host galaxy identification of FRBs started after the discovery of the first repeating FRB (FRB 121102; Spitler et al., Reference Spitler, Cordes and Hessels2014, Reference Spitler, Scholz and Hessels2016; Scholz et al., Reference Scholz, Spitler and Hessels2016). Chatterjee et al. (Reference Chatterjee, Law and Wharton2017) localised FRB 20121102A to $\sim$
100 milliarcsecond precision with the Karl G. Jansky Very Large Array (VLA; Perley et al., Reference Perley, Chandler, Butler and Wrobel2011) from interferometric imaging. With more localised FRBs detected, we are able to gain more insight into the nature of FRBs (e.g. constraining the emission mechanism models, understanding their progenitors, and measuring their surrounding properties), and use them to probe the cosmological parameters (e.g. James et al., Reference James, Ghosh and Prochaska2022b) and extragalactic baryon distribution (Macquart et al., Reference Macquart, Prochaska and McQuinn2020).
$\sim$
100 milliarcsecond precision with the Karl G. Jansky Very Large Array (VLA; Perley et al., Reference Perley, Chandler, Butler and Wrobel2011) from interferometric imaging. With more localised FRBs detected, we are able to gain more insight into the nature of FRBs (e.g. constraining the emission mechanism models, understanding their progenitors, and measuring their surrounding properties), and use them to probe the cosmological parameters (e.g. James et al., Reference James, Ghosh and Prochaska2022b) and extragalactic baryon distribution (Macquart et al., Reference Macquart, Prochaska and McQuinn2020).
The Australian Square Kilometre Array Pathfinder (ASKAP; Hotan et al., Reference Hotan, Bunton and Chippendale2021) is a 36 $\times$
12-m antenna radio interferometer located at Inyarrimanha Ilgari Bundara, the CSIRO Murchison Radio-astronomy Observatory, operating at frequencies between 700 and 1 800 MHz. The phased array feed receivers equipped on each ASKAP antenna enable a wide field of view,
$\times$
12-m antenna radio interferometer located at Inyarrimanha Ilgari Bundara, the CSIRO Murchison Radio-astronomy Observatory, operating at frequencies between 700 and 1 800 MHz. The phased array feed receivers equipped on each ASKAP antenna enable a wide field of view, $\sim$
30 deg
$\sim$
30 deg $^2$
. The Commensal Real-time ASKAP Fast Transients (CRAFT; Shannon et al., Reference Shannon, Bannister and Bera2024; Bannister et al., Reference Bannister, Shannon and Macquart2017) survey is a fast transients programme running on ASKAP since 2016 with FRBs as the primary target. In the first two years, CRAFT operated in fly’s eye mode where a sub-array of approximately 12 antennas were each pointed towards different directions, and detected 23 FRBs with an arcmin precision localisation (Shannon et al., Reference Shannon, Macquart and Bannister2018; Bhandari et al., Reference Bhandari, Bannister and James2019; Qiu et al., Reference Qiu, Bannister and Shannon2019; Macquart et al., Reference Macquart, Shannon and Bannister2019). To enable interferometric localisation, CRAFT then operated ASKAP in online incoherent sum (ICS) mode, with all antennas pointing to the same direction. The CRAFT backend squared-summed the signals from each antenna at an integration time of
$^2$
. The Commensal Real-time ASKAP Fast Transients (CRAFT; Shannon et al., Reference Shannon, Bannister and Bera2024; Bannister et al., Reference Bannister, Shannon and Macquart2017) survey is a fast transients programme running on ASKAP since 2016 with FRBs as the primary target. In the first two years, CRAFT operated in fly’s eye mode where a sub-array of approximately 12 antennas were each pointed towards different directions, and detected 23 FRBs with an arcmin precision localisation (Shannon et al., Reference Shannon, Macquart and Bannister2018; Bhandari et al., Reference Bhandari, Bannister and James2019; Qiu et al., Reference Qiu, Bannister and Shannon2019; Macquart et al., Reference Macquart, Shannon and Bannister2019). To enable interferometric localisation, CRAFT then operated ASKAP in online incoherent sum (ICS) mode, with all antennas pointing to the same direction. The CRAFT backend squared-summed the signals from each antenna at an integration time of $\approx$
1 ms and frequency resolution of 1 MHz and searched for dispersed signals within. CRAFT also included a ‘voltage triggering’ system, which saved the raw antenna voltages of FRB detections. Scott et al. (Reference Scott, Cho and Day2023) developed the CRAFT Effortless Localisation and Enhanced Burst Inspection (CELEBI) pipeline to correlate, calibrate, image, and beamform the voltage data to improve the sky localisation to that which is possible from the longest baselines in the array (
$\approx$
1 ms and frequency resolution of 1 MHz and searched for dispersed signals within. CRAFT also included a ‘voltage triggering’ system, which saved the raw antenna voltages of FRB detections. Scott et al. (Reference Scott, Cho and Day2023) developed the CRAFT Effortless Localisation and Enhanced Burst Inspection (CELEBI) pipeline to correlate, calibrate, image, and beamform the voltage data to improve the sky localisation to that which is possible from the longest baselines in the array ( $\sim$
6 km). This process allows the FRB positional uncertainty to be reduced to the level of
$\sim$
6 km). This process allows the FRB positional uncertainty to be reduced to the level of $\sim 10.0 / (2 \times S/N)$
arcsec, where
$\sim 10.0 / (2 \times S/N)$
arcsec, where $S/N$
is the signal-to-noise ratio of the source. ASKAP accurately localised over 20 FRBs in the ICS mode using the data from the voltage triggers, enabling host galaxy identification and redshifts to be obtained (Bannister et al., Reference Bannister, Deller and Phillips2019). This yielded, amongst other things, a first independent measure of the cosmological baryon density (Macquart et al., Reference Macquart, Prochaska and McQuinn2020); properties of the FRB host galaxy population (e.g. Heintz et al., Reference Heintz, Prochaska and Simha2020; Bhandari et al., Reference Bhandari, Heintz and Aggarwal2022; Gordon et al., Reference Gordon2023); properties of the cosmic web (e.g. Prochaska & Zheng, Reference Prochaska and Zheng2019; Simha et al., Reference Simha, Burchett and Prochaska2020); FRB environments within nearby host galaxies (Mannings et al., Reference Mannings2021); spectropolarimetry at
$S/N$
is the signal-to-noise ratio of the source. ASKAP accurately localised over 20 FRBs in the ICS mode using the data from the voltage triggers, enabling host galaxy identification and redshifts to be obtained (Bannister et al., Reference Bannister, Deller and Phillips2019). This yielded, amongst other things, a first independent measure of the cosmological baryon density (Macquart et al., Reference Macquart, Prochaska and McQuinn2020); properties of the FRB host galaxy population (e.g. Heintz et al., Reference Heintz, Prochaska and Simha2020; Bhandari et al., Reference Bhandari, Heintz and Aggarwal2022; Gordon et al., Reference Gordon2023); properties of the cosmic web (e.g. Prochaska & Zheng, Reference Prochaska and Zheng2019; Simha et al., Reference Simha, Burchett and Prochaska2020); FRB environments within nearby host galaxies (Mannings et al., Reference Mannings2021); spectropolarimetry at $\mu$
s timescales of FRBs (Day et al., Reference Day, Deller and Shannon2020; Cho et al., Reference Cho, Macquart and Shannon2020); and FRB follow-up of repeating FRBs at Parkes/Murriyang (Kumar et al., Reference Kumar, Shannon and Flynn2021). However, the detection rate of FRBs is limited by the sensitivity of the ICS system, which is a factor of
$\mu$
s timescales of FRBs (Day et al., Reference Day, Deller and Shannon2020; Cho et al., Reference Cho, Macquart and Shannon2020); and FRB follow-up of repeating FRBs at Parkes/Murriyang (Kumar et al., Reference Kumar, Shannon and Flynn2021). However, the detection rate of FRBs is limited by the sensitivity of the ICS system, which is a factor of $N_\mathrm{ant}^{1/2}$
(where
$N_\mathrm{ant}^{1/2}$
(where $N_{\mathrm{ant}}$
is the number of antennas) less than achievable with coherent processing.
$N_{\mathrm{ant}}$
is the number of antennas) less than achievable with coherent processing.
In this paper, we describe CRACO, the ‘CRAFT COherent upgrade’, which brings fully coherent, real-time burst detection. Planning for this mode began in 2018, with the first light taking place in 2023. Results of the commissioning and operation of the first coarse-time-resolution mode of CRACO, in which dispersed radio transients are searched for offline in 110-ms image data, are described here. The target temporal resolution for the full system is 1.7 ms. CRACO was designed to yield a detection SNR improvement of order $\sqrt{N_{\mathrm{ant}}}=6$
(under the assumption of full phasing accuracy and all dishes in operation) over the existing incoherent system. In practice, phasing efficiency is typically 0.90–0.95 of the theoretical maximum, and considering that not all dishes are available at any given time, we aimed at a sensitivity improvement of
$\sqrt{N_{\mathrm{ant}}}=6$
(under the assumption of full phasing accuracy and all dishes in operation) over the existing incoherent system. In practice, phasing efficiency is typically 0.90–0.95 of the theoretical maximum, and considering that not all dishes are available at any given time, we aimed at a sensitivity improvement of $\approx 5$
. For FRBs, this sensitivity improvement is expected to yield a
$\approx 5$
. For FRBs, this sensitivity improvement is expected to yield a $5^{3/2} \approx 12\times$
improvement in the FRB detection rate assuming a Euclidean distribution (e.g. Oppermann et al., Reference Oppermann, Connor and Pen2016). Based on the detection rates of FRBs with CRAFT in the ICS mode (James et al., Reference James, Bannister and Macquart2019; Shannon et al., Reference Shannon, Bannister and Bera2024), CRACO thus has the potential to yield
$5^{3/2} \approx 12\times$
improvement in the FRB detection rate assuming a Euclidean distribution (e.g. Oppermann et al., Reference Oppermann, Connor and Pen2016). Based on the detection rates of FRBs with CRAFT in the ICS mode (James et al., Reference James, Bannister and Macquart2019; Shannon et al., Reference Shannon, Bannister and Bera2024), CRACO thus has the potential to yield $\approx 0.5$
to 2 localisable FRBs per day.
$\approx 0.5$
to 2 localisable FRBs per day.
CRACO has several science drivers based on this sensitivity upgrade: (1) the substantially increased localised FRB discovery rate discussed above; (2) the discovery of higher-z FRBs than in CRAFT/ICS; (3) an increased discovery rate for slow radio transients including rotating radio transients (RRATs) and intermittent pulsars; (4) the study of the interplanetary scintillation of Active Galactic Nuclei (AGN); and (5) space weather.
The first transient survey, CRACO 110-ms Pilot Survey (CRACO-PS), was performed at 110-ms time resolution and operated from 2023 April to 2023 November. This initially rather coarse time resolution allowed us to operate a search programme in an under-explored region of transient space, that is, relatively long-duration, dispersed radio transients, or ‘not so fast radio bursts’. Simultaneously, we used this survey to commission the system and work towards higher time resolution.
In this paper, we present a brief system description including the bandpass calibration, RFI rejection strategies, search pipeline, candidates post-processing pipeline, system equivalent flux density estimations, cross-checks of CRACO’s performance with the Parkes/Murriyang radio telescope, and known issues in the current system in Sections 2 and 3. In Section 4, we describe the design of CRACO-PS and report the results of the survey in Section 5, which includes the detection of two FRBs (one discovered by CRACO, but missed by the ICS system), the coordinate corrections of four pulsars, and the detection of two new RRATs. In Section 6, we discuss the inferred FRB rates based on the CRACO detections and their implications. We also discuss the prospects for detecting new FRBs, pulsars, and ultra-long period objects (ULPOs) with CRACO, and the further planned improvement of the system. Conclusions of this work are presented in Section 7.
2. CRACO system design and operation
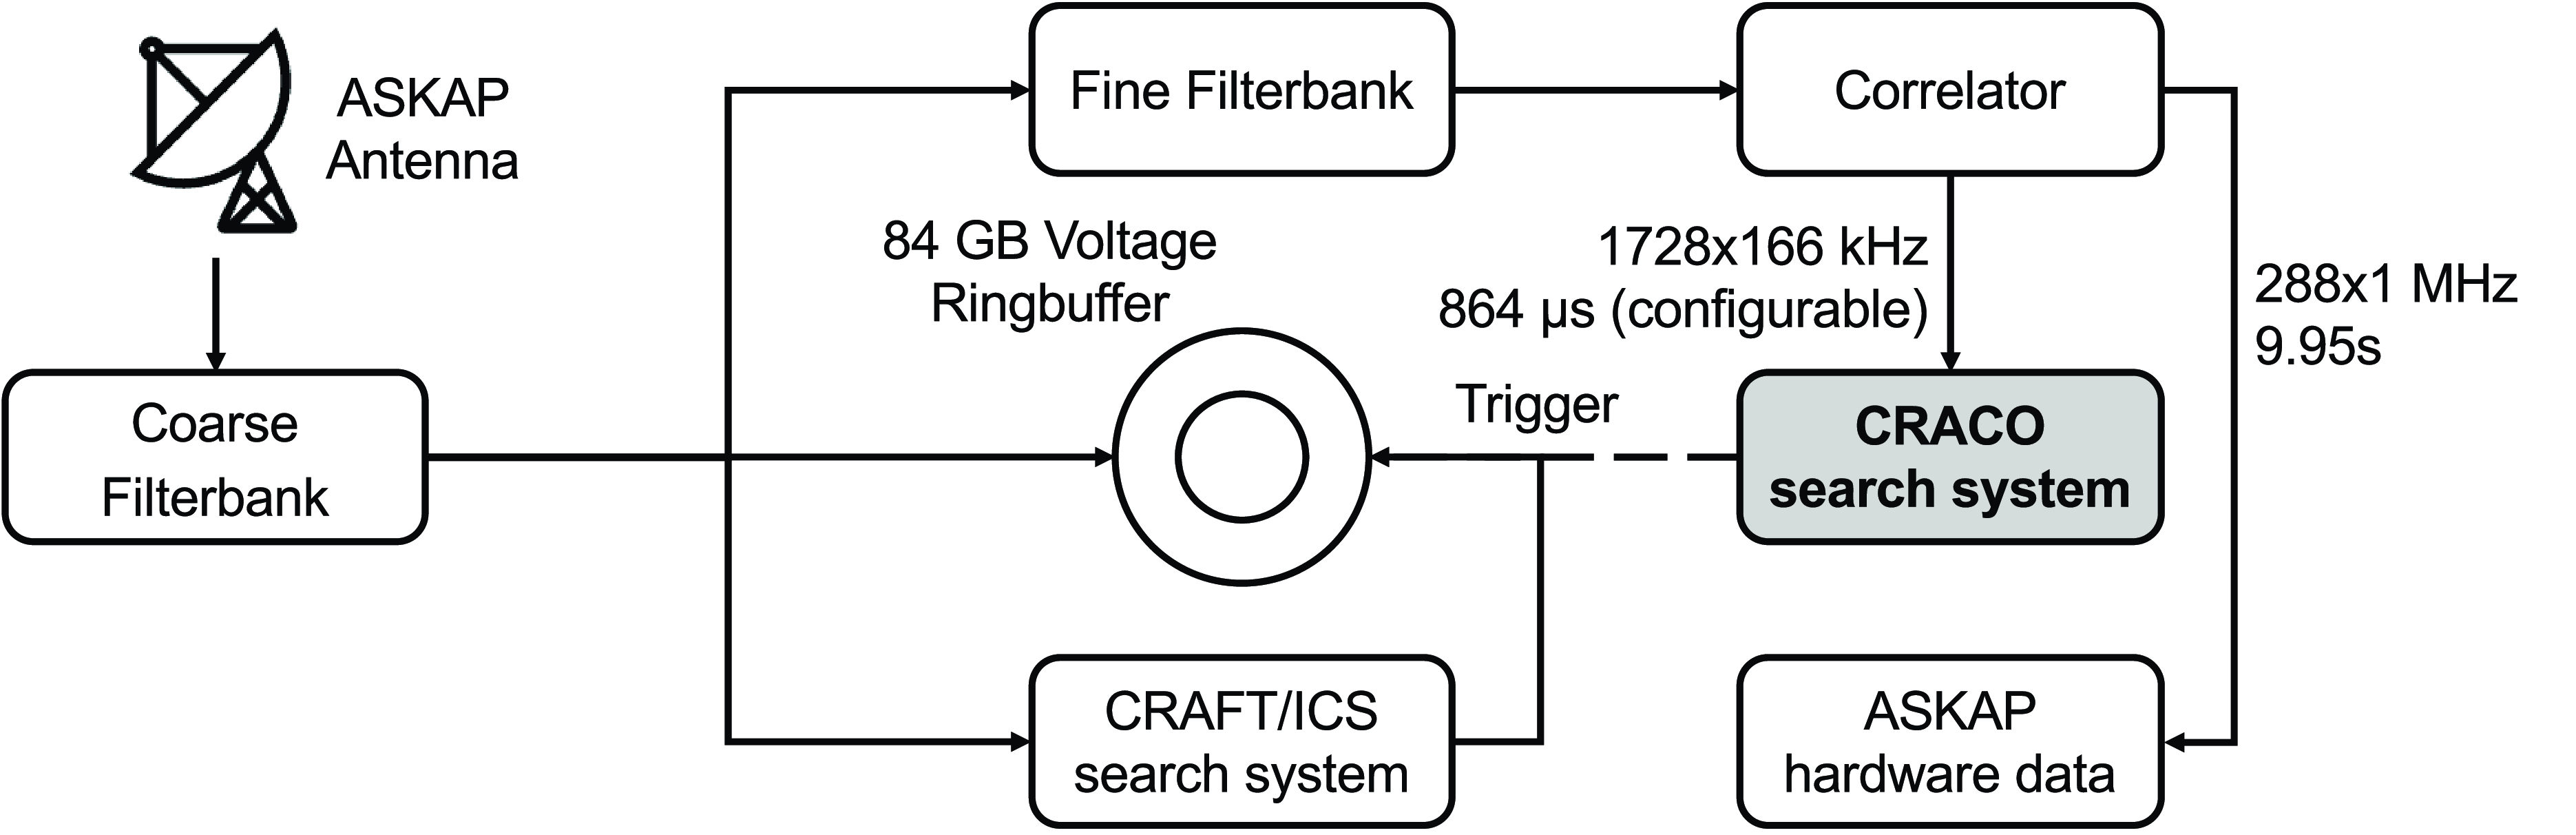
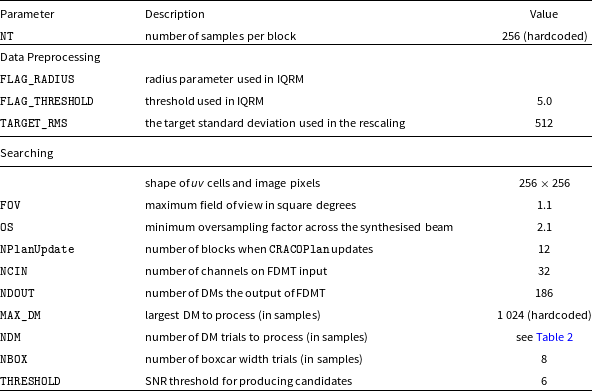
In this section, we briefly describe the design principles, hardware and software system sufficient for the results of the 110-ms science commissioning survey. A full description of CRACO will be presented in Bannister et al (in prep.). The ASKAP system is described in detail in Hotan et al. (Reference Hotan, Bunton and Chippendale2021). We show two schematic diagrams in Figures 1 and 2 describing CRACO operations. We list the pipeline parameters in Table 1 and the survey parameters in Table 2.
Data stream flowchart for the ASKAP hardware, CRAFT/ICS, and CRACO systems. The dashed line indicates the triggering process from CRACO to the ICS system remains to be implemented.
CRACO search system flowchart. The dashed line means the trigger process was not yet implemented when this survey was undertaken.
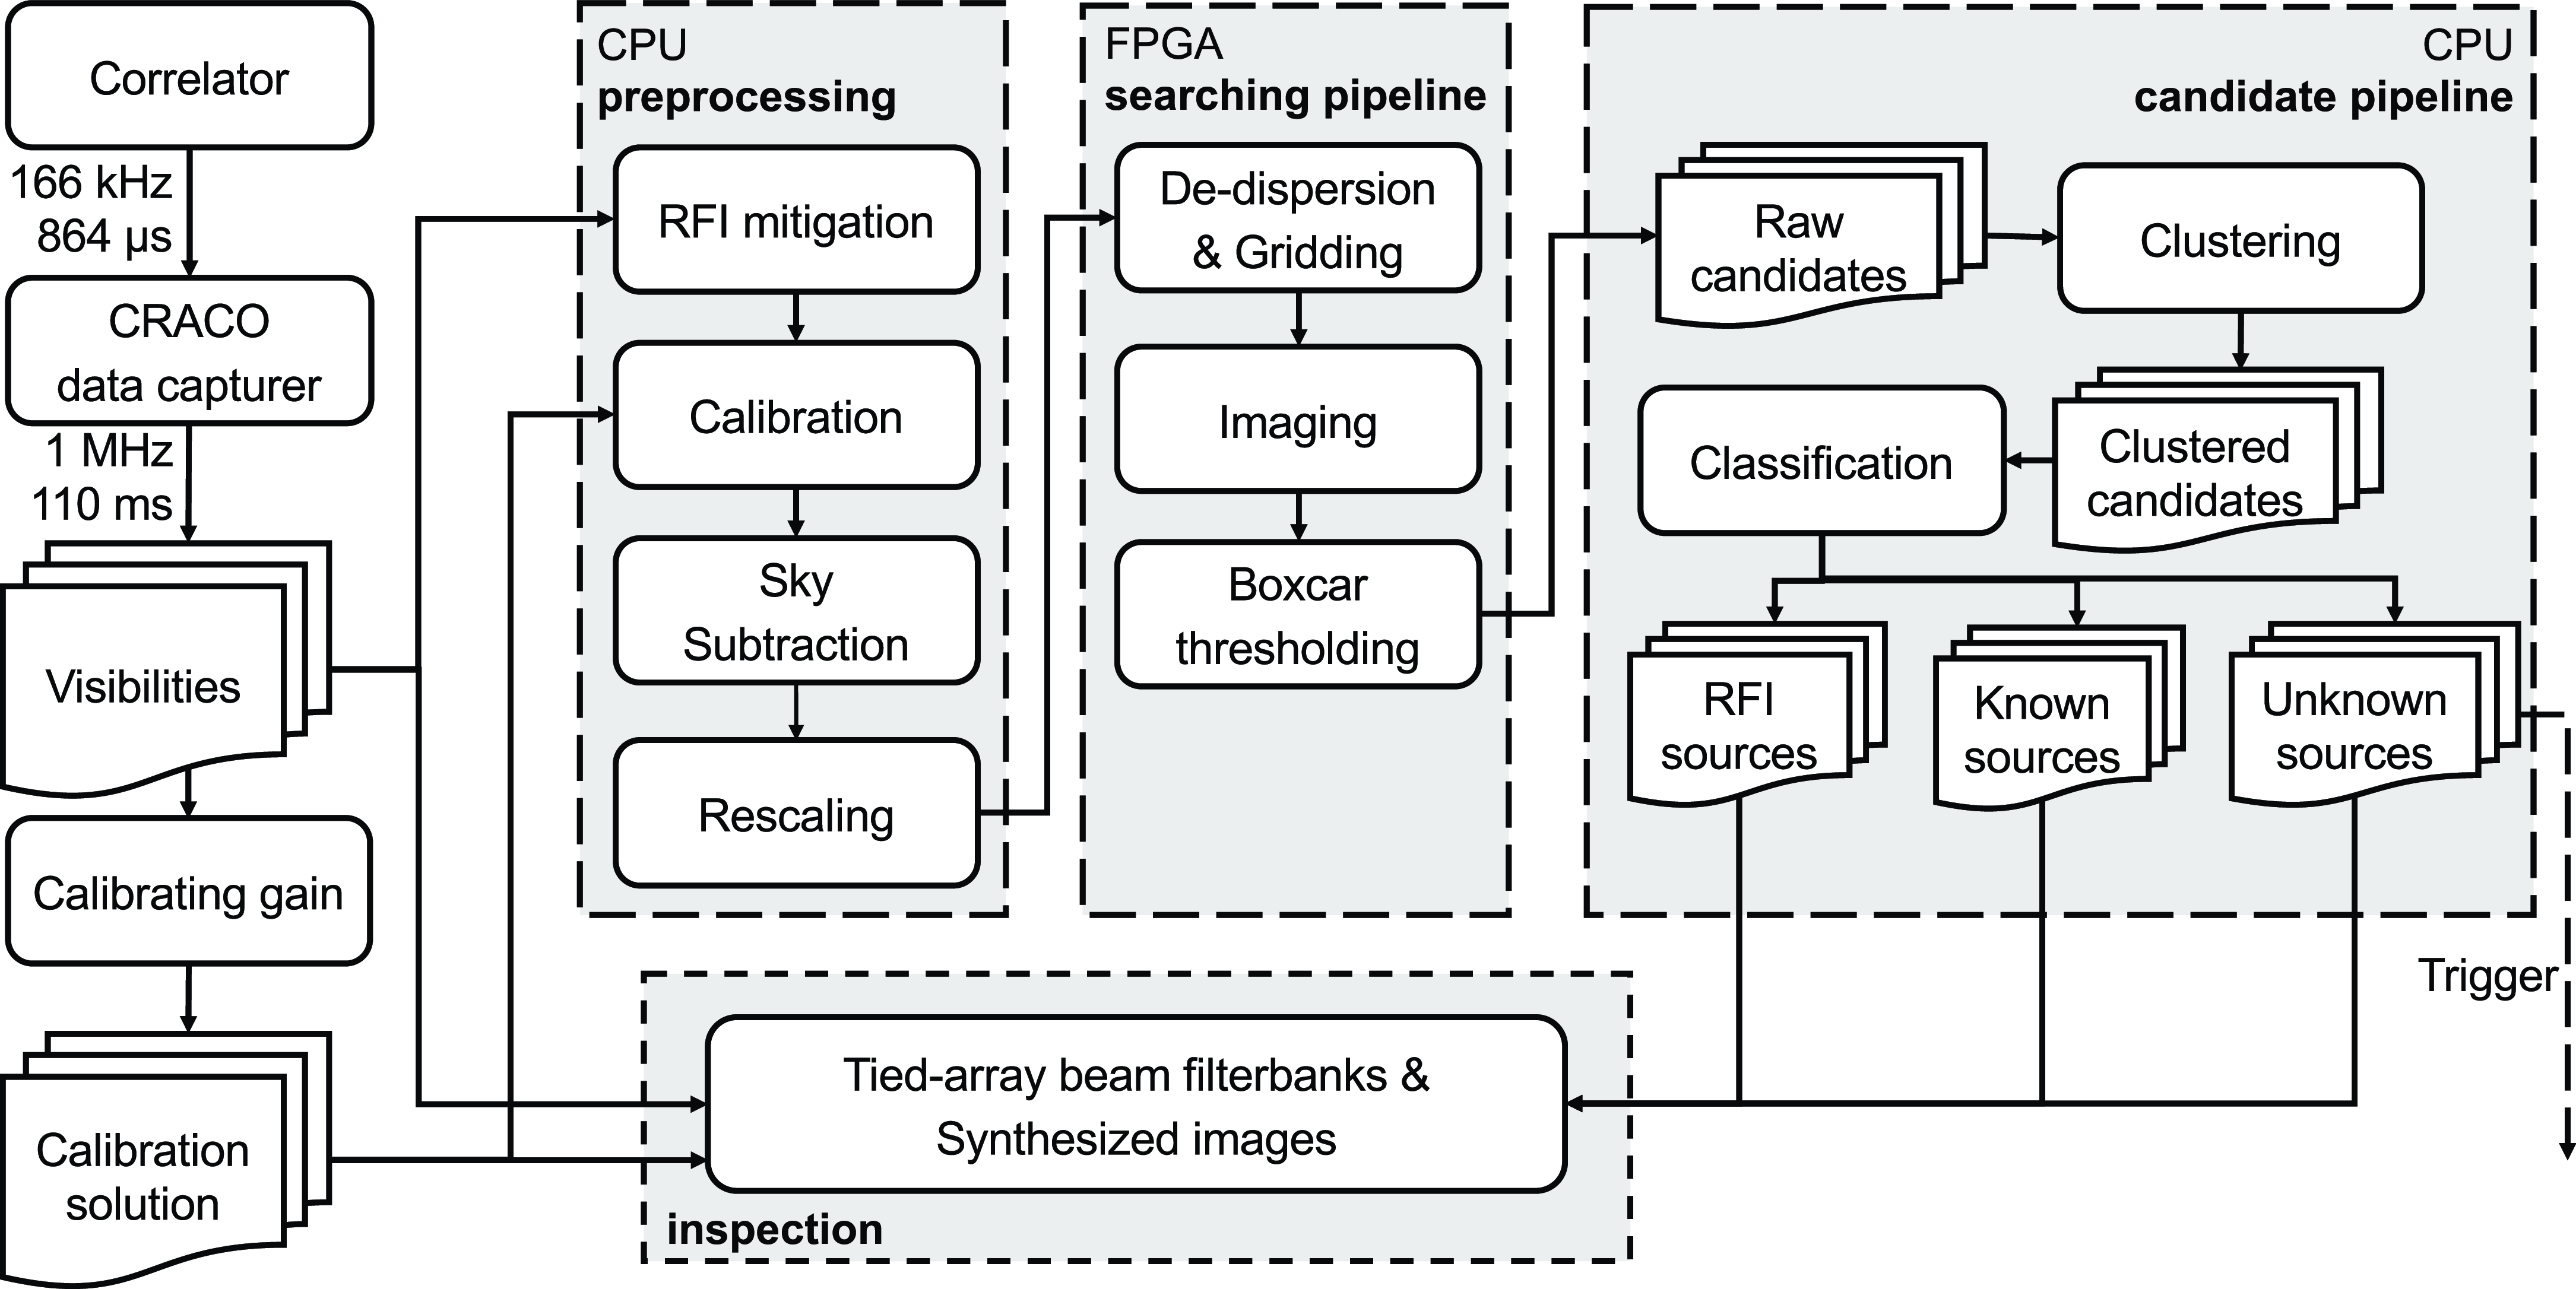
CRACO implements millisecond timescale imaging of the field of view (FoV). It adopts a similar approach to RealFAST (Law et al., Reference Law, Bower and Burke-Spolaor2018), the transient detection hardware/software implemented on the Karl G. Jansky Very Large Array (VLA; Perley et al., Reference Perley, Chandler, Butler and Wrobel2011). Visibility data are received and recorded on disc. In an offline process, the visibilities are read, averaged, calibrated and sky subtracted, then processed with the search pipeline. CRACO forms $256 \times 256$
pixel images with approximately
$256 \times 256$
pixel images with approximately $\sim$
15.5 arcsec resolution (depending on observing frequency and the uv-coverage). We typically use all baselines out to antenna 24, which achieves an acceptable compromise between FoV and sensitivity. The pipeline dedisperses the visibilities at
$\sim$
15.5 arcsec resolution (depending on observing frequency and the uv-coverage). We typically use all baselines out to antenna 24, which achieves an acceptable compromise between FoV and sensitivity. The pipeline dedisperses the visibilities at $\sim$
200 Dispersion Measure (DM) trials (depending on the observing frequency and the recording bandwidth), computes 8 sliding window boxcars, and thresholds the result. The pipeline is implemented on 20 Xilinx Alveo U280 FPGA processing cards. The number of DM trials represents the maximum dispersive time delay, measured in units of samples, that can be searched. Further detailed discussion is in Section 2.4.3.
$\sim$
200 Dispersion Measure (DM) trials (depending on the observing frequency and the recording bandwidth), computes 8 sliding window boxcars, and thresholds the result. The pipeline is implemented on 20 Xilinx Alveo U280 FPGA processing cards. The number of DM trials represents the maximum dispersive time delay, measured in units of samples, that can be searched. Further detailed discussion is in Section 2.4.3.
Parameters used in the search pipeline
CRACO 110-ms Pilot Survey search parameters. $\Omega\Delta$
t indicates the search volume in units of deg
$\Omega\Delta$
t indicates the search volume in units of deg $^2$
hr. SNR is the signal-to-noise ratio threshold we used to filter for candidates. NDM is the maximum DM (in units of time samples) used in the search.
$^2$
hr. SNR is the signal-to-noise ratio threshold we used to filter for candidates. NDM is the maximum DM (in units of time samples) used in the search.
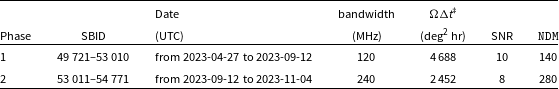
‡We use a field of view of 1.1 deg in diameter to estimate the search volume. Due to the uv coverage, a small number of schedule blocks had a somewhat smaller (or larger) FoV.
CRACO aims at a final target 1.728 ms time resolution of the full field of view, yielding 23 Terapixels per second to be searched for transient events. Achieving this is a 3-stage process, in which we aim for time resolutions of 110.592 ms (this paper), 13.824 ms (currently operational), and a final 1.728 ms (slated for late-2024).
2.1 CRACO hardware and data recording
ASKAP operates in three frequency bands (low, mid, and high) between 700 MHz and 1 800 MHz. Within each band, observers can choose up to 288 MHz of bandwidth for the observationsFootnote a. We show a schematic diagram describing the data flow for three different systems (ASKAP hardware, CRAFT/ICS, and CRACO) in Figure 1. The signals from each PAF element on each antenna are digitised and channelised to produce 1 MHz coarse filterbanks. In typical observations, digital beamformers apply weights derived through observations of the Sun and on-dish calibrator to form 36 dual polarisation beams, where the beam arrangements are called a ‘footprint’ (see Hotan et al. (Reference Hotan, Bunton and Chippendale2021) for typical ASKAP footprints). The spacing between adjacent beams (also called ‘pitch’) varies between 0.75 and 1.05 deg, which largely depends on the observing frequency and science requirements. An 84 GB ring-buffer is maintained in the beamformer stage, capable of holding 0.9–14.2 s, which can be traded for the quantisation number of bits. Triggers from the transient search pipeline yield voltage dumps from this ring-buffer, for later use localising the events, and for high time and frequency resolution analysis.
Beamformed signals are then split into finer channels with a resolution of 1/54 MHz and sent to the correlator which computes visibilities for each baseline. The correlator computes two data products. The low time resolution product used for normal spectral line and continuum processing is 15,552 $\times$
1/54 kHz channels with a time resolution of 90
$\times$
1/54 kHz channels with a time resolution of 90 $\times$
110.592 ms (approximately 9.95 s) with all four Stokes parameters. The correlator also produces a high time resolution product. This product has a configurable integration time of 0.864, 1.728ms or 3.456 ms. The correlator applies a fixed factor of 6 frequency averaging to achieve 1/9 MHz channels. It has two stokes modes, either forming ‘pseudo stokes I’ (XX+YY, calibration is not applied), or ‘XX and YY’. The ‘XX and YY’ mode cannot be used in the 0.864ms mode due to data rate constraints. CRACO-PS captured data in the 3.4 ms pseudo stokes I mode. Data are captured from the network as RoCE packets and saved to disc. All subsequent processing is performed independently per beam. We only recorded 120 MHz bandwidth in the first three months and increased it to 240 MHzFootnote b afterwards (see Table 2). We recorded both the real and imaginary parts of visibilities as 32-bit floating point numbers. With one polarisation, 240 channels (240 MHz bandwidth), a time resolution of 110.592 ms, and 435 baselines (30 antennas), the data rate is 27.2 GB hour
$\times$
110.592 ms (approximately 9.95 s) with all four Stokes parameters. The correlator also produces a high time resolution product. This product has a configurable integration time of 0.864, 1.728ms or 3.456 ms. The correlator applies a fixed factor of 6 frequency averaging to achieve 1/9 MHz channels. It has two stokes modes, either forming ‘pseudo stokes I’ (XX+YY, calibration is not applied), or ‘XX and YY’. The ‘XX and YY’ mode cannot be used in the 0.864ms mode due to data rate constraints. CRACO-PS captured data in the 3.4 ms pseudo stokes I mode. Data are captured from the network as RoCE packets and saved to disc. All subsequent processing is performed independently per beam. We only recorded 120 MHz bandwidth in the first three months and increased it to 240 MHzFootnote b afterwards (see Table 2). We recorded both the real and imaginary parts of visibilities as 32-bit floating point numbers. With one polarisation, 240 channels (240 MHz bandwidth), a time resolution of 110.592 ms, and 435 baselines (30 antennas), the data rate is 27.2 GB hour $^{-1}$
for each beam.
$^{-1}$
for each beam.
We did not calculate baseline vectors (i.e. uvw values) in real time. We used ASKAP metadata files (with uvw values for all baselines every 9.95 s) to interpolate the uvw values in the CRACO data during the following offline search. The ASKAP system performs fringe rotation of the data to the phase/delay centres corresponding to the nominal pointing position of each beam and this is the same position uvw values are calculated for.
2.2 Bandpass calibration
For almost all ASKAP observations, the bright Southern hemisphere source PKS B1934–638 is used as the bandpass calibrator. Observations of this source incur significant operational overhead, taking approximately 2 h to complete. As CRACO requires solutions in real time, these bandpass observations cannot be used, as they often take place after the target observations. CRACO uses self-calibration to derive the desired calibration solutions. Almost any ASKAP field is suitable for self-calibration, as there is usually $\gt1$
Jy of flux in any beam, and an excellent sky model is available in the form of the RACS catalogue (McConnell et al., Reference McConnell, Hale and Lenc2020; Hale et al., Reference Hale, McConnell and Thomson2021).
$\gt1$
Jy of flux in any beam, and an excellent sky model is available in the form of the RACS catalogue (McConnell et al., Reference McConnell, Hale and Lenc2020; Hale et al., Reference Hale, McConnell and Thomson2021).
The ASKAP bandpass is relatively stable over several days, but small changes in the antenna phases can lower the candidate detection SNR. CRACO automatically generates calibration solutions daily to account for these small changes in antenna phases. We only use data recorded with an elevation angle $\theta \gt 20^\circ$
and a declination
$\theta \gt 20^\circ$
and a declination $\delta \lt +40^\circ$
to perform the calibration. If there is more than one observation available for calibration, we used the following order to decide which one to use: (1) normal ASKAP bandpass (i.e. PKS B1934–638); (2) other extragalactic field; (3) galactic field. New calibration solutions are also generated after a change in beamformer weights or observing frequency. We use
$\delta \lt +40^\circ$
to perform the calibration. If there is more than one observation available for calibration, we used the following order to decide which one to use: (1) normal ASKAP bandpass (i.e. PKS B1934–638); (2) other extragalactic field; (3) galactic field. New calibration solutions are also generated after a change in beamformer weights or observing frequency. We use $\sim$
10 min of CRACO data from the selected observation to perform the field calibration to obtain the bandpass solutionFootnote c. For a given field, we construct a sky model by extracting all bright (peak flux density
$\sim$
10 min of CRACO data from the selected observation to perform the field calibration to obtain the bandpass solutionFootnote c. For a given field, we construct a sky model by extracting all bright (peak flux density $\gt$
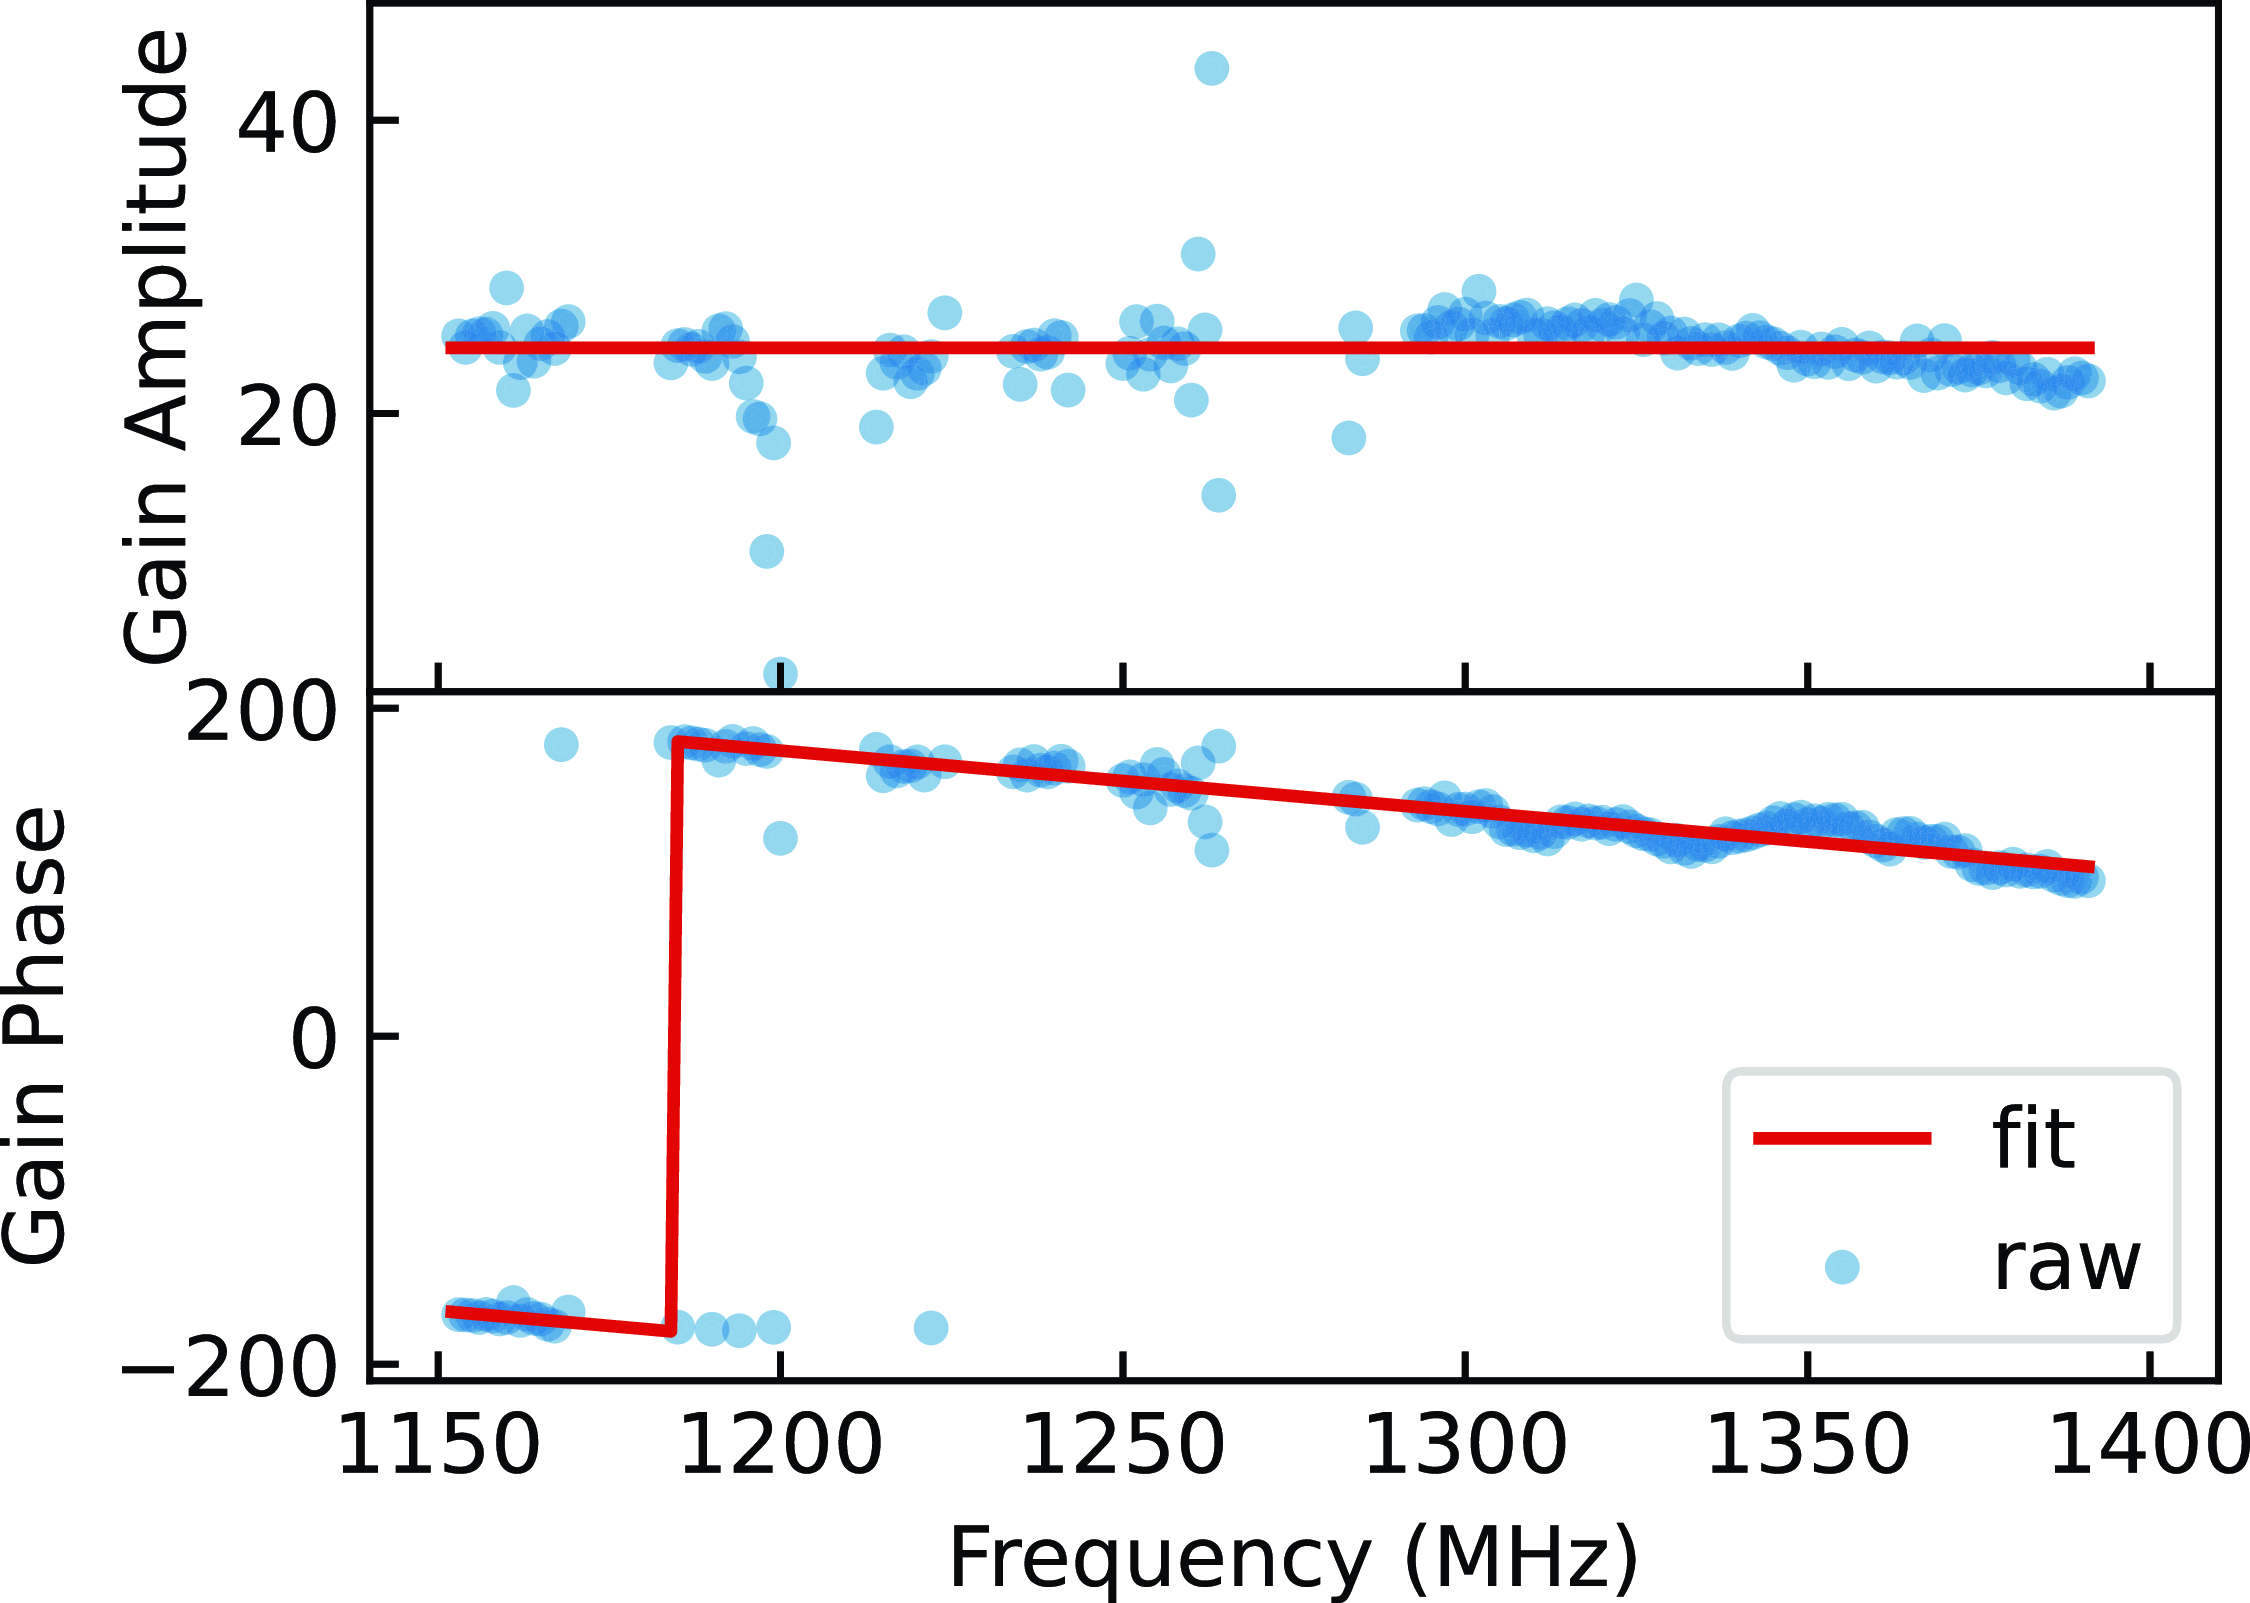
5 mJy/beam) sources within a 2 degree radius of the field centre from the RACS-Low DR1 catalogue (McConnell et al., Reference McConnell, Hale and Lenc2020; Hale et al., Reference Hale, McConnell and Thomson2021)Footnote d. We then calibrate the CRACO visibilities data against this sky model to get the bandpass solutions of gain and phase for each frequency channel using the least squares fit. The existence of radio frequency interference (RFI) in calibration observations can lead to wrong or missing solutions for the affected channels, which will in turn lower the search sensitivity. To mitigate these effects from the RFI, we fit these frequency-dependent solutions with a linear model. This procedure is performed for each antenna, using the median amplitude value of all channels as the model amplitude and by fitting for a linear trend of the unwrapped phase values (see Figure 3 for an example). We used the fitted model as the final solution and applied it in the following processing procedures.
$\gt$
5 mJy/beam) sources within a 2 degree radius of the field centre from the RACS-Low DR1 catalogue (McConnell et al., Reference McConnell, Hale and Lenc2020; Hale et al., Reference Hale, McConnell and Thomson2021)Footnote d. We then calibrate the CRACO visibilities data against this sky model to get the bandpass solutions of gain and phase for each frequency channel using the least squares fit. The existence of radio frequency interference (RFI) in calibration observations can lead to wrong or missing solutions for the affected channels, which will in turn lower the search sensitivity. To mitigate these effects from the RFI, we fit these frequency-dependent solutions with a linear model. This procedure is performed for each antenna, using the median amplitude value of all channels as the model amplitude and by fitting for a linear trend of the unwrapped phase values (see Figure 3 for an example). We used the fitted model as the final solution and applied it in the following processing procedures.
Raw and model-fitted calibration solution of gain and phase for a typical 10-minute observation. Blue circles show the calibration solution per frequency channel derived from the sky model directly, while the red line shows the fitted linear calibration solution.
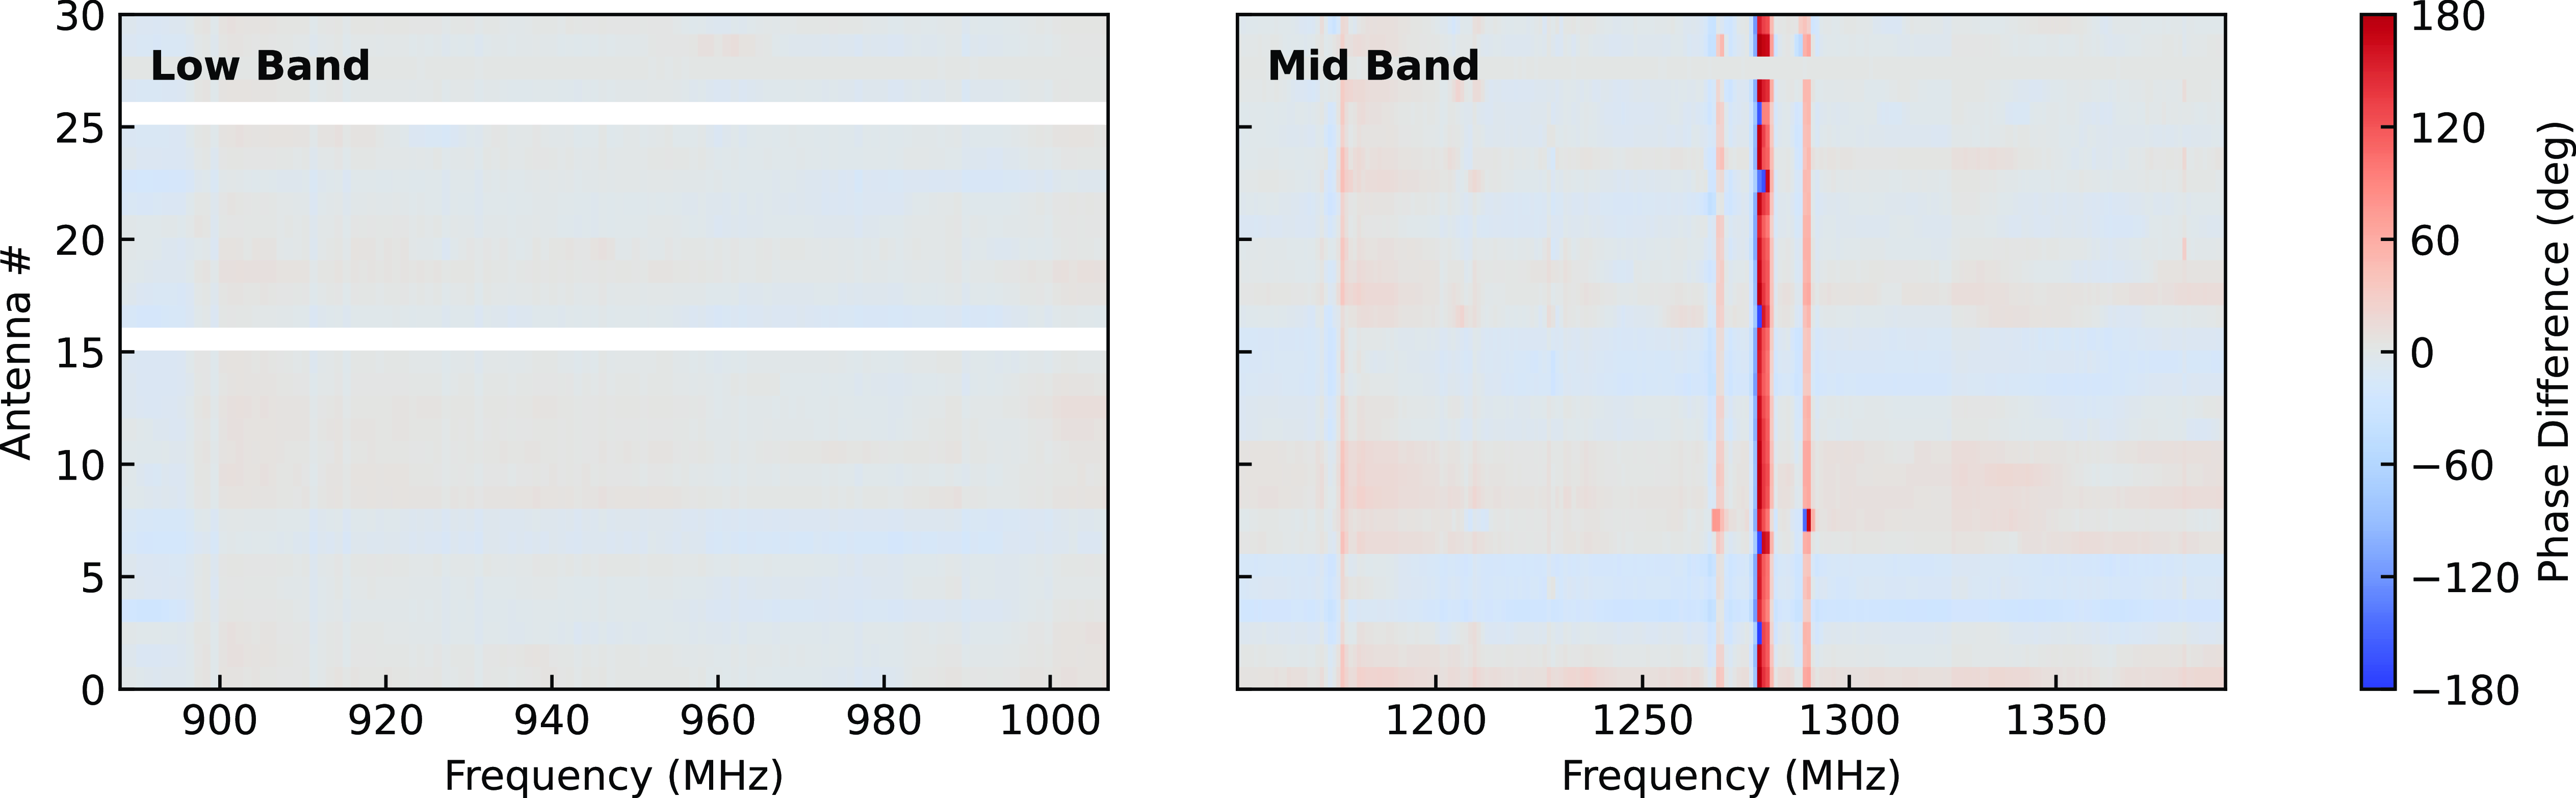
To verify the field calibration method, we compared our solutions derived from CRACO observations and ASKAP hardware observations of the bright source PKS B1934–638. In Figure 4, we show the phase differences between the two methodsFootnote e. Except for the frequency ranges affected by the RFI, the phase solutions largely agree with each other (the standard deviations of the differences are $\sim5\,$
deg and
$\sim5\,$
deg and $\sim10\,$
deg for the low band and mid band, respectively).
$\sim10\,$
deg for the low band and mid band, respectively).
Phase differences between the calibration solutions derived from CRACO field observations and the normal ASKAP PKS B1934–638 observations. The left panel shows the differences between the phase solutions derived from SB51896 (CRACO) and SB51887 (ASKAP Hardware) in low band (centred at 947.5 MHz), and the right panel shows the differences between the phase solutions derived from SB53094 (CRACO) and SB53091 (ASKAP Hardware) in mid band (centred at 1 271.5 MHz). We show the comparison for Beam 0 (note that the location of this beam within the PAF varies with the configuration footprint). The large differences in phase (at a small set of frequencies) in the mid band data are mainly caused by radio frequency interference (e.g. satellite navigation systems in $\sim$
1 150–1 300 MHz). These sources of RFI are mitigated against by the linear fitting method illustrated in Fig. 3.
$\sim$
1 150–1 300 MHz). These sources of RFI are mitigated against by the linear fitting method illustrated in Fig. 3.
2.3 Data preprocessing
There are three steps applied to the raw data in the CRACO system: RFI mitigation, calibration, and normalisation. These steps are performed on central processing units (CPUs). All data were processed block by block, with each block containing 256 samples of the data.
2.3.1 RFI mitigation
There are two steps to remove RFI in the data, namely static flagging and dynamic flagging.
In static flagging, we flag a list of known bad frequency ranges, which are constantly bad and are not well-handled by dynamic flagging. We have continually updated the list as operations continue, and currently flag the following frequency ranges: 920–960 MHz and 1 150–1 320 MHz.
Given the high volume of data, we cannot use standard flagging tools. Therefore, for the dynamic flagging, we first incoherently sum the visibility amplitudes across all baselines, forming ‘cross-amplitude sum’ (CAS) filterbanks. We use Inter-Quartile Range MitigationFootnote f (IQRM; Morello et al., Reference Morello, Rajwade and Stappers2022) to mask bad channels automatically. We set the IQRM radius parameter $r=64$
and
$r=64$
and $r=180$
for 120 MHz and 240 MHz bandwidth observation, respectively, and set the threshold to
$r=180$
for 120 MHz and 240 MHz bandwidth observation, respectively, and set the threshold to $t=5.0$
. The parameters were tuned empirically. This method effectively removes RFI and leaves the rest of the band clean.
$t=5.0$
. The parameters were tuned empirically. This method effectively removes RFI and leaves the rest of the band clean.
2.3.2 Calibration
For a given observation, we selected the gain solution derived from the observation that shared the same beamforming weights and was observed no more than one day apart. If there was no gain solution available, we would produce a new gain solution based on the method discussed in Section 2.2.
2.3.3 Sky subtraction and rescaling
Most radio sources in the sky have a relatively constant flux over the timescales we are probing with CRACO. To search for transients, we need to subtract the non-variable sky from the data and rescale it so that it has a zero mean and a target standard deviation (STD). For each block, we calculated the sky model as the complex mean values for each baseline and channel across a block, and the rescaling factor as the STD of the raw data absolute value divided by the target STD. We subtracted the sky model from the raw data and divided it by the rescaling factor. Since we calculated the sky model as the mean value across a block, the system was only sensitive to pulse-like emission narrower than the block size (conservatively, on a timescale $\lesssim$
20 s for the block size of 28 s using in 110 ms observations), and all wider transients would be subtracted out.
$\lesssim$
20 s for the block size of 28 s using in 110 ms observations), and all wider transients would be subtracted out.
2.4 Searching
The searching process comprises three main parts: de-dispersion and gridding, imaging, and boxcar filtering and thresholding. To achieve a better performance, the search was conducted on field-programmable gate arrays (FPGAs).
2.4.1 De-dispersion and gridding
Before making images, we de-disperse and grid the calibrated visibilities into four-dimension data (u, v, DM, and time). In the process, we calculate for each baseline and each channel which uv cell the Stokes I correlation amplitudes should be assigned to (we term this assignment CRACOPlan). The CRACOPlan is calculated every NPlanUpdate (12 by default, see Table 1) blocks, which is a result of the balance between positional accuracy and search efficiency.
The uv grid was fixed to $256\times256$
uv cells, and therefore the size of the corresponding synthesised image was
$256\times256$
uv cells, and therefore the size of the corresponding synthesised image was $256\times256$
pixels as well. The image pixel size and the uv cell size depend on two parameters in the search pipeline: the maximum field of view (FOV; 1.1 deg per beam, by default), and the minimum oversampling factor (OS; 2.1 by default). We first calculated the size of the synthesised beam using the maximum length of the u, v values in a given block,
$256\times256$
pixels as well. The image pixel size and the uv cell size depend on two parameters in the search pipeline: the maximum field of view (FOV; 1.1 deg per beam, by default), and the minimum oversampling factor (OS; 2.1 by default). We first calculated the size of the synthesised beam using the maximum length of the u, v values in a given block,
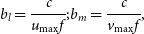 \begin{align*}b_l = \cfrac{c}{u_\mathrm{max}f};b_m = \cfrac{c}{v_\mathrm{max}f},\end{align*}
where c is the speed of light and f is the centre frequency. If the field size when we oversample the synthesised beam at a rate of OS is larger than FOV, we will increase the oversampling factor to match the FOV. Otherwise, we will lower the FOV so that the minimum OS is fulfilled. Therefore the image pixel sizes are
 \begin{align*}p_l = \min \left(\texttt{FOV}/256, b_l/\texttt{OS}\right),p_m = \min \left(\texttt{FOV}/256, b_m/\texttt{OS}\right),\end{align*}
and the corresponding uv cell sizes are
 \begin{align*}c_u = 1 / \min\left(\texttt{FOV}, 256 b_l/\texttt{OS}\right), c_u = 1 / \min\left(\texttt{FOV}, 256 b_m/\texttt{OS}\right).\end{align*}
To de-disperse the data more efficiently, we divide the whole bandwidth into several chunks of NCIN channels and pad zero values for the chunk of less than NCIN channels. We first use the Fast Dispersion Measure Transform (FDMT; Zackay &Ofek, Reference Zackay and Ofek2017) algorithm to de-disperse each NCIN channels chunk prior to gridding. We then assign the partially de-dispersed data onto uv cells based on the CRACOPlan calculated previously, in which we use brute force to de-disperse the results for all chunks, and thus de-dispersed the data across the whole observing band.
2.4.2 Imaging
As we have already subtracted the non-variable sky in Section 2.3.3, there will be only a few sources in the data, and dirty images produced with a simple fast Fourier transform are sufficient for searching.
2.4.3 Boxcar filtering and thresholding
The pipeline can search for transient events of one to eight samples in length, using 8 ‘boxcar’ filters. The output from the previous imaging step has an equivalent shape of the number of DM trials $\times$
the number of samples in time
$\times$
the number of samples in time $\times$
the number of boxcar widths
$\times$
the number of boxcar widths $\times$
the number of l-pixels
$\times$
the number of l-pixels $\times$
the number of m-pixels (ndm
$\times$
the number of m-pixels (ndm $\times$
256
$\times$
256 $\times$
8
$\times$
8 $\times$
256
$\times$
256 $\times$
256). The pipeline divided the whole block of data into small chunks with a shape of 1
$\times$
256). The pipeline divided the whole block of data into small chunks with a shape of 1 $\times$
8
$\times$
8 $\times$
8
$\times$
8 $\times$
1
$\times$
1 $\times$
16 and calculated the maximum signal-to-noise ratio value for each small chunk. If the maximum signal-to-noise ratio value exceeded the signal-to-noise ratio threshold, the pipeline would write the event to the candidate list.
$\times$
16 and calculated the maximum signal-to-noise ratio value for each small chunk. If the maximum signal-to-noise ratio value exceeded the signal-to-noise ratio threshold, the pipeline would write the event to the candidate list.
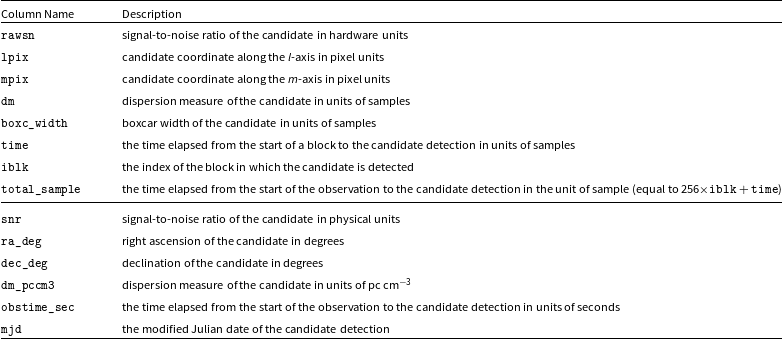
We list the candidate properties computed by the pipeline in Table 3. The raw DM value (dm in Table 3) is reported in units of time samples in the pipeline, that is, it is the dispersive time delay in samples across the observing band. We convert the raw DM to physical units (dm_pccm3 in Table 3) using:
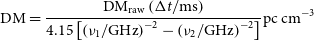 \begin{equation} \mathrm{DM} = \cfrac{\mathrm{DM}_\mathrm{raw}\left(\Delta t / \mathrm{ms}\right)}{4.15\left[\left(\nu_1/\mathrm{ GHz}\right)^{-2} - \left(\nu_2/\mathrm{GHz}\right)^{-2}\right]}\,\mathrm{pc\,cm}^{-3}\end{equation}
where $\Delta t$
is the time resolution (110 ms), and
$\Delta t$
is the time resolution (110 ms), and $\nu_1$
and
$\nu_1$
and $\nu_2$
are the edge frequencies of the observing bandwidth. The error on the raw DM reported in this work was given as
$\nu_2$
are the edge frequencies of the observing bandwidth. The error on the raw DM reported in this work was given as $+$
/
$+$
/ $-$
1 time sample across the band and was converted to physical units according to Equation (1).
$-$
1 time sample across the band and was converted to physical units according to Equation (1).
Search pipeline output parameters and descriptions
2.5 Candidate post-processing
We reduce the number of candidates to manageable levels using a post-processing pipeline, which consists primarily of two stages: candidate ‘Clustering’ and candidate ‘Classification’. ‘Clustering’ refers to the identification of burst candidates which arise at similar time, boxcar width and dispersion measure, as these are likely to originate from a single celestial event. ‘Classification’ refers to the identification of known sky sources (which we can filter out of the final candidate lists), as well as events that are most likely RFI. As such, the aim of the post-processing stage is to obtain burst detections almost exclusively from new transient sources.
2.5.1 Candidate clustering
For a given burst, particularly those with high SNR, the detection pipeline can generate several (or several tens of) candidates with a range of parameters (i.e. DMs, boxcar widths, and positions, etc.). We employed the DBSCAN algorithm (Ester et al., Reference Ester, Kriegel, Sander and Xu1996) to group these these candidates into clusters. We used three data series total_sample, dm, and boxcar_widths (all in units of samples), normalising them by dividing a factor of 3, 5, and 4, respectively, to perform the clustering step. We set eps = 1, the maximum distance separating events in the same cluster, for DBSCAN. For each cluster, we then calculated the standard deviation for lpix and mpix, (hereinafter referred to as lpix_rms and mpix_rms), to be used in further steps. These are termed ‘temporal clusters’ in what follows.
2.5.2 RFI amelioration
Although we implemented RFI flagging strategies in the search pipeline, and the ASKAP/CRACO RFI environment is rather clean, some unflagged RFI can still leak through, leading to spurious candidates that exceed our detection threshold. We employed simple heuristics to filter out these RFI candidates. We evaluated and refined our RFI amelioration heuristics by examining a large number of candidate clusters, including those due to RFI, scintillating continuum sources, and single pulses from pulsars. RFI is often impulsive, and accordingly generates candidates that are clustered within a relatively narrow time window, but spread widely across the FoV because the RFI is in the near field and exhibits a curved wavefront across the array. For clusters where either lpix_rms or mpix_rms $\gt2$
, we conducted additional clustering (hereinafter referred to as ‘spatial clustering’), within the cluster itself. This clustering used the lpix and mpix series, setting eps = 3 as the hyperparameter for DBSCAN. For a given temporal cluster, if the number of spatial clusters is
$\gt2$
, we conducted additional clustering (hereinafter referred to as ‘spatial clustering’), within the cluster itself. This clustering used the lpix and mpix series, setting eps = 3 as the hyperparameter for DBSCAN. For a given temporal cluster, if the number of spatial clusters is $\le2$
, we consider each spatial cluster as a unique candidate. However, for clusters with an excessive number of spatial clusters (
$\le2$
, we consider each spatial cluster as a unique candidate. However, for clusters with an excessive number of spatial clusters ( $\gt2$
), we group them into a single cluster. We classify a candidate as being RFI if the number of candidates within the temporal cluster is
$\gt2$
), we group them into a single cluster. We classify a candidate as being RFI if the number of candidates within the temporal cluster is $\le 2$
(astronomical sources should be detected as multiple candidates), or the number of the candidates within the spatial cluster is
$\le 2$
(astronomical sources should be detected as multiple candidates), or the number of the candidates within the spatial cluster is $\gt2$
(RFI candidates spread widely across the FoV). For candidate clusters not flagged as RFI, we select the candidate with the highest SNR for further analysis.
$\gt2$
(RFI candidates spread widely across the FoV). For candidate clusters not flagged as RFI, we select the candidate with the highest SNR for further analysis.
2.5.3 Classifying known radio transient sources
Two known classes of objects, pulsars and scintillating continuum sources (hereafter ‘scintillators’), can exhibit rapid millisecond timescale flux variations, which result in candidate detections from the search pipeline. To filter out these known sources, we cross-matched the candidates against two catalogues: the Australia Telescope National Facility Pulsar Catalogue (PSRCAT, Manchester et al., Reference Manchester, Hobbs, Teoh and Hobbs2005) for pulsars, and the RACS-low1 catalogue (Hale et al., Reference Hale, McConnell and Thomson2021) for scintillators. In both cases, we did not use the entire catalogue. For PSRCAT, we excluded pulsars with positional uncertainties greater than 15 arcsec. This criterion helps us to (1) avoid excluding real, unknown sources due to coincidental matches, and (2) obtain better localisations for poorly localised pulsars. For the RACS-low1 catalogue, we selected sources with a flux density $S \gt 0.3$
Jy, as sources need to be quite bright for scintillation to yield candidates after the pipeline. Taking into account the typical beam size of the 23-antenna data (
$S \gt 0.3$
Jy, as sources need to be quite bright for scintillation to yield candidates after the pipeline. Taking into account the typical beam size of the 23-antenna data ( $\sim$
1 arcmin), we set a threshold of 60 arcsec for cross-matching to these sources in CRACO-PS, which excludes
$\sim$
1 arcmin), we set a threshold of 60 arcsec for cross-matching to these sources in CRACO-PS, which excludes $\sim$
20 deg
$\sim$
20 deg $^2$
,
$^2$
, $\sim$
0.1% of the ASKAP visible sky, from the search.
$\sim$
0.1% of the ASKAP visible sky, from the search.
2.5.4 Manual inspection
After the clustering, filtering, and cross-matching processes, we successfully eliminated most of the unwanted candidates, from a raw rate of $\sim5\times10^5$
candidates per day to
$\sim5\times10^5$
candidates per day to $\sim30$
candidates per day after application of our heuristics. The candidates that are not pulses from unknown Galactic or extragalactic sources are typically caused by weak RFI, known sources aliased from well outside the field of view, or sidelobes from bright sources. We developed a web graphical user interfaceFootnote g to manually check filterbank plots and synthesised images for all candidates in the final list to eliminate false positives.
$\sim30$
candidates per day after application of our heuristics. The candidates that are not pulses from unknown Galactic or extragalactic sources are typically caused by weak RFI, known sources aliased from well outside the field of view, or sidelobes from bright sources. We developed a web graphical user interfaceFootnote g to manually check filterbank plots and synthesised images for all candidates in the final list to eliminate false positives.
2.6 Transient localisation
Precise localisation is essential for studying transients, especially for their multi-wavelength follow-up observations. There are several approximations we make in the gridding and imaging steps to speed up the search. As a result, the pipeline reported positions become increasingly inaccurate (with errors of up to tens of arcsec) far from the centre of the field (see Section 2.7.3 for a detailed discussion). Additionally, not all antennas are used in the detection pipeline, meaning the opportunity exists to improve the S/N and hence localisation precision. For both of those reasons, we developed post-processing scripts to enable arcsecond localisation for the transients we detected. We first extracted $\sim$
90 s of visibility data observed around the transient detection (hereafter termed ‘field data’) with all available baselines, applied the calibration solution used for searching, and de-dispersed the visibility data with the detection DM. We also extracted the visibility data for the transient detection (hereafter termed ‘event data’) out of the field data. We imaged both the field and event data using the tclean procedure in casa (CASA Team et al., Reference Team, Bean and Bhatnagar2022) with w-projection enabled, and used PyBDSF (Mohan & Rafferty, Reference Mohan and Rafferty2015) for source finding on both images. Based on the raw transient position in the event data, we could produce a tied-array beam filterbank of the event with the highest possible SNR. We cross-matched the detected sources in the field image against the RACS-low1 catalogueFootnote h to correct for systematic astrometric offsets. We also cross-matched the RACS-low1 catalogue against the ALLWISE catalogue (Cutri et al., Reference Cutri, Wright and Conrow2021) to correct for the systematic offset in the RACS catalogue. A detailed discussion of this method, the final corrections for the whole RACS catalogue, and the estimation of the uncertainty in the residual RACS astrometric errors can be found in Jaini et al., (in prep.). We then applied all these corrections to the event position. We typically achieve an uncertainty of several arcsec in the final localisation (compared to
$\sim$
90 s of visibility data observed around the transient detection (hereafter termed ‘field data’) with all available baselines, applied the calibration solution used for searching, and de-dispersed the visibility data with the detection DM. We also extracted the visibility data for the transient detection (hereafter termed ‘event data’) out of the field data. We imaged both the field and event data using the tclean procedure in casa (CASA Team et al., Reference Team, Bean and Bhatnagar2022) with w-projection enabled, and used PyBDSF (Mohan & Rafferty, Reference Mohan and Rafferty2015) for source finding on both images. Based on the raw transient position in the event data, we could produce a tied-array beam filterbank of the event with the highest possible SNR. We cross-matched the detected sources in the field image against the RACS-low1 catalogueFootnote h to correct for systematic astrometric offsets. We also cross-matched the RACS-low1 catalogue against the ALLWISE catalogue (Cutri et al., Reference Cutri, Wright and Conrow2021) to correct for the systematic offset in the RACS catalogue. A detailed discussion of this method, the final corrections for the whole RACS catalogue, and the estimation of the uncertainty in the residual RACS astrometric errors can be found in Jaini et al., (in prep.). We then applied all these corrections to the event position. We typically achieve an uncertainty of several arcsec in the final localisation (compared to $\sim$
30 arcsec uncertainty in the search pipeline). Unless otherwise specified, all coordinates reported in this work are those with corrections applied.
$\sim$
30 arcsec uncertainty in the search pipeline). Unless otherwise specified, all coordinates reported in this work are those with corrections applied.
2.7 Known features or issues
2.7.1 Aliased false-positive candidates
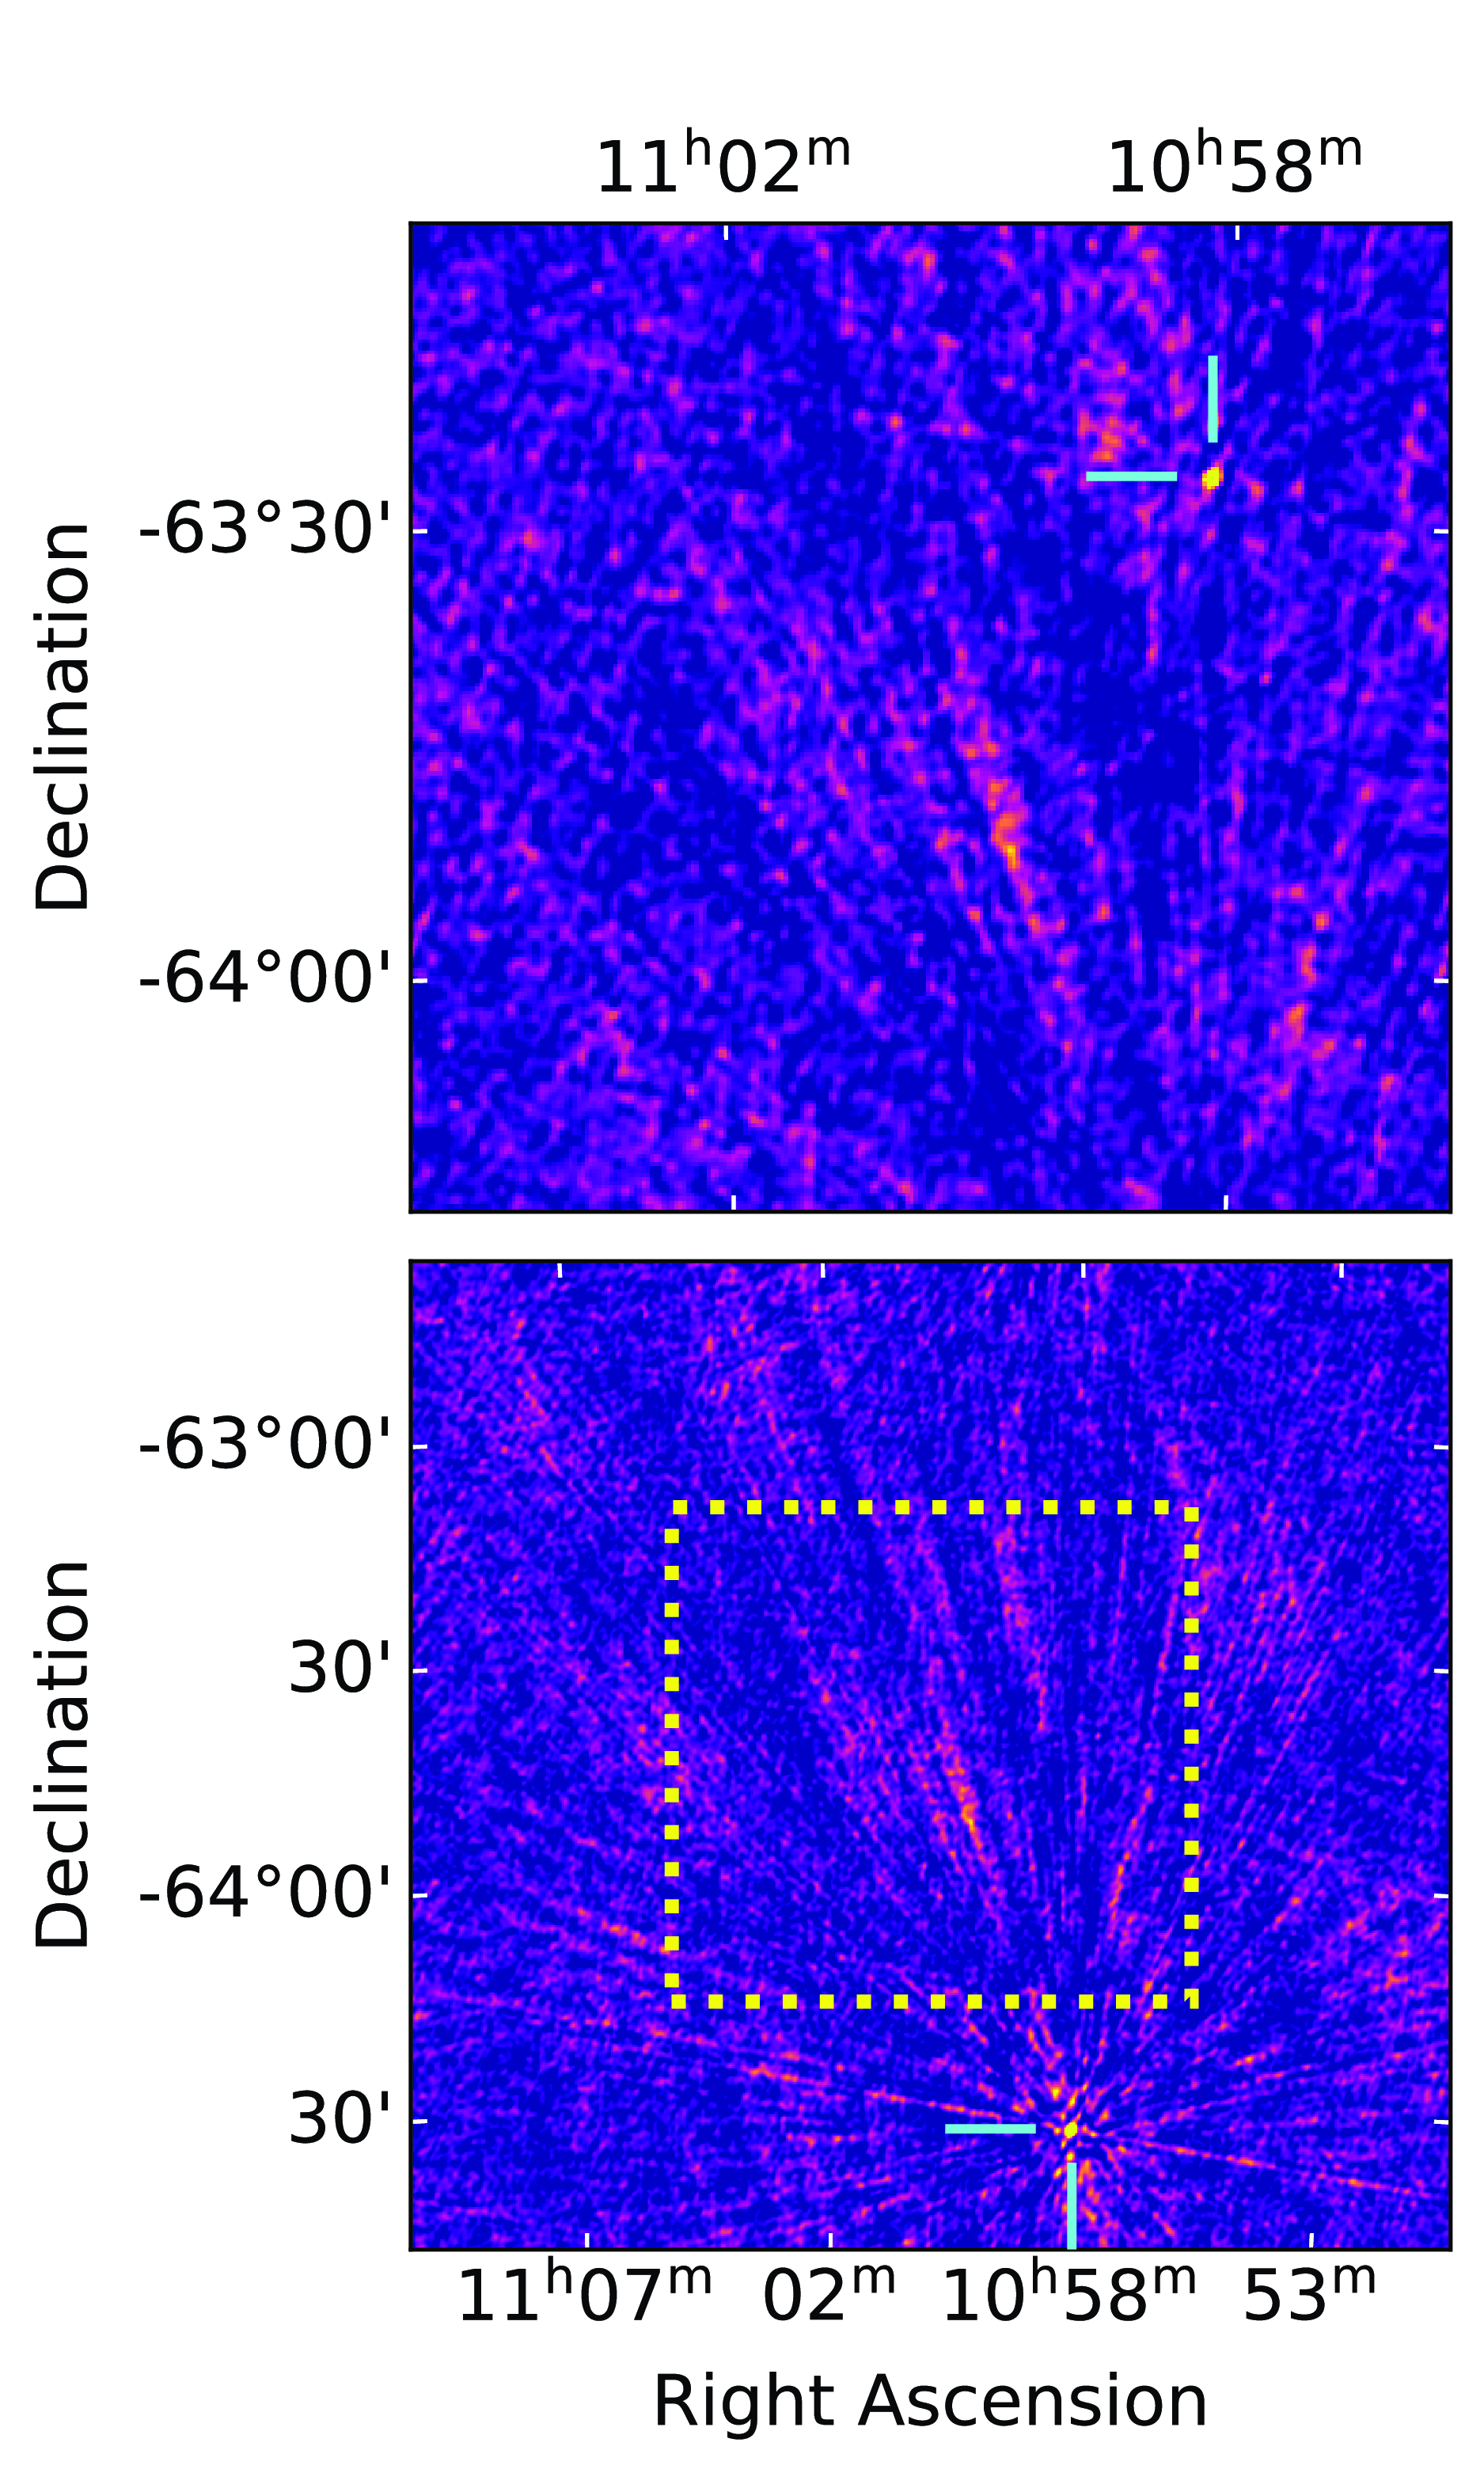
In many observed fields, we see false positive candidates that are due to a phenomenon called ‘aliasing’. These are an artefact of our imaging process and arise when the image is smaller than the FoV of the primary beam. Sources outside the imaging region may appear in the image (see Figure 5). Aliasing phenomenon will be more severe especially when using pillbox gridding (e.g. Thompson et al., Reference Thompson, Moran and Swenson2017). In CRACO-PS, we used a FoV of 1.1 deg to make synthesised images, which is smaller than the primary beam (for an observation centred at 943 MHz, the primary beam is $\sim$
1.8 deg in diameter). Importantly, real transients outside the imaging region may be detected as alias candidates albeit with a lower SNR, which can increase our effective search FoV. We note that due to the visibility data being stored on disc, we are still able to recover the correct positions after the post-processing stage. We manually checked alias sources in CRACO-PS, but have implemented an alias source filter to remove aliases from known sources automatically in the current CRACO.
$\sim$
1.8 deg in diameter). Importantly, real transients outside the imaging region may be detected as alias candidates albeit with a lower SNR, which can increase our effective search FoV. We note that due to the visibility data being stored on disc, we are still able to recover the correct positions after the post-processing stage. We manually checked alias sources in CRACO-PS, but have implemented an alias source filter to remove aliases from known sources automatically in the current CRACO.
An example of a candidate detection due to aliasing. The top panel shows the detection image of the candidate produced by the pipeline, with a FoV of 1.1 deg, and image dimensions of (256, 256) pixels. The bottom panel also shows the detection image, but with the image size doubled to (512, 512) pixels to yield a 2.2 deg FoV. The detections are marked with cyan bars. The yellow dashed rectangle in the lower panel shows the region covered in the top panel. This illustrates how a candidate can arise from a source whose true sky position lies outside the imaged region in the upper panel, but appears in it due to aliasing.
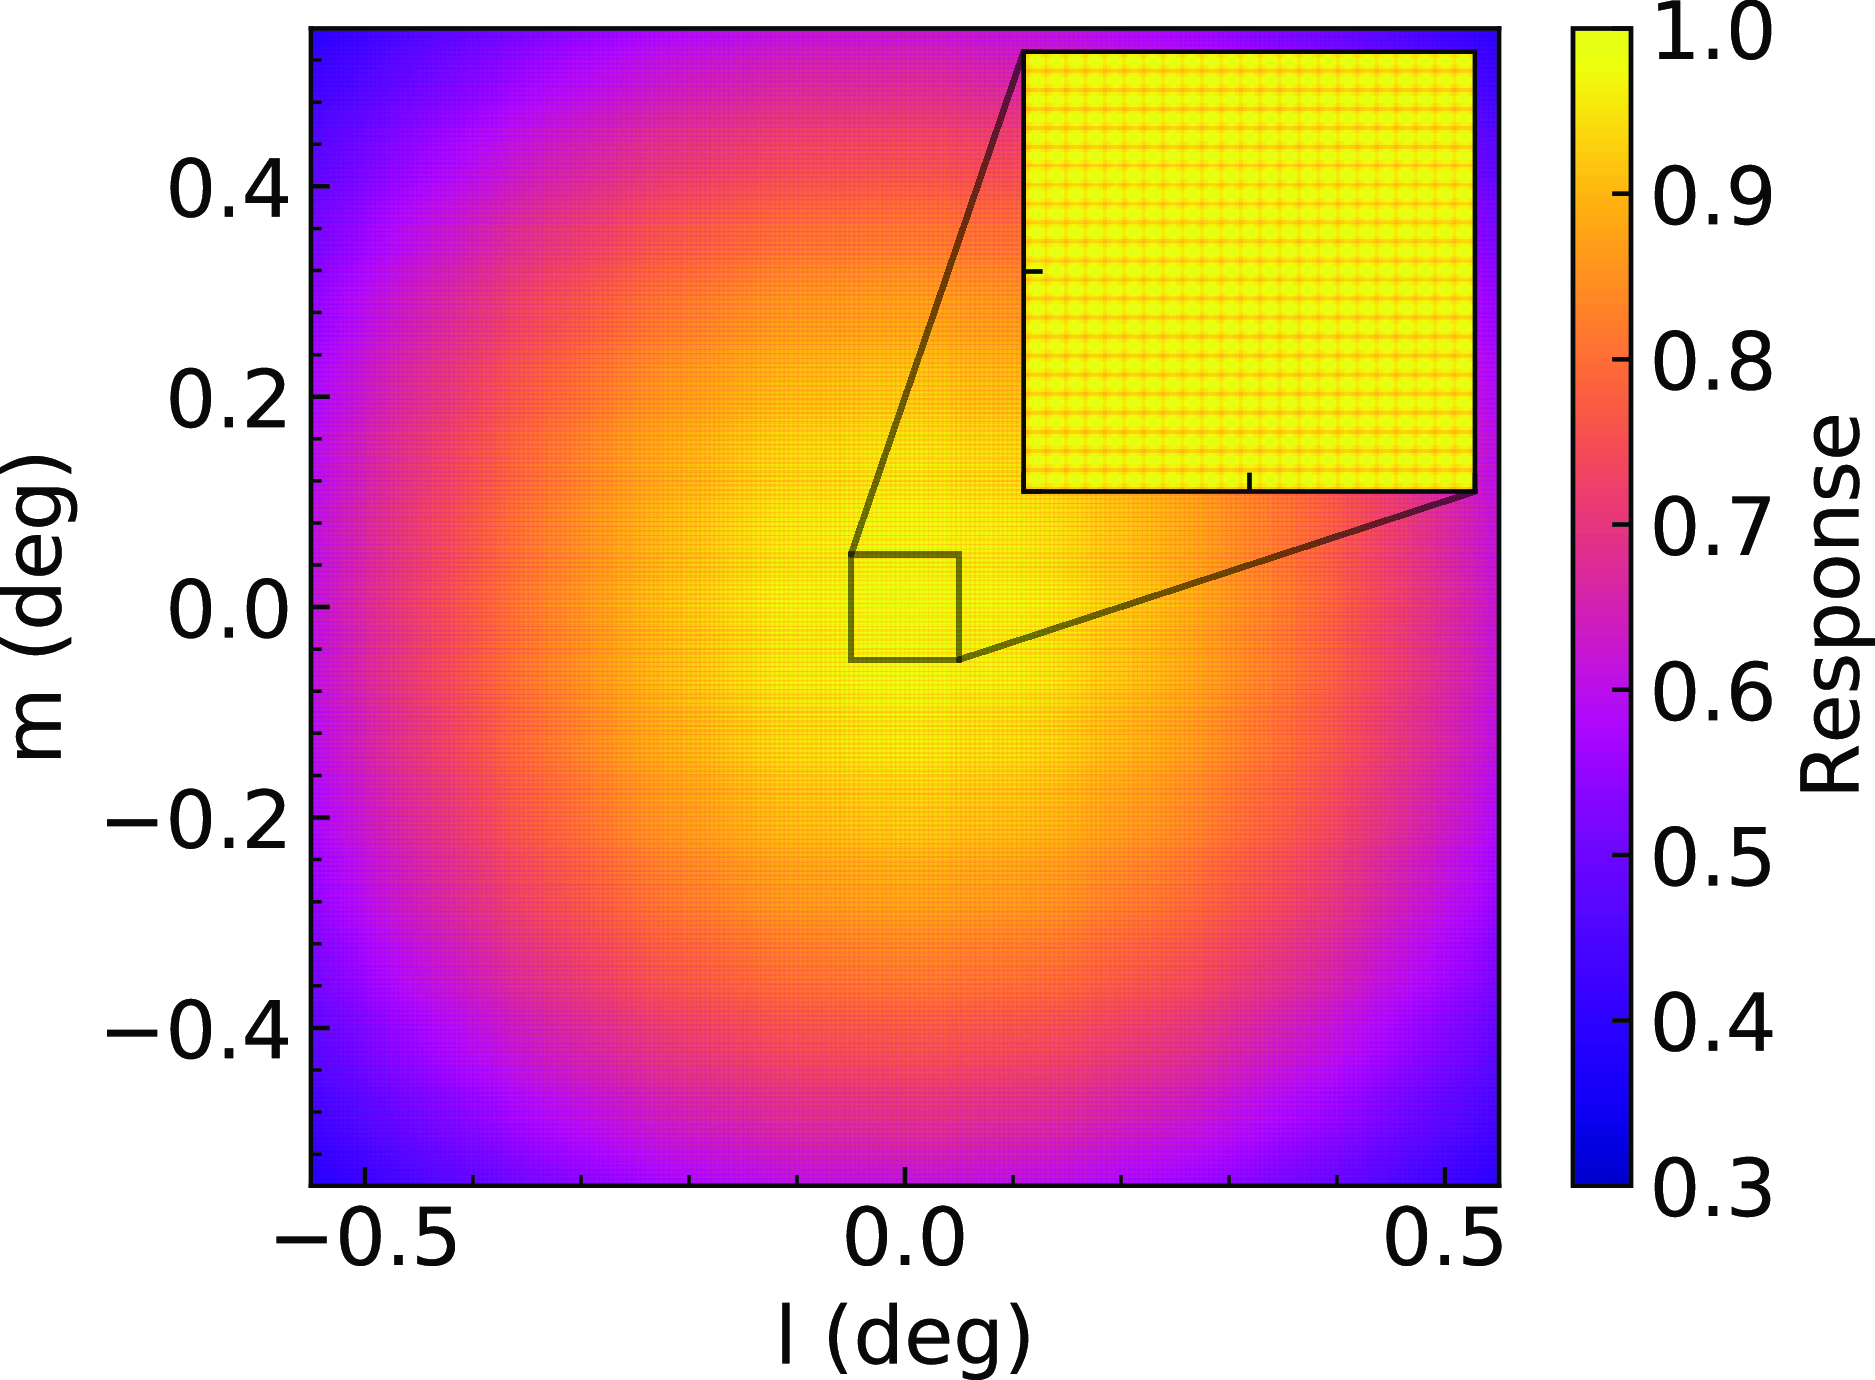
2.7.2 Nonuniform system response across the FoV
Candidates far from the phase centre were detected with a lower SNR than the expected value. We made simulated visibility data of a point source at different coordinates and generated detection images to measure the system response. As is shown in Figure 6, the SNR loss at the corners of the FoV reached $\sim$
60%.
$\sim$
60%.
A map of the signal response across the FoV as a function of coordinate offset from the phase centre. The map was made using simulated visibility data with a point source at coordinate (l, m), and calculated response as the ratio of detection flux to the input flux. The inset shows a zoomed-in region around the phase centre.
This is another limitation of using pillbox gridding. If the convolving function used for gridding is $C\left(u, v\right)$
, the measured intensity of the synthesised image will follow
$C\left(u, v\right)$
, the measured intensity of the synthesised image will follow $\widehat{C}\left(l, m\right)I'\left(l, m\right)$
, where
$\widehat{C}\left(l, m\right)I'\left(l, m\right)$
, where $\widehat{C}$
denotes the Fourier transform of C, and I ′ denotes the real intensity map convolved with the synthesised beam. For the pillbox gridding, the convolving function can be written as
$\widehat{C}$
denotes the Fourier transform of C, and I ′ denotes the real intensity map convolved with the synthesised beam. For the pillbox gridding, the convolving function can be written as
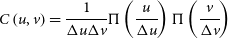 \begin{equation}C\left(u, v\right) = \cfrac{1}{\Delta u\Delta v}\Pi\left(\cfrac{u}{\Delta u}\right)\Pi\left(\cfrac{v}{\Delta v}\right)\end{equation}
where $\Delta u$
and
$\Delta u$
and $\Delta v$
are gridding spacing, and
$\Delta v$
are gridding spacing, and $\Pi\left(x\right)$
is the unit rectangle function. The Fourier transform of
$\Pi\left(x\right)$
is the unit rectangle function. The Fourier transform of $C\left(u, v\right)$
is a sinc function,
$C\left(u, v\right)$
is a sinc function,
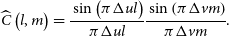 \begin{equation}\widehat{C}\left(l, m\right) = \cfrac{\sin\left(\pi\Delta ul\right)}{\pi\Delta ul} \cfrac{\sin\left(\pi\Delta vm\right)}{\pi\Delta vm}.\end{equation}
At the edge of the synthesised image, $l = (2\Delta u)^{-1}$
and
$l = (2\Delta u)^{-1}$
and $m = (2\Delta v)^{-1}$
, therefore
$m = (2\Delta v)^{-1}$
, therefore $\widehat{C} = 4/\pi^2 \approx 0.4$
. The stripy pattern shown in Figure 6 (see inset) can be explained by insufficient oversampling across the primary beam, which can cause a maximum loss of another
$\widehat{C} = 4/\pi^2 \approx 0.4$
. The stripy pattern shown in Figure 6 (see inset) can be explained by insufficient oversampling across the primary beam, which can cause a maximum loss of another $\sim$
4%. The SNR reduction can be suppressed with a more complicated gridding function (e.g. Gaussian function, and Spheroidal functions) and larger oversampling factor (i.e. smaller pixel size). However, implementing these solutions requires FPGA code changing which is challenging and can shrink the CRACO effective FoV by eliminating aliases (see Section 2.7.1). Some faint events which should have been detected can be missed by the search pipeline due to the nonuniform response across the FoV. For the events CRACO detects, we can recover their expected SNR in the post-processing step, for example, by making synthesised images with casa, generating a tied-array beam filterbank towards the event position.
$\sim$
4%. The SNR reduction can be suppressed with a more complicated gridding function (e.g. Gaussian function, and Spheroidal functions) and larger oversampling factor (i.e. smaller pixel size). However, implementing these solutions requires FPGA code changing which is challenging and can shrink the CRACO effective FoV by eliminating aliases (see Section 2.7.1). Some faint events which should have been detected can be missed by the search pipeline due to the nonuniform response across the FoV. For the events CRACO detects, we can recover their expected SNR in the post-processing step, for example, by making synthesised images with casa, generating a tied-array beam filterbank towards the event position.
2.7.3 Astrometric offset due to approximations
To allow faster searching, we made several approximations in making synthesised images. There are three primary approximations, each of which can lead to an offset as large as $\sim$
10 arcsec:
$\sim$
10 arcsec:
-
• We assumed the CRACOPlan would not change within a short time. In CRACO-PS, we updated CRACOPlan every 12 blocks (about 5 mins). This could lead to as much as a $\sim$
10 arcsec offset in astrometry because some data could be assigned to the wrong uv cells.
$\sim$
10 arcsec offset in astrometry because some data could be assigned to the wrong uv cells. -
• We assumed that all baselines could be approximated as a plane. According to Equation 3.12 in Thompson et al. (Reference Thompson, Moran and Swenson2017), this approximation will not be held and we need to consider the effect of the w-term when the FoV is larger than 15 arcmin for the array with a maximum baseline of 2 km observed at 1 GHz. The w-term can introduce an offset of
$\sim$
10 arcsec for a source near the edges of the image. -
• We approximated the source coordinate as the centre position of the brightest pixel in the image, which caused an error of
$\sim$
10 arcsec caused by the sparse sampling.


Although these astrometric offsets will not hugely impact the search pipeline performance, the coordinate information is critical in understanding the nature of the transient events. As we have discussed in Section 2.6, we can achieve an uncertainty of several arcsec in the localisation with CRACO data in the post-processing steps.
2.7.4 Other features or bugs
There are still several features or bugs in the pipeline we used for CRACO-PS which are not fixed or fully understood. We will discuss the workarounds to avoid them and how they affected our search capability in this section.
High-DM spurious candidates are those high significance candidates with a high DM, but for which there was no convincing signal in either the synthesised images or filterbanks. This kind of candidate was usually detected with a dm (in samples, see Table 3) larger than the number of channels of the data. Compared to a brute force de-dispersion, the FDMT algorithm takes intra-channel dispersion into account. During boxcar filtering, there could be overlaps between the adjacent samples. The higher the DM, the more overlaps there would be. The noise cannot be simply approximated as the standard deviation because of the correlation in the data. This is the same effect identified by Hoffmann et al. (Reference Hoffmann, James and Qiu2024) in ‘v2’ of the Fast Real-time Engine for Dedispersing Amplitudes search algorithm used in CRAFT/ICS observations, and it leads to an underestimation of the intrinsic noise fluctuations in the searches, and hence an overestimate of the SNR. This will limit the DM range the pipeline can search up to, and the impact will be more severe with a higher time resolution. For example, we can search up to $\sim$
10 000 pc cm
$\sim$
10 000 pc cm $^{-3}$
at a 110 ms resolution, but only
$^{-3}$
at a 110 ms resolution, but only $\sim$
1 000 pc cm
$\sim$
1 000 pc cm $^{-3}$
at a 13.8 ms resolution. This issue will be addressed in the future, ensuring it no longer affects our ability to search for high-DM signals.
$^{-3}$
at a 13.8 ms resolution. This issue will be addressed in the future, ensuring it no longer affects our ability to search for high-DM signals.
Phase centre fake candidates are similar to high-DM fake candidates but appear exactly at the phase centre. This kind of candidate may arise from CRACOPlan update as most of them were detected in a plan update block, but we have not figured out the exact reason. In the candidate post-processing, we filtered out all candidates within 2 pixels of the phase centre. This will cause an effective FoV loss, but only $0.04\%$
in total area is masked out.
$0.04\%$
in total area is masked out.
Buffer saturation happens when the number of candidates in one block (256 samples) is larger than 8 192, and we can only get the first 8 192 candidates in the final output. The high number of candidates can happen due to various reasons. If the pulse is too bright, such as consecutive single pulses from the Vela pulsar, it will produce a large number of candidates at different DMs, positions (main lobe and side lobes), and boxcar widths, which also occurs when there is RFI in the data. Some issues we discussed above (e.g. high DM spurious candidates) can also result in a large number of unwanted candidates, which can saturate the buffer as well. To minimise the saturation occurrence, we flagged the known RFI frequencies before the data was run through the pipeline, and we set ndm close to the number of channels (see Table 2 for example) to suppress the high-DM spurious candidates. $\sim$
10% observing time at the mid-band (mainly caused by the satellite RFIs) and
$\sim$
10% observing time at the mid-band (mainly caused by the satellite RFIs) and $\lesssim$
0.1% observing time at the low-band are affected by the saturation issue.
$\lesssim$
0.1% observing time at the low-band are affected by the saturation issue.
3. System performance
3.1 Sensitivity validation of CRACO/ASKAP
We use methods described in James et al. (Reference James, Bannister and Macquart2019) to validate the sensitivity of CRACO. To assess the sensitivity of CRACO, we performed an ASKAP observation (Schedule Block 52211) of the bright pulsar PSR J1644 $-$
4559 contemporaneous with Parkes/Murriyang Ultra Wideband Low (UWL, Hobbs et al., Reference Hobbs, Manchester and Dunning2020) to verify the system equivalent flux density (SEFD). The ASKAP observation was performed with CRACO with a temporal and spectral resolution of 1.728 ms and 1.0 MHz, respectively, at a centre frequency of 944 MHz. Only 21 antennas were used for CRACO recording. The Parkes/Murriyang UWL observation was performed in a pulsar search mode (Hobbs et al., Reference Hobbs, Manchester and Dunning2020) with a temporal and spectral resolution of 64
$-$
4559 contemporaneous with Parkes/Murriyang Ultra Wideband Low (UWL, Hobbs et al., Reference Hobbs, Manchester and Dunning2020) to verify the system equivalent flux density (SEFD). The ASKAP observation was performed with CRACO with a temporal and spectral resolution of 1.728 ms and 1.0 MHz, respectively, at a centre frequency of 944 MHz. Only 21 antennas were used for CRACO recording. The Parkes/Murriyang UWL observation was performed in a pulsar search mode (Hobbs et al., Reference Hobbs, Manchester and Dunning2020) with a temporal and spectral resolution of 64 $\mu$
s and 0.5 MHz, respectively. The search mode data were reduced to PSRFITS archive files using dspsr and further analysis was performed using the pulsar processing package psrchive.
$\mu$
s and 0.5 MHz, respectively. The search mode data were reduced to PSRFITS archive files using dspsr and further analysis was performed using the pulsar processing package psrchive.
The UWL single pulses were flux-calibrated using UWL calibrator observation of J0407 $-$
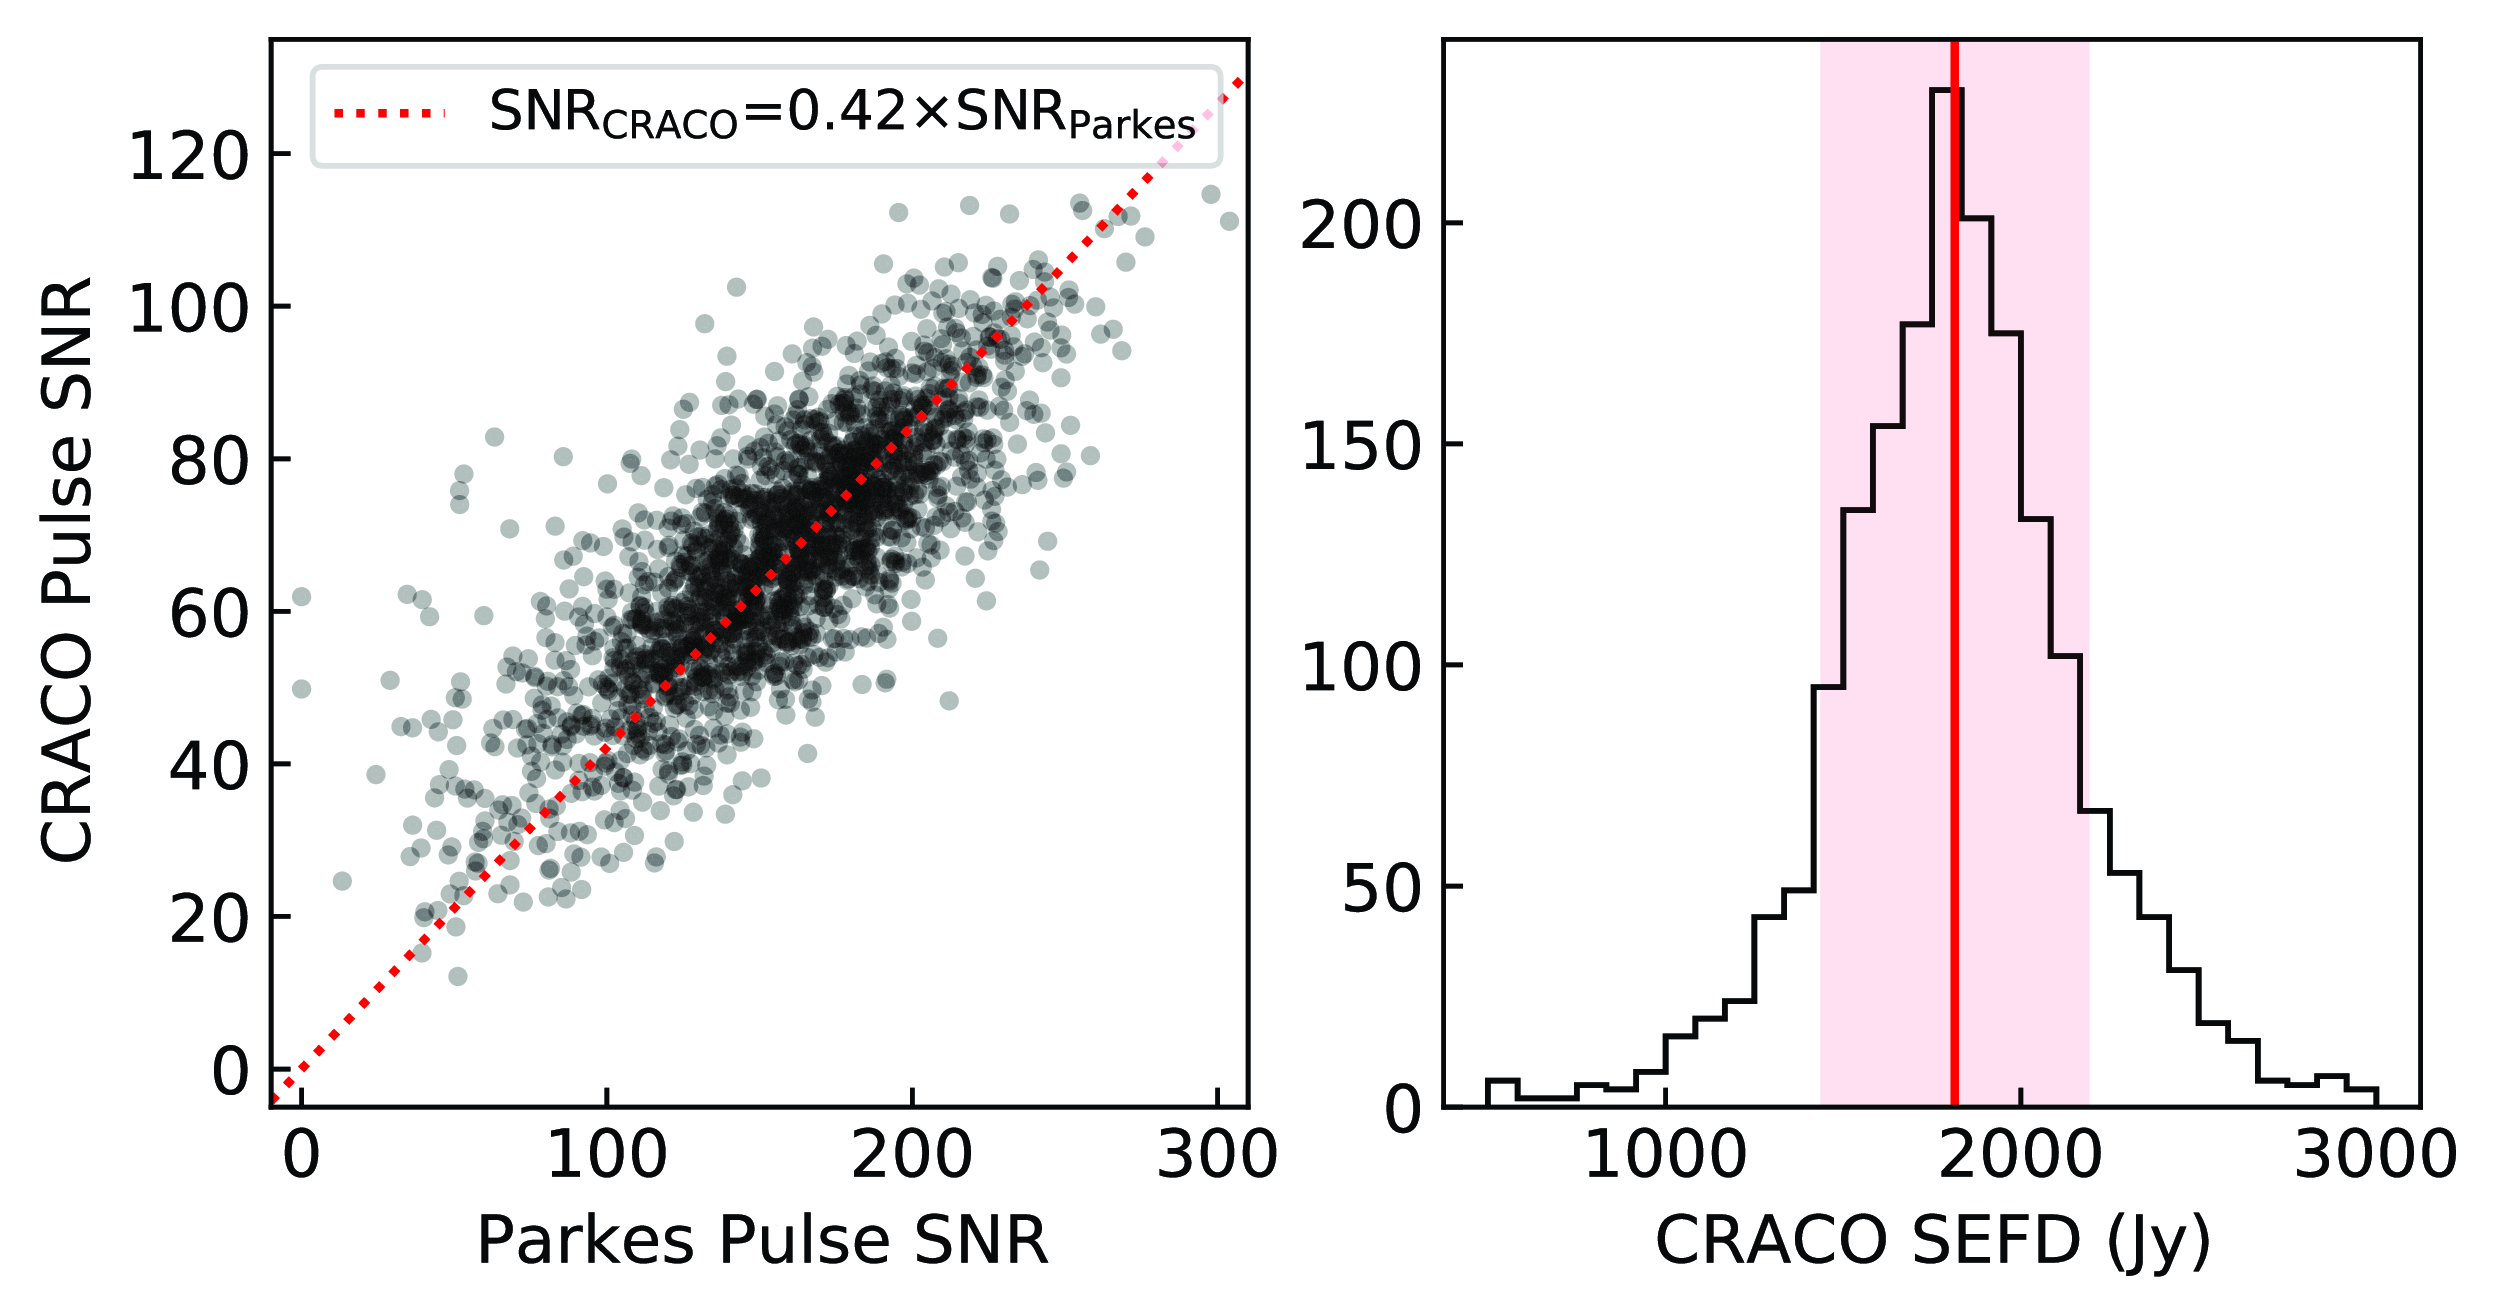
458. The UWL data are impacted by more hostile RFI environment compared to the ASKAP in the same band. We excise RFI using the native excision algorithm in psrchive. For comparison, we use the common frequency channels and average the data to the same time resolution, 26.8 ms, for both UWL and CRACO. The SNR for the individual single pulses for CRACO and UWL are calculated from the frequency-averaged pulse profiles. The time offset between UWL and ASKAP observations was corrected using frequency-averaged profile cross-correlation between both data streams. The SNR derived from CRACO is on-average 42% that of Parkes UWL (see Figure 7). Since the pulse duration for PSR J1644-4559 (
$-$
458. The UWL data are impacted by more hostile RFI environment compared to the ASKAP in the same band. We excise RFI using the native excision algorithm in psrchive. For comparison, we use the common frequency channels and average the data to the same time resolution, 26.8 ms, for both UWL and CRACO. The SNR for the individual single pulses for CRACO and UWL are calculated from the frequency-averaged pulse profiles. The time offset between UWL and ASKAP observations was corrected using frequency-averaged profile cross-correlation between both data streams. The SNR derived from CRACO is on-average 42% that of Parkes UWL (see Figure 7). Since the pulse duration for PSR J1644-4559 ( $\sim50\,ms$
at 900 MHz) is greater than the temporal resolution of both systems, and we use identical frequencies for our analysis, we conclude that the primary effect on the SNR is the SEFD of each system, that is, the ratio between CRACO SNR and Parkes SNR follows
$\sim50\,ms$
at 900 MHz) is greater than the temporal resolution of both systems, and we use identical frequencies for our analysis, we conclude that the primary effect on the SNR is the SEFD of each system, that is, the ratio between CRACO SNR and Parkes SNR follows
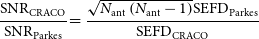 \begin{equation} \cfrac{\mathrm{SNR}_\mathrm{CRACO}}{\mathrm{SNR}_\mathrm{Parkes}} = \cfrac{\sqrt{N_\mathrm{ant}\left(N_\mathrm{ ant}-1\right)}\mathrm{SEFD}_\mathrm{Parkes}}{\mathrm{SEFD}_\mathrm{CRACO}}\end{equation}
, where $N_\mathrm{ant}$
is the number of the antenna used for CRACO recording. The SEFD of Parkes UWL for the frequency channels we use for comparison is
$N_\mathrm{ant}$
is the number of the antenna used for CRACO recording. The SEFD of Parkes UWL for the frequency channels we use for comparison is $\sim$
38 JyFootnote i. Therefore, we conclude that the SEFD of the CRACO system for a single antenna is
$\sim$
38 JyFootnote i. Therefore, we conclude that the SEFD of the CRACO system for a single antenna is $1\,820\pm370\,$
Jy, which is consistent with what was reported in Hotan et al. (Reference Hotan, Bunton and Chippendale2021).
$1\,820\pm370\,$
Jy, which is consistent with what was reported in Hotan et al. (Reference Hotan, Bunton and Chippendale2021).
Left: Comparison of pulse SNR detected from PSR J1644 $-$
4559 using CRACO and Parkes UWL. The red dotted line represents the best linear fit without an intercept, with a slope of 0.42. Right: Histogram of derived CRACO single-dish SEFD from single pulses. The red solid line indicates the median value of the derived CRACO SEFD (1810 Jy), while the red shaded region represents the 1-
$-$
4559 using CRACO and Parkes UWL. The red dotted line represents the best linear fit without an intercept, with a slope of 0.42. Right: Histogram of derived CRACO single-dish SEFD from single pulses. The red solid line indicates the median value of the derived CRACO SEFD (1810 Jy), while the red shaded region represents the 1- $\sigma$
error range (370 Jy).
$\sigma$
error range (370 Jy).
3.2 DM and coordinate measurement accuracy
We used known pulsars detected in the 110-ms survey (see Table 9) to estimate the accuracy of the pipeline measurement on the DM and coordinate. We selected all bright (SNR > 8) candidates with a known pulsar matched in the candidate post-processing output (i.e. after clustering, and cross-matching), and compared their DM and coordinates against the values in the PSRCAT using the psrqpy package (Pitkin, Reference Pitkin2018).
We measured an offset weighted by the SNR of $0.26\pm7.60\,$
arcsec,
$0.26\pm7.60\,$
arcsec, $4.83\pm9.36\,$
arcsec, and
$4.83\pm9.36\,$
arcsec, and $11.36\pm6.30\,$
arcsec for right ascension, declination, and angular offset, respectively (see Figure 8 top panel). We observe an asymmetric distribution for declination, of which the underlying cause is still unclear. We also noted that there were false matches due to sidelobes which would cause systematic offsets. However, these offsets are all within the expectation (compared to the typical pixel size of
$11.36\pm6.30\,$
arcsec for right ascension, declination, and angular offset, respectively (see Figure 8 top panel). We observe an asymmetric distribution for declination, of which the underlying cause is still unclear. We also noted that there were false matches due to sidelobes which would cause systematic offsets. However, these offsets are all within the expectation (compared to the typical pixel size of $\sim$
15 arcsec, and also see discussion in Section 2.7.3). Even in the case of significant outliers, we are still able to measure a precise coordinate with the steps discussed in Section 2.6 for new discoveries.
$\sim$
15 arcsec, and also see discussion in Section 2.7.3). Even in the case of significant outliers, we are still able to measure a precise coordinate with the steps discussed in Section 2.6 for new discoveries.
Coordinate and DM value comparison for known pulsars detected in the CRACO 110-ms pilot survey between the pipeline and PSRCAT. On the top panel, we show $\Delta$
RA
$\Delta$
RA $\cos$
DEC,
$\cos$
DEC, $\Delta$
DEC, and angular separation values for all CRACO candidates matched with a known pulsar against the separation to the phase centre on l-axis,
$\Delta$
DEC, and angular separation values for all CRACO candidates matched with a known pulsar against the separation to the phase centre on l-axis, $m-$
axis, and
$m-$
axis, and $lm-$
space, respectively. Two horizontal dashed lines represent the size of one pixel (
$lm-$
space, respectively. Two horizontal dashed lines represent the size of one pixel ( $\sim$
15.5 arcsec). On the bottom panel we show the comparison of the DM values for all CRACO candidates matched with a known pulsar between the one reported by CRACO and listed in PSRCAT on the left. We also show the same comparison but only for the candidates with the highest SNR for each pulsar on the right.
$\sim$
15.5 arcsec). On the bottom panel we show the comparison of the DM values for all CRACO candidates matched with a known pulsar between the one reported by CRACO and listed in PSRCAT on the left. We also show the same comparison but only for the candidates with the highest SNR for each pulsar on the right.
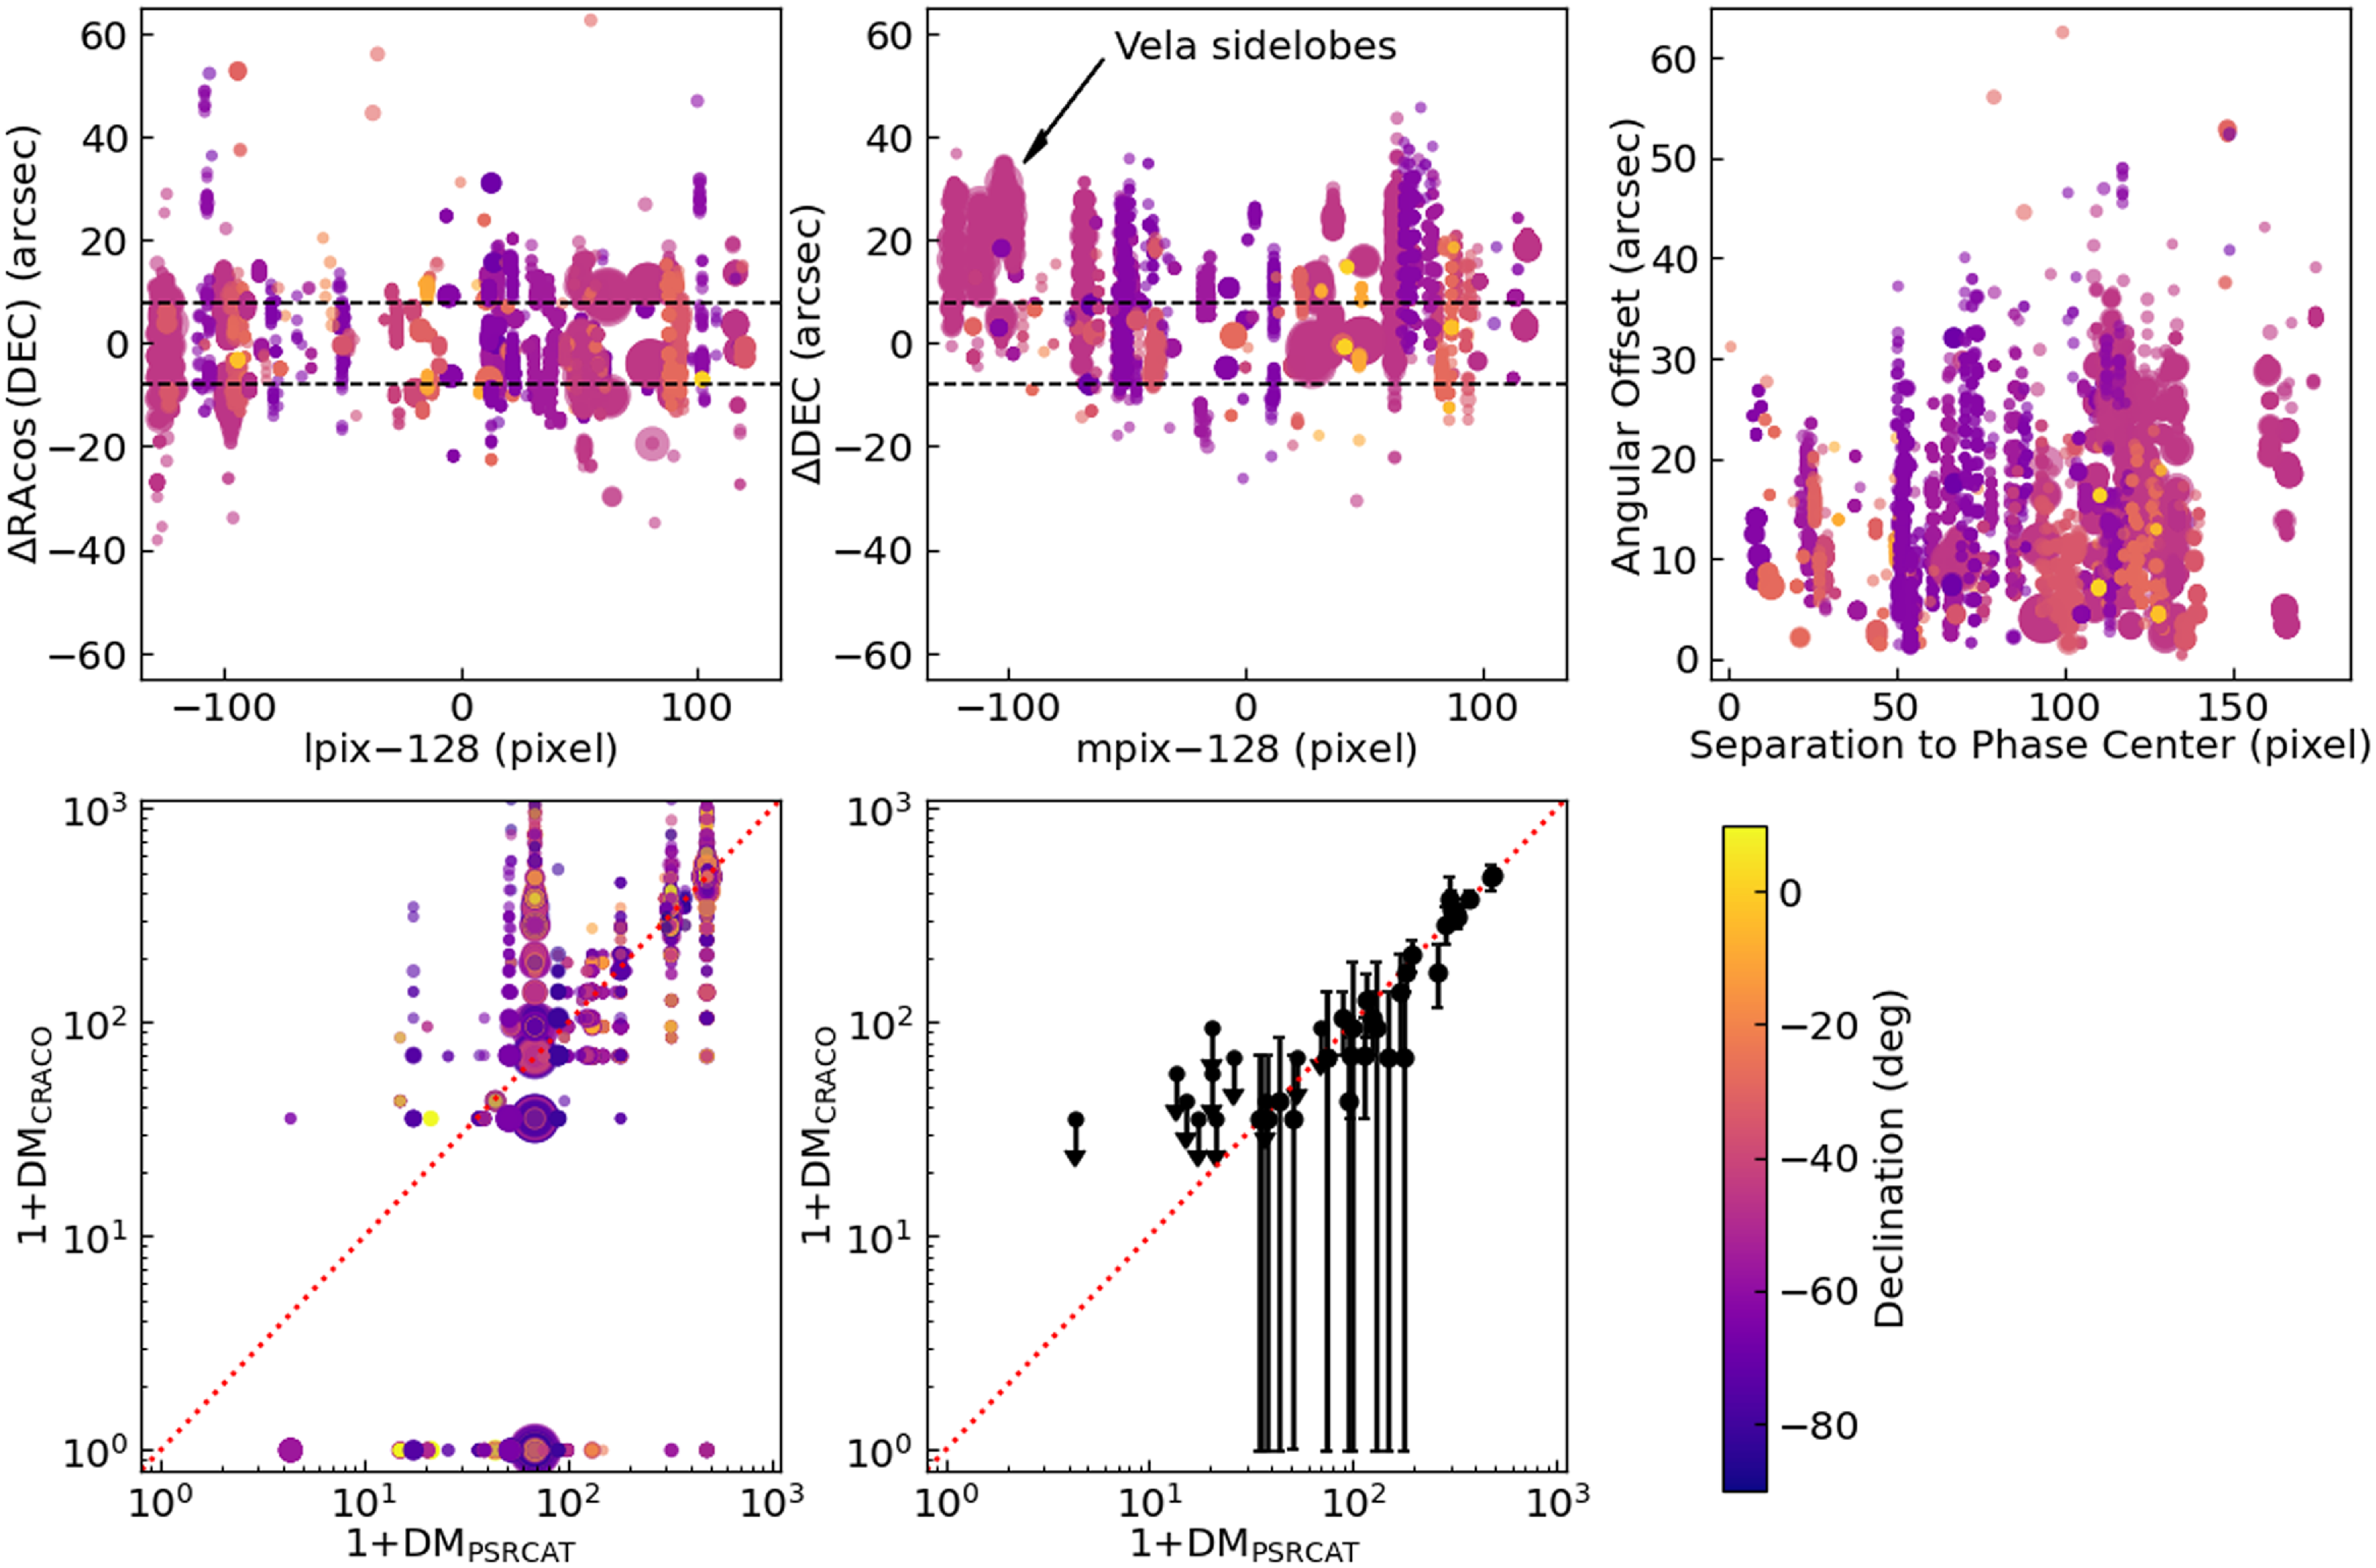
We also compared the DM value measured by the pipeline against the value in the PSRCAT. Due to the low time resolution of the data (110 ms), the detection DMs are highly quantised. We therefore only made qualitative comparisons. As is shown in the bottom panel of Figure 8 the DM values reported by the pipeline largely agreed with the catalogued values. The scatter in the left plot is mainly caused by the false matches and imperfect clustering in our post-processing procedure.
3.3 Candidate pipeline performance
We performed regular manual checks to qualitatively understand the performance of the candidate pipeline. However, we did not perform comprehensive quantitative checks as the system was still in development. We saw $\sim10^3$
candidates per day due to RFI, of which typically
$\sim10^3$
candidates per day due to RFI, of which typically $\sim$
10 per day were misclassified as potential real sources. The majority of the leaked RFI candidates are associated with either RFI with a slow variation (on a timescale of several seconds) in phase, or moving objects (i.e. from a satellite or aeroplane). Other notable sources of false positives were aliases from known sources (
$\sim$
10 per day were misclassified as potential real sources. The majority of the leaked RFI candidates are associated with either RFI with a slow variation (on a timescale of several seconds) in phase, or moving objects (i.e. from a satellite or aeroplane). Other notable sources of false positives were aliases from known sources ( $\sim$
10 candidates per day) and sidelobes of bright sources (
$\sim$
10 candidates per day) and sidelobes of bright sources ( $\sim$
1 candidate per day). Around 30 candidates per day occurred due to Galactic pulsating sources, of which
$\sim$
1 candidate per day). Around 30 candidates per day occurred due to Galactic pulsating sources, of which $\sim$
98% were correctly classified and
$\sim$
98% were correctly classified and $\sim$
2% were missed mainly due to their poor localisation. False negatives were mainly candidates from real pulsars classified as RFI, because either: (1) the candidate was detected at the same time as lots of real RFI; (2) due to the issues discussed in Section 2.7.4; or (3) the pulsar signal was so bright (with a single pulse SNR
$\sim$
2% were missed mainly due to their poor localisation. False negatives were mainly candidates from real pulsars classified as RFI, because either: (1) the candidate was detected at the same time as lots of real RFI; (2) due to the issues discussed in Section 2.7.4; or (3) the pulsar signal was so bright (with a single pulse SNR $\gtrsim$
50) that it produced several sidelobe candidates. We did not do systematic injections to test the performance of the pipeline robustly in our 110-ms survey. However, this will be included in future operations once the CRACO system becomes stable.
$\gtrsim$
50) that it produced several sidelobe candidates. We did not do systematic injections to test the performance of the pipeline robustly in our 110-ms survey. However, this will be included in future operations once the CRACO system becomes stable.
4. Pilot survey description
We conducted the CRACO-PS observations as part of the system commissioning procedure between April and November of 2023. During the survey the CRACO system was piggybacked onto all available ASKAP surveys including the First Large Absorption line Survey in HI (FLASH; Allison et al., Reference Allison, Sadler and Amaral2022), the Variables And Slow Transients (VAST; Murphy et al., Reference Murphy, Chatterjee and Kaplan2013, Reference Murphy, Kaplan and Stewart2021) csurvey, the Evolutionary Map of the Universe (EMU; Norris et al., Reference Norris, Hopkins and Afonso2011, Reference Norris, Marvil and Collier2021) survey, and the Widefield ASKAP L-band Legacy All-sky Blind surveY (WALLABY; Koribalski et al., Reference Koribalski, Staveley-Smith and Westmeier2020). Parameters for these four surveys onto which we have piggybacked are listed in Table 4.
During the commissioning we developed the CRACO backend incrementally, such as by improving the bandwidth, optimising the search algorithm, and changing the search parameters, to meet the proposed capacity. Because of that, the survey consisted of two parts with different sets of search parameters listed in Table 2. The maximum DM in the physical unit we searched up to depends on the parameter ndm and the frequency range. As a reference, for the observations centred at 943.5 MHz (i.e. EMU observations), the maximum DM we searched up to was $\sim$
12 000 pc cm
$\sim$
12 000 pc cm $^{-3}$
for both parts of the survey. We recorded data from the inner 30 antennas (with a maximum baseline of
$^{-3}$
for both parts of the survey. We recorded data from the inner 30 antennas (with a maximum baseline of $\sim$
2 km), but we only searched data from the inner 23 antennas (with a maximum baseline of
$\sim$
2 km), but we only searched data from the inner 23 antennas (with a maximum baseline of $\sim$
1 km). This decision was made to balance the sensitivity and FoV. We chose the minimum oversampling factor (with regard to the synthesised beam) to be 2.1 to minimise the SNR loss due to sparse sampling in the uv plane, and used a FoV of 1.1 deg to ensure the overlapping between adjacent beams for the search. Including longer baselines would decrease the synthesised beam and therefore decrease the FoV if we held the oversampling factor fixed. Not all 23 antennas were operational throughout the entire survey: there could be several (typically up to three) antennas non-operational due to maintenance and other various reasons. We show the coverage map of the pilot survey in Figure 9. We could not search all 36 beams (the corresponding beams are coloured white in the figure) because of hardware issues in some FPGA cards at the time of the search.
$\sim$
1 km). This decision was made to balance the sensitivity and FoV. We chose the minimum oversampling factor (with regard to the synthesised beam) to be 2.1 to minimise the SNR loss due to sparse sampling in the uv plane, and used a FoV of 1.1 deg to ensure the overlapping between adjacent beams for the search. Including longer baselines would decrease the synthesised beam and therefore decrease the FoV if we held the oversampling factor fixed. Not all 23 antennas were operational throughout the entire survey: there could be several (typically up to three) antennas non-operational due to maintenance and other various reasons. We show the coverage map of the pilot survey in Figure 9. We could not search all 36 beams (the corresponding beams are coloured white in the figure) because of hardware issues in some FPGA cards at the time of the search.
5. Pilot survey results
The CRACO pipeline is able to detect transient events on timescales from a hundred milliseconds to a second. FRBs, pulsars/RRaTs, and ULPOs can all show burst-like emission on these timescales.
5.1 FRBs
In CRACO-PS we detected one FRB, FRB 20231027A, through the CRACO pipeline and also confirmed the detection of a CRAFT/ICS-detected FRB, FRB 20230902A, in the CRACO data. We list their properties in Table 5.
Observation parameters for the ASKAP surveys for which CRACO operated in piggyback mode. The column marked Time shows the total number of hours we recorded with the CRACO backend.
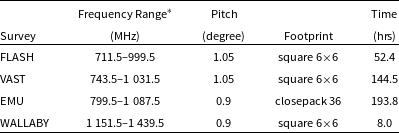
*This indicates the frequency range of the survey itself, and not necessarily the frequency band searched with CRACO
CRACO 110-ms Pilot Survey coverage map. The grey shaded region shows the sky that ASKAP cannot observe due to the elevation limit. The red dashed line indicates the position of the Galactic Plane.
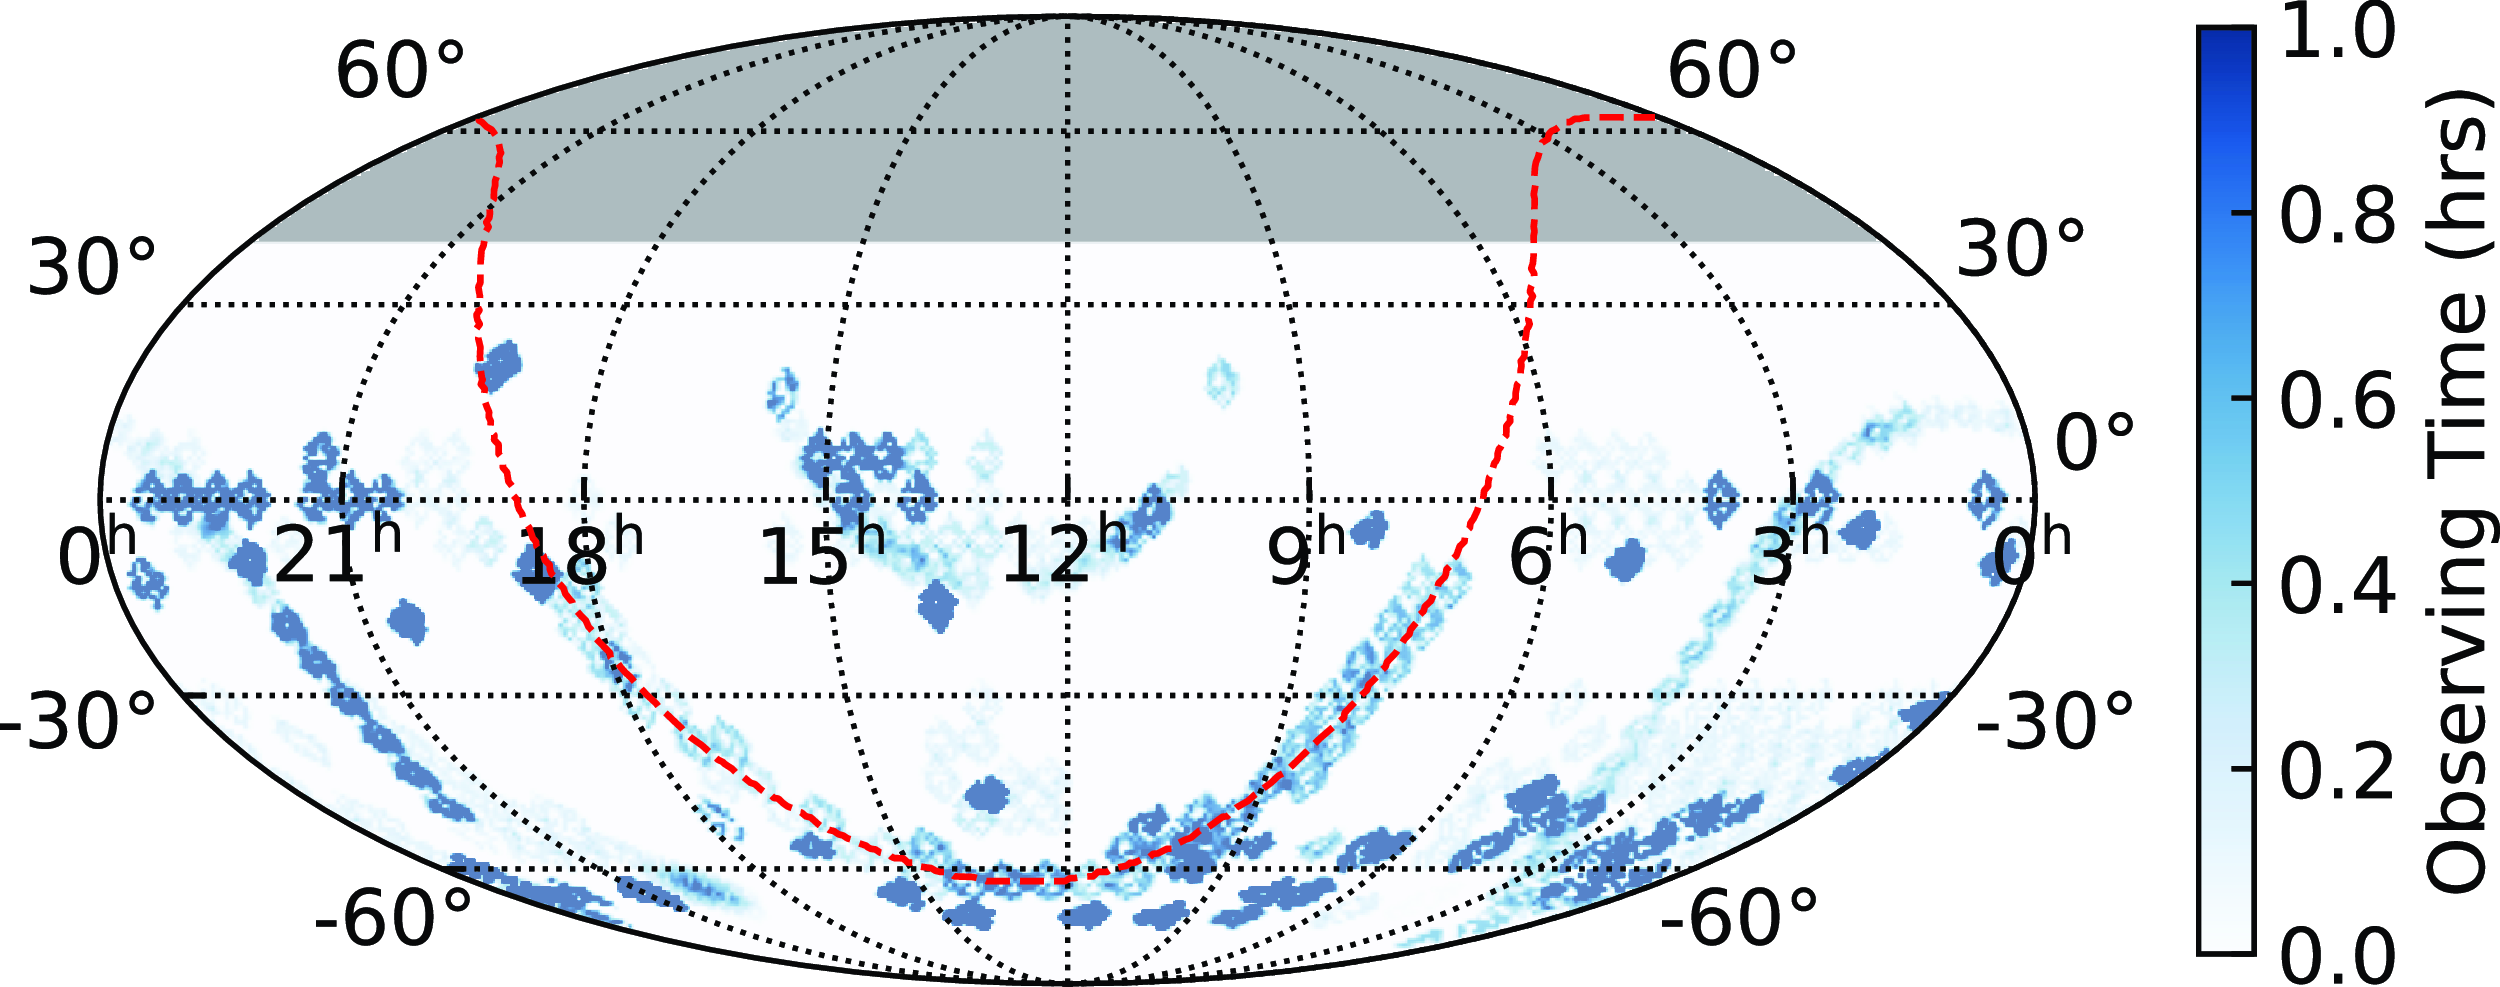
5.1.1 FRB 20230902A
FRB 20230902AFootnote j was detected in real time by the CRAFT/ICS (Bannister et al., Reference Bannister, Deller and Phillips2019) system (SB52520, beam 17) with a SNR of 10.1 (with 22 antennas available), a pulse width of $\sim8\,$
ms, and a DM of 438.23 pc cm
$\sim8\,$
ms, and a DM of 438.23 pc cm $^{-3}$
. At the time of FRB 20230902A, we were recording CRACO data with 26 available antennas, 110-ms time resolution, and a 120 MHz bandwidth (from 856 to 976 MHz). We expected an SNR of
$^{-3}$
. At the time of FRB 20230902A, we were recording CRACO data with 26 available antennas, 110-ms time resolution, and a 120 MHz bandwidth (from 856 to 976 MHz). We expected an SNR of $\eta\sqrt{\cfrac{\Delta\nu_\mathrm{CRACO}}{\Delta\nu_\mathrm{ICS}}}\cfrac{N_\mathrm{ ant,CRACO}}{\sqrt{N_\mathrm{ant,ICS}}}\sqrt{\cfrac{W_\mathrm{obs, ICS}}{W_\mathrm{obs, CRACO}}}\mathrm{SNR}_\mathrm{ICS} \approx 5.3$
detection for FRB 20230902A in the CRACO data, where
$\eta\sqrt{\cfrac{\Delta\nu_\mathrm{CRACO}}{\Delta\nu_\mathrm{ICS}}}\cfrac{N_\mathrm{ ant,CRACO}}{\sqrt{N_\mathrm{ant,ICS}}}\sqrt{\cfrac{W_\mathrm{obs, ICS}}{W_\mathrm{obs, CRACO}}}\mathrm{SNR}_\mathrm{ICS} \approx 5.3$
detection for FRB 20230902A in the CRACO data, where $\Delta\nu$
is the observing bandwidth,
$\Delta\nu$
is the observing bandwidth, $N_\mathrm{ant}$
is the number of antennas,
$N_\mathrm{ant}$
is the number of antennas, $W_\mathrm{obs}$
is the observed width, and
$W_\mathrm{obs}$
is the observed width, and $\eta\approx0.6$
is the response factor for a one time sample width pulse (e.g. Qiu et al., Reference Qiu, Keane, Bannister, James and Shannon2023). We used CASA to image the CRACO data to confirm the detection. We identified a transient detected with an SNR of 5.4 at the FRB position (see Figure 12(i) left panel). In the normalised data (similar to what should be done in the search pipeline internally), the detection SNR increases to 6.0 (see Figure 12(i) right panel). There is also a clear burst in the dynamic spectrum (see Figure 10(i)) from the CRACO data.
$\eta\approx0.6$
is the response factor for a one time sample width pulse (e.g. Qiu et al., Reference Qiu, Keane, Bannister, James and Shannon2023). We used CASA to image the CRACO data to confirm the detection. We identified a transient detected with an SNR of 5.4 at the FRB position (see Figure 12(i) left panel). In the normalised data (similar to what should be done in the search pipeline internally), the detection SNR increases to 6.0 (see Figure 12(i) right panel). There is also a clear burst in the dynamic spectrum (see Figure 10(i)) from the CRACO data.
Measured and derived parameters for two FRBs in CRACO-PS. All values are based on the post-processing refined analysis.
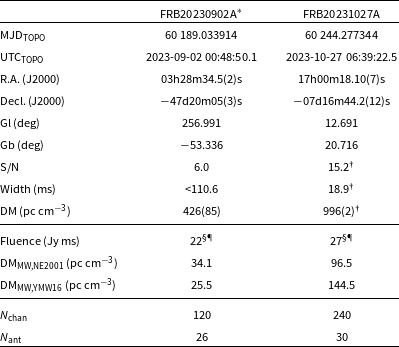
*More accurate values for FRB20230902A are reported in Shannon et al. (Reference Shannon, Bannister and Bera2024).
†Derived from CRAFT/ICS filterbank data.
§Both FRBs were detected with a width of one time sample in the CRACO system. We included the response factor $\eta\approx0.6$
reported in Qiu et al. (Reference Qiu, Keane, Bannister, James and Shannon2023) in the calculation.
$\eta\approx0.6$
reported in Qiu et al. (Reference Qiu, Keane, Bannister, James and Shannon2023) in the calculation.
¶Fluences were corrected for primary beam response.
Filterbank plots for FRBs detected in the CRACO pilot survey. For each burst, we show the dedispersed pulse profile for the burst (top), the dynamic spectrum for the dedispersed pulse (middle), and signal strength as a function of DM and time (bottom). The horizontal stripes correspond to the parts of the band that have been removed due to the presence of RFI.

Given its low SNR in the CRACO data, there was no detection of this FRB in the default search (with 21 out of the inner 23 antennas). We ran another search using all available antennas and found a $6\sigma$
candidate at the FRB time and position. The pipeline coordinate of the FRB was 03h28m34.30s,
$6\sigma$
candidate at the FRB time and position. The pipeline coordinate of the FRB was 03h28m34.30s, $-$
47d20m00.87s (J2000), which is 1.4 arcsec away from the CASA image coordinate and 8 arcsec away from the CELEBI pipeline position (with a phase calibration applied).
$-$
47d20m00.87s (J2000), which is 1.4 arcsec away from the CASA image coordinate and 8 arcsec away from the CELEBI pipeline position (with a phase calibration applied).
5.1.2 FRB 20231027A
FRB 20231027A was the first FRB detected initially by the CRACO pipeline. It was detected in a commensal observation with the VAST survey (SB54236 Beam 33) with an SNR of 9.7 (with 24 antennas available), a DM of 967 pc cm $^{-3}$
at the coordinate of 17h00m18.2s
$^{-3}$
at the coordinate of 17h00m18.2s $-$
07d16m37s (J2000). We show the detection images of FRB 20231027A in Figure 12(ii) and Figure 10(ii).
$-$
07d16m37s (J2000). We show the detection images of FRB 20231027A in Figure 12(ii) and Figure 10(ii).
VLT FORS/R-band (left) and HAWK- $K_s$
-band (right) imaging at the position of FRB 20231027A. Blue crosses and cyan labels denote PATH candidates with a posterior
$K_s$
-band (right) imaging at the position of FRB 20231027A. Blue crosses and cyan labels denote PATH candidates with a posterior $\gt0.01$
. The white ellipse in each image outlines the localisation region (1-
$\gt0.01$
. The white ellipse in each image outlines the localisation region (1- $\sigma$
uncertainty) of the FRB.
$\sigma$
uncertainty) of the FRB.
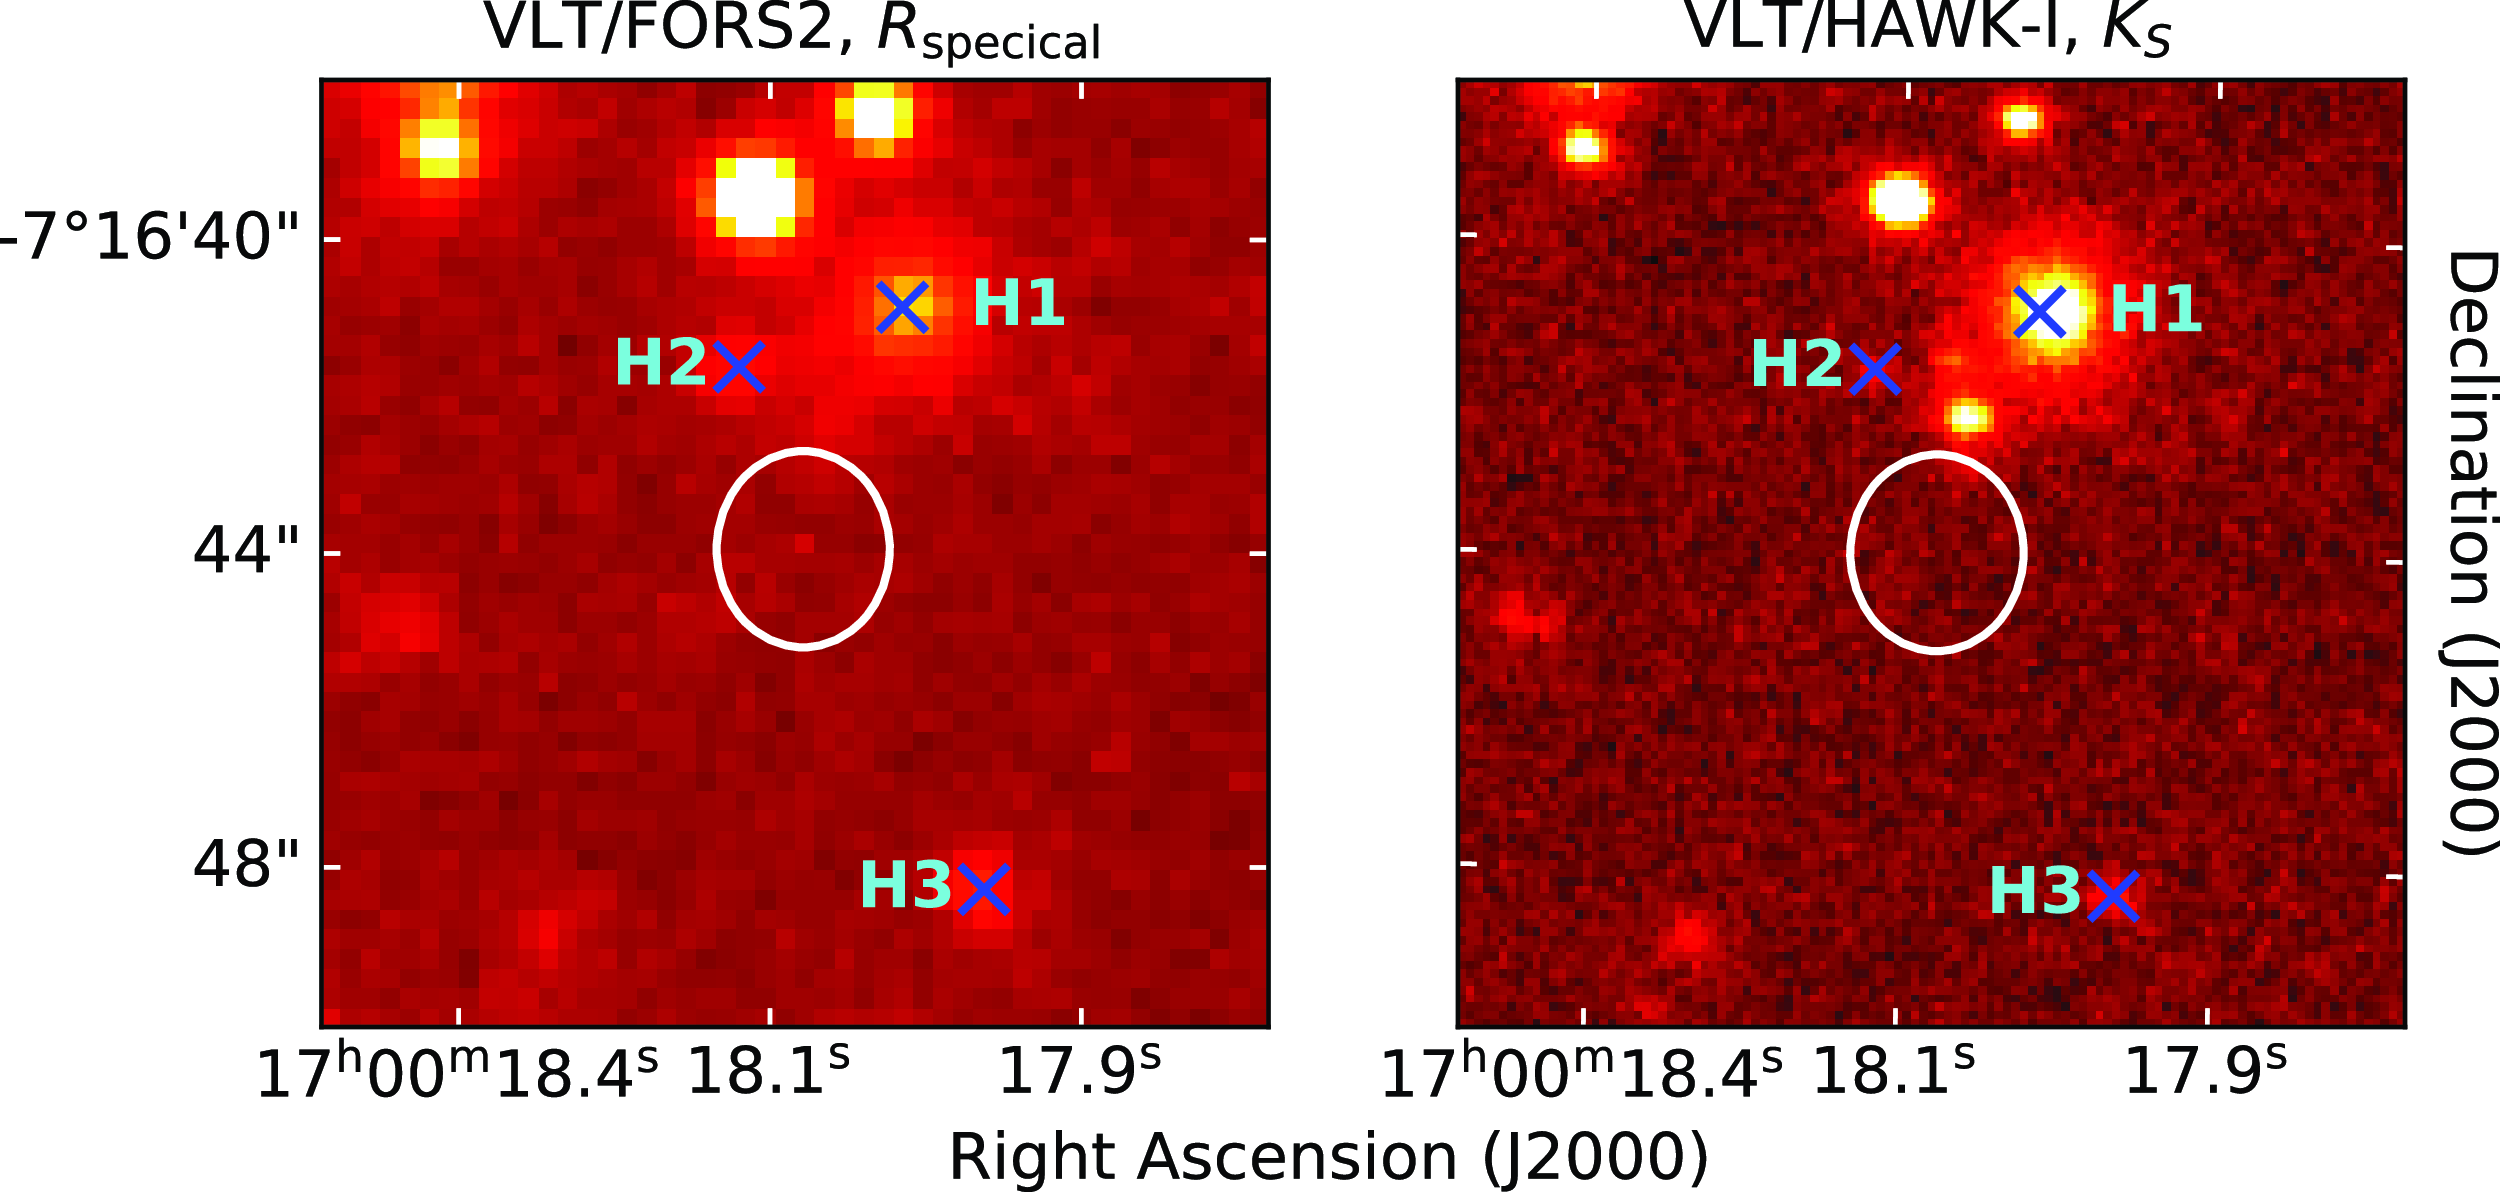
The CRAFT/ICS system was also operating at the time of the detection. Although FRB 20231027A was detected in the ICS data, the event did not trigger a voltage dump due to the width being too great Footnote k. However, we were still able to obtain 1 ms time resolution filterbank data from the ICS system, from which we measured a DM of 996 $\pm$
2 pc cm
$\pm$
2 pc cm $^{-3}$
and a pulse width of 18.9 ms.
$^{-3}$
and a pulse width of 18.9 ms.
We recorded the data with all 30 available antennas, 110-ms time resolution, and a 240 MHz bandwidth (from 744 to 984 MHz). FRB 20231027A was detected in both beam 32Footnote l and 33, with the FRB showing a higher SNR in beam 32 (12.8) compared to beam 33 (11.6). We therefore used the data from beam 32 for subsequent analysis. We used the post-processing scripts discussed in Section 4 and measured coordinates for FRB 20231027A of 17h00m18.10s $\pm$
0.07s
$\pm$
0.07s $-$
07d16m44.2s
$-$
07d16m44.2s $\pm$
1.2s (J2000).
$\pm$
1.2s (J2000).
There was no host galaxy detection in the Dark Energy Camera Legacy Survey (DR10; Dey et al., Reference Dey, Schlegel and Lang2019) towards the FRB position. Galactic extinction along this sightline is high ( $E(B-V)=0.44$
, according to the IRSA Dust ToolFootnote m). We conducted deeper imaging observations in the
$E(B-V)=0.44$
, according to the IRSA Dust ToolFootnote m). We conducted deeper imaging observations in the $R_\mathrm{special}$
filter on the FOcal Reducer and low dispersion Spectrograph (FORS2; Appenzeller et al., Reference Appenzeller, Fricke and Fürtig1998) and
$R_\mathrm{special}$
filter on the FOcal Reducer and low dispersion Spectrograph (FORS2; Appenzeller et al., Reference Appenzeller, Fricke and Fürtig1998) and $K_s$
on the High Acuity Wide field K-band Imager (HAWK-I; Pirard et al., Reference Pirard, Kissler-Patig and Moorwood2004) instruments on the VLT (Appenzeller & Rupprecht, Reference Appenzeller and Rupprecht1992). Using the R-band VLT image, we apply the Probabilistic Association of Transients to their Hosts (Aggarwal et al., Reference Aggarwal, Budavári and Deller2021) codeFootnote n to attempt a host association. We apply standard priors and configuration as described in (Shannon et al., Reference Shannon, Bannister and Bera2024), with the prior of the host being unseen set to 0.1. Three objects (see Figure 11) have significant posterior probabilities of hosting the FRB: J170018.02-071640.86 (Candidate H1), J170018.16-071641.62 (Candidate H2), and J170017.95-071648.28 (Candidate H3). Their posteriors are given in Table 6. The posterior for an unseen host is 0.03. A spectroscopic observation was also performed using X-shooter on the VLT (Vernet et al., Reference Vernet, Dekker and D’Odorico2011), finding a redshift for the Candidate H3, from the [Oii] doublet and H
$K_s$
on the High Acuity Wide field K-band Imager (HAWK-I; Pirard et al., Reference Pirard, Kissler-Patig and Moorwood2004) instruments on the VLT (Appenzeller & Rupprecht, Reference Appenzeller and Rupprecht1992). Using the R-band VLT image, we apply the Probabilistic Association of Transients to their Hosts (Aggarwal et al., Reference Aggarwal, Budavári and Deller2021) codeFootnote n to attempt a host association. We apply standard priors and configuration as described in (Shannon et al., Reference Shannon, Bannister and Bera2024), with the prior of the host being unseen set to 0.1. Three objects (see Figure 11) have significant posterior probabilities of hosting the FRB: J170018.02-071640.86 (Candidate H1), J170018.16-071641.62 (Candidate H2), and J170017.95-071648.28 (Candidate H3). Their posteriors are given in Table 6. The posterior for an unseen host is 0.03. A spectroscopic observation was also performed using X-shooter on the VLT (Vernet et al., Reference Vernet, Dekker and D’Odorico2011), finding a redshift for the Candidate H3, from the [Oii] doublet and H $\alpha$
line. Additionally, five extended sources in the field were observed with the Low-Resolution Imaging Spectrometer (LRIS; Oke et al., Reference Oke, Cohen and Carr1995) on Keck; as well as confirming the redshift of Candidate H3, redshifts were obtained for the objects Candidate H5 (H
$\alpha$
line. Additionally, five extended sources in the field were observed with the Low-Resolution Imaging Spectrometer (LRIS; Oke et al., Reference Oke, Cohen and Carr1995) on Keck; as well as confirming the redshift of Candidate H3, redshifts were obtained for the objects Candidate H5 (H $\alpha$
) and Candidate H4 ([Oii] and H
$\alpha$
) and Candidate H4 ([Oii] and H $\beta$
). These redshifts were obtained using Marz (Hinton et al., Reference Hinton, Davis, Lidman, Glazebrook and Lewis2016), and are tabulated in Table 6. No obvious features were found in the spectrum of Candidate H2, and due to difficulties with sky subtraction, a redshift has not yet been obtained for Candidate H1. Therefore, while the preferred host is Candidate H1, it is not a highly secure association at a posterior of 0.67, and we do not currently have a redshift for it.
$\beta$
). These redshifts were obtained using Marz (Hinton et al., Reference Hinton, Davis, Lidman, Glazebrook and Lewis2016), and are tabulated in Table 6. No obvious features were found in the spectrum of Candidate H2, and due to difficulties with sky subtraction, a redshift has not yet been obtained for Candidate H1. Therefore, while the preferred host is Candidate H1, it is not a highly secure association at a posterior of 0.67, and we do not currently have a redshift for it.
Host candidates of FRB 20231027A. Magnitudes are not corrected for Galactic extinction.
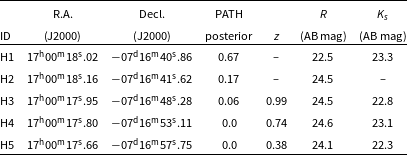
Interferometric images of FRBs detected in the CRACO Pilot Survey. The left panel displays the unnormalised images before (left) and at the time of (right) the FRB detection. The right panel presents the normalised (field source subtracted) images at the time of the FRB detection. All images are imaged with a single sample of data with an integration time of 110 ms. Field sources are marked with cyan solid circles, and FRB locations are indicated by yellow dashed circles. All data have been de-dispersed using the optimal DM value available.
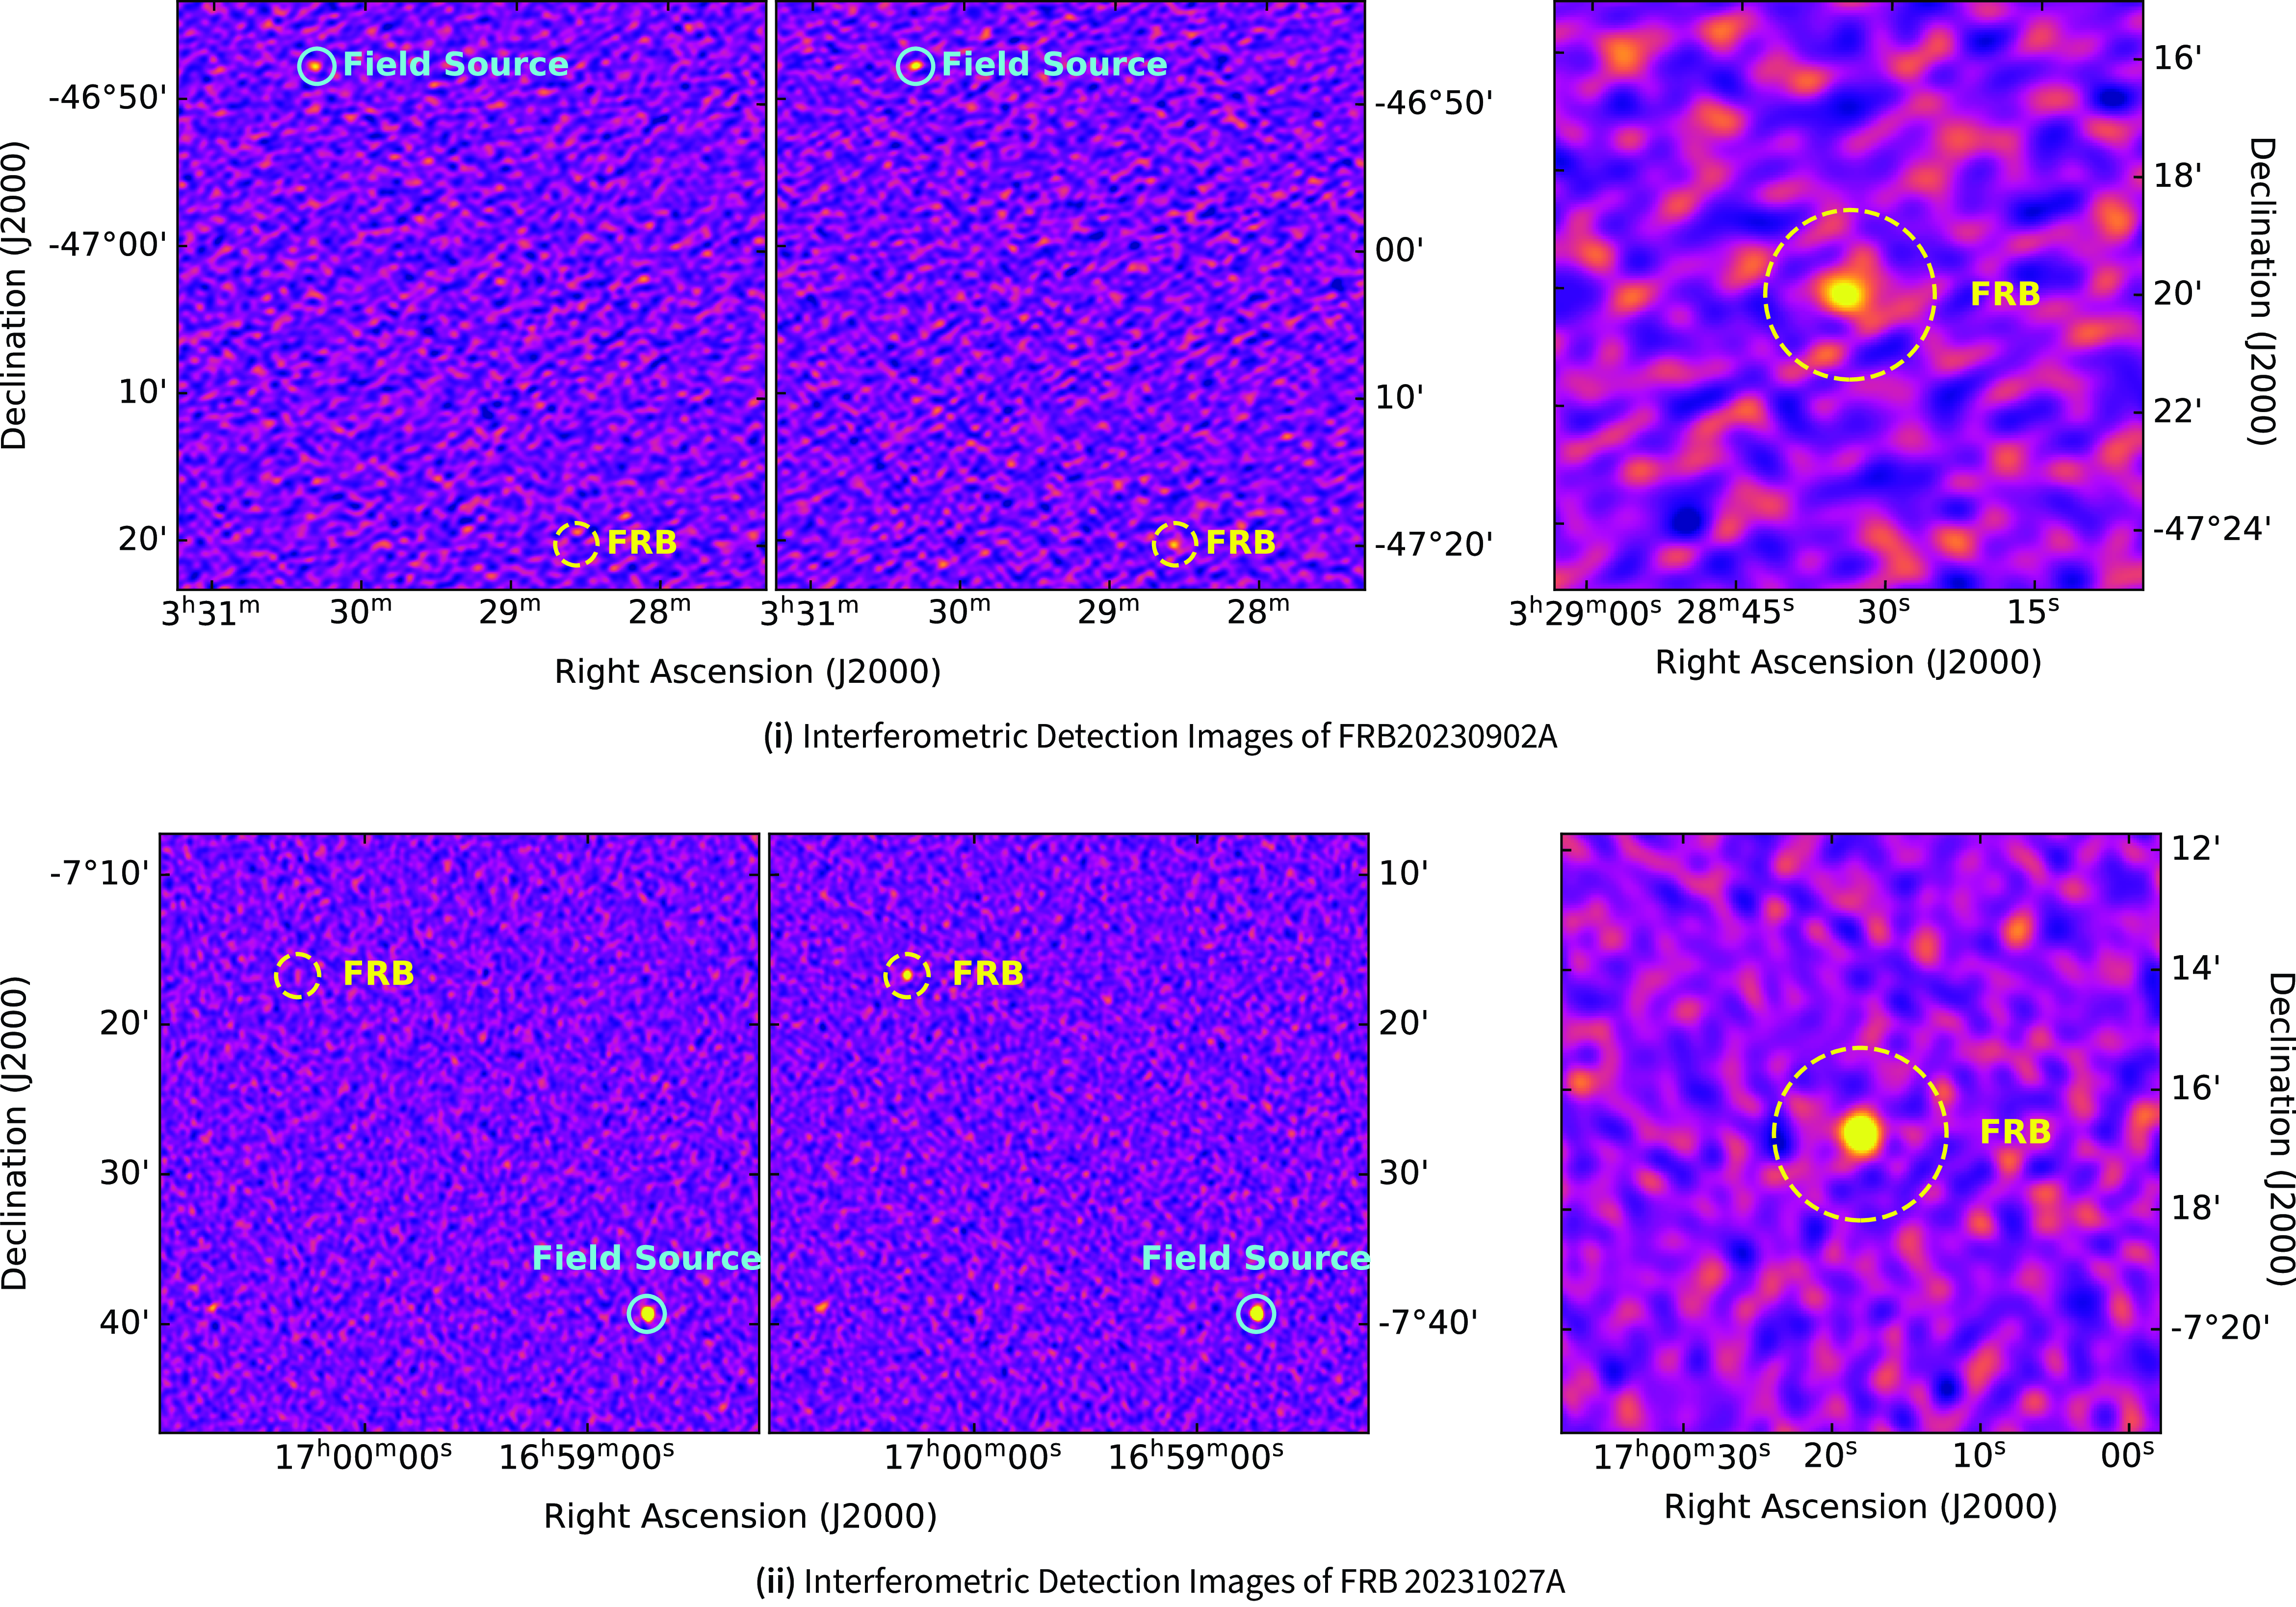
Examples of dynamic spectra for single pulse detections with CRACO from known Milky Way pulsars. PSR J0410–31 and PSR J2033+0042 are RRATs; PSR J1838–2330, PSR J1741–0840, and PSR J1840-0840 are nulling pulsars; XTE J1810–197 (PSR J1809–1943) is a bright radio magnetar. White regions in the dynamic spectra have been flagged out due to the presence of RFI or to missing packets during the recording.

The estimated redshift for FRB 20231027A using the Macquart relation is 0.86 (0.80), assuming contributions from the host galaxy of $100 (1+z)^{-1}$
pc cm
$100 (1+z)^{-1}$
pc cm $^{-3}$
, Milky Way (MW) halo of 50 pc cm
$^{-3}$
, Milky Way (MW) halo of 50 pc cm $^{-3}$
, and the MW interstellar medium (ISM) of 96.5 (144.5) pc cm
$^{-3}$
, and the MW interstellar medium (ISM) of 96.5 (144.5) pc cm $^{-3}$
. Given limiting image magnitudes of
$^{-3}$
. Given limiting image magnitudes of $m_R^\mathrm{lim}=25.8$
and
$m_R^\mathrm{lim}=25.8$
and $m_{K_s}^\mathrm{ lim}=23.5$
, the redshift–magnitude scaling for nine FRB host galaxies calculated by Marnoch et al. (Reference Marnoch, Ryder and James2023) suggests that six (five) of these galaxies would have been detected in the R-band (
$m_{K_s}^\mathrm{ lim}=23.5$
, the redshift–magnitude scaling for nine FRB host galaxies calculated by Marnoch et al. (Reference Marnoch, Ryder and James2023) suggests that six (five) of these galaxies would have been detected in the R-band ( $K_s$
-band) follow-up observations for the redshift range
$K_s$
-band) follow-up observations for the redshift range $0.80$
–
$0.80$
– $0.86$
. Therefore, the true host galaxy with a low luminosity may remain undetected at this redshift range.
$0.86$
. Therefore, the true host galaxy with a low luminosity may remain undetected at this redshift range.
5.2 Pulsars and RRATs
Single pulses from pulsars and RRATs can be detected as candidates through the pipeline. In our pilot survey, a total of 42 known pulsars/RRATs were detected (see Figure 13 for single pulse detections for selected pulsars, and Appendix B for the full list of pulsars).
Pulsars with relatively constant pulse amplitudes and periods comparable to or less than our time resolution of 110 ms do not appear as transient sources, and our pipeline is insensitive to them. All detected pulsars are with a relatively long spin period (longer than two time samples, that is, $P_0 \gt 220$
ms). All of the detected pulsars except PSR J0835
$P_0 \gt 220$
ms). All of the detected pulsars except PSR J0835 $-$
4510 (the Vela pulsar) and PSR J1047
$-$
4510 (the Vela pulsar) and PSR J1047 $-$
6709 have a spin period larger than 220 ms. The Vela pulsar has a spin period of 89.3 ms. The peak flux density for Vela was measured to be
$-$
6709 have a spin period larger than 220 ms. The Vela pulsar has a spin period of 89.3 ms. The peak flux density for Vela was measured to be $2.4\,$
Jy beam
$2.4\,$
Jy beam $^{-1}$
at 888 MHz (Hale et al., Reference Hale, McConnell and Thomson2021). Flux variation due to scintillation or intrinsic pulse-to-pulse flux changes can lead to candidate detections in our pipeline. PSR J1047
$^{-1}$
at 888 MHz (Hale et al., Reference Hale, McConnell and Thomson2021). Flux variation due to scintillation or intrinsic pulse-to-pulse flux changes can lead to candidate detections in our pipeline. PSR J1047 $-$
6709 has a spin period of 198.4 ms. This pulsar can have strong pulse to pulse flux variations and is especially known to emit giant pulses (Sun et al., Reference Sun, Yan and Wang2021). The sporadic single pulse detections in our data were consistent with those shown in Sun et al. (Reference Sun, Yan and Wang2021).
$-$
6709 has a spin period of 198.4 ms. This pulsar can have strong pulse to pulse flux variations and is especially known to emit giant pulses (Sun et al., Reference Sun, Yan and Wang2021). The sporadic single pulse detections in our data were consistent with those shown in Sun et al. (Reference Sun, Yan and Wang2021).
Among the 42 known pulsars/RRATs detected in CRACO-PS, we detected pulses from two RRATs (PSR J0410 $-$
31, PSR J2033+0042), several nulling pulsars (e.g. PSR J1738
$-$
31, PSR J2033+0042), several nulling pulsars (e.g. PSR J1738 $-$
2330, PSR J1741
$-$
2330, PSR J1741 $-$
0840, and PSR J1840
$-$
0840, and PSR J1840 $-$
0840), and one magnetar (XTE J1810
$-$
0840), and one magnetar (XTE J1810 $-$
197). Most of the pulsars we detected do not appear to be remarkable, so we will not discuss them in detail.
$-$
197). Most of the pulsars we detected do not appear to be remarkable, so we will not discuss them in detail.
5.2.1 Precise pulsar localisation
Precise pulsar localisation can be obtained via long-term timing observations with a single-dish radio telescope, which is hard for pulsars with extreme nulling behaviours. In contrast, interferometric data can be used to localise pulsars upon detection. With CRACO data, we can get better coordinates for previously poorly localised pulsars. In our pilot survey, we improved the localisation for four known pulsars/RRATs: PSR J0031 $-$
5726, PSR J0410
$-$
5726, PSR J0410 $-$
31, PSR J1738
$-$
31, PSR J1738 $-$
2330, and PSR J2228
$-$
2330, and PSR J2228 $-$
65 (see Table 7). We compared the DM and spin frequency derived from CRACO data to those in the literature to confirm the associations. Though the DM uncertainty reported by CRACO is large (the typical uncertainty in DM is
$-$
65 (see Table 7). We compared the DM and spin frequency derived from CRACO data to those in the literature to confirm the associations. Though the DM uncertainty reported by CRACO is large (the typical uncertainty in DM is $\sim$
35 pc cm
$\sim$
35 pc cm $^{-3}$
), the DM measurements for all four pulsars are consistent with those in the literature (see Table 9). We made filterbanks of the whole observation for them to measure their rotation frequency. As most pulses are not resolved at a 110-ms resolution, we therefore extracted pulse peak times as an approximation for times of arrival (ToAs). We then fitted the ToAs in pint (Luo et al., Reference Luo, Ransom and Demorest2021). We fit only for the rotation frequency
$^{-3}$
), the DM measurements for all four pulsars are consistent with those in the literature (see Table 9). We made filterbanks of the whole observation for them to measure their rotation frequency. As most pulses are not resolved at a 110-ms resolution, we therefore extracted pulse peak times as an approximation for times of arrival (ToAs). We then fitted the ToAs in pint (Luo et al., Reference Luo, Ransom and Demorest2021). We fit only for the rotation frequency $F_0$
and report the fitted value in Table 7.
$F_0$
and report the fitted value in Table 7.
5.2.2 Pulsar/RRATs discoveries
We discovered two new pulsars/RRATs in CRACO-PS, with their measured and derived parameters listed in Table 8.
Updated positions for the poorly localised pulsars detected in CRACO-PS. We also update the pulsar names based on their new positions, with previous names listed in parentheses. R.A. and Decl. columns are the coordinates derived from the post-processing images as discussed in Section 4. $F_0$
is the frequency derived from the CRACO pulse detections, and N
$F_0$
is the frequency derived from the CRACO pulse detections, and N $_\mathrm{ToA}$
indicates the number of ToAs used in the derivation. For comparison, the catalogued frequency is listed as F
$_\mathrm{ToA}$
indicates the number of ToAs used in the derivation. For comparison, the catalogued frequency is listed as F $_{0, \mathrm{cat}}$
(values are from ATNF pulsar catalogue (v 2.1.1, Manchester et al., Reference Manchester, Hobbs, Teoh and Hobbs2005) unless otherwise specified).
$_{0, \mathrm{cat}}$
(values are from ATNF pulsar catalogue (v 2.1.1, Manchester et al., Reference Manchester, Hobbs, Teoh and Hobbs2005) unless otherwise specified).
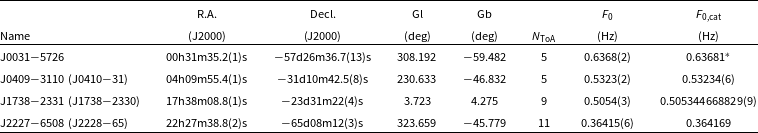
*The value was retrieved from https://mwatelescope.atlassian.net/wiki/spaces/MP/pages/24970773/SMART+survey+candidates
PSR J1319 $-$
4536/MTP0023 was first discovered in the MeerTRAP (More TRAnsients and Pulsars, Rajwade et al. Reference Rajwade, Stappers, Williams, Evans, Bryant and Motohara2020) survey using the MeerKAT telescope, and independently discovered in CRACO-PS later. It was rediscovered on 12 August 2023 during commensal observations with the EMU project (SB51948, Beam 28). The source was detected at R.A. 13h19m49.7s Decl. -45d36m13s with a SNR of 10.9 and a DM of 0 pc cm
$-$
4536/MTP0023 was first discovered in the MeerTRAP (More TRAnsients and Pulsars, Rajwade et al. Reference Rajwade, Stappers, Williams, Evans, Bryant and Motohara2020) survey using the MeerKAT telescope, and independently discovered in CRACO-PS later. It was rediscovered on 12 August 2023 during commensal observations with the EMU project (SB51948, Beam 28). The source was detected at R.A. 13h19m49.7s Decl. -45d36m13s with a SNR of 10.9 and a DM of 0 pc cm $^{-3}$
(i.e.
$^{-3}$
(i.e. $\lt 68.45$
pc cm
$\lt 68.45$
pc cm $^{-3}$
)Footnote o. We created the filterbank of PSR J1319
$^{-3}$
)Footnote o. We created the filterbank of PSR J1319 $-$
4536 with the full 10-h observation with all available antennas. We detected 20 single pulses with SNR larger than 8, and measured a frequency of 0.534500(2) Hz based on the ToAs using pint. Its coordinates, DM, and period are all consistent with the MeerTRAP discovery (J. D. Turner, private communication). A detailed analysis of PSR J1319
$-$
4536 with the full 10-h observation with all available antennas. We detected 20 single pulses with SNR larger than 8, and measured a frequency of 0.534500(2) Hz based on the ToAs using pint. Its coordinates, DM, and period are all consistent with the MeerTRAP discovery (J. D. Turner, private communication). A detailed analysis of PSR J1319 $-$
4536 will be given in J. D. Turner et al., (in prep.).
$-$
4536 will be given in J. D. Turner et al., (in prep.).
PSR J0755 $-$
7026 was discovered on 15 September 2023 during commensal observations with the EMU project (SB53201, Beam 09). The source was detected at R.A. 07h55m42.3s Decl.
$-$
7026 was discovered on 15 September 2023 during commensal observations with the EMU project (SB53201, Beam 09). The source was detected at R.A. 07h55m42.3s Decl. $-$
70d26m59.0s with a SNR of 12.8 at a DM of 41.9 pc cm
$-$
70d26m59.0s with a SNR of 12.8 at a DM of 41.9 pc cm $^{-3}$
with a boxcar width of 1. We got more precise coordinates for PSR J0755
$^{-3}$
with a boxcar width of 1. We got more precise coordinates for PSR J0755 $-$
7026 using the post-processing script and report these in Table 8. Besides the discovery pulse, there were another four weak single pulses over the 90-minute observations.
$-$
7026 using the post-processing script and report these in Table 8. Besides the discovery pulse, there were another four weak single pulses over the 90-minute observations.
Measured and derived parameters for two new pulsars discovered in CRACO-PS. We measured the coordinates for both pulsars with CRACO data after post-processing. All other information for J1319 $-$
4536 was derived from CRACO data, while that for J0755
$-$
4536 was derived from CRACO data, while that for J0755 $-$
7026 was derived from the Parkes/Murriyang observation.
$-$
7026 was derived from the Parkes/Murriyang observation.
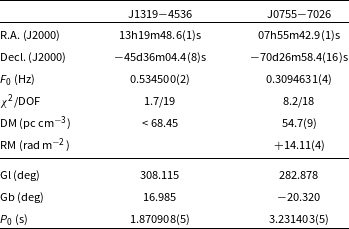
We conducted a follow-up observation of PSR J0755 $-$
7026 with the 64-m Parkes/Murriyang telescope, on 30 September 2023 (project code PX113) with the Ultra-Wideband Low receiver (Hobbs et al., Reference Hobbs, Manchester and Dunning2020) with full Stokes parameters along with a noise diode observation. We searched for single pulses using heimdall-fetch based multi-tiered sub-band search pipeline (Barsdell, Reference Barsdell2012; Kumar et al., Reference Kumar, Shannon and Flynn2021) with the DM searching up to 100 pc cm
$-$
7026 with the 64-m Parkes/Murriyang telescope, on 30 September 2023 (project code PX113) with the Ultra-Wideband Low receiver (Hobbs et al., Reference Hobbs, Manchester and Dunning2020) with full Stokes parameters along with a noise diode observation. We searched for single pulses using heimdall-fetch based multi-tiered sub-band search pipeline (Barsdell, Reference Barsdell2012; Kumar et al., Reference Kumar, Shannon and Flynn2021) with the DM searching up to 100 pc cm $^{-3}$
. We identified 20 single pulses in the 5-h observation. We generated the ToAs based on the heimdall-fetch search pipeline output and fitted the rotation frequency
$^{-3}$
. We identified 20 single pulses in the 5-h observation. We generated the ToAs based on the heimdall-fetch search pipeline output and fitted the rotation frequency $F_0$
using pint based on them. PSR J0755
$F_0$
using pint based on them. PSR J0755 $-$
7026 is a relatively slow spinning pulsar, with a spin period of 3.23 s
$-$
7026 is a relatively slow spinning pulsar, with a spin period of 3.23 s
Based on the brightest single pulse detected at MJD 60217.741325, we measured a DM of 54.7 pc cm $^{-3}$
using pdmp, which is consistent with the CRACO detection. We performed polarisation calibration using the 2-min observation of a linearly polarised noise diode obtained at the start of the observation. We used PKS B1934
$^{-3}$
using pdmp, which is consistent with the CRACO detection. We performed polarisation calibration using the 2-min observation of a linearly polarised noise diode obtained at the start of the observation. We used PKS B1934 $-$
638 as a flux density reference for the flux calibration. We used psrchive’s pac pulsar archive calibration programme to perform the calibration. We then used the rmfit tool of psrchive to fit for the RM. We found a strong detection with a RM of +14.11 rad m
$-$
638 as a flux density reference for the flux calibration. We used psrchive’s pac pulsar archive calibration programme to perform the calibration. We then used the rmfit tool of psrchive to fit for the RM. We found a strong detection with a RM of +14.11 rad m $^{-2}$
. We found that the pulse was highly polarised (see Figure 14 left plot), with a linear polarisation fraction of
$^{-2}$
. We found that the pulse was highly polarised (see Figure 14 left plot), with a linear polarisation fraction of $\sim$
65% and a circular polarisation fraction of
$\sim$
65% and a circular polarisation fraction of $\sim$
25%. We noted that there was a known pulsar, PSR J0750
$\sim$
25%. We noted that there was a known pulsar, PSR J0750 $-$
6846, with a similar DM (54.6 pc cm
$-$
6846, with a similar DM (54.6 pc cm $^{-3}$
),
$^{-3}$
), $\sim$
1.7 deg away from the detection position (Manchester et al., Reference Manchester, Hobbs, Teoh and Hobbs2005; Spiewak et al., Reference Spiewak, Flynn and Johnston2020). However, neither the RM nor the spin period of PSR J0755
$\sim$
1.7 deg away from the detection position (Manchester et al., Reference Manchester, Hobbs, Teoh and Hobbs2005; Spiewak et al., Reference Spiewak, Flynn and Johnston2020). However, neither the RM nor the spin period of PSR J0755 $-$
7026 is the same as that of PSR J0750
$-$
7026 is the same as that of PSR J0750 $-$
6846.
$-$
6846.
Examples of polarised pulse profiles of two types of single pulse from PSR J0755 $-$
7026 at 1.45 GHz after RM corrections. Left and right plots show the pulse profile for a single-peak pulse and a double-peak pulse, respectively. We show the total intensity, linear polarisation and circular polarisation in black, red, and blue lines, respectively. The top panels show the polarisation position angle (P.A.) variation for each pulse. The uncertainties of P.A. are plotted in 3
$-$
7026 at 1.45 GHz after RM corrections. Left and right plots show the pulse profile for a single-peak pulse and a double-peak pulse, respectively. We show the total intensity, linear polarisation and circular polarisation in black, red, and blue lines, respectively. The top panels show the polarisation position angle (P.A.) variation for each pulse. The uncertainties of P.A. are plotted in 3 $\sigma$
.
$\sigma$
.
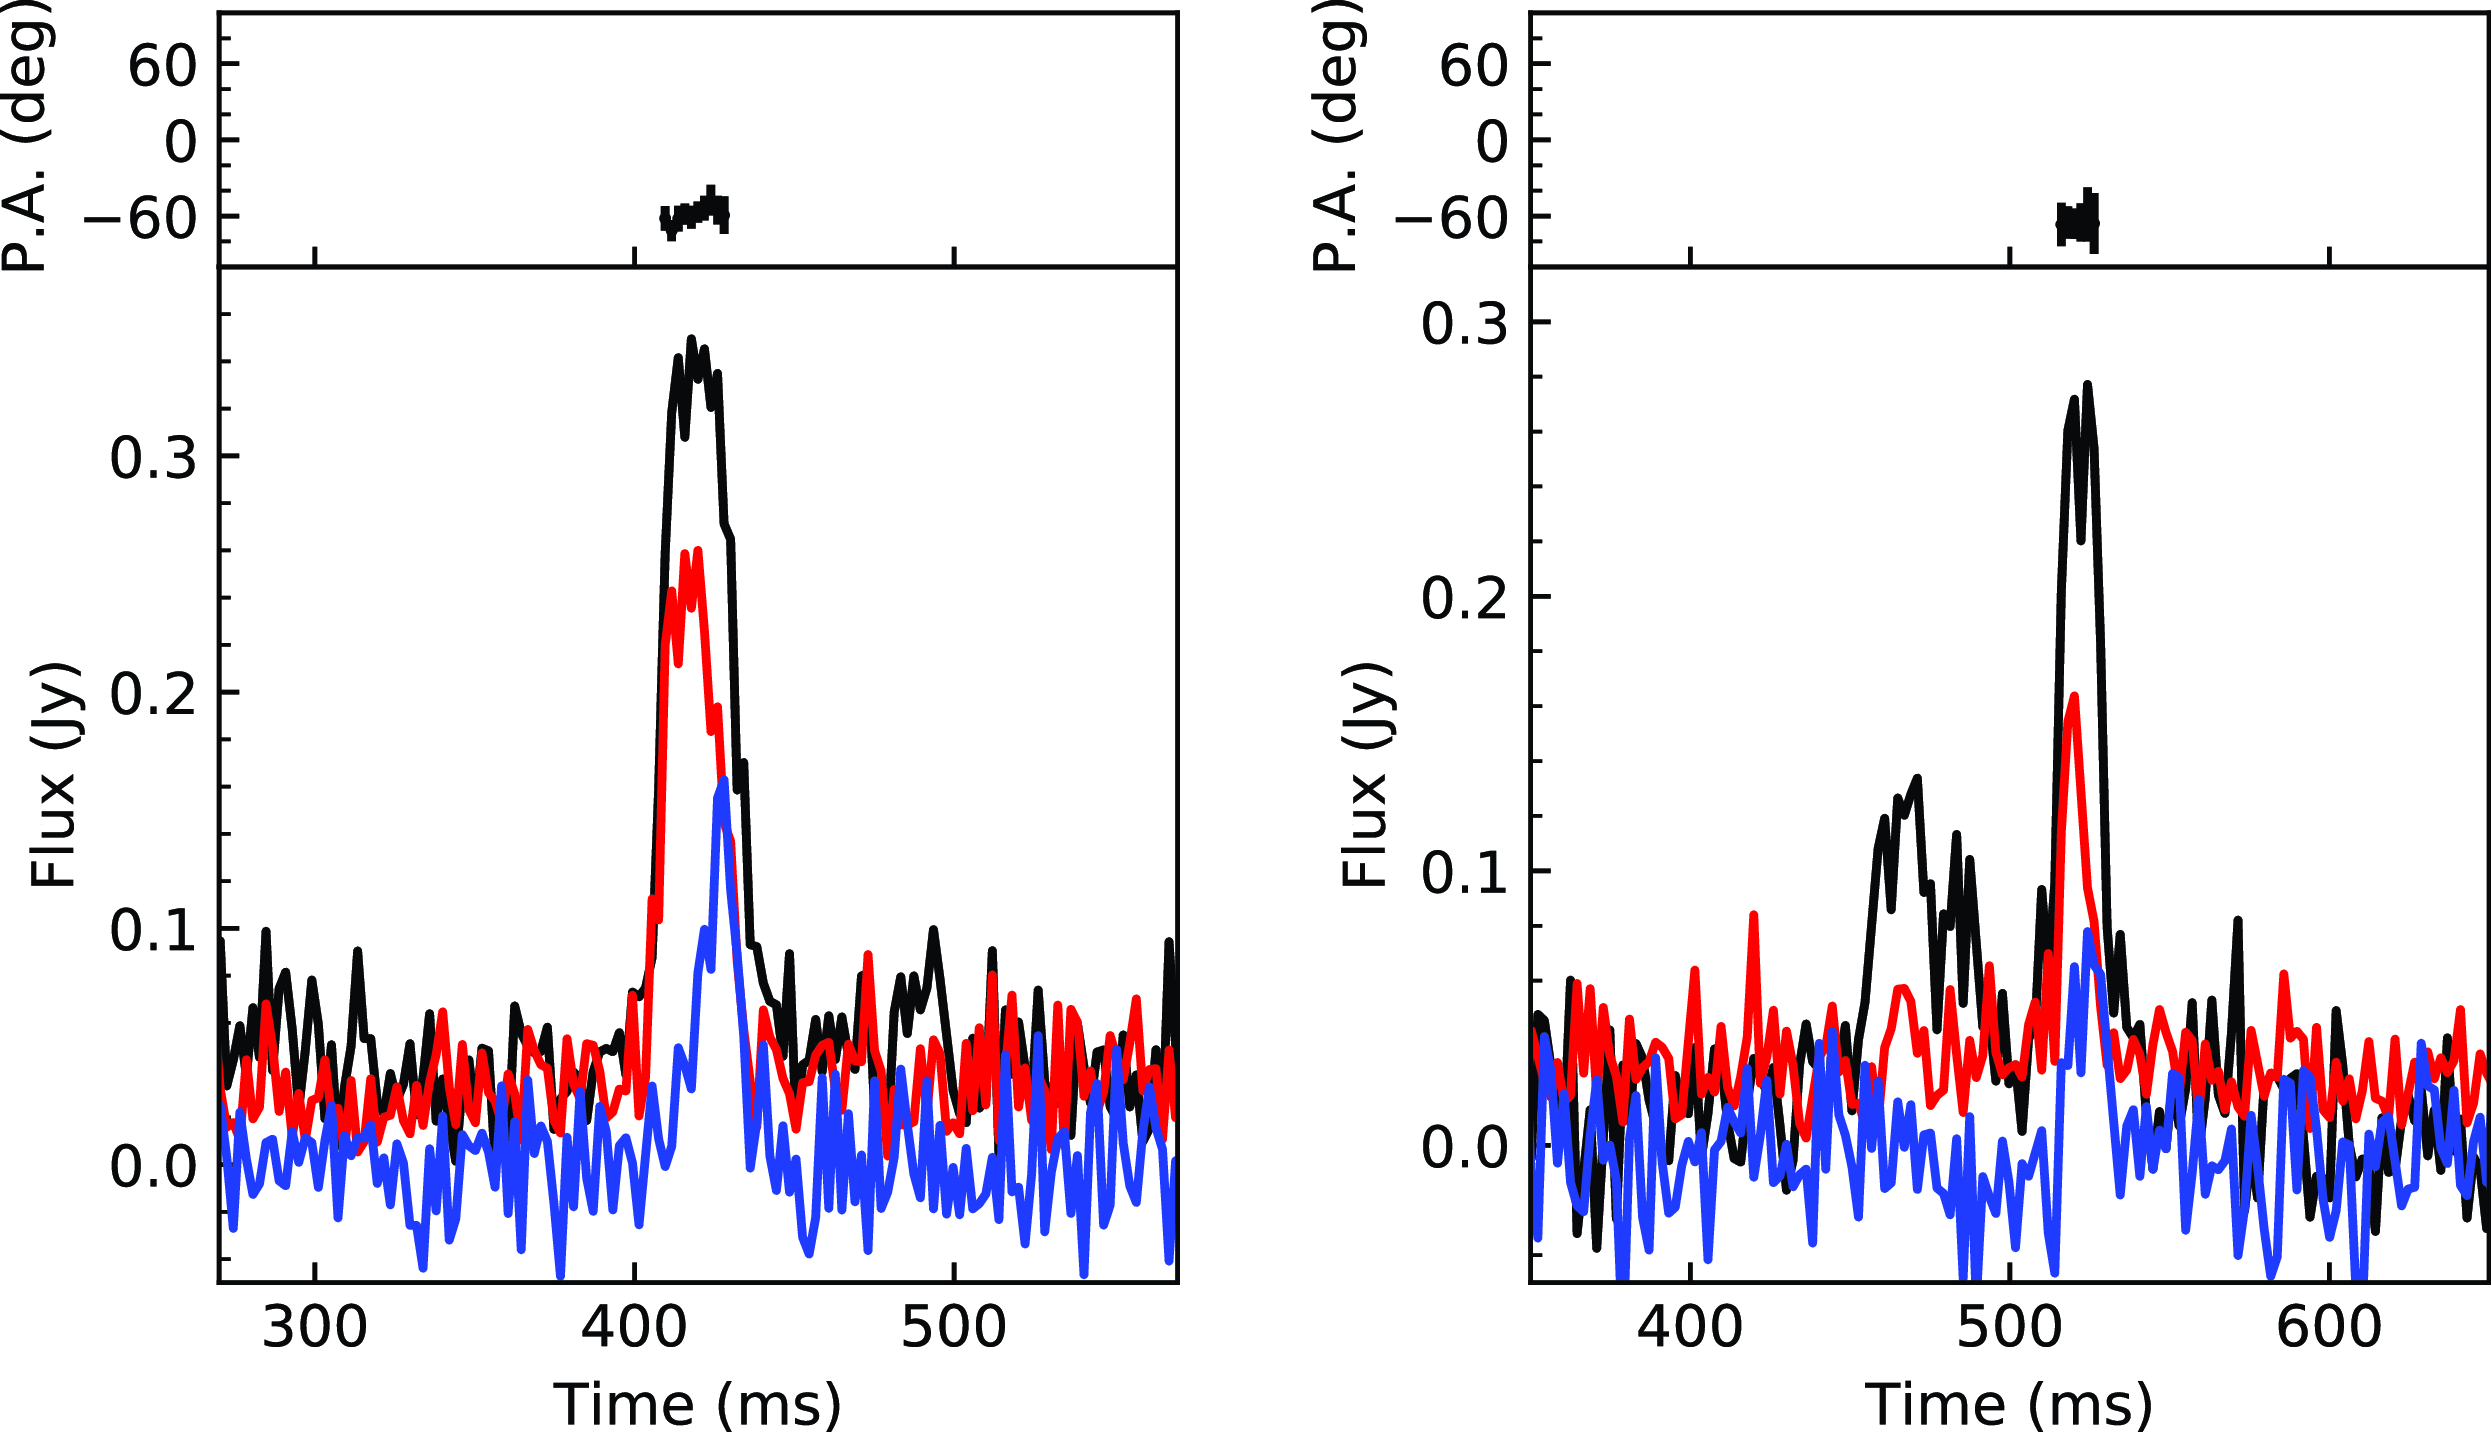
Similar to some other RRaTs (e.g. Zhang et al., Reference Zhang, Geng and Wang2023), single pulse properties of PSR J0755 $-$
7026 varied from pulse to pulse. While the emission for most pulses was confined to the lower frequency range (
$-$
7026 varied from pulse to pulse. While the emission for most pulses was confined to the lower frequency range ( $\lesssim$
2 GHz), several pulses have emission extending up to
$\lesssim$
2 GHz), several pulses have emission extending up to $\sim$
3 GHz. The pulse profiles also changed over time. We could classify all pulses into two categories based on their morphology: single-peak pulses and double-peak pulses (see Figure 14). The separations between two peaks are all around 50 ms for those double-peak pulses. A detailed analysis of PSR J0755
$\sim$
3 GHz. The pulse profiles also changed over time. We could classify all pulses into two categories based on their morphology: single-peak pulses and double-peak pulses (see Figure 14). The separations between two peaks are all around 50 ms for those double-peak pulses. A detailed analysis of PSR J0755 $-$
7026 will be presented in future work.
$-$
7026 will be presented in future work.
5.3 Ultra-long period objects
Hurley-Walker et al. (Reference Hurley-Walker, Zhang and Bahramian2022, Reference Hurley-Walker, Rea and McSweeney2023); Caleb et al. (Reference Caleb, Lenc and Kaplan2024); Dong et al. (Reference Dong, Clarke and Curtin2024) recently discovered four ultra-long period objects (ULPOs), whose nature has not been fully understood. Although their main pulses (with timescales of minutes) are too wide to be detected in the CRACO pipeline, the pipeline is still able to detect them through their millisecond-timescale sub-pulse structures. On 2023 April 28 (UT), we conducted a 3-h observation (SB49744) targeting one ULPO, GPM J1839 $-$
10. Pulses from GPM J1839
$-$
10. Pulses from GPM J1839 $-$
10 were detected in an untargeted search by the pipelineFootnote p (see Figure 15). The pipeline reported a DM of 172
$-$
10 were detected in an untargeted search by the pipelineFootnote p (see Figure 15). The pipeline reported a DM of 172 $\pm$
57 pc cm
$\pm$
57 pc cm $^{-3}$
, which is a bit off compared to its known DM of 273.5
$^{-3}$
, which is a bit off compared to its known DM of 273.5 $\pm$
2.5 pc cm
$\pm$
2.5 pc cm $^{-3}$
reported in (Hurley-Walker et al., Reference Hurley-Walker, Rea and McSweeney2023). This can be explained by the wide pulse profile, the low time resolution of the data, and a relatively narrow bandwidth (120 MHz).
$^{-3}$
reported in (Hurley-Walker et al., Reference Hurley-Walker, Rea and McSweeney2023). This can be explained by the wide pulse profile, the low time resolution of the data, and a relatively narrow bandwidth (120 MHz).
CRACO filterbank plot for GPM J1839 $-$
10. We show the pulse profile on the top and the dynamic spectrum for the pulse on the bottom. All data were dedispersed at DM=273.5 pc cm
$-$
10. We show the pulse profile on the top and the dynamic spectrum for the pulse on the bottom. All data were dedispersed at DM=273.5 pc cm $^{-3}$
.
$^{-3}$
.
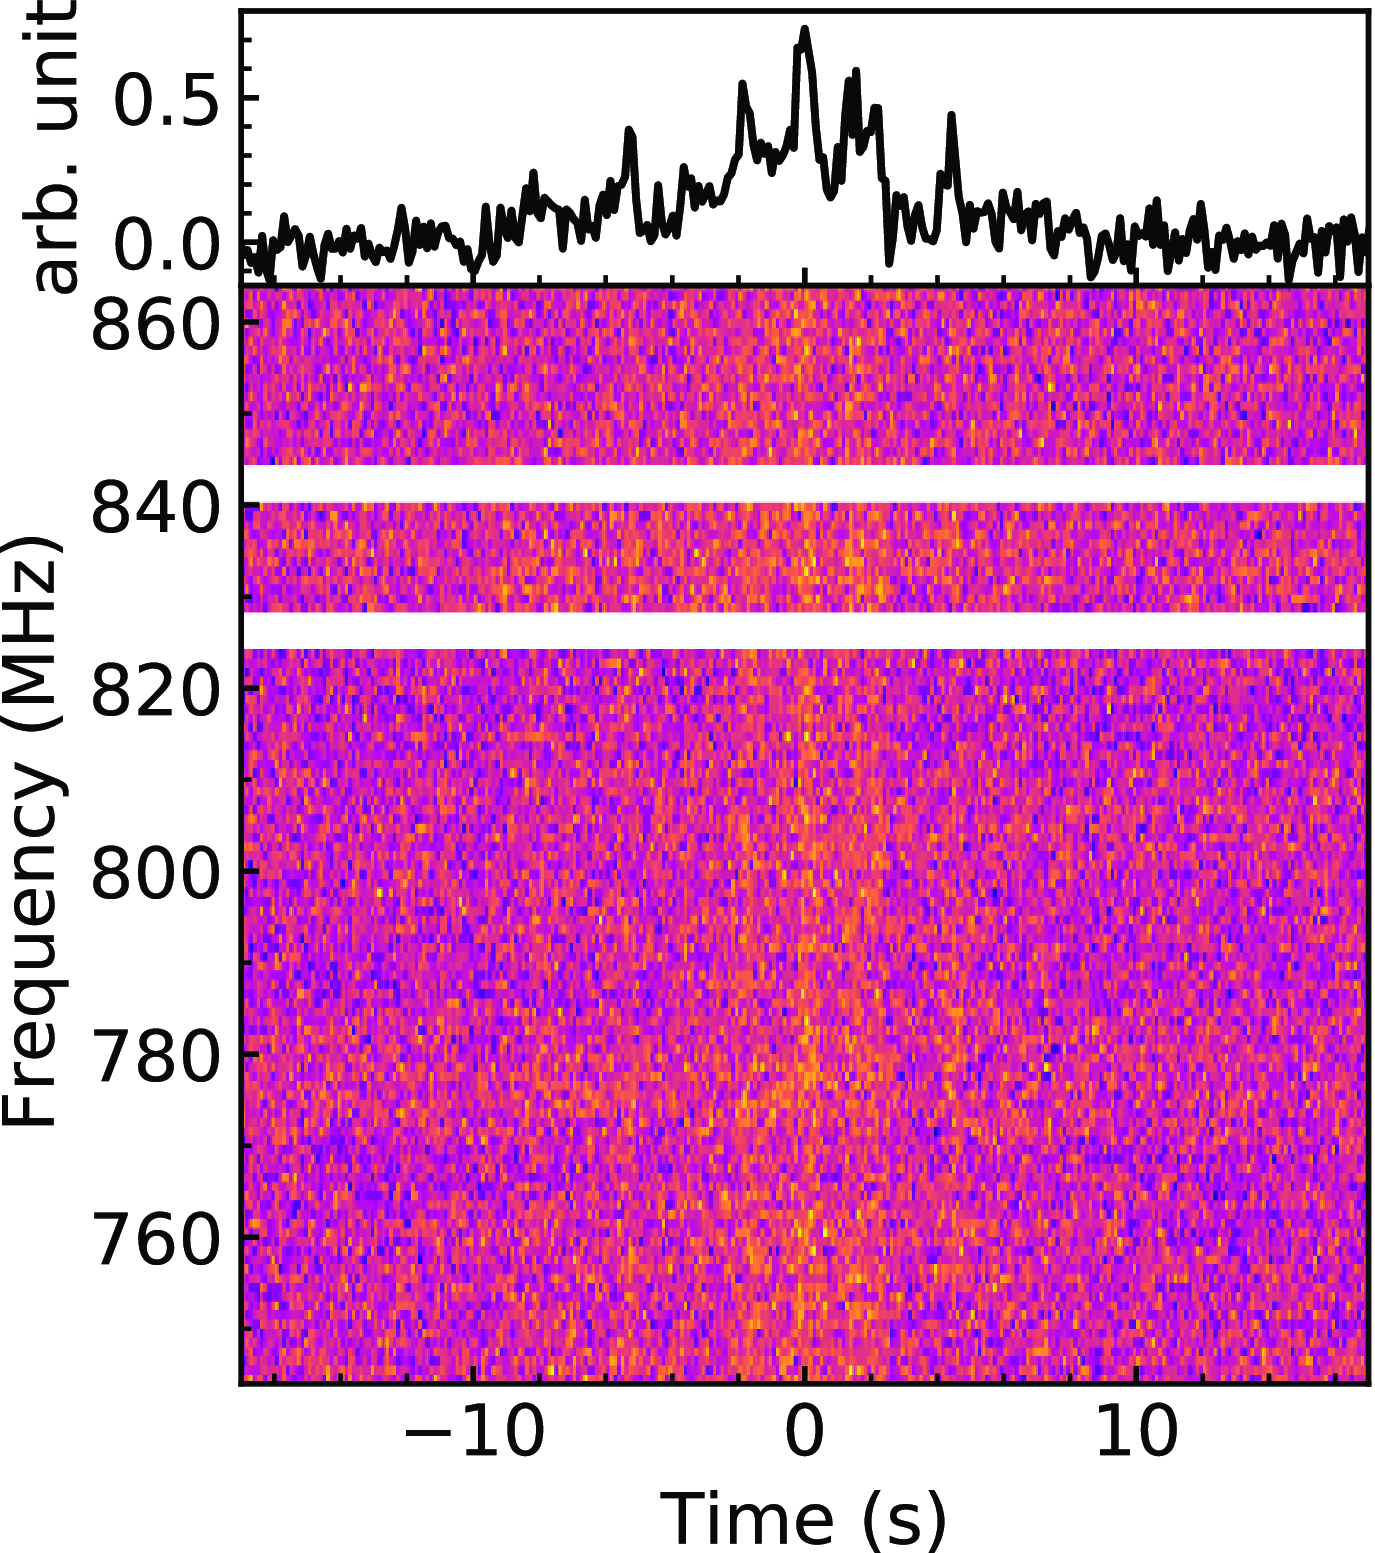
5.4 Scintillating continuum sources
At radio frequencies, any compact object (with an angular size $\lesssim 1\,$
mas at GHz frequencies) can exhibit flux variations due to the effect of interstellar scintillation (ISS) caused by the inhomogeneities in the ionised interstellar medium (ISM) of the Milky Way. The typical variation timescales range from minutes to months (e.g. Hunstead, Reference Hunstead1972; Walker, Reference Walker1998). For compact bright sources (e.g. radio-loud active galactic nuclei), the slow flux fluctuation caused by the ISS can be detected as candidates by the CRACO pipeline. Scintillation candidates usually show vertical stripes in their filterbanks. We show this for one of the scintillation candidates we detected as an example in Figure 16.
$\lesssim 1\,$
mas at GHz frequencies) can exhibit flux variations due to the effect of interstellar scintillation (ISS) caused by the inhomogeneities in the ionised interstellar medium (ISM) of the Milky Way. The typical variation timescales range from minutes to months (e.g. Hunstead, Reference Hunstead1972; Walker, Reference Walker1998). For compact bright sources (e.g. radio-loud active galactic nuclei), the slow flux fluctuation caused by the ISS can be detected as candidates by the CRACO pipeline. Scintillation candidates usually show vertical stripes in their filterbanks. We show this for one of the scintillation candidates we detected as an example in Figure 16.
Besides the inhomogeneities in the ISM, solar activity (e.g. solar wind and coronal mass ejection) can also cause electron density irregularities in the interplanetary medium (IPM). Similar to the effect of the ISM, compact objects can show amplitude scintillation at radio frequencies due to the interplanetary scintillation (IPS). Compared to ISS, IPS is expected to have a flux variation on a shorter timescale (i.e. $\sim$
seconds) and a larger modulation index (e.g. Morgan et al., Reference Morgan, Macquart and Ekers2018). We show the filterbank from an IPS candidate in Figure 16 in the right panel, where a more dramatic flux variation can be seen compared to the normal ISS shown in the left panel.
$\sim$
seconds) and a larger modulation index (e.g. Morgan et al., Reference Morgan, Macquart and Ekers2018). We show the filterbank from an IPS candidate in Figure 16 in the right panel, where a more dramatic flux variation can be seen compared to the normal ISS shown in the left panel.
In the pilot survey, we detected one scintillating continuum source in every five fields on average. Searching for scintillators is not the primary science goal for CRACO real time search, so as discussed already in Section 2, we classified all candidates that are spatially associated with a known RACS source brighter than 0.3 Jy as known sources. This criterion works for most observations except those close to the Sun (i.e. within $\sim30\,$
deg). In these observations, relatively faint continuum sources (
$\sim30\,$
deg). In these observations, relatively faint continuum sources ( $\sim$
50 mJy) could also show huge flux variations due to the IPS and lead to candidate detections in the CRACO pipeline. These candidates can be easily identified in the human inspection step.
$\sim$
50 mJy) could also show huge flux variations due to the IPS and lead to candidate detections in the CRACO pipeline. These candidates can be easily identified in the human inspection step.
Filterbanks of example CRACO candidates caused by scintillation effects. We show the candidate caused by normal interstellar scintillation on the left and by interplanetary scintillation on the right.

6. Discussion
6.1 Inferred FRB all-sky rates
We first estimated the flux densities of events in our survey based on a modified version of the interferometry sensitivity equation (Thompson et al., Reference Thompson, Moran and Swenson2017)
 \begin{equation} \overline{S}_\mathrm{peak}\left(\mathrm{S/N}, N, W_\mathrm{obs}\right) = \cfrac{\mathrm{S/N}}{\sqrt{N(N-1)}} \cfrac{\mathrm{SEFD}}{\sqrt{N_\mathrm{pol}\Delta\nu W_\mathrm{obs}}}\end{equation}
where $S_\mathrm{peak}$
is the peak flux density, N is the number of the antennas,
$S_\mathrm{peak}$
is the peak flux density, N is the number of the antennas, $W_\mathrm{obs}$
is the observed width,
$W_\mathrm{obs}$
is the observed width, $N_\mathrm{pol}$
is the number of polarisations summed, and
$N_\mathrm{pol}$
is the number of polarisations summed, and $\Delta\nu$
is the observing bandwidth. The observed width is given by
$\Delta\nu$
is the observing bandwidth. The observed width is given by $W_\mathrm{obs} = \sqrt{W^2 + W_\mathrm{disp}^2 + W_\mathrm{int}^2}$
, where W is the intrinsic pulse width,
$W_\mathrm{obs} = \sqrt{W^2 + W_\mathrm{disp}^2 + W_\mathrm{int}^2}$
, where W is the intrinsic pulse width, $W_\mathrm{disp}$
is the smearing time, and
$W_\mathrm{disp}$
is the smearing time, and $W_\mathrm{int}$
is the time resolution. In Table 5, we show the inferred fluence limits
$W_\mathrm{int}$
is the time resolution. In Table 5, we show the inferred fluence limits $\mathcal{F} = S_\mathrm{peak}W_\mathrm{obs} / \eta$
for the FRBs we detected, where we used the SEFD estimated in Section 3.1, and post-processing refined measured values S/N,
$\mathcal{F} = S_\mathrm{peak}W_\mathrm{obs} / \eta$
for the FRBs we detected, where we used the SEFD estimated in Section 3.1, and post-processing refined measured values S/N, $W_\mathrm{obs}$
to derive the fluence limits. The response factor
$W_\mathrm{obs}$
to derive the fluence limits. The response factor $\eta$
is a function of pulse width due to scalloping. The response factor for unresolved, or barely resolved pulses (i.e. those detected with only one or two time sample width) can be
$\eta$
is a function of pulse width due to scalloping. The response factor for unresolved, or barely resolved pulses (i.e. those detected with only one or two time sample width) can be $\sim60-70\%$
(e.g. Qiu et al., Reference Qiu, Keane, Bannister, James and Shannon2023)
$\sim60-70\%$
(e.g. Qiu et al., Reference Qiu, Keane, Bannister, James and Shannon2023)
Following Keane & Petroff (Reference Keane and Petroff2015), we estimated the CRACO-PS survey fluence completeness threshold $\mathcal{F}_c$
(see Figure 17). We derived the fluence completeness threshold for two phases with the parameters listed in Table 2, respectively. We assumed that pulse widths would be less than 880 ms, the widest pulse we can detect. During the search, we used data from the inner 23 antennas that were available. To be conservative, we used
$\mathcal{F}_c$
(see Figure 17). We derived the fluence completeness threshold for two phases with the parameters listed in Table 2, respectively. We assumed that pulse widths would be less than 880 ms, the widest pulse we can detect. During the search, we used data from the inner 23 antennas that were available. To be conservative, we used $N=20$
to calculate the fluence limits to account for the bad antennas during the observation. This corresponds to fluence completeness for bursts less than 880ms duration of 58.1 Jy ms and 32.9 Jy ms for the survey phase 1 and phase 2, respectively. For bursts at 110 ms duration and below, sensitivity is uniform, with a completeness threshold of 20.5 Jy ms and 11.6 Jy ms for the phase 1 and phase 2, resepctively.
$N=20$
to calculate the fluence limits to account for the bad antennas during the observation. This corresponds to fluence completeness for bursts less than 880ms duration of 58.1 Jy ms and 32.9 Jy ms for the survey phase 1 and phase 2, respectively. For bursts at 110 ms duration and below, sensitivity is uniform, with a completeness threshold of 20.5 Jy ms and 11.6 Jy ms for the phase 1 and phase 2, resepctively.
Peak flux density versus observed width for two phases of CRACO-PS. Solid grey lines represent lines of constant S/N and dashed black lines represent lines of constant fluence. The range of widths searched is enclosed by the dashed vertical lines. The lowest fluence limits of the survey are shown with blue dash-dotted lines. We highlight the search S/N threshold and the fluence completeness threshold curves with thick lines. The shaded region is the fluence incomplete region. We show the parameters of the two FRBs presented in this work as red stars.
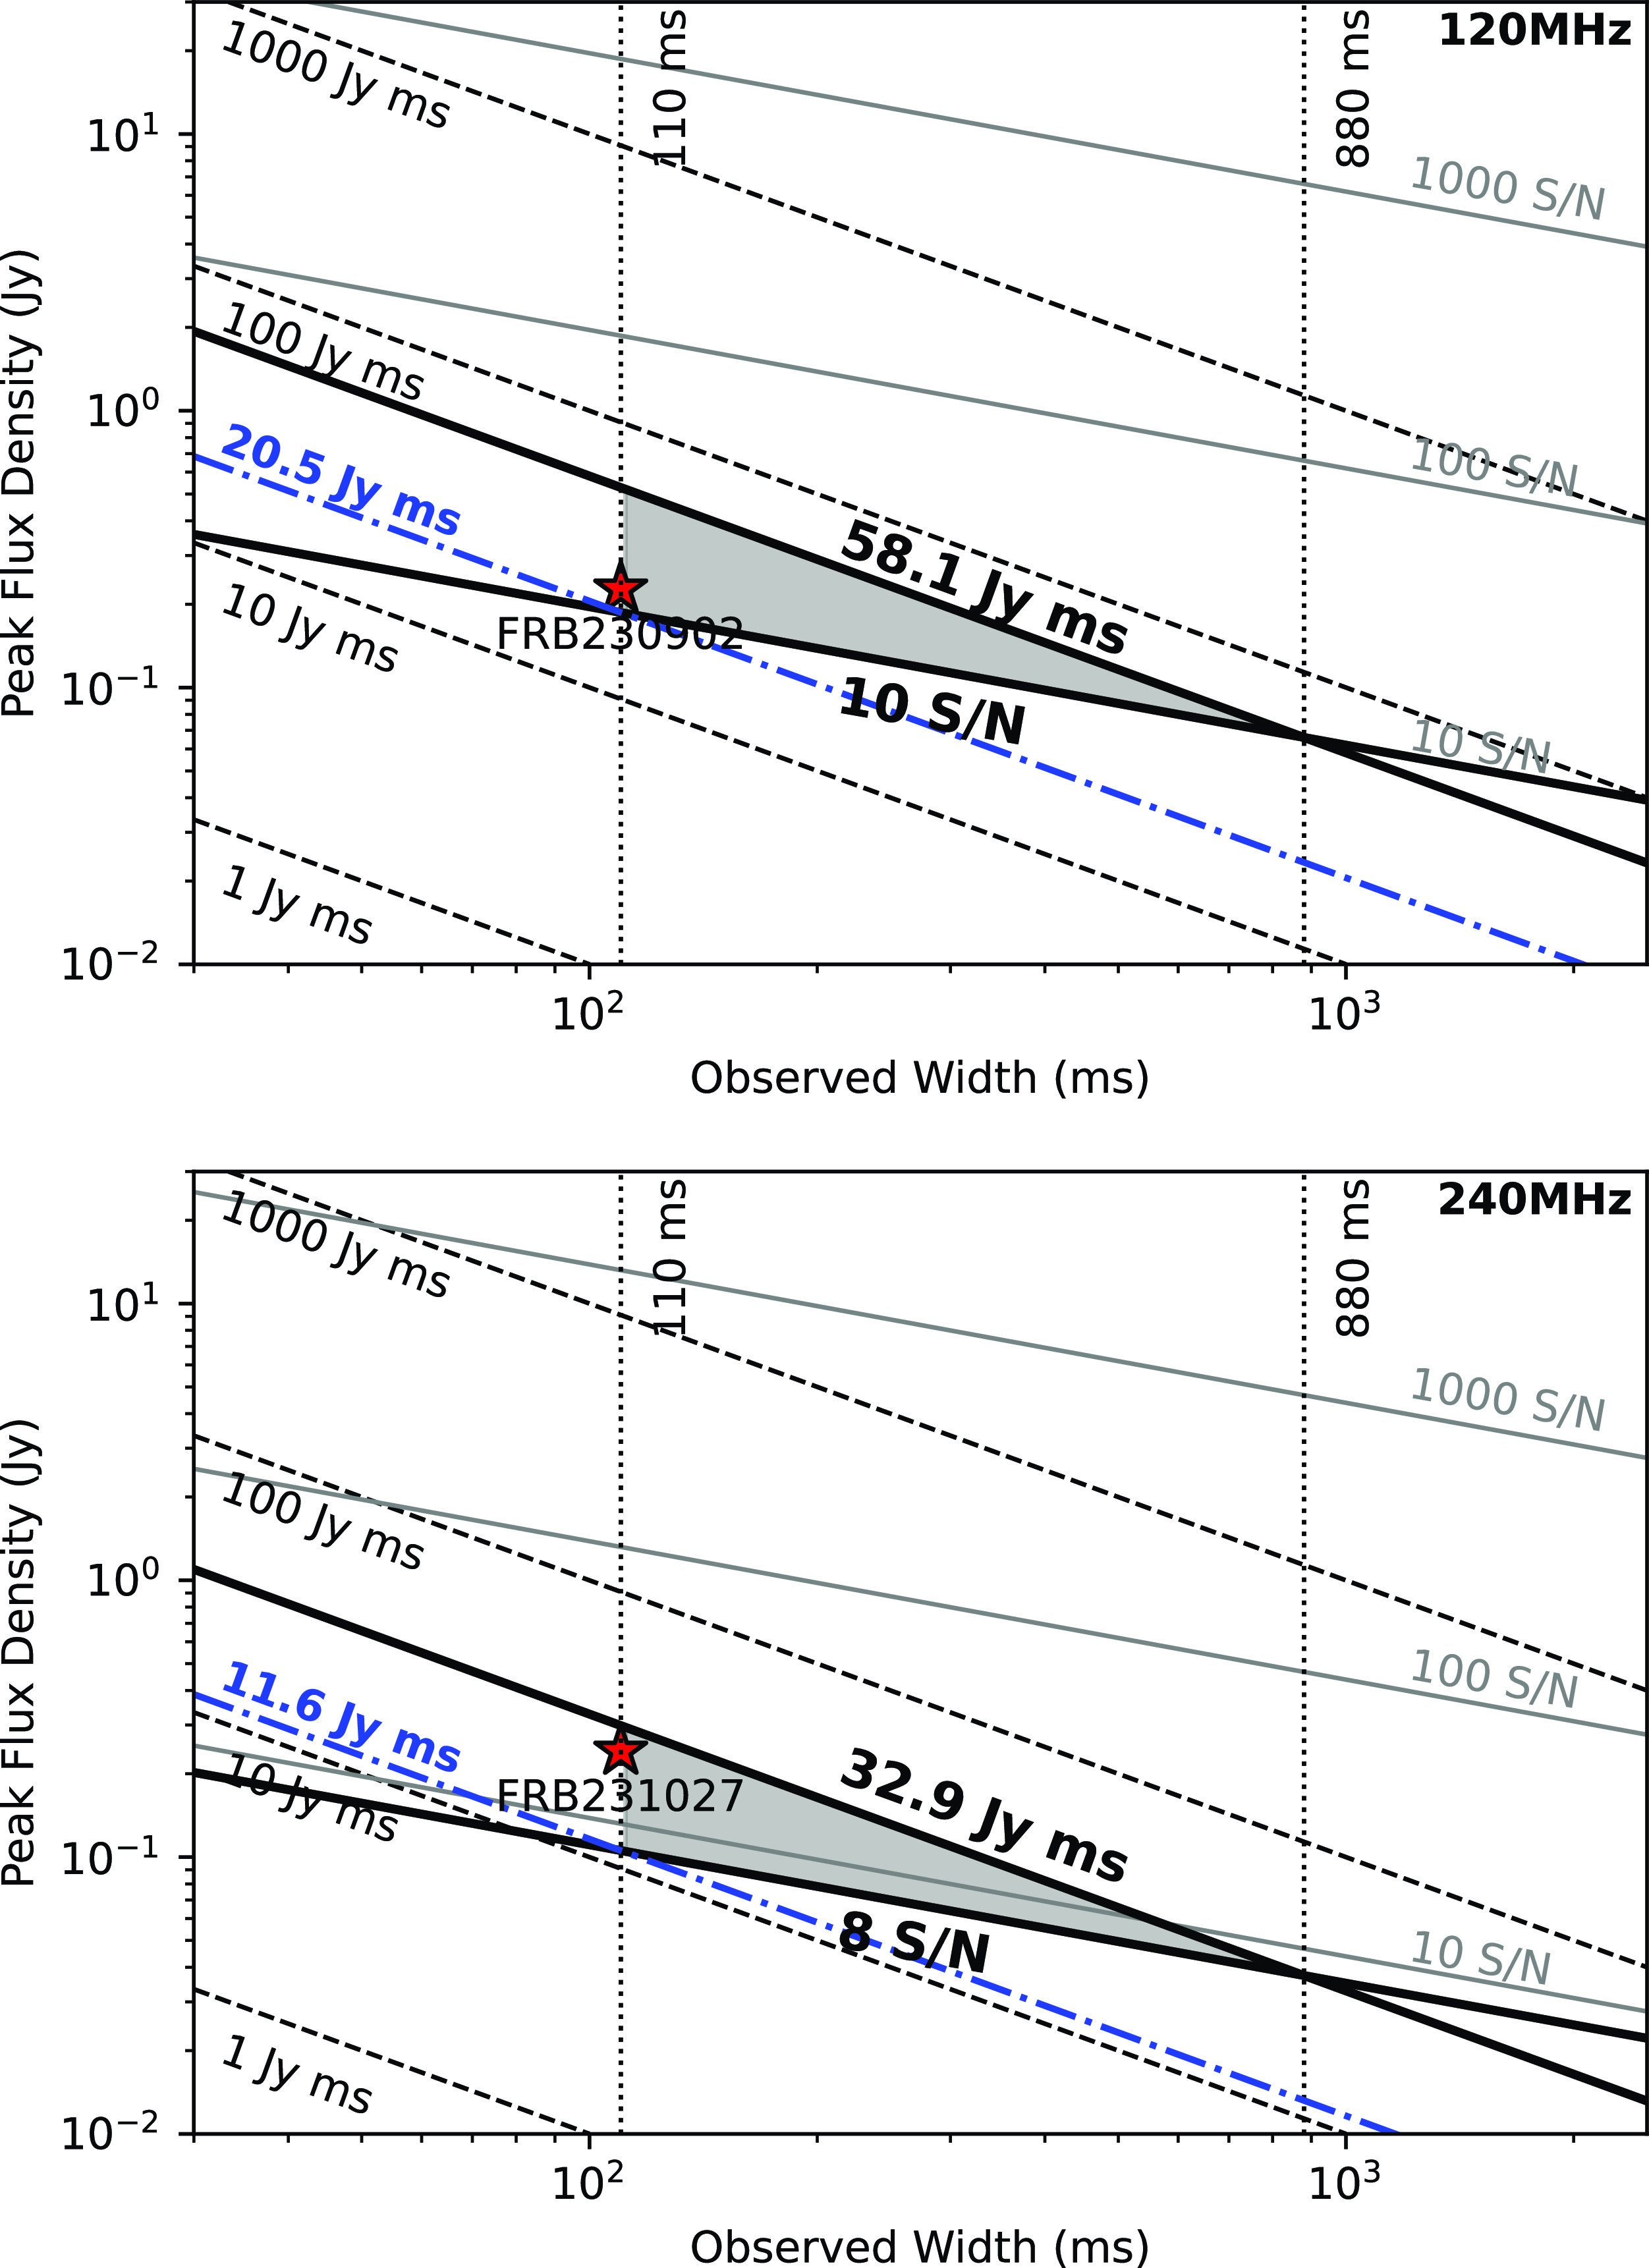
We calculated the inferred FRB all-sky rates ( $\mathcal{R}_\mathrm{FRB}$
) for phase 1 and phase 2 separately. During phase 1, the search volume is 4 688 deg
$\mathcal{R}_\mathrm{FRB}$
) for phase 1 and phase 2 separately. During phase 1, the search volume is 4 688 deg $^2$
hr and we detected no FRB. This corresponds to a rate upper limit of
$^2$
hr and we detected no FRB. This corresponds to a rate upper limit of
 \begin{align*}\mathcal{R}_\mathrm{FRB}\left(\mathcal{F} \gt 58.1\,\mathrm{Jy}\,\mathrm{ms}\right) \lt 6.32\times10^2\,\mathrm{events}\,\mathrm{ sky}^{-1}\,\mathrm{d}^{-1}\end{align*}
where we used a Poisson upper limit at the 95 per cent confidence level given a non-detection (Gehrels, Reference Gehrels1986). During phase 2, we detected one FRB with a search volume of 2 452 deg $^2$
hr. Based on this, we estimate a detectable event rate of
$^2$
hr. Based on this, we estimate a detectable event rate of
 \begin{align*}\mathcal{R}_\mathrm{FRB}\left(\mathcal{F} \gt 11.6\,\mathrm{Jy}\,\mathrm{ms}\right) = 4.03_{-3.82}^{+19.15}\times10^2\,\mathrm{ events}\,\mathrm{sky}^{-1}\,\mathrm{d}^{-1}\end{align*}
at a 95 per cent confidence level. We detected no FRB above the fluence completeness threshold, which gives us a rate upper limit of
 \begin{align*}\mathcal{R}_\mathrm{FRB}\left(\mathcal{F} \gt 32.9\,\mathrm{Jy}\,\mathrm{ms}\right) \lt 1.21\times10^3\,\mathrm{events}\,\mathrm{ sky}^{-1}\,\mathrm{d}^{-1}.\end{align*}
Other FRB detections are mostly sensitive to bursts at less than 110 ms duration. Hence, we calculate our rate estimate for the whole CRACO-PS based on our completeness thresholds of 20.5 Jy ms to bursts with a width of 110 ms and less. We use an assumed Euclidean distribution to scale down the effective survey area for phase 2 by a factor of $\left(\mathcal{F}_2/\mathcal{F}_1\right)^{3/2} \approx 0.42$
. This gives as a limit on the rate of FRBs of duration
$\left(\mathcal{F}_2/\mathcal{F}_1\right)^{3/2} \approx 0.42$
. This gives as a limit on the rate of FRBs of duration $\leq$
110 ms of
$\leq$
110 ms of
 \begin{equation} \mathcal{R}_\mathrm{FRB}\left(\mathcal{F} \gt 20.5\,\mathrm{Jy}\,\mathrm{ms}\right) = 1.72_{-1.64}^{+6.47}\times10^2\,\mathrm{events}\,\mathrm{sky}^{-1}\,\mathrm{d}^{-1}\end{equation}
, which is largely consistent with FRB survey rates in the literature (see Figure 18).
FRB all-sky rates as a function of fluence inferred from CRACO-PS and literature surveys (see references below). The black diamond denotes the upper limit of the rate inferred from CRACO-PS. Grey solid lines show the relation between rate and fluence threshold under the Euclidean distribution. We also show the expected fluence completeness threshold for further CRACO (data recorded at a time resolution of 13.8 ms and 1.7 ms) in grey dashed lines. Note that the inferred all-sky FRB rate for Crawford 2022 was re-estimated (see the discussion in the main text). References: Thornton 2013 (Thornton et al., Reference Thornton, Stappers and Bailes2013), Spitler 2014 (Spitler et al., Reference Spitler, Cordes and Hessels2014), Champion 2016 (Champion et al., Reference Champion, Petroff and Kramer2016), Rane 2016 (Rane et al., Reference Rane, Lorimer and Bates2016), Caleb 2017 (Caleb et al., Reference Caleb, Flynn and Bailes2017), Bhandari 2018 (Bhandari et al., Reference Bhandari, Keane and Barr2018), Shannon 2018 (Shannon et al., Reference Shannon, Macquart and Bannister2018), Farah 2019 (Farah et al., Reference Farah, Flynn and Bailes2019), Parent 2020 (Parent et al., Reference Parent, Chawla and Kaspi2020), CHIME 2021 (CHIME/FRB Collaboration et al., 2021), Niu 2021 (Niu et al., Reference Niu, Li and Luo2021), Crawford 2020 (Crawford et al., Reference Crawford, Hisano and Golden2022), and Jankowski 2023 (Jankowski et al., Reference Jankowski, Bezuidenhout and Caleb2023).

Only a small fraction ( $\lesssim2\%$
) of FRBs have been observed with a pulse width
$\lesssim2\%$
) of FRBs have been observed with a pulse width $\gtrsim$
100 ms (e.g. Petroff et al., Reference Petroff, Hessels and Lorimer2022). Hunting for these long FRBs can help us map the baryons in the Universe and better characterise the FRB population. Wide pulse widths can be caused by the propagation effects such as scattering (e.g. Pleunis et al., Reference Pleunis, Michilli and Bassa2021), or they could be intrinsic to the emission mechanism (e.g. CHIME/FRB Collaboration et al., 2022). Detections of highly scattered FRBs can help in measuring the physical properties of the scattering material and constraining the DM budget, which can be used to estimate the FRB redshifts (e.g. Ocker et al., Reference Ocker, Cordes and Chatterjee2022). The lack of long FRB detections is intriguing. It can be explained by the assumption that the intrinsically long FRBs only represent a small fraction of the entire population, but biases in previous surveys can also explain it. Most surveys were conducted at a time resolution of order
$\gtrsim$
100 ms (e.g. Petroff et al., Reference Petroff, Hessels and Lorimer2022). Hunting for these long FRBs can help us map the baryons in the Universe and better characterise the FRB population. Wide pulse widths can be caused by the propagation effects such as scattering (e.g. Pleunis et al., Reference Pleunis, Michilli and Bassa2021), or they could be intrinsic to the emission mechanism (e.g. CHIME/FRB Collaboration et al., 2022). Detections of highly scattered FRBs can help in measuring the physical properties of the scattering material and constraining the DM budget, which can be used to estimate the FRB redshifts (e.g. Ocker et al., Reference Ocker, Cordes and Chatterjee2022). The lack of long FRB detections is intriguing. It can be explained by the assumption that the intrinsically long FRBs only represent a small fraction of the entire population, but biases in previous surveys can also explain it. Most surveys were conducted at a time resolution of order $\sim 1\,$
ms (e.g. 0.983 ms for CHIME (CHIME/FRB Collaboration et al., 2018), 0.864 ms for ASKAP-CRAFT (Bannister et al., Reference Bannister, Deller and Phillips2019), and 0.306 ms for MeerKAT-MeerTRAP (Rajwade et al., Reference Rajwade, Bezuidenhout and Caleb2022)), and only searched for pulses with a width of a few dozen samples (i.e.
$\sim 1\,$
ms (e.g. 0.983 ms for CHIME (CHIME/FRB Collaboration et al., 2018), 0.864 ms for ASKAP-CRAFT (Bannister et al., Reference Bannister, Deller and Phillips2019), and 0.306 ms for MeerKAT-MeerTRAP (Rajwade et al., Reference Rajwade, Bezuidenhout and Caleb2022)), and only searched for pulses with a width of a few dozen samples (i.e. $\lesssim50\,$
ms), and therefore are insensitive to wide pulses. CHIME/FRB Collaboration et al. (2021) also conceded that a huge number of wide FRBs (especially those with a width beyond 100 ms, either intrinsic or highly scattered) could be missed by the current CHIME FRB detection pipeline based on sensitivity testing with injections.
$\lesssim50\,$
ms), and therefore are insensitive to wide pulses. CHIME/FRB Collaboration et al. (2021) also conceded that a huge number of wide FRBs (especially those with a width beyond 100 ms, either intrinsic or highly scattered) could be missed by the current CHIME FRB detection pipeline based on sensitivity testing with injections.
There have been a few attempts to search for long FRBs. For example, Fedorova & Rodin (Reference Fedorova and Rodin2019a,b) found 12 FRB candidates, all of which had a pulse width $\gtrsim300\,$
ms, at 111 MHz with the Large Phased Antenna of the Lebedev Physical Institute with the data recorded at 100 ms time resolution. However, it is difficult to confirm the astrophysical origin of these candidates due to the narrow bandwidth (2.5 MHz over 6 channels) and low SNR reported for the events. Crawford et al. (Reference Crawford, Hisano and Golden2022) found four FRB candidates in a search of the Parkes 70-cm pulsar survey archival data at a time resolution of 0.3 ms. They searched for pulsed signals with a boxcar width ranging from 1 to 512 samples (i.e.
$\gtrsim300\,$
ms, at 111 MHz with the Large Phased Antenna of the Lebedev Physical Institute with the data recorded at 100 ms time resolution. However, it is difficult to confirm the astrophysical origin of these candidates due to the narrow bandwidth (2.5 MHz over 6 channels) and low SNR reported for the events. Crawford et al. (Reference Crawford, Hisano and Golden2022) found four FRB candidates in a search of the Parkes 70-cm pulsar survey archival data at a time resolution of 0.3 ms. They searched for pulsed signals with a boxcar width ranging from 1 to 512 samples (i.e. $\sim150\,$
ms). All four candidates were detected with a pulse width exceeding
$\sim150\,$
ms). All four candidates were detected with a pulse width exceeding $\sim50\,$
ms. However, we consider three candidates to be marginal because of either RFI-like patterns or low SNR estimations. Based on this, we re-estimated the inferred all-sky FRB rate from this survey to be
$\sim50\,$
ms. However, we consider three candidates to be marginal because of either RFI-like patterns or low SNR estimations. Based on this, we re-estimated the inferred all-sky FRB rate from this survey to be $\mathcal{R}_\mathrm{ FRB}\left(\mathcal{F} \gt 35\,\mathrm{Jy}\,\mathrm{ms}\right) = 1.2^{+4.4}_{-1.1}\times10^3\,\mathrm{events}\,\mathrm{ sky}^{-1}\,\mathrm{d}^{-1}$
. The most promising one, FRB 19910730A, was detected with a pulse width of 113.4 ms. Crawford et al. (Reference Crawford, Hisano and Golden2022) argued that the wide pulse from FRB 910730 was unlikely to be caused by scattering and could be intrinsic. In Figure 18, we notice that the inferred FRB rate based on Crawford et al. (Reference Crawford, Hisano and Golden2022) is about an order of magnitude higher compared to other surveys (assuming a Euclidean distribution), which indicates that long FRBs may have a different origin to the short FRB population.
$\mathcal{R}_\mathrm{ FRB}\left(\mathcal{F} \gt 35\,\mathrm{Jy}\,\mathrm{ms}\right) = 1.2^{+4.4}_{-1.1}\times10^3\,\mathrm{events}\,\mathrm{ sky}^{-1}\,\mathrm{d}^{-1}$
. The most promising one, FRB 19910730A, was detected with a pulse width of 113.4 ms. Crawford et al. (Reference Crawford, Hisano and Golden2022) argued that the wide pulse from FRB 910730 was unlikely to be caused by scattering and could be intrinsic. In Figure 18, we notice that the inferred FRB rate based on Crawford et al. (Reference Crawford, Hisano and Golden2022) is about an order of magnitude higher compared to other surveys (assuming a Euclidean distribution), which indicates that long FRBs may have a different origin to the short FRB population.
It is important to realise however that FRB thresholds quoted at different FRB durations $t_\mathrm{FRB}$
must be treated with caution. For an experiment searching for FRBs, the fluence threshold up to a minimum time resolution
$t_\mathrm{FRB}$
must be treated with caution. For an experiment searching for FRBs, the fluence threshold up to a minimum time resolution $t_\mathrm{res}$
is constant with
$t_\mathrm{res}$
is constant with $t_\mathrm{FRB}$
; it then decreases as
$t_\mathrm{FRB}$
; it then decreases as $t_\mathrm{FRB}^{-0.5}$
up to a maximum search time window
$t_\mathrm{FRB}^{-0.5}$
up to a maximum search time window $t_\mathrm{max}$
and then decreases as
$t_\mathrm{max}$
and then decreases as $t_\mathrm{FRB}^{-1}$
above that. This makes the rate dependent on the FRB width distribution. This has been modelled by both James et al. (Reference James, Prochaska and Macquart2022a), who analyse the total (intrinsic plus scattered) width distribution of FRBs observed by ASKAP and Parkes; and by CHIME/FRB Collaboration et al. (2021), who separately model the intrinsic and scattered widths. Both use log-normal distributions, finding the mean and standard deviation (
$t_\mathrm{FRB}^{-1}$
above that. This makes the rate dependent on the FRB width distribution. This has been modelled by both James et al. (Reference James, Prochaska and Macquart2022a), who analyse the total (intrinsic plus scattered) width distribution of FRBs observed by ASKAP and Parkes; and by CHIME/FRB Collaboration et al. (2021), who separately model the intrinsic and scattered widths. Both use log-normal distributions, finding the mean and standard deviation ( $\mu_w$
,
$\mu_w$
, $\sigma_w$
) of
$\sigma_w$
) of $\log w\,[\mathrm{ms}]$
to be (1.7, 0.9) and (0.7, 1.72), respectively. Assuming the rate dependence of equation (6), we find that a CRACO-PS-like experiment searching for FRBs between 110 ms and 880 ms, with threshold
$\log w\,[\mathrm{ms}]$
to be (1.7, 0.9) and (0.7, 1.72), respectively. Assuming the rate dependence of equation (6), we find that a CRACO-PS-like experiment searching for FRBs between 110 ms and 880 ms, with threshold $\mathcal{F}_0$
at 110 ms, should detect 2.5 (1.5) times as many FRBs assuming
$\mathcal{F}_0$
at 110 ms, should detect 2.5 (1.5) times as many FRBs assuming $\mu_w$
,
$\mu_w$
, $\sigma_w$
=1.7, 0.9 (0.7, 1.72) as a CRAFT/ICS-like experiment with the same threshold
$\sigma_w$
=1.7, 0.9 (0.7, 1.72) as a CRAFT/ICS-like experiment with the same threshold $\mathcal{F}_0$
at
$\mathcal{F}_0$
at $t_\mathrm{ res}=1.182$
ms, searching up to
$t_\mathrm{ res}=1.182$
ms, searching up to $12 \times 1.182 = 14.184$
ms. This estimate ignores DM-smearing, which increases the observed width, and would further increase the rate of experiments with long integration times, relative to those short integration times. While our measured rate is significantly more than a factor of 1.5–2.5 above the trend from experiments search at ms scales evident from Figure 18, the large errors are still consistent with that rate.
$12 \times 1.182 = 14.184$
ms. This estimate ignores DM-smearing, which increases the observed width, and would further increase the rate of experiments with long integration times, relative to those short integration times. While our measured rate is significantly more than a factor of 1.5–2.5 above the trend from experiments search at ms scales evident from Figure 18, the large errors are still consistent with that rate.
To better understand the long FRBs and model the full FRB population, FRB surveys that are sensitive to pulse widths from a hundred milliseconds to seconds are needed. CRACO-PS can search for pulses lasting $\sim$
seconds. Compared to Fedorova & Rodin (Reference Fedorova and Rodin2019a) and Fedorova & Rodin (Reference Fedorova and Rodin2019b); Crawford et al. (Reference Crawford, Hisano and Golden2022), CRACO-PS has a much wider bandwidth (
$\sim$
seconds. Compared to Fedorova & Rodin (Reference Fedorova and Rodin2019a) and Fedorova & Rodin (Reference Fedorova and Rodin2019b); Crawford et al. (Reference Crawford, Hisano and Golden2022), CRACO-PS has a much wider bandwidth ( $\gt100\,$
MHz) and the capacity of recording visibility data, which enables us to rule out most non-astrophysical signals and localise the events. Although the FRB we detected in CRACO-PS was a short one (16 ms), we can still put a limit on the long FRB event rates (see discussions above). The rate is consistent with that inferred from Crawford et al. (Reference Crawford, Hisano and Golden2022) but not very constraining. Further similar surveys can be used in estimating a more robust all-sky long FRB event rate and therefore can be beneficial in modelling the full FRB population and understanding its progenitors.
$\gt100\,$
MHz) and the capacity of recording visibility data, which enables us to rule out most non-astrophysical signals and localise the events. Although the FRB we detected in CRACO-PS was a short one (16 ms), we can still put a limit on the long FRB event rates (see discussions above). The rate is consistent with that inferred from Crawford et al. (Reference Crawford, Hisano and Golden2022) but not very constraining. Further similar surveys can be used in estimating a more robust all-sky long FRB event rate and therefore can be beneficial in modelling the full FRB population and understanding its progenitors.
6.2 Long period pulsars and RRATs discoveries
Most pulsars have been discovered through periodicity searches on time series data. However, these searches are not sensitive to pulsars with exotic and extreme properties, such as high intermittency, and long periodicity. Many of the recently discovered RRATs and long period pulsars (i.e. with a spin period larger than 10 s) are first identified in single pulse searches (e.g. Keane et al., Reference Keane, Ludovici and Eatough2010; Karako-Argaman et al., Reference Karako-Argaman, Kaspi and Lynch2015; Deneva et al., Reference Deneva, Stovall and McLaughlin2016; Tan et al., Reference Tan, Bassa and Cooper2018; Caleb et al., Reference Caleb, Heywood and Rajwade2022). Though CRACO performed searches on synthesised images, it works equivalently as a single pulse searching machine on $256\times256$
coherent tied-array beams.
$256\times256$
coherent tied-array beams.
CRACO discovered two new RRATs during $\sim$
250 hrs of CRACO-PS observation. There are
$\sim$
250 hrs of CRACO-PS observation. There are $\sim$
400 RRATs discovered so far (see RRATalog
Footnote q) with
$\sim$
400 RRATs discovered so far (see RRATalog
Footnote q) with $\sim$
20 years of searching for RRATs since their discovery in 2005 (McLaughlin et al., Reference McLaughlin, Lyne and Lorimer2006). Other single pulse searches with wide field-of-view instruments have resulted in a large number of discoveries as well. For example, Good et al. (Reference Good, Andersen and Chawla2021) and Dong et al. (Reference Dong, Crowter and Meyers2023) detected 28 new pulsars (including 18 RRATs) with CHIME, and Bezuidenhout et al. (Reference Bezuidenhout, Barr and Caleb2022) detected 12 new Galactic transients (include 7 confirmed pulsars) with MeerKAT.
$\sim$
20 years of searching for RRATs since their discovery in 2005 (McLaughlin et al., Reference McLaughlin, Lyne and Lorimer2006). Other single pulse searches with wide field-of-view instruments have resulted in a large number of discoveries as well. For example, Good et al. (Reference Good, Andersen and Chawla2021) and Dong et al. (Reference Dong, Crowter and Meyers2023) detected 28 new pulsars (including 18 RRATs) with CHIME, and Bezuidenhout et al. (Reference Bezuidenhout, Barr and Caleb2022) detected 12 new Galactic transients (include 7 confirmed pulsars) with MeerKAT.
Compared to the normal pulsar surveys with single-dish telescopes, CRACO has a much wider instantaneous field of view (e.g. a factor of 50 compared to the Parkes MultiBeam Pulsar Survey), which is useful in finding previously missed pulsars. Most pulsar surveys only target regions that are believed to have more pulsars, for example, the low Galactic latitude region (i.e. $|b|\lesssim 5\,$
deg), globular clusters, and the Magellanic Clouds. There have been two all-sky pulsar surveys using single dish telescopes: the High Time Resolution Universe North (HTRU-N; Barr et al., Reference Barr, Champion and Kramer2013) survey with the Effelsberg 100-m Radio Telescope, and the High Time Resolution Universe South (HTRU-S; Keith et al., Reference Keith, Jameson and van Straten2010) survey with the Parkes/Murriyang 64-m telescope. These surveys were limited in the amount of time per pointing because of the huge number of pointings to cover the sky. There are 218 371 and 42 641 pointings for HTRU-N and HTRU-S, respectively. As a comparison, only 1 493 tiles are needed to cover the whole visible sky with ASKAP using the closepack36 footprint (e.g. Duchesne et al., Reference Duchesne, Thomson and Pritchard2023). For single-dish pulsar surveys, those with limited coverage can easily miss pulsars at high galactic latitude, and those with full sky coverage can miss pulsars with a significant nulling fraction (e.g. intermittent pulsars), and faint pulsars with only a few bright pulses. Single pulse searches with wide field-of-view instruments (e.g. CHIME, ASKAP, LOFAR, and MeerKAT) offer us opportunities to find previously missed pulsars, which can help us better understand the underlying pulsar population.
$|b|\lesssim 5\,$
deg), globular clusters, and the Magellanic Clouds. There have been two all-sky pulsar surveys using single dish telescopes: the High Time Resolution Universe North (HTRU-N; Barr et al., Reference Barr, Champion and Kramer2013) survey with the Effelsberg 100-m Radio Telescope, and the High Time Resolution Universe South (HTRU-S; Keith et al., Reference Keith, Jameson and van Straten2010) survey with the Parkes/Murriyang 64-m telescope. These surveys were limited in the amount of time per pointing because of the huge number of pointings to cover the sky. There are 218 371 and 42 641 pointings for HTRU-N and HTRU-S, respectively. As a comparison, only 1 493 tiles are needed to cover the whole visible sky with ASKAP using the closepack36 footprint (e.g. Duchesne et al., Reference Duchesne, Thomson and Pritchard2023). For single-dish pulsar surveys, those with limited coverage can easily miss pulsars at high galactic latitude, and those with full sky coverage can miss pulsars with a significant nulling fraction (e.g. intermittent pulsars), and faint pulsars with only a few bright pulses. Single pulse searches with wide field-of-view instruments (e.g. CHIME, ASKAP, LOFAR, and MeerKAT) offer us opportunities to find previously missed pulsars, which can help us better understand the underlying pulsar population.
We quantified the potential new detections following the same method described in Good et al. (Reference Good, Andersen and Chawla2021). We first used the pulsar population synthesis package PsrPopPy (Bates et al., Reference Bates, Lorimer, Rane and Swiggum2014) to simulate the pulsar population using the default parameters with 1038 pulsar detections in the Parkes Multi-Beam Pulsar Survey (PKMBS; Manchester et al., Reference Manchester, Lyne and Camilo2001). For a specific pulsar, we drew a series of single pulse luminosities from a lognormal distribution (e.g. Mickaliger et al., Reference Mickaliger, McEwen, McLaughlin and Lorimer2018),
 \begin{equation} p\left(L\right) = \cfrac{1}{L\sigma_L\sqrt{2\pi}}\exp\left(-\cfrac{1}{2}\cfrac{\left(\ln L - \mu_L\right)^2}{\sigma_L^2}\right)\end{equation}
where the mean luminosity $\mu_L$
is the value from the PsrPopPy simulation, and the scale parameter
$\mu_L$
is the value from the PsrPopPy simulation, and the scale parameter $\sigma_L$
is drawn from a normal distribution (e.g. Mickaliger et al., Reference Mickaliger, McEwen, McLaughlin and Lorimer2018),
$\sigma_L$
is drawn from a normal distribution (e.g. Mickaliger et al., Reference Mickaliger, McEwen, McLaughlin and Lorimer2018),
 \begin{equation} f\left(\sigma_L\right) = \cfrac{1}{\sigma_{\sigma_L}\sqrt{2\pi}}\exp\left(-\cfrac{1}{2}\cfrac{\left(\sigma_L - \mu_{\sigma_L}\right)^2}{\sigma_{\sigma_L}^2}\right).\end{equation}
We calibrated $\mu_{\sigma_L}$
and
$\mu_{\sigma_L}$
and $\sigma_{\sigma_L}$
with the PKMBS single-pulse detections from 278 sources (Mickaliger et al., Reference Mickaliger, McEwen, McLaughlin and Lorimer2018), and the result was consistent with Good et al. (Reference Good, Andersen and Chawla2021). The number of single pulses in the series was calculated as
$\sigma_{\sigma_L}$
with the PKMBS single-pulse detections from 278 sources (Mickaliger et al., Reference Mickaliger, McEwen, McLaughlin and Lorimer2018), and the result was consistent with Good et al. (Reference Good, Andersen and Chawla2021). The number of single pulses in the series was calculated as $N = T_\mathrm{obs}/P$
, where
$N = T_\mathrm{obs}/P$
, where $T_\mathrm{obs}$
is the observation duration for each pointing, and P is the pulsar period. We used
$T_\mathrm{obs}$
is the observation duration for each pointing, and P is the pulsar period. We used $T_\mathrm{obs}=30\,$
mins for PKMBS to calibrate, and
$T_\mathrm{obs}=30\,$
mins for PKMBS to calibrate, and $T_\mathrm{obs}=400\,$
mins for CRACO to estimate the expected detections in two yearsFootnote r. The sky temperature was retrieved from the global diffuse sky model described in de Oliveira-Costa et al. (Reference de Oliveira-Costa, Tegmark and Gaensler2008) using the PyGDSM packageFootnote s (Price, Reference Price2016). In the simulation, we estimated that we could detect single pulses from
$T_\mathrm{obs}=400\,$
mins for CRACO to estimate the expected detections in two yearsFootnote r. The sky temperature was retrieved from the global diffuse sky model described in de Oliveira-Costa et al. (Reference de Oliveira-Costa, Tegmark and Gaensler2008) using the PyGDSM packageFootnote s (Price, Reference Price2016). In the simulation, we estimated that we could detect single pulses from $\sim$
3 000–4 000 objects (including on the order of 2 500–3 000 known pulsars) in a two-year time span. We note that this number is a very rough estimation because of the limited knowledge of the single-pulse statistics and the underlying pulsar population, and the approximation on the ASKAP observing time, but it does show a huge potential of discovering more new pulsars with final CRACO in the next few years.
$\sim$
3 000–4 000 objects (including on the order of 2 500–3 000 known pulsars) in a two-year time span. We note that this number is a very rough estimation because of the limited knowledge of the single-pulse statistics and the underlying pulsar population, and the approximation on the ASKAP observing time, but it does show a huge potential of discovering more new pulsars with final CRACO in the next few years.
6.3 ULPO discoveries
Ultra-long period objects (ULPOs) are radio transients detected with a period significantly longer than that of the known pulsar population. There have only been six ULPOs discovered so far: GLEAMX J162759.5–523504.3 with a $\sim$
18 minute period (Hurley-Walker et al., Reference Hurley-Walker, Zhang and Bahramian2022); GPM J1839
$\sim$
18 minute period (Hurley-Walker et al., Reference Hurley-Walker, Zhang and Bahramian2022); GPM J1839 $-$
10 with period of
$-$
10 with period of $\sim$
21 min (Hurley-Walker et al., Reference Hurley-Walker, Rea and McSweeney2023); ASKAP J1935
$\sim$
21 min (Hurley-Walker et al., Reference Hurley-Walker, Rea and McSweeney2023); ASKAP J1935 $+$
2148 with a
$+$
2148 with a $\sim$
54 minute period (Caleb et al., Reference Caleb, Lenc and Kaplan2024); CHIME 0630+25 with a
$\sim$
54 minute period (Caleb et al., Reference Caleb, Lenc and Kaplan2024); CHIME 0630+25 with a $\sim$
7-minute period (Dong et al., Reference Dong, Clarke and Curtin2024); ILT J1101+5521 with a
$\sim$
7-minute period (Dong et al., Reference Dong, Clarke and Curtin2024); ILT J1101+5521 with a $\sim$
126-minute period (de Ruiter et al., Reference de Ruiter, Rajwade and Bassa2024); and GLEAM-X J0704
$\sim$
126-minute period (de Ruiter et al., Reference de Ruiter, Rajwade and Bassa2024); and GLEAM-X J0704 $-$
37 with a
$-$
37 with a $\sim$
2.9-h period (Hurley-Walker et al., Reference Hurley-Walker, McSweeney and Bahramian2024). All of them were discovered through general image domain transient searches. Both GLEAMX J162759.5–523504.3 and GPM J1839
$\sim$
2.9-h period (Hurley-Walker et al., Reference Hurley-Walker, McSweeney and Bahramian2024). All of them were discovered through general image domain transient searches. Both GLEAMX J162759.5–523504.3 and GPM J1839 $-$
10 show millisecond to second timescale sub-pulse structures (Hurley-Walker et al., Reference Hurley-Walker, Zhang and Bahramian2022, Reference Hurley-Walker, Rea and McSweeney2023) which could be detectable by single-pulse searches, and indeed the blind detection of sub-pulse structures within GPM J1839
$-$
10 show millisecond to second timescale sub-pulse structures (Hurley-Walker et al., Reference Hurley-Walker, Zhang and Bahramian2022, Reference Hurley-Walker, Rea and McSweeney2023) which could be detectable by single-pulse searches, and indeed the blind detection of sub-pulse structures within GPM J1839 $-$
10 showed the capability of finding ULPOs with CRACO.
$-$
10 showed the capability of finding ULPOs with CRACO.
The nature of ULPOs is still not clear, and several possible models have been suggested, including magnetars (Beniamini et al., Reference Beniamini, Wadiasingh and Hare2023; Cooper &Wadiasingh, Reference Cooper and Wadiasingh2024), binary neutron star systems (Turolla et al., Reference Turolla, Possenti and Treves2005), and white dwarf pulsars (Zhang & Gil, Reference Zhang and Gil2005; Katz, Reference Katz2022; Qu & Zhang, Reference Qu and Zhang2024). The ULPOs may in fact span multiple object classes. Discoveries of more of these systems are vital for understanding their nature and emission mechanism. While CRACO can detect ULPOs through their sub-pulse structures, the ASKAP image-domain transient search project, VAST, can also detect ULPOs but mainly via their second- to minute-timescale pulse structures and polarised emission (Murphy et al., Reference Murphy, Kaplan and Stewart2021; Wang et al., Reference Wang, Murphy and Lenc2023).
A combination of CRACO and VAST will be an excellent machine for discovering and initially characterising new ULPOs. CRACO can detect radio emission from ULPOs in (near) real-time with an accurate measurement of dispersion measure. VAST can provide polarisation information of the source, and we can use multiple detections to measure the periodicity of the source if there is any. All this information is helpful in planning and scheduling multi-wavelength follow-up observations in a timely manner as the radio emission from ULPOs may turn off abruptly; for example, GLEAMX J162759.5–523504.3 was only active for 3 months (Hurley-Walker et al., Reference Hurley-Walker, Zhang and Bahramian2022).
6.4 Further CRACO developments
The final goal for the CRACO system is to search for dispersed signals from the data at 1.7 ms resolution in real time. The CRACO-PS survey used our pilot computing cluster seren and search pipeline version 1.0Footnote t, which were about three times slower (i.e. it took three times the duration of the observation to search the data) at 110 ms resolution. A new cluster skadi, dedicated to CRACO operation, has been installed on site. skadi is equipped with 72 FPGA cards, about 3 times more than that of the pilot cluster. The FPGA card on skadi is more powerful than the card on seren (Alveo U55C card compared to Alveo U280 card). With the new cluster skadi and a new version of the search pipeline, we are currently able to run the pipeline at 13.8 ms resolution in real time and search the number of DM trails of 240 (DM value up to 1 000 pc cm $^{-3}$
; as of Jun 2024). We are now working on improvements to the search pipeline to make it fast enough for higher time resolutions, and resolving the known issues described in Section 2.7.4.
$^{-3}$
; as of Jun 2024). We are now working on improvements to the search pipeline to make it fast enough for higher time resolutions, and resolving the known issues described in Section 2.7.4.
We are also planning for the next version of CRACO, CRACO 2.0, aiming at improving the search capability of the system as follows:
-
• Gridding function - As discussed in Section 2.7, the simple pillbox gridding function can cause SNR loss of 60% near the corners of the FoV. This can be improved by using a more complicated gridding function. Although implementing a new gridding function will eliminate aliased detections, using extra cards to cover the sky near the FoV edges will solve this issue.
-
• Field of view - The current system can cover the half power beam width for all inner beams (1.7 deg at 1 GHz), but there are
$\sim$
7 deg
$^2$
of sky observable by ASKAP but not searched by the CRACO pipeline because of the 1.1 deg
$^2$
FoV we set in the search pipeline. In skadi, we have 36 extra FPGA cards available, which can be useful in searching the region near the edges of the FoV. -
• Number of antennas - To balance the oversampling factor and FoV, we cannot use the data from the all inner 30 antennas CRACO records during the search. We can optimise the number of antennas being used in the search by simulating uv-coverage for sources at different hour angle and declination.
-
• Maximum boxcar width - The current system only supports searching for signals with a maximum boxcar width of 8, which can easily miss signals with a (potential) wide width such as intrinsically wide FRBs, super scattered FRBs, slow rotating pulsars, and sub-pulse structure from ULPOs. At the target 1.7 ms time resolution, CRACO will only be sensitive to signals with a width of
$\lesssim$
20 ms, but it will increase to
$\sim$
2 s if we can increase the maximum boxcar width to 1 024. For transients with a timescale larger than
$\sim$
2 s, image domain searches (without de-dispersion or with very coarse de-dispersion) will be sufficient (e.g. Murphy et al., Reference Murphy, Kaplan and Stewart2021; Wang et al., Reference Wang, Murphy and Lenc2023).


7. Conclusions
CRACO, a coherent upgrade of the current ASKAP ICS system, searches for dispersed signals in the visibility data at millisecond time resolution. We conducted a 110 ms pilot survey (CRACO-PS) as part of the commissioning. During the 400 hr survey, we detected one ICS-discovered FRB (FRB 20230902A), and discovered one FRB (FRB 20231027A). The detection of FRB 20231027A gives us a detectable event rate of $\mathcal{R}_\mathrm{FRB}\left(\mathcal{F} \gt 20.5\,\mathrm{Jy}\,\mathrm{ms}\right)$ $\gtrsim 1.72_{-1.64}^{+6.47}\times10^2\,\mathrm{events}\,\mathrm{sky}^{-1}\,\mathrm{d}^{-1}$
, which is broadly consistent with rates estimated in the previous literature. We corrected the localisation for four previous poorly localised pulsars and discovered two new RRATs by searching for single pulses. We also demonstrated the CRACO capability of detecting new ULPOs.
$\gtrsim 1.72_{-1.64}^{+6.47}\times10^2\,\mathrm{events}\,\mathrm{sky}^{-1}\,\mathrm{d}^{-1}$
, which is broadly consistent with rates estimated in the previous literature. We corrected the localisation for four previous poorly localised pulsars and discovered two new RRATs by searching for single pulses. We also demonstrated the CRACO capability of detecting new ULPOs.
A 13.8-ms search mode has already been achieved and is currently in operation (December 2023), after the 110-ms transient survey concluded. At the target 1.7 ms resolution, CRACO will be $\sim$
5 times more sensitive than the previous ICS system, and therefore we expect to detect
$\sim$
5 times more sensitive than the previous ICS system, and therefore we expect to detect $\sim$
100 localised FRBs within a year. These discoveries will be crucial for our understanding of the FRB underlying population, the surrounding environment of the FRB progenitor, and probing the universe by constraining cosmology parameters such as the Hubble constant. CRACO is a powerful machine for detecting FRBs with arcsecond-level uncertainty in their localisations, extreme neutron stars (e.g. pulsars with a high nulling fraction, slow spin-period pulsars, and RRATs), and sources of an unknown nature such as ULPOs.
$\sim$
100 localised FRBs within a year. These discoveries will be crucial for our understanding of the FRB underlying population, the surrounding environment of the FRB progenitor, and probing the universe by constraining cosmology parameters such as the Hubble constant. CRACO is a powerful machine for detecting FRBs with arcsecond-level uncertainty in their localisations, extreme neutron stars (e.g. pulsars with a high nulling fraction, slow spin-period pulsars, and RRATs), and sources of an unknown nature such as ULPOs.
Acknowledgement
We are grateful to the ASKAP engineering and operations team for their assistance in developing fast radio burst instrumentation for the telescope and supporting the survey. This work uses data obtained from Inyarrimanha Ilgari Bundara/the CSIRO Murchison Radio-astronomy Observatory. We acknowledge the Wajarri Yamaji People as the Traditional Owners and native title holders of the Observatory site. CSIRO’s ASKAP radio telescope is part of the Australia Telescope National Facility (https://ror.org/05qajvd42). Operation of ASKAP is funded by the Australian Government with support from the National Collaborative Research Infrastructure Strategy. ASKAP uses the resources of the Pawsey Supercomputing Research Centre. Establishment of ASKAP, Inyarrimanha Ilgari Bundara, the CSIRO Murchison Radio-astronomy Observatory and the Pawsey Supercomputing Research Centre are initiatives of the Australian Government, with support from the Government of Western Australia and the Science and Industry Endowment Fund. CRACO was funded through Australian Research Council Linkage Infrastructure Equipment, and Facilities grant LE210100107.
Murriyang, the Parkes radio telescope, is part of the Australia Telescope National Facility (https://ror.org/05qajvd42) which is funded by the Australian Government for operation as a National Facility managed by CSIRO. We acknowledge the Wiradjuri people as the Traditional Owners of the Parkes Observatory site. Part of this work was based on observations collected at the European Southern Observatory under ESO programme 108.21ZF. Some of the data presented herein were obtained at Keck Observatory, which is operated as a scientific partnership among the California Institute of Technology, the University of California, and the National Aeronautics and Space Administration. The Observatory was made possible by the generous financial support of the W. M. Keck Foundation. The authors wish to recognise and acknowledge the very significant cultural role and reverence that the summit of Maunakea has always had within the Native Hawaiian community. We are most fortunate to have the opportunity to conduct observations from this mountain.
Part of this work was performed on the OzSTAR national facility at Swinburne University of Technology. The OzSTAR programme receives funding in part from the Astronomy National Collaborative Research Infrastructure Strategy (NCRIS) allocation provided by the Australian Government, and from the Victorian Higher Education State Investment Fund (VHESIF) provided by the Victorian Government.
RMS, and YW acknowledge support through Australian Research Council Future Fellowship FT 190100155. RMS, ATD, AJ, YWJL, and TM acknowledge support through Australian Research Council Discovery Project DP 220102305. MG and CWJ acknowledge support from the Australian Government through the Australian Research Council Discovery Project DP210102103. MG is also supported through UK STFC Grant ST/Y001117/1. For the purpose of open access, the author has applied a Creative Commons Attribution (CC BY) licence to any Author Accepted Manuscript version arising from this submission. Parts of this research were conducted by the Australian Research Council Centre of Excellence for Gravitational Wave Discovery (OzGrav), through project numbers CE170100004 and CE230100016. ACG and the Fong Group at Northwestern acknowledges support by the National Science Foundation under grant Nos. AST-1909358, AST-2308182 and CAREER grant No. AST-2047919. ACG acknowledges support from NSF grants AST-1911140, AST-1910471 and AST-2206490 as a member of the Fast and Fortunate for FRB Follow-up team. MC acknowledges support of an Australian Research Council Discovery Early Career Research Award (project number DE220100819) funded by the Australian Government.
This publication makes use of data products from the Wide-field Infrared Survey Explorer, which is a joint project of the University of California, Los Angeles, and the Jet Propulsion Laboratory/California Institute of Technology, funded by the National Aeronautics and Space Administration.
Data Availability
The data that support the findings of this study are available from the corresponding author upon reasonable request.
Appendix A. Data verification
The visibility data for both CRACO and general ASKAP hardware are averaged based on the same correlator output. We verified the CRACO data quality by averaging CRACO data to 9.95 s time resolution and comparing it to the ASKAP hardware data. As is shown in Figure 19, the CRACO data was consistent with the hardware data. The reason for minor differences is the random packet loss during the data transposing in the CRACO recording system.
Amplitude and phase comparison between CRACO and ASKAP hardware visibility data. We averaged CRACO data by a factor of 90 to match the hardware time resolution. We show the phase differences and amplitude ratio between the two datasets in the lower left and upper right, respectively. For each small plot, the x-axis shows the time and the y-axis shows the frequency. Antenna AK01 and AK19 were flagged during the observation so therefore there are no data from them in either CRACO or ASKAP hardware data.

Appendix B. Detected known pulsars
We list the 42 known pulsars/RRaTs detected in CRACO-PS in Table 9 with their measured properties reported by the CRACO pipeline and in the literature.
Known pulsars detected in the CRACO 110-ms pilot survey. The SBID and Beam columns indicate the observation information of the brightest single pulse detected with the CRACO pipeline. DM $_\mathrm{CRACO}$
, R.A.
$_\mathrm{CRACO}$
, R.A. $_\mathrm{CRACO}$
, and Decl.
$_\mathrm{CRACO}$
, and Decl. $_\mathrm{CRACO}$
are the DM and coordinates reported by the pipeline. DM
$_\mathrm{CRACO}$
are the DM and coordinates reported by the pipeline. DM $_\mathrm{ cat}$
, R.A.
$_\mathrm{ cat}$
, R.A. $_\mathrm{cat}$
, and Decl.
$_\mathrm{cat}$
, and Decl. $_\mathrm{cat}$
are the information from the previous work, which are retrieved from the ATNF pulsar catalogue unless specified.
$_\mathrm{cat}$
are the information from the previous work, which are retrieved from the ATNF pulsar catalogue unless specified.
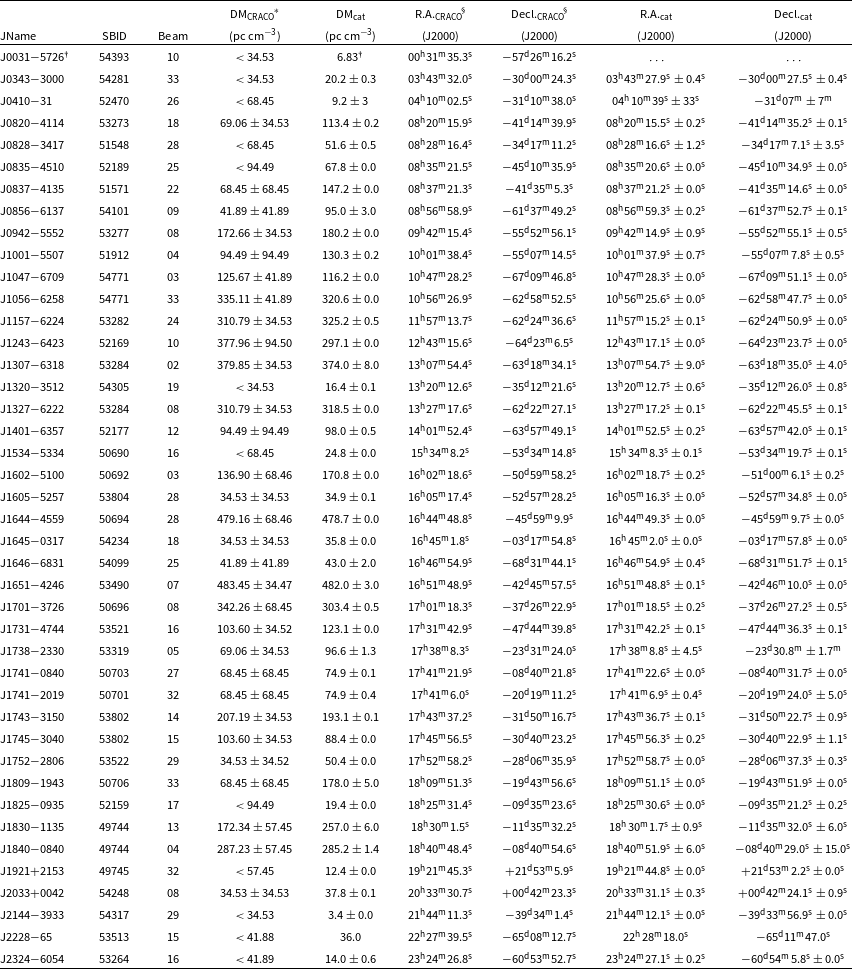
*The uncertainty in DM $_\mathrm{CRACO}$
corresponds to the DM of one sample. An upper limit is reported if the DM measured with the pipeline is 0.
$_\mathrm{CRACO}$
corresponds to the DM of one sample. An upper limit is reported if the DM measured with the pipeline is 0.
§The error on the coordinate depends on the pixel size of the images, which varies for different observations. The typical pixel size of CRACO images is $\sim$
30-60 arcsec.
$\sim$
30-60 arcsec.
†J0031 $-$
5726 was discovered by MWA (see https://mwatelescope.atlassian.net/wiki/spaces/MP/pages/24970773/SMART+survey+candidates), and not recorded in ATNF Pulsar catalogue yet.
$-$
5726 was discovered by MWA (see https://mwatelescope.atlassian.net/wiki/spaces/MP/pages/24970773/SMART+survey+candidates), and not recorded in ATNF Pulsar catalogue yet.


 Open access