


1. Introduction
Subjective beliefs play a crucial role in economic decision-making. Relevant beliefs are often about real-valued random variables.Footnote 1 The decision to buy an asset depends on beliefs about the future price. The decision to install farm irrigation depends on beliefs about future rainfall. In these cases, beliefs take the form of a density function over the range of possible values.
Decisions can depend in complex ways on the subjective belief distribution. For example, the value of an asset to a risk-neutral buyer depends on the mean of the price distribution. The value of irrigation for a farmer depends on the likelihood and severity of dry conditions, which may be related to the lower tail of the rainfall distribution. Because of this, it is important that a belief elicitation methodology in this environment allows a researcher to capture the relevant information about the subjective distribution.
In this paper, we introduce a methodology for eliciting quantiles of a subjective real-valued belief using a price list methodology: the quantile price list. Our methodology is simple, incentive compatible under very general conditions, and can be extended to elicit any quantile. This allows researchers to pinpoint the information they require or to get a more comprehensive view of a participant’s underlying beliefs by eliciting several quantiles. We also show how the elicited quantiles can be used to approximate an entire belief distribution and estimate unobserved properties, such as the mean.
We demonstrate our methodology using an experiment on beliefs about student math test performance. Twenty students from The Ohio State University took a math test and were marked as “successful” if they answered at least 13 questions correctly. We elicited the beliefs of the participants about the number of students who were successful, specifically the 0.25, 0.50 (median), and 0.75 quantiles of their subjective belief distributions, and use these beliefs to approximate the entire cumulative distribution function (CDF) for each participant.
Additionally, we elicited the probability each participant believes that a randomly chosen student passed the math task using a price list methodology for probabilities popularized in Holt and Smith Reference Holt and Smith2016. We compare the approximated CDFs from our methodology to the implied binomial distributions induced from this elicited probability and find that our approximated subjective CDFs are much “flatter” than the implied binomial distributions, demonstrating how our methodology can provide a more nuanced understanding of beliefs.
Section 2 introduces and formalizes the theory of quantile price lists. Section 3 demonstrates how to approximate an entire belief distribution after eliciting several quantiles. Section 4 compares our methodology with other methods. Section 5 describes the design of our proof-of-concept experiment. Section 6 reports the results of the experiment, and Section 7 concludes with a discussion focusing on potential applications.
2. Theory
We begin this section by describing our procedure informally and discussing why and under what conditions it elicits quantiles of a subjective belief. Our formal results follow this discussion.
2.1. Quantile price lists
To make the discussion of our procedure more concrete, suppose that we want to learn about a participant’s belief about the distance between Los Angeles and San Diego. We have chosen this example to demonstrate that we can elicit subjective beliefs about events that are not inherently random. Ultimately, our methodology applies to eliciting beliefs about any quantity, random or not, as long as it can be observed or verified.Footnote 2
Let us start with a participant who is somewhat familiar with the geography of California. They know that these cities are both in southern California and are not that far apart. Suppose that we ask this participant if they would rather have  $\$10$ with a
  $75\%$ chance or
  $\$10$ if the distance between the two cities is less than
  $1,000$ miles. This participant believes that the distance is almost certain to be less than
  $1,000$ miles and chooses the latter option, since they believe that it will yield the
  $\$10$ with a nearly
  $100\%$ chance. We can conclude that whatever the distribution of their belief F about the distance between these two cities, it is the case that
  $F(X\leq 1,000)\geq0.75$.
Now suppose that we continue asking questions like this, but where the second option pays conditional on the distance being below  $900,800,700,600,500,400$, and 300, respectively. In each case, the participant chooses the second option. However, they conclude that the chance that the distance is below 200 miles is less than
  $75\%$ and, when asked to compare being paid
  $\$10$ with a
  $75\%$ chance and being paid conditional on the distance being below 200 miles, they now choose the first option. From these choices, we can conclude that for their belief F,
  $F(X\leq 300)\geq0.75$ but
  $F(X\leq 200)\leq0.75$. Thus, whatever number x solves
  $F(X\leq x)=0.75$ (the 75th quantile) must be between 200 and 300.Footnote 3 Gathering these questions into a list results in what we call a quantile price list, an example of which is shown in Figure 1.
A quantile price list for the 0.75 quantile belief about the distance between Los Angeles and San Diego. The chosen options indicate the 0.75 quantile of the participants’ belief is between 200 and 300.

To find a different quantile, we repeat this exercise with a different objective lottery. For example, if the same participant were asked to compare  $\$10$ with a
  $25\%$ chance and
  $\$10$ if the distance is below 200, they may well choose the latter option but switch to choosing the objective lottery when asked to compare it to
  $\$10$ if the distance is below 100. These pairs of choices imply that
  $F(X\leq 200)\geq0.25$ but
  $F(X\leq 100)\leq0.25$. We can conclude the 0.25 quantile of their subjective belief is between 100 and 200.
Notice that in these cases, we use the choices to bound the number x that would create an indifference between some objective lottery that pays with probability p and an act that pays if the random variable is below x. We interpret this x as being the p – th quantile of the participant’s belief. To interpret this indifference as a quantile of the belief, we need to assume a few things about preferences:
If a participant is indifferent between a  $75\%$ chance of
  $\$10$ and
  $\$10$ if the random variable is below 250 but strictly prefers a
  $75\%$ chance of
  $\$20$ to
  $\$20$ if the random variable is below 250, then we cannot interpret 250 as the 0.75 quantile. This is because the number we would infer as the 0.75 quantile appears to depend on whether
  $\$10$ or
  $\$20$ is the outcome. In this case, we cannot reliably infer a belief using some arbitrarily chosen outcome for incentivizing the revelation of that belief. Thus, to interpret the outcome of our procedure as identifying the quantile of a belief, we need to assume that participants’ willingness to substitute between acts and objective lotteries does not depend on the arbitrarily chosen outcome. We refer to this assumption as the replacement axiom.
Another way our procedure can fail to deliver a result that can be interpreted as the quantile of a belief is if preferences over acts or objective lotteries are not monotone. For example, if a participant is indifferent between a  $75\%$ chance of
  $\$10$ and
  $\$10$ if the random variable is below 250, but also indifferent between a
  $50\%$ chance of
  $\$10$ and
  $\$10$ if the random variable is below 300, then it is hard to interpret either of these indifferences as generated by a coherent belief, since it implies that F would have to be downward sloping. One way for this to happen is if preferences over acts do not respect the monotonicity of events, so that an act can be strictly preferred to another even if it pays conditional on an event that is “smaller” in terms of inclusion (such as
  $X\leq 250$ vs.
  $X\leq 300$). Another way to obtain preferences like this is if preferences over objective lotteries are not monotonic in probabilities (for instance,
  $\$10$ with
  $50\%$ chance is preferred to
  $\$10$ with
  $75\%$). On the other hand, if both of these monotonicity conditions are met, then the indifferences between acts that pay conditional on larger events (in terms of inclusion) will occur at higher objective probabilities, and thus these indifferences can be interpreted as belonging to some consistent distribution F. We refer to this pair of assumptions as the act monotonicity and objective lottery monotonicity axioms, respectively.
The replacement axiom and the two monotonicity axioms are enough to ensure that we can use indifferences to identify structure in preferences that can reasonably be interpreted as the quantiles of an underlying belief distribution. However, to actually find that indifference, we will need one more assumption, which has been latent in the discussion up until now. When we ask participants to choose their favorite option from the relevant pair and incentivize it by randomly implementing one of these choices, how do we know that their choice in each menu is their favorite? This requires weak structure on the participant’s preferences over compound lotteries for the types of acts and objective lotteries used in this procedure. This axiom is known as statewise monotonicity, which is an assumption required in any experimental economic procedure that asks participants to make multiple choices and then randomly chooses one to implement (Azrieli et al., Reference Azrieli, Chambers and Healy2018).
2.2. Formal results
This section makes use of the following notation. The set of outcomes is  $\mathscr{X}=\left\{a,b\right\} $. Throughout, it is assumed
  $a\succ b$. X is a real-valued random variable with state space Ω. A tail event Ex is an event of the form
  $X\leq x$. Simple lotteries are objective lotteries of the form
  $S=(a\circ p,b\circ(1-p))$, where
  $p\in[0,1]$. Binary acts are acts of the form
  $\left(a\circ E,b\circ E^{c}\right)$ where E is an event in X and E c is the complement of that event. Simple mixtures are compound lotteries that mix (potentially) objective and subjective risk of the form
  $M=\left(L_{1}\circ p_{1},L_{2}\circ p_{2},...,L_{n}\circ p_{n}\right)$ where
  $p_{i}\in[0,1]$ with
  $\sum_{i=1}^{n}p_{i}=1$, and each Li is a simple lottery or a binary act. The set of all simple mixtures is
  $\mathscr{M}$.
A quantile price list is a probability p (the quantile to be elicited), along with a sequence of n values  $\left(x_{1},...,x_{n}\right)$ with
  $x_{i} \gt x_{i+1}$. The range of the quantile price list is
  $\left[x_{n},x_{1}\right]$. The price list is constructed by pairing a constant objective lottery
  $o_{p}=\left(a\circ p,b\circ1-p\right)$ with a sequence of increasing binary acts
  $A_{x_{i}}=(a\circ E_{x_{i}} ,b\circ E_{x_{i}}^c) $ (recall that tail events
  $E_{x_{i}}$ are events
  $X \lt x_i$) to create n menus of the form
  $\left\{o_{p},A_{x_{i}}\right\} $. To implement the price list, participants are asked to choose either the lottery or the act from each menu. A menu is randomly chosen (according to any fixed distribution), and the participant is rewarded with the lottery chosen from that menu.Footnote 4
Assume participants have preference relation  $\succsim$ over
  $\mathscr{M}$ that is complete, transitive. We define these additional axioms.
Axiom (1): Objective Lottery Monotonicity:
 $p\geq p'\Leftrightarrow\left(a\circ p,b\circ1-p\right)\succsim\left(a\circ p',b\circ1-p'\right)$.
Axiom (2): Act Monotonicity:
 $E'\subseteq E\Rightarrow\left(a\circ E,b\circ E^c\right)\succsim\left(a\circ E',b\circ E'^c\right)$.
Axiom (3): Continuity:
 $\forall E\in \Omega$,
  $\exists p\in[0,1]:$
  $\left(a\circ E,b\circ E^c\right)\sim\left(a\circ p,b\circ 1-p\right)$.
Axiom (4): Replacement:
For all  $a,a',b,b'$:
  $\left(a\circ E,b\circ E^{c}\right)\sim\left(a\circ p,b\circ1-p\right) \Leftrightarrow \\ \left(a'\circ E,b'\circ E^{c}\right)\sim\left(a'\circ p,b'\circ1-p\right)$
Axiom (5): Statewise Monotonicity:
 $L_{i}^{*}\succ L_{i}\Leftrightarrow\left(L_{1}\circ p_{1},...,L_{i}^{*}\circ p_{i},...,L_{n}\circ p_{n}\right)\succ\left(L_{1}\circ p_{1},...,L_{i}\circ p_{i},...,L_{n}\circ p_{n}\right)$
We now formalize the discussion from the previous subsection. Under objective lottery monotonicity, act monotonicity, continuity, and replacement, participants behave “as if” their preferences are generated by a well-formed subjective distribution F.
Proposition 1. Under Axioms 1-4, there exists a unique CDF function F (invariant to the choice of a and b) that solves  $\Bigl(a\circ F(x),b\circ 1-F(x)\Bigr)\sim\left(a\circ E_x,b\circ E_x^c\right)$. (Proof in Appendix Section 8.1.)
Let F(x) be the CDF that solves  $\left(a\circ F(x),b\circ 1-F(x)\right)\sim\left(a\circ E_x,b\circ E_x^c\right)$ under the conditions of Proposition 1. A p quantile of F(x) is any q that solves
  $F(q)\geq p$ and
  $F(q) \leq p$. Such a q always exists but may not be unique. However, since F(x) is increasing, the set of p quantiles is an interval
  $[q_l,q_h]$. On the other hand, if F(x) is strictly increasing every p quantile is unique (
 $q_l=q_h=q$).
Call xi a switching-point for the p quantile if the participant chooses  $A_{x_{i}}$ from
  $\left\{o_{p},A_{x_{i}}\right\} $ but op from
  $\left\{o_{p},A_{x_{i+1}}\right\}$. Under the addition of statewise monotonicity, if a participant’s subjective distribution has a unique p quantile qp within the range of the quantile price list, then the participant’s choices in the quantile price list will have a switching-point, and that switching-point reveals an interval that must contain qp.
The fact that a p quantile may not be unique poses a minor complication for elicitation. If the set of p quantiles  $[q_l,q_h]$ spans multiple values of
  $(x_1,...,x_n)$, then there is a range of values for which the participant is indifferent between being paid according to the objective lottery op and the binary act
  $A_{x_{i}}$. This can result in the multiple switching-points. In this case, however, any switching-point identifies a p quantile.
Proposition 2. Under Axioms 1-5, for a quantile price list for the p quantile, if the set of p quantiles  $[q_l,q_h]$ is such that
  $q_h \lt x_1$ and
  $q_l \gt x_n$, then there is at least one switching-point xi in the sequence
  $(x_1,...,x_n)$ and for any switching-point, there is some x in
  $\left[x_{i},x_{i+1}\right]$ that is a p quantile of F. (Proof in Appendix Section 8.2.)
3. Approximating beliefs via maximum entropy
Our procedure allows researchers to collect any set of quantiles. These quantiles can be interpreted as points on the CDF of the participant’s underlying subjective belief distribution, or more precisely, as intervals where these points must lie. However, we envision that researchers may want to extrapolate from the information collected by our methodology to calculate unobserved properties of these distributions (such as moments or unelicited quantiles).
In some situations, researchers may want to fit a parameterized distribution that is specific to their research context. Since the assumptions and procedures for this would depend on the particular research questions, we will not elaborate on them here. Instead, in this section, we offer a procedure to approximate the entire subjective belief that does not make any context-specific distributional assumptions and uses only the information provided by our methodology.
To do this, we apply the principle of maximum entropy.Footnote 5 The principle of maximum entropy is closely related to the principle of insufficient reason. A distribution that maximizes entropy subject to constraints is the distribution that is least informative beyond the information encoded by those constraints. More informally, the process determines which distribution uses known information and only the known information.Footnote 6
3.1. Characterization of the maximum entropy approximation
Suppose that a random variable X is known to be continuously distributed on  $\left[\underline{q},\overline{q}\right]$. Furthermore, there are n quantile values
  $\{q_{p_1},q_{p_2},...,q_{p_n}\}$ associated with the probabilities
  $\{p_1,p_2,...,p_n\}$, with each quantile value
  $q_{p_i}$ constrained to be within an interval:
  $\left[l_{p_i},h_{p_i}\right]$. Without loss of generality, assume
  $p_i \gt p_{i-1}$. For convenience, let
  $p_0=0$ and
  $p_{n+1}=1$. The fact that the distribution has support
  $\left[\underline{q},\overline{q}\right]$ can be represented by
  $l_{p_0}=h_{p_0}=\underline{q}$ and
  $l_{p_{n+1}}=h_{p_{n+1}}=\overline{q}$. The other values of
  $l_{p_i},h_{p_i}$ are determined by our elicitation methodology.
We wish to find the distribution  $\tilde{F}$ and the associated density
  $\tilde{f}$ that maximizes the entropy function
  $h(f)=\int_{\underline{q}}^{\overline{q}}-f(x)ln(f(x))dx$ subject to the n restrictions
  $l_{p_i}\leq q_{p_i} \leq h_{p_i}$. These constraints can be interpreted geometrically to restrict F to be in the set of all increasing functions from
  $\left[\underline{q},\overline{q}\right]$ to
  $\left[0,1\right]$ that pass through the horizontal line segments represented by each pair
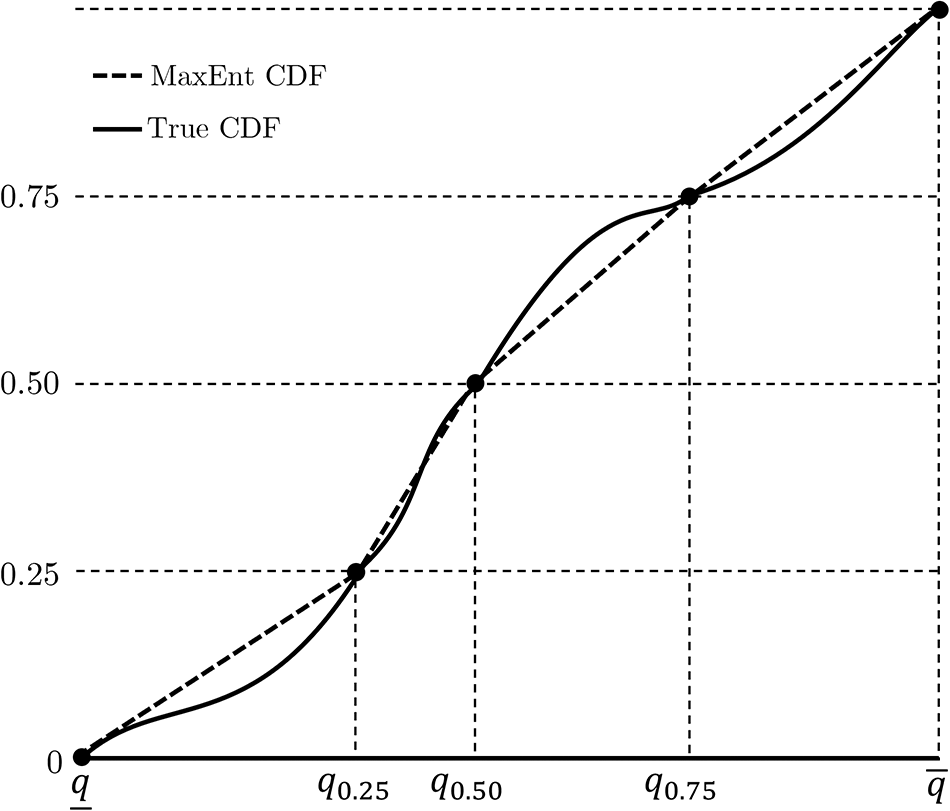
  $[l_{p_i},h_{p_i}]$. This is shown in Figure 2.
Constraints created by elicited quantiles. Each quantile is constrained to be within an interval represented by the horizontal line segments. The CDF of the participants subjective belief distribution must pass through these line segments

Of course, the maximum entropy distribution must have some value for each  $q_{p_i}$. Proposition 3 shows that between these points, whatever they are, the maximum entropy distribution
  $\tilde{F}$ is a simple piecewise linear interpolation of the quantiles
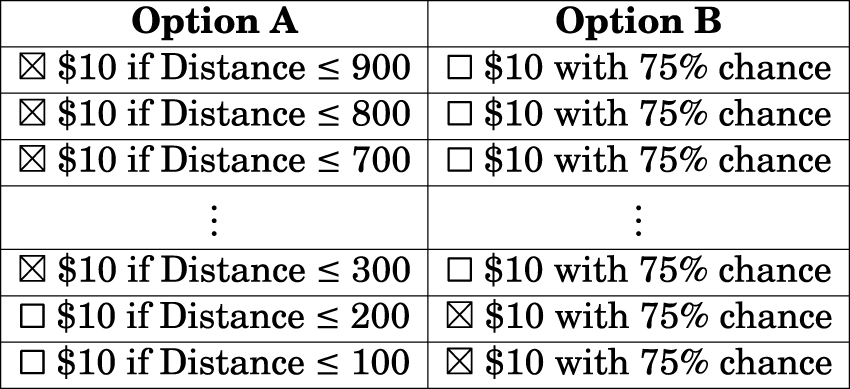
  $q_{p_i}$. If the quantiles were known exactly, rather than constrained to be within some interval, this would be a full characterization of the maximum entropy distribution. An example of this is shown in Figure 3 for known quantiles
  $\{q_{0.25},q_{0.50},q_{0.75}\}$.
An example of the maximum entropy CDF (dotted line) and true CDF (solid line) with known quantiles at  $25\%,50\%, 75\%$

Proposition 3. Assume that for each of  $\{p_1,p_2,...,p_n\}$ where
  $p_{i+1} \gt p_i$, the pi quantile of a distribution is restricted to be equal to the value qi. Among all distributions over the range
  $\left[\underline{q},\overline{q}\right]$ that meet these n quantile restrictions, the distribution
  $\tilde{F}$ that maximizes entropy is a piecewise linear CDF connecting the points
 $\Biggl(\Bigl(\underline{q},0\Bigr),\left(q_{p_1},p_1\right),\left(q_{p_2},p_2\right), ... , \left(q_{p_n},p_n\right),\Bigl(\overline{q},1\Bigr)\Biggr)$. (Proof in Appendix Section 8.1.)
Notice that Proposition 3 does not fully characterize the maximum entropy distribution subject to the quantile intervals elicited by our methodology. However, it greatly simplifies the problem of finding this distribution. Although maximizing entropy in general is an infinite-dimensional optimization problem, Proposition 3 simplifies the problem to one of finding the values of  ${q_{p_2},...,q_{p_{n-1}}}$ for which F constructed from the piecewise linear interpolation of the points
  $\Biggl(\Bigl(\underline{q},0\Bigr),\left(q_{p_1},p_1\right),\left(q_{p_2},p_2\right), ... , \left(q_{p_n},p_n\right),\Bigl(\overline{q},1\Bigr)\Biggr)$ maximizes the entropy function
  $h(f)=\int_{\underline{q}}^{\overline{q}}-f(x)ln(f(x))dx$.
The problem can be solved efficiently with generic nonlinear optimization packages. Figure 4 shows the maximum entropy distribution subject to the quantile intervals shown in Figure 2. In this case, q 0.25 and q 0.50 are maximized at corner solutions, while q 0.75 is maximized at an interior. The first-order conditions on each quantile ensure that whenever the maximum entropy function involves an interior solution for some quantile, the density is constant and equal on both sides of that quantile and, therefore,  $\tilde{F}$ does not have a kink at that quantile.
An example of the maximum entropy CDF through the constraints imposed by elicited quantile intervals for  $q_{0.25},q_{0.50},q_{0.75}$

3.2. Approximating moments
Once we have approximated beliefs using the maximum entropy distribution  $\tilde{F}$, it is possible to estimate properties of a belief that have not been observed. As an example, suppose that we want to calculate the belief about the mean of X. This can be done using the CDF and the fact that
  $E(X)=\int_{-\infty}^{\infty}1-F(x)dx$. Thus, the mean of the approximated distribution can be calculated by the following sum.
 \begin{equation}
\begin{aligned}
\int_{\underline{q}}^{q_{p_{1}}}x\left(\frac{p_{1}}{q_{p_{1}}-\underline{q}}\right)dx+\int_{q_{p_{1}}}^{q_{p_{2}}}x\left(\frac{p_{2}-p_{1}}{q_{p_{2}}-q_{p_{1}}}\right)dx+...\\ +\int_{q_{p_{n-1}}}^{q_{p_{n}}}x\left(\frac{p_{n}-p_{n-1}}{q_{p_{n}}-q_{p_{n-1}}}\right)dx+\int_{q_{p_{n}}}^{\overline{q}}x\left(\frac{1-p_{n}}{\overline{q}-q_{p_{n}}}\right)dx
\end{aligned}
\end{equation}
\begin{equation}
\begin{aligned}
\int_{\underline{q}}^{q_{p_{1}}}x\left(\frac{p_{1}}{q_{p_{1}}-\underline{q}}\right)dx+\int_{q_{p_{1}}}^{q_{p_{2}}}x\left(\frac{p_{2}-p_{1}}{q_{p_{2}}-q_{p_{1}}}\right)dx+...\\ +\int_{q_{p_{n-1}}}^{q_{p_{n}}}x\left(\frac{p_{n}-p_{n-1}}{q_{p_{n}}-q_{p_{n-1}}}\right)dx+\int_{q_{p_{n}}}^{\overline{q}}x\left(\frac{1-p_{n}}{\overline{q}-q_{p_{n}}}\right)dx
\end{aligned}
\end{equation} For our experiment, where we elicit q 0.25, q 0.50, and q 0.75, this sum simplifies to the following expression for the approximated mean in terms of  $\underline{q},\overline{q}$ and the quantiles:
 \begin{equation}
\frac{1}{8}\left(\underline{q}+\overline{q}\right)+\frac{1}{4}\left(q_{0.25}+q_{0.50}+q_{0.75}\right)
\end{equation}
\begin{equation}
\frac{1}{8}\left(\underline{q}+\overline{q}\right)+\frac{1}{4}\left(q_{0.25}+q_{0.50}+q_{0.75}\right)
\end{equation}4. Comparison to other methodologies
The choice of methodology to elicit subjective beliefs involves two main decisions: what to elicit and how to elicit it. It is possible to elicit any aspect of beliefs (Lambert et al., Reference Lambert, Pennock and Shoham2008).Footnote 7 The decision of what to elicit ultimately depends on the information required by the research question. We propose eliciting quantiles as a flexible way to gather information about a real-valued distribution when the required information is about the distribution itself rather than about the probabilities of particular events. For example, if a researcher wants to know the probability that a participant believes that the value of a random variable is greater than some fixed quantity, it is appropriate to elicit a probability. If a researcher wants to know the values that a participant believes are in the upper and lower 5% tails of a distribution, then quantiles are more appropriate.
It is also possible to elicit moments of a real-valued subjective distribution. However, in contrast to quantiles, moments are not a fundamental part of a distribution but are derived from it. Furthermore, moments may not exist for certain extreme distributions. More practically, because moments are not event-based but rather a summary of the entire distribution, the incentives involved in eliciting moments are more complex than those for eliciting quantiles. This also makes them harder to communicate to participants when researchers want to tell participants exactly what they are eliciting. An exception to this is a situation like that in our experiment, where beliefs about a moment can be directly inferred, under some assumptions, from the elicitation of a probability.
Moments, unlike quantiles, cannot always be elicited in isolation. For example, it is impossible to elicit the variance of a subjective distribution without learning about the mean (Lambert et al., Reference Lambert, Pennock and Shoham2008). Finally, as we demonstrate, if information about moments is required, these values can be approximated from the elicited quantiles. For these reasons, we believe that it is often more appropriate to elicit quantiles rather than moments when research questions depend on information about real-valued subjective distributions.
For research questions that specifically require the elicitation of moments and where the researcher is not satisfied with estimating these from the elicited quantiles, scoring rules can be used. Scoring rules are a flexible way to elicit quantities of a distribution. Participants provide their estimate of the target value, such as the mean, which is then compared to the truth or a sample from the true distribution. It is possible to tailor the scoring rules to elicit a wide range of information about a distribution (Gneiting & Raftery, Reference Gneiting and Raftery2007, Lambert, Reference Lambert2019). In experimental economics, it is common to “binarize” scoring rules to eliminate the effect of risk preferences on biasing elicited beliefs. In binarized scoring rules, the probability of a reward, rather than the value of the reward, changes with the accuracy of the reported beliefs (Savage, Reference Savage1971, Hossain & Okui, Reference Hossain and Okui2013, Harrison et al., Reference Harrison, Martínez-Correa and Swarthout2014).
Researchers convinced by our arguments on eliciting quantiles may still be skeptical that eliciting quantiles using price lists is the best solution. Like moments and probabilities, quantiles can also be elicited using scoring rules. However, unlike our price list methodology, scoring rules require participants to provide their beliefs about the target quantities directly. This may be more cumbersome for participants, since the scoring rules do not provide any guidance on how to discover these values. For example, Eyting and Schmidt Reference Eyting and Schmidt(2021) propose eliciting quantiles with the following language (in this case, to elicit the 0.75 quantile): “What do you say is X if underestimation is four times more costly than overestimation?” Although this is incentive compatible, participants are left to determine how to arrive at X that maximizes their utility under this rule. Even if researchers tell participants what they are eliciting, such as in Dustan et al. Reference Dustan, Koutout and Leo(2022), who tell participants their incentives are designed to elicit the median of their belief, participants must still arrive at what their belief about the median is without any guidance. In contrast, our price list methodology leverages the event-based nature of a quantile and allows participants to “discover” their belief through a series of simpler questions about event probabilities.
Baillon Reference Baillon2008 proposes an elegant alternative approach to eliciting subjective distributions that also focuses on the event-based nature of quantiles and only uses comparisons between subjective bets (and not objective lotteries). In principle, an incentive-compatible procedure that avoids such comparisons would eliminate the need for the objective lottery monotonicity axiom and allow a weakening of the replacement axiom needed for the incentive compatibility of quantile price lists. As Baillon points out, this would be especially valuable in the presence of ambiguity aversion where objective lottery comparisons will tend to underestimate participant’s beliefs about the probability of events.
The Baillon Reference Baillon2008 procedure involves first finding the median by eliciting the value q 0.50 such that a participant is indifferent between a bet that pays if  $X\leq q_{0.50}$ and a bet that pays if
  $X\geq q_{0.50}$. In Baillon’s terminology,
  $X\geq q_{0.50}$ and
  $X\leq q_{0.50}$ are a pair of exchangeable events. That is, a pair with equal probability. The procedure then subdivides these events into further exchangeable events. For example, a second round of subdivision determines the 0.25 and 0.75 quantiles. This procedure can be iterated again, thus eliciting seven evenly spaced quantiles, and so on.
To elicit qp, the procedure asks participants to choose the bet they prefer between  $X\leq x$ and
  $X\geq x$ for some starting value x and then proceeds by bisecting the remaining interval iteratively. For example, when eliciting a quantile on the support
  $[0,100]$, the participant would first be asked to compare bets on
  $X\geq 50$ and
  $X \leq 50$. If they choose
  $X \geq 50$ they would then be asked to compare
  $X\geq 75$ and
  $X \leq 75$. This process is iterated until the remaining interval is within a desired level of precision. To incentivize this, some choices are implemented at random. Subsequent quantiles are determined by bisecting the resulting subdivided intervals. For example, if the first round of bisection determines that
  $q_{0.5}=60$, then q 0.75 will be elicited by a similar bisection process on the interval
  $[60,100]$.
In contrast to our procedure, Baillon acknowledges that this mechanism is not incentive compatible since the options in each menu depend on the responses of the participant in the previous menus. This is true both within the bisection rounds used to elicit a particular quantile and between quantiles. To see why this causes problems for incentive compatibility, consider a simplified version of the procedure that uses only three comparisons to determine quantiles on the interval  $[0,100]$, with one comparison chosen at random for payment. Suppose a participant’s belief has zero mass on the intervals
  $[0,10]$ and
  $[70,100]$ and is uniform on the interval
  $[10,70]$. The median of their belief is 40. If the participant “tells the truth” about their preferences, they will choose the bet
  $X\leq 50$ over
  $X \geq 50$, then
  $X \geq 25$ over
  $X \leq 25$, then
  $X \geq 37.5$ over
 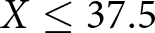 $X \leq 37.5$. Their expected probability of winning the randomly chosen bet is approximately
  $65\%$. However, if they choose the bets
  $X \geq 50$ and then
  $X \leq 75$ and then
  $X \leq 62.5$ their expected probability of winning the randomly chosen bet is approximately
  $74\%$.
Furthermore, our procedure allows us to pinpoint precise quantiles. In contrast, the subdivision of exchangeable events often requires several subdivisions (and thus elicitations) to approximate a particular quantile. For example, our procedure can elicit the 0.90 quantile with one price list. To come close to this with the exchangeable event procedure would require three rounds of subdivision: first eliciting the 0.50, then the 0.75 then the 0.875 quantile. The complexity of each elicitation appears to be about the same as our price lists. In this sense, even if one can overcome the non-incentive compatibility of the exchangeable event procedure, the benefit of avoiding objective lotteries can come at a large cost in terms of elicitation time.
A final alternative to approximating the CDF, as we propose, is to approximate the probability density function. This can be done by partitioning the support and eliciting participants’ beliefs about the probability of each set in the partition. The earliest use of this method to our knowledge is Kabus Reference Kabus1976. One common methodology based on this approach is to have participants “build” a histogram by putting tokens into bins. An early example can be found in Van Noortwijk et al. Reference Van Noortwijk, Dekker, Cooke and Mazzuchi1992. Incentivizing truthful elicitation of the probability of each bin can then be achieved with any incentive-compatible elicitation for a probabilistic belief. For example, Harrison et al. Reference Harrison, Martínez-Correa, Swarthout and Ulm(2015) incentivize each bin using a quadratic scoring rule. However, it would also be possible to incentivize each bin using a binarized scoring rule, multiple price list, or Becker–DeGroot–Marschak (BDM) and randomly pick a bin for payment. Peeters and Wolk Reference Peeters and Wolk2019 incentivize the allocation of tokens into bins through a two-player “Colonel Blotto” game where players are awarded either proportionally to their share of tokens in the bin containing the realized event or in a winner-take-all manner.
We believe that this is a reasonable alternative to our methodology when the goal is to measure a distribution precisely, here using many bins. However, when eliciting a distribution more coarsely, the information the procedure reveals is heavily dependent on the bins chosen and the belief of the participant. For example, in the experiment described in Section 5, we elicit quantiles of participants’ beliefs about the number of students, out of 20, who “passed” a math task, but suppose instead that we had elicited their beliefs about the probability that this number was in each of the ranges (bins) 0–6, 7–13, 14–20. Suppose that a participant was confident about the difficulty of this task, putting all the mass in the bin 0–6. We would learn nothing further about the shape of that participant’s belief distribution within this bin.
In contrast, when eliciting the three quantiles 0.25, 0.50, and 0.75, as we do in our experiment, we would still learn about the shape of that participant’s belief distribution within the 0–6 bin. For example, they might reveal a 0.25 quantile of 2, 0.50 quantile of 3, and 0.75 quantile of 5. In essence, our procedure can pinpoint the collection of information about the shape of a distribution without assumptions about where the mass of the distribution is located.
In conclusion, we believe that eliciting quantiles with price lists is a simple, intuitive, and practical approach, especially when the research focus is on understanding particular aspects of participants’ real-valued subjective belief distributions. The flexibility of quantile elicitation, in contrast to the complexities and limitations associated with moments, makes it a superior choice in many research scenarios. Furthermore, the use of price list methodologies, as opposed to more complex scoring rules, further simplifies the elicitation process, making it more accessible to participants in complex scenarios. These benefits highlight the potential “behavioral incentive compatibility” of our methodology in addition to theoretical incentive compatibility (Danz et al., Reference Danz, Vesterlund and Wilson2022).
5. Proof-of-concept experiment
In this section, we present the design of our proof-of-concept experiment. We first give an overview and discuss the purpose of the experiment before turning to the finer details.
5.1. Experiment overview
The event that the participants considered in our experiment is the number of students who passed or failed a math task. We elicited three quantiles of the subjective belief distributions of the participants, 0.25, 0.50, and 0.75, as well as their belief about the probability that a randomly chosen student passed the math task. Under the assumption that a participant views the performance of each student on the math task as independent and has a point belief p about the probability that a randomly chosen student passed, their subjective belief about the number of students who passed should be binomial with mean  $20*p$. We refer to this as their mean belief below.
Using the methodology presented in this paper, we can compare the directly elicited shape of participants’ subjective beliefs (using the quantiles) to the implied binomial shape. We emphasize that our goal is not to compare the performance of eliciting quantiles with the performance of eliciting a probability or mean. Instead, our experiment is intended to demonstrate how eliciting quantiles using our methodology can provide a more nuanced view of participants’ entire subjective belief and potentially shed light on the underlying assumptions implying a binomial subjective belief. In addition, we randomly varied whether we elicited quantiles or the mean first. Using the two treatments, we can determine whether reporting the mean belief before or after quantile beliefs leads to greater consistency across the four elicitations.
5.2. Experiment details
Before the experiment, 20 Ohio State students completed a math task similar to the task developed in Niederle and Vesterlund Reference Niederle and Vesterlund2007. Each student was shown a sequence of five two-digit numbers. The students had five minutes to correctly calculate the sum of as many sets of two-digit numbers as they could. For each correctly answered math problem, they received  $\$1$. The students also received a
  $\$5$ show-up fee. The performance of these students on the math task is the basis of the main experiment.
We categorized each of the 20 students according to how many math problems they correctly answered. Table 1 shows the distribution of correctly answered math problems for the students. If a student correctly answered at least 13 math problems, we classified them as “passing” the math task. If they answered any number less than thirteen of the math problems correctly, we categorized them as “failing” the math task. We chose this categorization prior to running the experiment. All students who participated in the math task knew that their answers would be seen later by other participants, but did not know about the categorization of success. We chose not to disclose the categorization to the students in order to not change their performance goal on the task.
Distribution of correctly answered math problems for the 20 students in our experiment.

For the main experiment, we used the number of students who passed the math task as our subjective event of interest. Participants in the main experiment were also recruited through the Ohio State Experimental Economics Laboratory. Anyone who participated in the previous math task was excluded from participation in the main experiment. We chose to do both the math task and the experiment in person at the Ohio State laboratory so that the participants in the experiment would have some baseline facts they could use to form beliefs about the students’ performance in the math task. Experiences in Ohio State math classes or general perceptions of the math abilities of university students are facts that could be used by our participants to form their beliefs about other students’ performances on the prior math task.
The participants were first informed about the math task and given an example of the math problems. The participants then told us their beliefs about the students’ performance on the math task. Their beliefs were elicited through their switching-points on four separate multiple price lists (MPLs). Three of the four MPLs were quantile price lists targeted at the 0.25, 0.50, and 0.75 quantiles. The fourth MPL elicited participants’ beliefs about the probability that a randomly chosen student passed. This MPL is not part of our methodology but has been used extensively in experimental economics. It is based on the logic of the BDM mechanism originally proposed to elicit willingness-to-pay by Becker et al. Reference Becker, DeGroot and Marschak1964. The concept of using this method for eliciting beliefs was described by Savage Reference Savage1971 and first implemented by Grether Reference Grether(1981). In this context and to our knowledge, Holt and Smith Reference Holt and Smith2016 were the first to represent this BDM in the multiple price list format.
In our experiment, each MPL consisted of 21 rows. In all MPLs, a single switching-point was enforced. In each row, there were two options, Option A and Option B. Participants decided which of the two options they preferred in each row. The right-hand side of each quantile price list, or Option B, was constant. For the 0.25 quantile, Option B was “ $\$10$ with a
  $25\%$ chance” in each row. For the 0.50 quantile, Option B was “
 $\$10$ with a
  $50\%$ chance” in each row. For the 0.75 quantile, Option B was “
 $\$10$ with a
  $75\%$ chance”. The left-hand side, or Option A changed in each row. Option A in the first row of all three quantile price lists was “
 $\$10$ if ≤ 20 people passed.” In each row, the number of people who succeeded in the math task decreased by 1 down to “
 $\$10$ if 0 people passed” in the 21st row. An example of the 0.25 quantile price list is shown in Figure 5.
Screenshot of the 0.25 quantile price list used in our experiment

The fourth MPL elicited the participants’ beliefs about the probability that a randomly chosen student passed the math task. The right-hand side of this MPL, or Option B, was constant across all rows: “ $\$10$ if one randomly chosen subject passed.” The left-hand side, or Option A, changed in each row. Option A in the first row was “
 $\$10$ with a
  $100\%$ chance.” In each row, the probability that the participants received
  $\$10$ in Option A decreased by
  $5\%$ down to “
 $\$10$ with a
  $0\%$ chance” in the 21st row. The exact MPL used is shown in Figure 6. Since we use the probability elicited from this MPL to infer the mean beliefs of the participants, we refer to it as the mean MPL below.
Screenshot of the MPL from our experiment used to elicit beliefs about the probability a randomly chosen participant passed the math task

Participants were randomly assigned to one of two treatments that differed only in the order of the four MPLs. In the mean-first treatment, the mean MPL was shown first. In the mean-last treatment, the three quantile price lists were shown first. In both treatments, the order of the three quantile price lists was randomized at the participant level.
One of the four MPLs was randomly chosen to determine payment. For the randomly chosen MPL, a row was then randomly chosen. The participant’s choice in that row was used to determine the final payment. If the chosen option was winning  $\$10$ with a certain probability (Option B for quantile price list and Option A for mean MPL), a 100-sided die was rolled. If the number on the die was lower than or equal to the probability stated in that row, the participant won
  $\$10$. If the chosen option was winning
  $\$10$ depending on how the students performed in the math task (Option A for quantile price lists and Option B for mean MPL), the actual performance of the students was used to determine payment. For the three quantile price lists, if the number of participants who actually succeeded was less than or equal to the number stated in the row, the participant won
  $\$10$. For the mean MPL, a student was randomly chosen from the math task. If this student succeeded, the participant won
  $\$10$.
The math sessions took approximately 15 minutes, and the average payment was  $\$7.40$. A total of 158 participants were recruited for the main experiment. Seventy-one participants were randomly assigned to mean-first and 87 participants were randomly assigned to mean-last. The experiment took 10 minutes, and the participants received a
  $\$5.00$ show-up fee plus an average payment of
  $\$3.29$. The full experimental instructions can be found in the Online Appendix.
6. Results
In this section, we report the results of our experiment. We begin by discussing belief consistency, we then provide some summary data on the elicited quantiles, compare means approximated from quantile data to directly elicited means, and finally compare the the shape of distributions using our methodology to the binomial distributions constructed from the directly elicited means under the assumption of independence.
6.1. Consistency
We first examine whether the beliefs of each participant can be justified by some subjective belief distribution. In order for this to be true, the quantile beliefs of a participant must be monotonically increasing. This means that their 0.25 quantile is less than or equal to their 0.50 quantile, which is less than or equal to their 0.75 quantile. Since this must be true for our maximum entropy approximation (see Section 3.1) to work appropriately, we exclude participants who do not have monotonic beliefs from all analyses.Footnote 8 Of those with monotonic beliefs, we have also excluded participants who always chose the objective lottery in all rows of the three quantile price lists. This requires choosing a lottery with a  $75\%$ chance of winning
  $\$10$ over a guaranteed chance of winning
  $\$10$, which is an indication of misunderstanding.Footnote 9 We refer to beliefs that are not excluded as “consistent.”
In total,  $73\%$ of the participants have consistent beliefs. The proportion of participants with consistent beliefs is not significantly different between the mean-first and mean-last treatment.
  $69.01\%$ of the mean-first and
  $75.86\%$ of the mean-last participants have consistent beliefs. A chi-squared test for the difference of these proportions is not significant with a p-value of .346. It does not seem that allowing participants to report their mean first or last substantially changes their ability to report beliefs that are consistent with an increasing subjective CDF.
6.2. Summary data–quantiles
As our main motivation for the experiment is to demonstrate our methodology, we now report summary results for the three quantile price lists. A switching-point provides a range of possible quantile beliefs. In our quantile price lists, the difference between each row is one student. Thus, a switching-point in the 10th row represents a range of 10–11 for the relevant quantile. Figure 7 shows a summary of the beliefs of all participants for each quantile elicited. For each quantile and participant, instead of plotting the full range, we have chosen a single point within the range. The belief chosen is the point in the range that maximizes the entropy of the CDF approximation (see Section 3.1).Footnote 10 We use this throughout this section whenever we need a point estimate of a participant’s quantile belief. The shaded region of Figure 7 provides a 50% probability interval for the approximated CDFs. In other words, for any quantile,  $50\%$ of participants’ approximated CDFs fall within the shaded region.
Box plots for each of the elicited quantiles. The points used for each plot are the values of the quantiles in the relevant participant’s maximum entropy distribution. The shaded region represents the  $50\%$ probability interval for each quantile

The  $50\%$ probability regions for each quantile are almost completely distinct, with very little overlap. There is a substantial amount of consistency, especially at the aggregate level. Furthermore, most participants make choices indicating they have some subjective uncertainty about the task. Only
  $4\%$ of the participants have the same switching point in all three quantile price lists. Interestingly, the 0.75 quantile has a tighter range than the other quantiles. Most of the participants have a belief in the range of 14 to 16 for the 0.75 quantile. The interquartile ranges of beliefs elicited for the other two quantiles are double this size, with much wider whiskers.
6.3. Comparing distributions
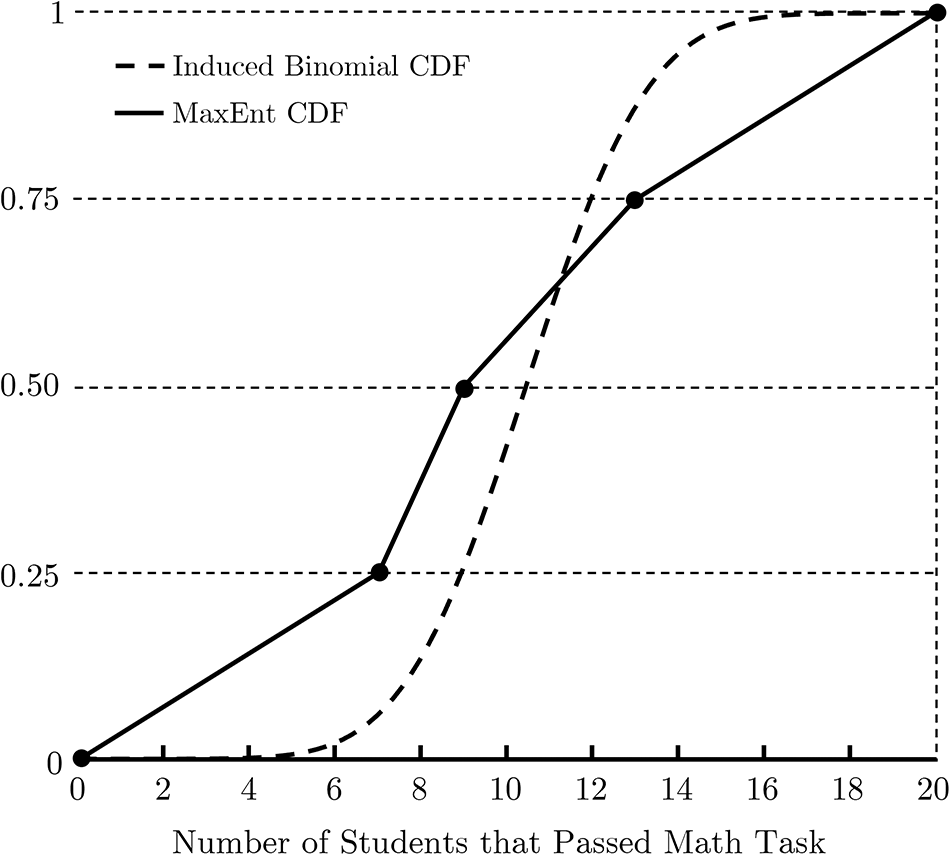
Using a participant’s elicited quantiles, we approximate their entire subjective belief distributions using the maximum entropy procedure presented in Section 3.1. We can compare this approximated CDF with the induced binomial distribution using their directly elicited mean. An example comparing the approximated CDF with the induced binomial CDF for a participant in our data is shown in Figure 8.
The approximated (maximum entropy) subjective belief distribution (solid line) using the quantile price lists and the induced binomial CDF (dotted line) using the mean MPL for Participant Id 23 in our experiment

We can compare these distributions in different ways. First, we focus on comparing the means of the approximated and induced binomial distributions. Recall that the directly elicited mean is determined from the mean MPL by assuming that a participant believes that student performance is independent. Under this assumption, the mean number of students who pass is twenty times the elicited probability that a randomly chosen student passes. The approximated mean is instead calculated from the approximated subjective belief distribution using Equation (2). Figure 9 shows a histogram of the difference between the elicited mean and approximated mean for each participant in the two treatments.
Histograms of the difference between the elicited mean (using the mean MPL) and the approximated mean (using the quantile price lists and maximum entropy approximation) for each participant by treatment

For the mean-first treatment, the average difference is -2.12, and for the mean-last treatment, the average difference is -1.29. The treatments are not significantly different in this respect nor in terms of the distance (average squared difference) between the elicited and approximated means.Footnote 11 However, there is a significant but slight tendency for the approximated mean to underestimate the directly elicited mean. The average pooled difference (-1.64) is significantly different from zero.Footnote 12
We now compare the shape of the induced binomial distribution with the directly elicited quantiles and the maximum entropy approximation constructed using these quantiles. Recall that, assuming a participant views the performance of each student on the math task as independent and has a point belief about the probability that a randomly chosen student passed, their belief about the number who passed should be binomial. However, even if participants believe that the performance of students is independent, their actual subjective beliefs may be flatter than binomial if they have higher-level uncertainty. For example, they may be uncertain about how difficult the math task really is. This would induce a distribution rather than a point belief about the probability that a randomly chosen student passed.Footnote 13
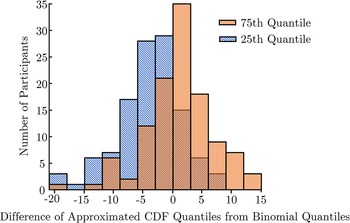
We first compare only our directly elicited 0.25 and 0.75 quantiles with the induced binomial distribution quantiles for each participant. Figure 10 shows the histograms of these differences. We find that the 0.25 quantile is below and the 0.75 quantile is above the binomial baseline for  $44\%$ of the participants. This corresponds with a strong tendency for participants to have “flatter” than binomial beliefs. This pattern also holds between treatments.Footnote 14
Histograms of the difference between the elicited 0.25 and 0.75 quantiles and the respective quantile of the induced binomial distribution for each participant. The value used for the elicited quantile of each participant is the value in their maximum entropy distribution

To investigate the apparent flatness of beliefs further, we now compare the distances between the approximated (maximum entropy) CDFs and the induced binomial CDFs. To measure this distance, we numerically integrate the squared horizontal difference between the CDFs. If the approximated CDFs are close to binomial, the distance will be close to 0. For reference, a perfectly linear approximated CDF with the three elicited quantiles at 5, 10, and 15, respectively, has a distance of approximately 13.26 from a binomial distribution with the same mean. The theoretical upper bound on the distance of these distributions is 400.
We do not find evidence that the timing of the mean MPL affects our distance measure between the approximated and induced binomial distributions.Footnote 15 Because of this, Figure 11 shows a histogram of this distance measure for each participant, pooled across treatments.
Histogram of the distance (integral of squared horizontal difference) between the maximum entropy CDF (approximated from the elicited quantiles) and the binomial CDF (induced by the probability elicited in the mean MPL) for each subject pooled across treatments

We find that the majority of participants have a distance between their approximated and induced binomial distributions that is less than 35. However, there is a large spike ( $23.5\%$ of participants) between 10 and 14, suggesting that many participants have approximated CDFs that are close to linear.Footnote 16 This suggests that distributions approximated from the elicited quantiles are flatter and more linear than the implied underlying binomial belief distribution. This is consistent with participants having higher-level uncertainty about the difficulty of the math task.
Together, these results show that eliciting just a mean belief may not be sufficient in this context to understand the entire subjective belief distribution. Ultimately, eliciting different quantiles of the belief distribution gives a fuller understanding of a participant’s beliefs, and we hope our analysis and discussion in this section demonstrates how our methodology can help researchers elicit richer information about beliefs that might be useful in their research.
7. Discussion
In this paper, we propose a robust and straightforward methodology for eliciting subjective real-valued beliefs. Our methodology allows practitioners to pinpoint aspects of beliefs that are relevant to their research question and to build a picture of participants’ entire belief distributions by eliciting several quantiles.
Given the flexibility of this methodology, there are potential applications in many areas of economics. One potential application is to obtain the tails of a belief distribution. In many situations, models predict similar central tendency but large differences in tails. Using our methodology, the tails of the distributions can be easily elicited to test these hypotheses. For example, beliefs about men and women are often compared on average, where important differences may be in terms of the shape or variances of distributions. The greater male variability hypothesis suggests that men are often more variable across traits than women (Thöni & Volk, Reference Thöni and Volk2021, Thöni et al., Reference Thöni, Volk and Cortina2021). Since variance (as a moment) is not elicitable on its own (see Lambert et al., Reference Lambert, Pennock and Shoham2008), our methodology likely represents the simplest way to test hypotheses in terms of beliefs about this type of difference.
Another potential application is to obtain richer beliefs that can be used for forecasting. For example, two experts might have beliefs about future inflation that are similar in terms of their mean but significantly different in terms of shape. Our methodology allows researchers to capture the full knowledge and uncertainty of experts on important indicators. Similarly, the potential of extreme events often drives-decision making in agriculture and insurance, and our methodology allows researchers to easily learn about these extreme beliefs by focusing on quantiles in the tail.
Supplementary material
The supplementary material for this article can be found at https://doi.org/10.1017/eec.2025.10023.
Statements and declarations
The authors declare that they have no relevant or material financial or nonfinancial interests that relate to the research described in this paper.
Acknowledgements
The authors thank Andrew Dustan, Paul J. Healy, Charles Holt, Samir Huseynov, Kristine Koutout, seminar participants at UC Santa Barbara, Loyola Marymount, and the 2023 ESA North American Meetings, and two anonymous referees for their valuable comments and feedback. The replication material for the study is available at http://doi.org/10.17605/osf.io/gu8nt


 Open access