





Impact statement
The popularization of AI-based tools such as ChatGPT presents an interesting opportunity for the collection of data on plastics and polymer consumption. Accurate plastics and polymer consumption accounting is of particular interest as national and international policies aimed at addressing the plastics waste problem (such as the global plastic treaty) are currently under development. In this study, we test whether generative AI models can be used to produce estimates comparable in accuracy to experts on plastics in products, and to quantify the annual consumption of eight polymers in Norway. Generative AI was not found to be a suitable replacement for subject matter expertise, as models produced unsuitable estimates for plastic accounting tasks. This is likely due to a lack of high-quality data on plastics and limitations inherent to using generative AI, such as its inability to quality assure results. Generative AI is therefore not currently a substitute for subject matter expertise for collecting data and estimates related to plastics accounting to reach policy objectives, but has potential in the future.
Introduction
Public concern over the documented and perceived risks of plastic pollution has catalysed the regulation of plastics production and consumption nationally (e.g. Sweden’s National Plastic Action Plan, New Zealand’s single-use plastics ban) and internationally (i.e. the currently debated global plastic pollution treaty). These regulations aim to reduce the rate of plastic emissions to the environment, where current projections indicate annual plastic waste releases to aquatic systems alone are to reach 53 million tonnes by 2030 (Borrelle et al., Reference Borrelle, Ringma, Law, Monnahan, Lebreton, Mcgivern, Murphy, Jambeck, Leonard, Hilleary, Eriksen, Possingham, De Frond, Gerber, Polidoro, Tahir, Bernard, Mallos, Barnes and Rochman2020). To develop informed policies that reduce, restrict or ban the production and/or consumption of specific plastic polymers, decision makers require detailed information about the amount of plastic currently in use and its polymer composition.
Several studies have attempted to quantify the sector-based production and consumption of different plastic polymers across the wider European Union (Kawecki et al., Reference Kawecki, Scheeder and Nowack2018, Reference Kawecki, Wu, Gonçalves and Nowack2021; Eriksen et al., Reference Eriksen, Pivnenko, Faraca, Boldrin and Astrup2020; Amadei et al., Reference Amadei, Sanyé-Mengual and Sala2022) specific European countries, including Norway (Abbasi et al., Reference Abbasi, Hauser, Baldé and Bouman2023), Austria (Van Eygen et al., Reference Van Eygen, Feketitsch, Laner, Rechberger and Fellner2017) and Switzerland (Kawecki and Nowack, Reference Kawecki and Nowack2019) as well as globally (Geyer et al., Reference Geyer, Jambeck and Law2017; Houssini et al., Reference Houssini, Li and Tan2025). However, few studies distinguish between polymer type when quantifying the volumes of plastics (Mutha et al., Reference Mutha, Patel and Premnath2006; Van Eygen et al., Reference Van Eygen, Feketitsch, Laner, Rechberger and Fellner2017) with most studies focusing on tracing the volumes of single polymer types in an economy (Kuczenski and Geyer, Reference Kuczenski and Geyer2010; Ciacci et al., Reference Ciacci, Passarini and Vassura2017). Data gaps on plastic packaging are particularly notable given it accounts for 44% of global plastics use (Geyer et al., Reference Geyer, Jambeck and Law2017) and represents 60% of plastic waste generated in Europe (Pat Jennings et al., Reference Pat Jennings, Ed Cook, Burlow, Kosior, Thomas, Riise, Gysbers, Sam Reeve and Lerpiniere2018; Plastics Europe, 2022). Furthermore, multi-layer plastics (MLPs), comprising individual layers with different polymer types, paper and aluminium, are increasingly used in packaging applications for some consumer goods (e.g. food packaging) to provide essential properties like oxygen barriers, moisture resistance, strength and extended shelf life. This added material complexity makes it even harder to accurately estimate the usage of different polymer types in packaging.
The launch of Open Artificial Intelligence’s (AI) tool ChatGPT (for Generative Pre-trained Transformer) in November 2022 has led to a growing interest in the possibilities that AI offers for advancing academic research (Rahman et al., Reference Rahman, Terano, Rahman, Salamzadeh and Rahaman2023). Generative AI models such as the GPTs provided by Open AI have a deep neural network architecture, with several layers of pre-trained transformers on a vast amount of text. The models have subsequently been improved upon by using reinforcement learning from human feedback. Furthermore, scientists have experimented with fine-tuning generative AI models to perform tasks more accurately than a zero-shot approach (i.e. no additional training data provided) (Dunn et al., Reference Dunn, Dagdelen, Walker, Lee, Rosen, Ceder, Persson and Jain2024), even demonstrated problem-solving abilities in line with average human respondents (Orrù et al., Reference Orrù, Piarulli, Conversano and Gemignani2023). Fine-tuning large language models (LLMs), which are initially trained on large amounts of data on a wide range of topics, involves providing pre-trained LLMs task-specific training datasets. This process may improve model accuracy and prime models to produce outputs in specific formats (e.g. text vs. numeric). Fine-tuning approaches include full fine-tuning which involves re-training an LLM with broad datasets, parameter-efficient fine-tuning in which a small subset of parameters are adjusted and instruction fine-tuning where a model is provided input–output pairs to align model outputs with expectations. Fine-tuned LLMs such as GPT can also accurately perform complex tasks, such as inferring results from published studies outside the original training set (Rysanek et al., Reference Rysanek, Nagy, Miller and Dilsiz2023), evaluating responses to medical questions(Johnson et al., Reference Johnson, Goodman, Patrinely, Stone, Zimmerman, Donald, Chang, Berkowitz, Finn, Jahangir, Scoville, Reese, Friedman, Bastarache, van der Heijden, Wright, Carter, Alexander, Choe, Chastain, Zic, Horst, Turker, Agarwal, Osmundson, Idrees, Kiernan, Padmanabhan, Bailey, Schlegel, Chambless, Gibson, Osterman and Wheless2023), protein design (Strokach and Kim, Reference Strokach and Kim2022) and code generation (Feng et al., Reference Feng, Vanam, Cherukupally, Zheng, Qiu and Chen2023). Despite demonstrating impressive capabilities in certain areas, the capabilities of generative AI models remain limited or poor in others. Some of the challenges associated with generative AI models including the production of ‘hallucinations’ (where models fabricate data, results or information) or being outperformed by experts (e.g. compared to clinicians) (Singhal et al., Reference Singhal, Azizi, Tu, Mahdavi, Wei, Chung, Scales, Tanwani, Cole-Lewis, Pfohl, Payne, Seneviratne, Gamble, Kelly, Babiker, Schärli, Chowdhery, Mansfield, Demner-Fushman, Agüera y Arcas, Webster, Corrado, Matias, Chou, Gottweis, Tomasev, Liu, Rajkomar, Barral, Semturs, Karthikesalingam and Natarajan2023). Although generative AI has the potential to serve as a tool for research, the limitations of generative AI models need to be explored and described, providing a platform for future targeted development.
AI models provide a valuable opportunity to address plastics related problems. This includes automated plastic waste identification using sensor-enabled waste sorting methods and AI models (Lakhouit, Reference Lakhouit2025; Son and Ahn, Reference Son and Ahn2025), which may be used for improved sorting of materials for recycling and waste management of plastics. In some cases, AI models performed well at classifying plastics waste even with a zero-shot approach where minimal or no training data were provided (Mewada et al., Reference Mewada, Grua, Eising, Denny, Van de Ven and Scanlan2025; Ranjbar et al., Reference Ranjbar, Ventikos and Arashpour2025). AI-based approaches are also being rapidly applied to the field of materials informatics to process large datasets and classify the composition of materials such as plastics by polymer type (Sivan et al., Reference Sivan, Satheesh Kumar, Abdullah, Raj, Misnon and Jose2024). Trained LLMs have also been used for extracting information on specific plastic categories (Kumar et al., Reference Kumar, Bakshi, Ramteke and Kodamana2023) to reduce the resources needed to find precise information from the rapidly growing field of plastics research.
To assist the Norwegian government in achieving the ambitious strategy for reducing plastic waste it outlined in 2021 (The Norwegian Ministries, n.d.), it is highly relevant to improve Norwegian plastic accounting. The plastic waste strategy requires the use of accurate statistics for baselining the current volumes of different polymers flowing through the Norwegian economy. Although there have been recent efforts to quantify the volumes of different plastic polymers circulating in the Norwegian economy (Abbasi et al., Reference Abbasi, Hauser, Baldé and Bouman2023), these studies are based on statistics that are heterogeneous and of varying quality (Berge et al., Reference Berge, Landsem and Skjerpen2023), while the large data gaps necessitate the use of data that is not fit for purpose. Statistics Norway, the official Norwegian governmental statistics agency, recognized this gap and employed experts to test methodological approaches for collecting data for plastics accounting, producing a dataset on the percent composition of different consumer products by plastic (Berge et al., Reference Berge, Landsem and Skjerpen2023). However, this work was resource intensive and resulted in a dataset that is non-comprehensive as it does not cover all categories traded in the Norwegian economy. Beyond the government, environmental organizations collect data on plastic waste generation in Norway. However, these data are collected under formal agreements with private companies, resulting in them typically requiring data aggregation (e.g. to the national level) prior to use, not made openly available, not representative of random trash sampling and characterization (i.e. ‘plukkanlyse’) and generally making them unsuitable for plastic accounting. Private companies that generate raw plastics and plastic products are hesitant to publicly disclose data on the generation or disposal of plastic. This hesitancy has led a paucity of easily available and usable data for plastic accounting in Norway. As collecting and further collating primary data requires significant manual work, generative AI tools represent a possible approach to facilitate the collection of data from vast, publicly available pre-training datasets (e.g. PlasticEurope, MatWeb, PoLyinfo). This study explores whether generative AI can be considered a reliable method for addressing plastic data gaps in polymer accounting (e.g. Kawecki et al., Reference Kawecki, Scheeder and Nowack2018, Reference Kawecki, Wu, Gonçalves and Nowack2021). We tested whether estimates from generative AI models can be used to retrieve numeric estimates or perform basic analyses to provide estimates where fit-for-purpose data are not available. Two different tasks related to plastics accounting were used to assess the quality of estimates from fine-tuned generative AI models. First, AI-based model estimates of the material composition of different plastic products by polymer type were compared to estimates provided by experts. Second, model estimates of the annual volumes of different polymers used in packaging in the Norwegian economic sectors were compared to those collected by experts. These tasks were selected as they are both resource and time-consuming for experts. If methods that rely on generative AI can produce comparable estimates, the amount of resources necessary to produce national estimates of plastics consumption may therefore be reduced.
Methods
Open AI’s model GPT-3.5 turbo (OpenAI, 2024) was used to produce estimates of (i) the plastic fraction in products and (ii) the annual volumes of different polymers used in packaging in the Norwegian economy. The AI-based estimates were then compared with those collected from available literature by experts. GPT-3.5 turbo-1106 was accessed in May 2024 through the openai python package (v. 0.18.0). The models were fine-tuned using a parameter-efficient fine-tuning approach by providing training datasets to improve the accuracy of the results. Instruction fine-tuning prompts were also initially explored through informal testing in ChatGPT, resulting in the test prompts (see Supplementary Table S1 for prompts). Hyper-parameter tuning involves changing model parameters, such as number of times a model is trained, to test for changes in model performance. Here, we tested whether increasing the number of epochs (i.e. full cycles of training the model during fine-tuning) improved model estimates (see Supplementary Table S1 for hyper-parameter specifications). As larger training datasets are generally assumed to increase the accuracy of estimates from neural networks (Foody et al., Reference Foody, McCulloch and Yates1995; Alwosheel et al., Reference Alwosheel, van Cranenburgh and Chorus2018), results from the models trained using different fine-tuning dataset sizes were compared. Two datasets for fine-tuning were created for each task by randomly dividing reference datasets (i.e. data collected from the literature by experts) into 75% (large) and 25% (small) subsets of the original data. As the performance of fine-tuned LLMs may be impacted by the size of training datasets, the training set sizes used in this study were selected to compare the performance of models with a training set larger and smaller than 50% of the total dataset (see Kumar et al., Reference Kumar, Sharma and Bedi2024). The size of training datasets was selected to be higher than in other studies (i.e. circa 20% in Latif and Zhai, Reference Latif and Zhai2024) as it has already been established that GPT has better performance at tasks related to knowledge querying than tasks related to interpreting numeric inputs (Hanna et al., Reference Hanna, Liu and Variengien2023).
Accuracy (the proportion of correct predictions, i.e., both true positives and true negatives among total number of predictions), precision (the proportion of true positive among predicted positives) and sensitivity (the proportion of true positives among actual positives, also known as ‘recall’) were calculated for each model to assess whether increasing the training dataset size or number of epochs improved model performance. All code and data for reproducing analyses are available under a CC BY-NC-SA 4.0 license (see Lara Veylit/Plasticine database GitLab: https://gitlab.sintef.no/Lara.Veylit/plasticine-database).
Data description
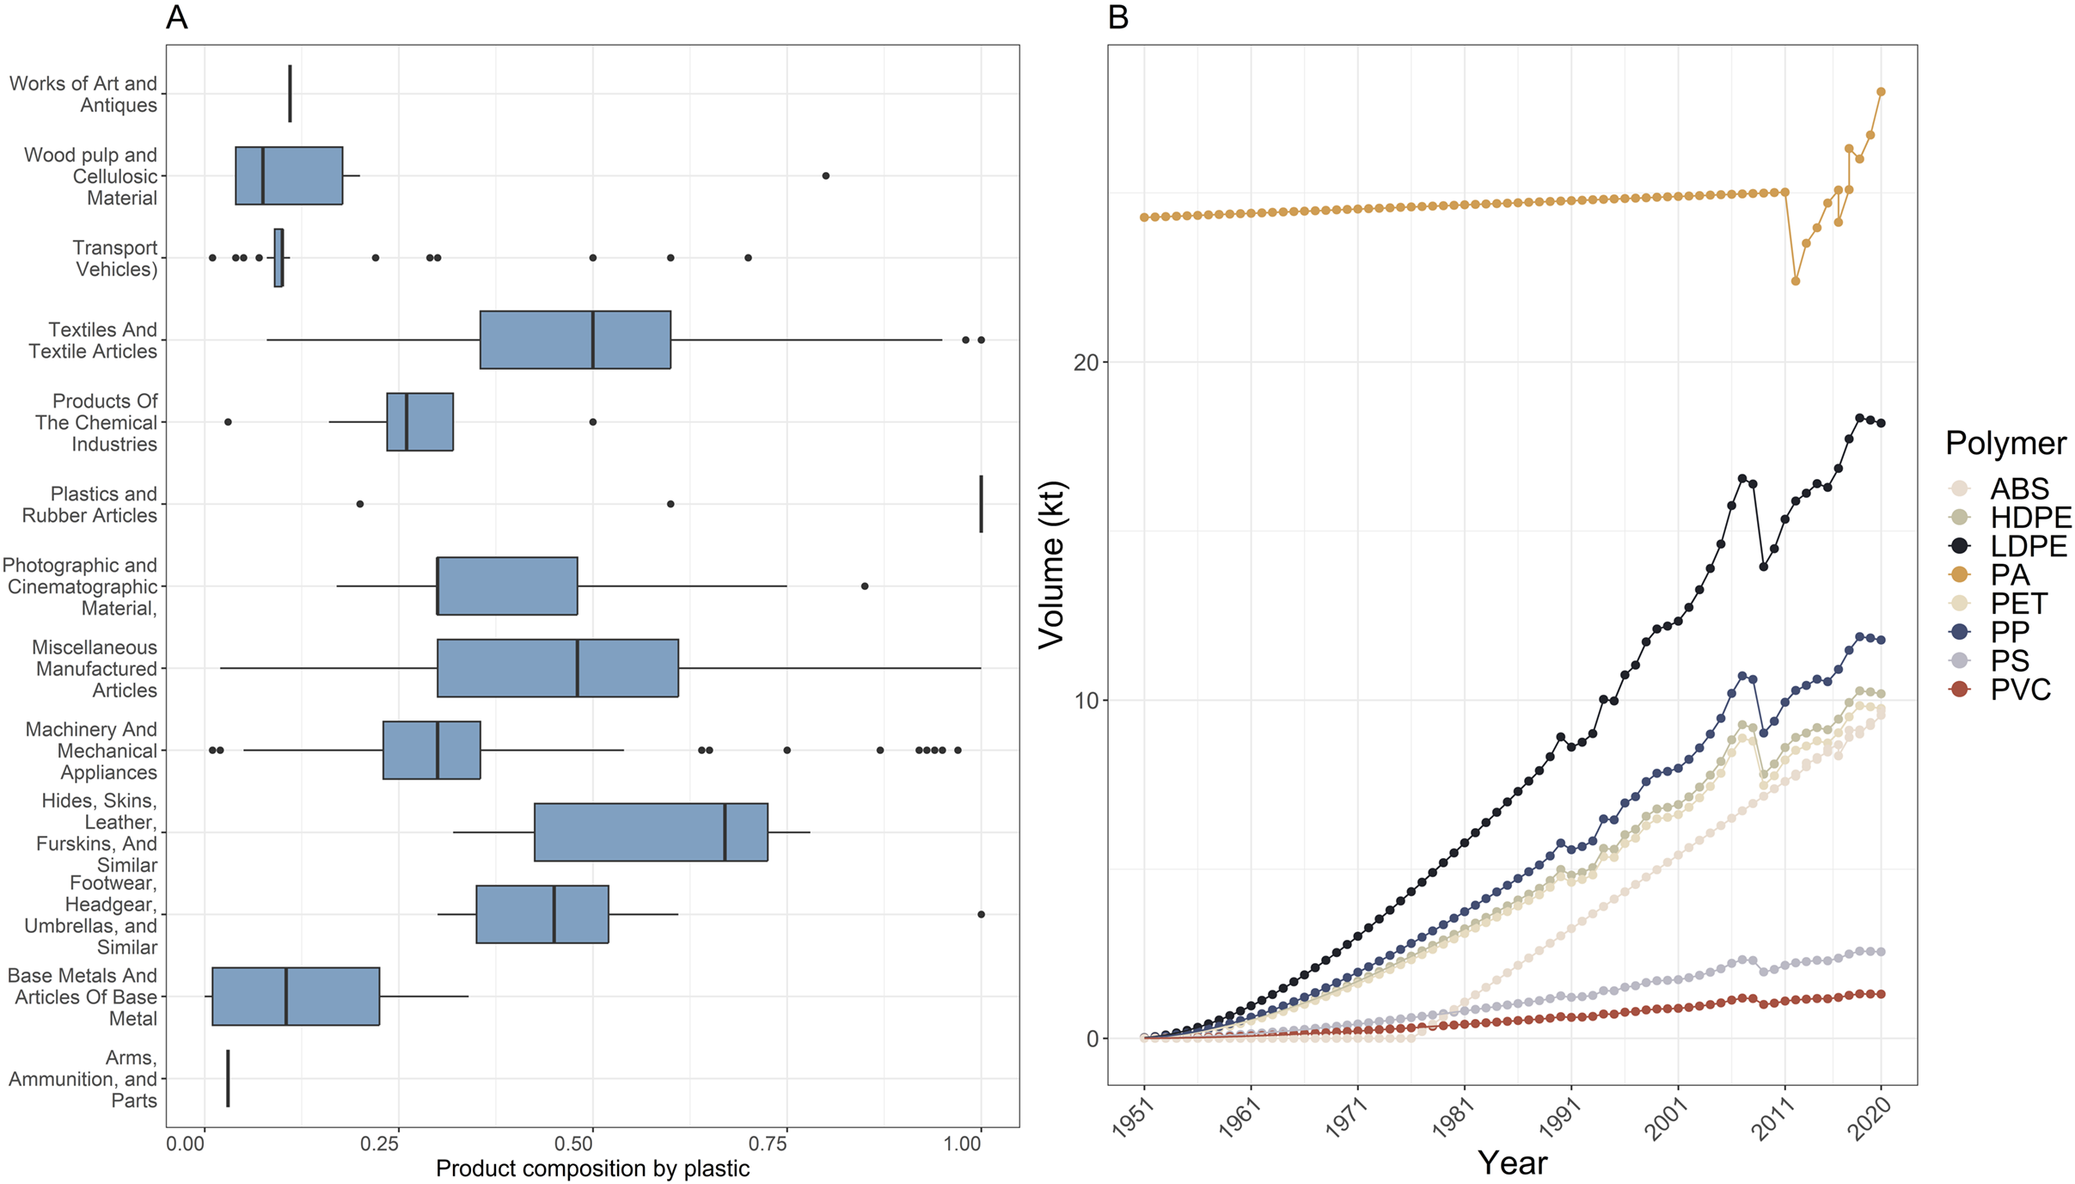
Separate datasets collected by experts were used to train GPT for the two tasks. The first task assessed whether fine-tuned models produce estimates of the proportion of plastic in products imported in Norway or exported by Norway that were comparable to values determined by experts. Due to the ubiquity of plastics and an ability to interpret codes used to standardize the classification of traded products (e.g. Combined Nomenclature codes), the task of assessing the composition of plastic versus other materials requires subject matter expertise. Experts from Statistics Norway (Statistisk Sentralbyrå; SSB) recently produced data on the composition of 946 consumer products imported by Norway (Berge et al., Reference Berge, Landsem and Skjerpen2023). Data on the composition of 13 categories of products ranging [0,1] were provided. The list of products are classified by Harmonized System (HS) codes and is limited to a small number of product categories, or HS code chapters (e.g. ‘Textiles and Textile Articles’, ‘Plastics and Rubber Articles’), due to the large amount of time and effort needed by experts to produce these estimates (Berge et al., Reference Berge, Landsem and Skjerpen2023). The dataset produced by experts at SSB was used as the reference dataset (Figure 1A) and for model fine-tuning. It is important to note that SSB released this dataset in 2023, while the knowledge cutoff for GPT 3.5-turbo is September 2021. Thus, GPT 3.5-turbo did not have access to the validation dataset before fine-tuning. Training datasets included official descriptions of each HS code (e.g. ‘Textile machinery; for extruding, drawing, texturing or cutting man-made textile materials’; see Supplementary Table S3).
Data collected by experts used to fine-tune GPT and compared to model outputs as reference data. Data on the proportion of imported products (grouped into product categories) containing plastic are provided by Statistics Norway (A), while data on the annual volumes of polymers in use in Norway were collected from the literature (B).

Figure 1. Long description
Panel A is a horizontal box plot titled Product composition by plastic. The x-axis ranges from 0.00 to 1.00. Categories on the y-axis from top to bottom include Works of Art and Antiques, Wood pulp and Cellulosic Material, Transport Vehicles, Textiles and Textile Articles, Products of The Chemical Industries, Plastics and Rubber Articles, Photographic and Cinematographic Material, Miscellaneous Manufactured Articles, Machinery and Mechanical Appliances, Hides, Skins, Leather, Furskins, and Similar, Footwear, Headgear, Umbrellas, and Similar, Base Metals and Articles of Base Metal, and Arms, Ammunition, and Parts. Textiles and Hides show the highest median plastic proportions near 0.50 and 0.70 respectively, while Works of Art and Arms show near zero.
Panel B is a line graph showing Volume in k t on the y-axis from 0 to over 20, and Year on the x-axis from 1951 to 2020. A legend identifies eight polymers. P A (polyamide) maintains a high, steady volume around 25 k t with a sharp dip and recovery between 2011 and 2020. L D P E (low-density polyethylene) shows a steep linear increase from 0 in 1951 to nearly 20 k t by 2020. P P (polypropylene) and H D P E (high-density polyethylene) follow similar upward trajectories reaching approximately 12 k t and 10 k t. P S (polystyrene), P E T (polyethylene terephthalate), A B S (acrylonitrile butadiene styrene), and P V C (polyvinyl chloride) show lower, more gradual increases, all remaining below 5 k t.
The second task assessed the quality of model outputs for plastic accounting by estimating the volume of the different polymers in plastic packaging in use in the Norwegian economy between 1951 and 2020. Data were collected for eight polymer groups: polypropylene (PP), acrylonitrile butadiene styrene (ABS), polyvinyl chloride (PVC), polystyrene (PS), high-density polyethylene (HDPE), low-density polyethylene (LDPE), polyethylene terephthalate (PET) and polyamide (PA). Training data on polymers in plastic packaging were either sourced from the literature or predicted using regressions (Figure 1B; see Supplementary Table S4 for the full dataset). Where estimates for a polymer in a single year were found in the literature, the proportion of Norwegian packaging waste of a given polymer was calculated and multiplied by Norway’s volume of plastic packaging consumption for that year (data available from 2012 to 2020) (Eurostat, 2023). The implicit assumption is that the polymer composition of plastic packaging has not changed over time, which may lead to under- or over-estimations. For years where no estimates were found in the literature, estimates were predictions from linear regressions. Linear regressions were used following the assumption that the consumption of plastics has increased linearly over time. This is an assumption based on the trend of increasing consumption of plastics which has been applied for future scenario predictions of plastic consumption in similar economies (i.e. Germany; see Patel et al., Reference Patel, Jochem, Radgen and Worrell1998).
The quality of reference data collected for validating model estimates was assessed using a pedigree matrix, which accounted for geographical, temporal and material representativeness of the data, as well as source reliability (Supplementary Table S2). In many cases, the primary source of data was not provided, thus it was not possible to provide a quality score for each category. As a result, a single holistic score is provided rather than a quality score in each category.
Estimating the material composition of products
The aim of this task was to assess whether GPT produced reliable estimates of the proportion of plastic in a product through retrieving values from pre-training data or extrapolating estimates informed by GPT’s large knowledge base. In addition to testing how accurate numeric estimates of product material composition were, the model performance was tested for accurately classifying products as containing plastic (i.e. estimated proportion of a product that is plastic >0). One-sample z tests were used to test whether differences between average model plastic composition and validation data across product categories were significantly different than zero.
Estimating volumes of polymers used in plastics packaging
To assess whether GPT produced estimates that were as reliable as those collected through a literature review by experts, the model was trained with data on annual estimates for the consumption of the eight polymer groups. GPT was prompted to estimate values between 0 and 30 kt, as the maximum volume of any polymer in the reference dataset produced by experts is 27.99 kt.
Results
Estimating the material composition of products by plastic
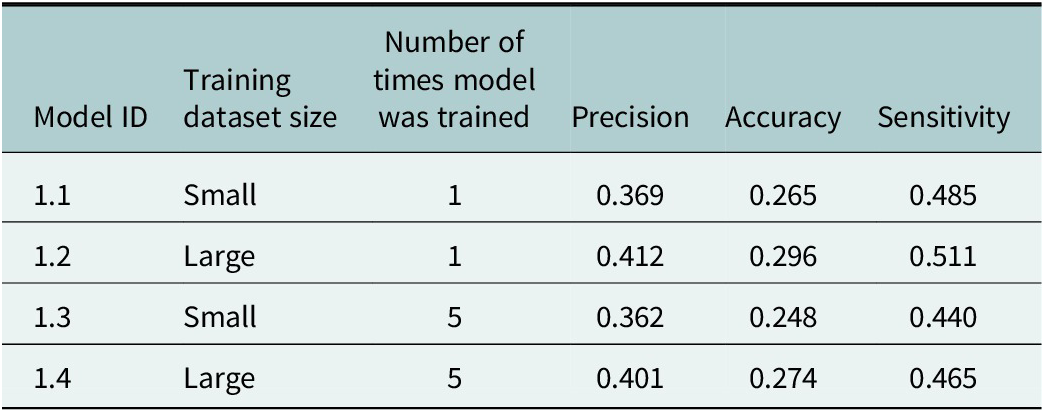
Numeric estimates from fine-tuned GPT models (models 1.1–1.4) were used to estimate the composition of products by plastic differed from the reference dataset (see Supplementary Figure S1 for estimates from each model and Supplementary Figure S2 for residuals plots). The model with the highest accuracy and sensitivity (model 1.2) was trained with the large training dataset, with the model training process being conducted once (Table 1). The model with the highest precision (model 1.4) was also trained with the large training dataset, and the model was trained five times (Table 1). In both cases, increasing the size of the training dataset when the model was trained only once increased the models’ precision (Δ0.043), accuracy (Δ0.001) and sensitivity (Δ0.026; see Table 1). Increasing the number of epochs for models trained with the small dataset (model 1.1 vs. 1.3) led to a slight decrease in the precision, accuracy and sensitivity of models (precision = Δ0.007, accuracy = Δ0.017, sensitivity = Δ0.045).
Precision, accuracy and sensitivity values for each fine-tuned model used to estimate the percent composition of products by plastic

Table 1. Long description
The table consists of six columns: Model I D, Training dataset size, Number of times model was trained, Precision, Accuracy, and Sensitivity.
* Model 1.1: Small dataset, trained 1 time. Precision 0.369, Accuracy 0.265, Sensitivity 0.485.
* Model 1.2: Large dataset, trained 1 time. Precision 0.412, Accuracy 0.296, Sensitivity 0.511.
* Model 1.3: Small dataset, trained 5 times. Precision 0.362, Accuracy 0.248, Sensitivity 0.440.
* Model 1.4: Large dataset, trained 5 times. Precision 0.401, Accuracy 0.274, Sensitivity 0.465.
Overall, models trained on large datasets (1.2 and 1.4) show higher precision, accuracy, and sensitivity than those trained on small datasets. Increasing the number of training sessions from 1 to 5 resulted in a slight decrease across all three performance metrics for both dataset sizes.
Note: In calculating these metrics, positive values included estimates within ±0.25 of the reference value (i.e. plastic composition value for a given HS code provided by experts). The range of values is between 0 and 1 for precision, accuracy and sensitivity, with larger values denoting better precision, accuracy and sensitivity.
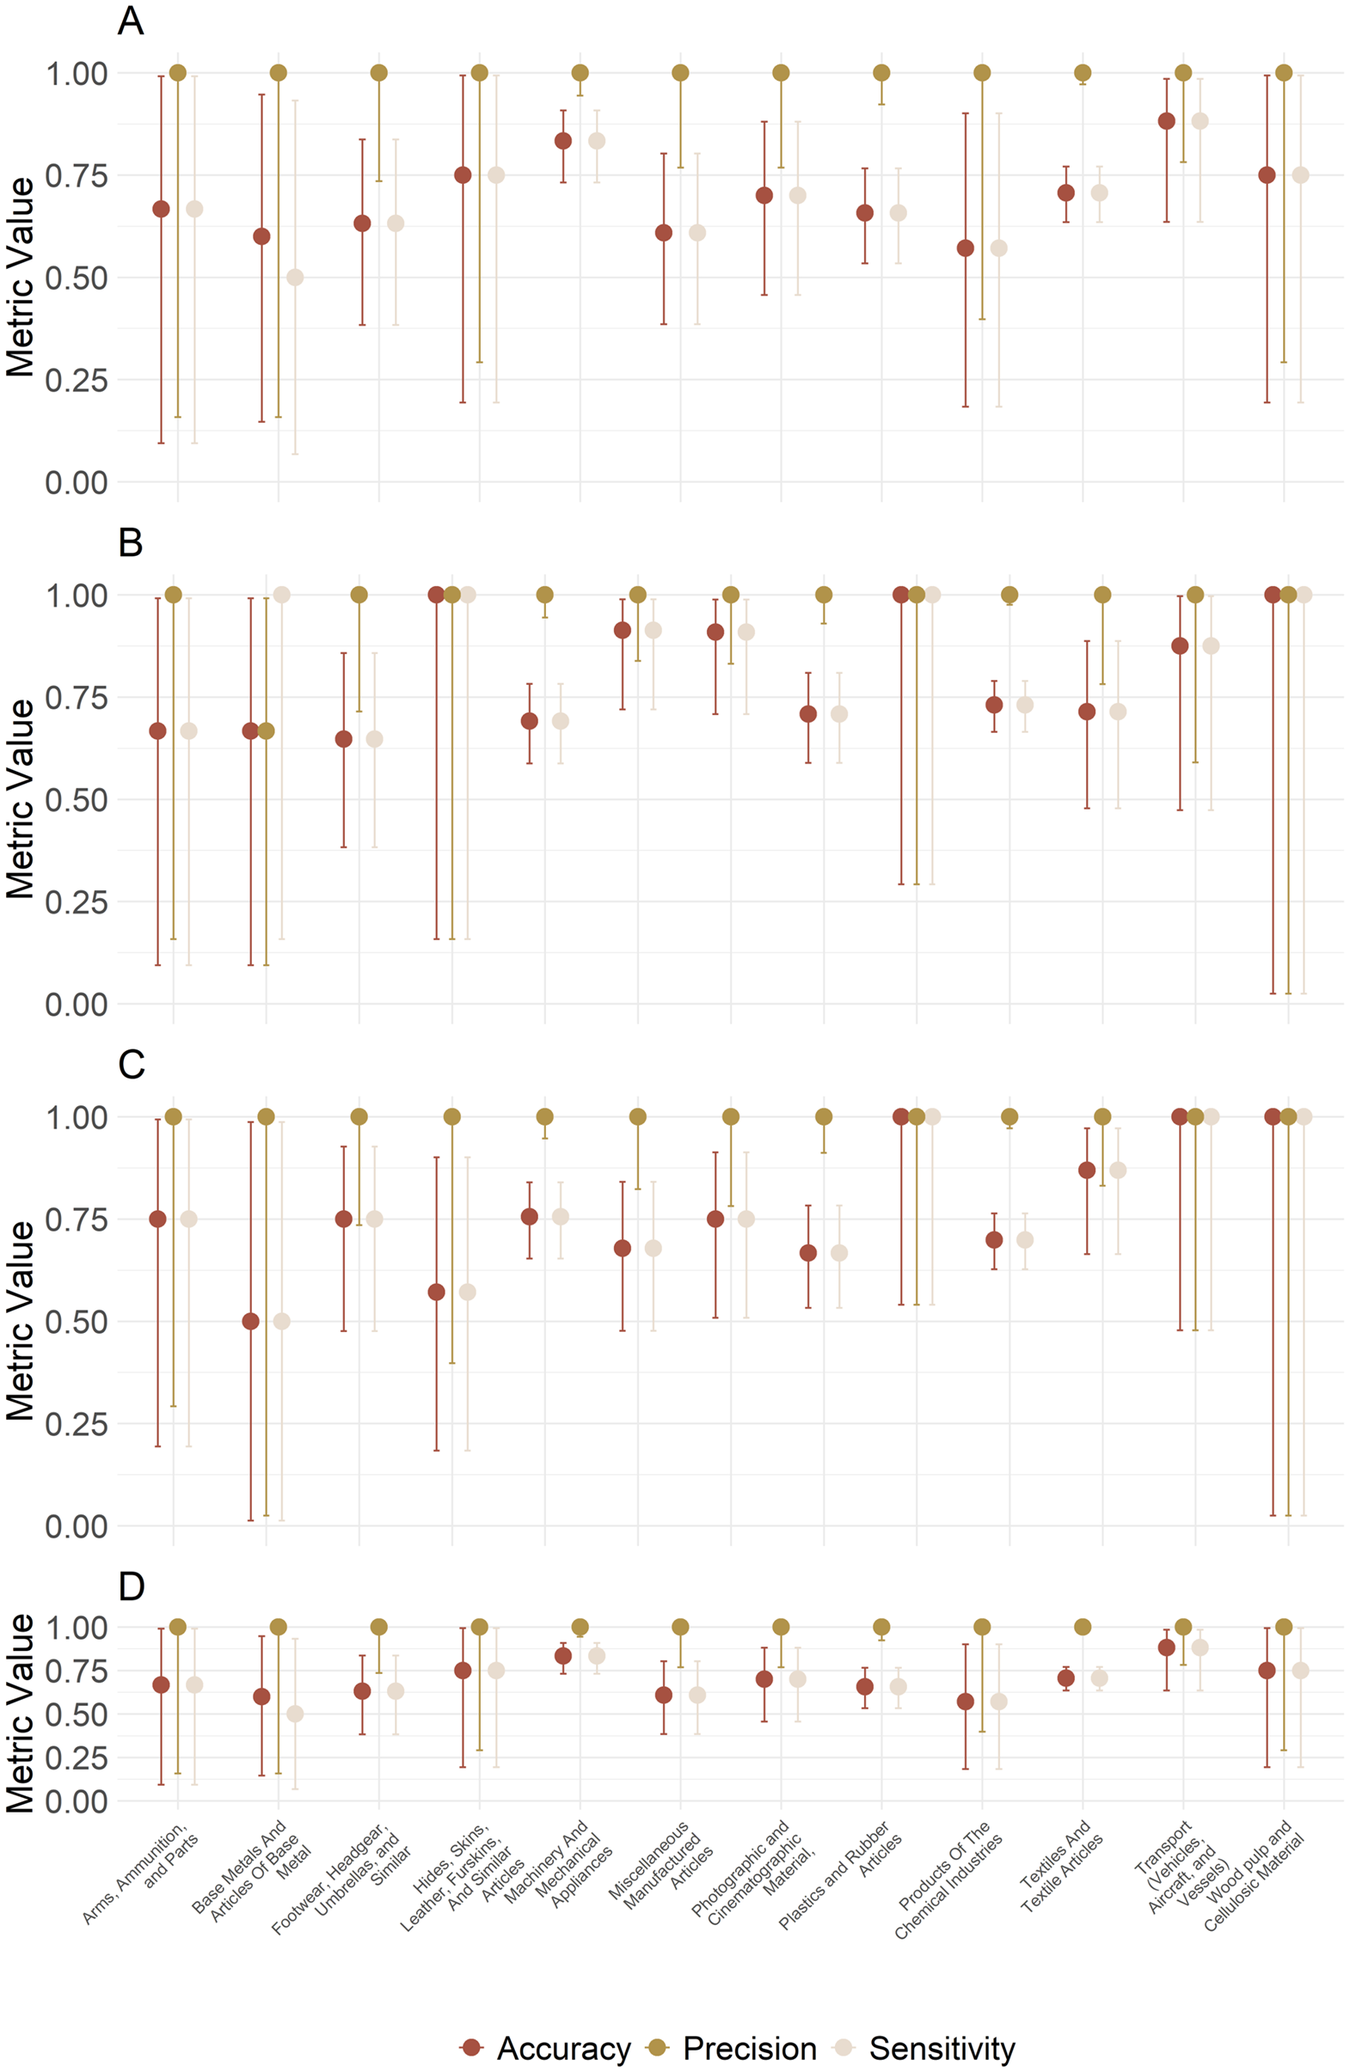
When results from the models were binned in binary classifications (i.e. ‘containing plastic’ where models estimated the proportion of plastic in products was >0 and therefore binned in the category ‘containing plastic’, or 1. Where models estimated the proportion of plastic in products as 0, the estimate was binned in the category ‘not containing plastic’, or 0), the overall model performance improved (Figure 2). For example, models 1.1–1.4 were highly accurate at estimating which products contained plastics in the product category ‘Plastics and Rubber Articles’ (Figure 2A–C, also see Supplementary Figure S1A–C).
Accuracy (i.e. proportion of model predictions which matched reference data where models correctly detected products did or did not contain plastic), precision (the proportion of plastic containing products from each model) and sensitivity (estimates of the composition of products by plastic from models >0, indicating products contain plastics, among products that contained plastic in the reference dataset). Fine-tuning of the models shown in A and C was conducted with small datasets on the composition of products by plastics, while fine-tuning of models in B and D was conducted with large datasets. The models in A and B were trained one time, while the models in C and D were trained five times. The 95% confidence intervals (calculated using the Clopper–Pearson interval) are shown for each metric.

Figure 2. Long description
A multi-panel figure consisting of four dot plots labeled A, B, C, and D. All plots share a common Y-axis titled Metric Value ranging from 0.00 to 1.00 and a common X-axis listing 13 product categories including Arms, Ammunition, and Parts; Base Metals; Footwear; Hides and Skins; Machinery; Miscellaneous Manufactured Articles; Photographic Material; Plastics and Rubber; Products Of The Chemical Industries; Textiles; Transport; and Wood pulp.
Each data point includes a vertical error bar representing a 95 percent confidence interval. The legend at the bottom identifies three metrics: Accuracy (dark red dots), Precision (gold dots), and Sensitivity (light beige dots).
* Panel A: Shows models trained once with small datasets. Precision is consistently at 1.00 for almost all categories, while accuracy and sensitivity fluctuate between 0.50 and 0.85 with wide confidence intervals.
* Panel B: Shows models trained once with large datasets. Precision remains high at 1.00. Accuracy and sensitivity show tighter confidence intervals compared to Panel A, generally clustering between 0.65 and 0.90.
* Panel C: Shows models trained five times with small datasets. Accuracy and sensitivity values are similar to Panel A but show slightly more stability in specific categories like Textiles.
* Panel D: Shows models trained five times with large datasets. This panel displays the most consistent performance across categories, with accuracy and sensitivity values tightly grouped around 0.60 to 0.85 and the narrowest confidence intervals among all four panels.
In all panels, Precision (gold) frequently reaches the 1.00 ceiling, while Accuracy and Sensitivity often track closely together, particularly in the large dataset models (B and D).
Estimating volumes of polymers used in plastic packaging
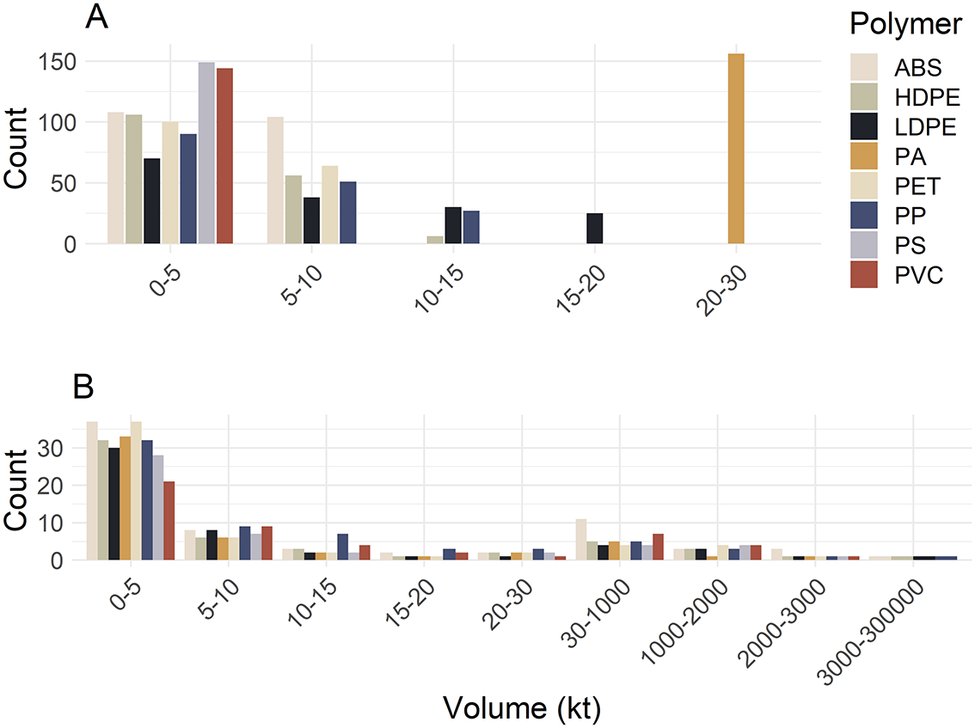
All four models produced numeric estimates (of polymers in packing in use in Norway in a given year) outside the prompted range of values, meaning models produced values outside the range prompted as acceptable, or between 0 and 30 kt (model 2.1 = 7.26%; models 2.2 = 13.46%; model 2.3 = 12.45%; model 2.4 = 11.05%). Furthermore, all four models produced very few numeric estimates (Figure 3B). Furthermore, the models provided non-numeric results, even when prompts were engineered for obtaining numeric results through both specifying outputs should be numeric and providing a range of acceptable values such as between 0 and 1, inclusive, or between 0 and 30, inclusive (see Supplementary Table S1 for prompts). Where GPT produced only text and not a numeric response, the estimate was set to ‘NA’. Numeric estimates outside the prompted range of 0–30 kt appeared to be dates (e.g. 1960) rather than estimated volumes of polymers in use, as the model was prompted to retrieve (Figure 3). Values outside of the prompted range (i.e. characters or numeric values outside the range of 0–30kt) were therefore not included further in analyses. The model that produced the highest percentage of estimates accepted within the prompted range was trained 5 times on the large dataset (model 2.4) with 55.88% of values falling in the range of 0 and 30 kt, (inclusive). The model that produced the lowest percentage of estimates (47.98%) was trained once on the large dataset (model 2.2).
Counts of annual estimates in specified ranges for polymers in packaging in use in Norway (in kt) from reference data (A) and from all models (B). Ranges of values are closed on the right (i.e. values that are larger than the max value in a bin are included in the next bin).

Figure 3. Long description
A two-panel grouped bar chart. A legend on the right identifies eight polymers: A B S, H D P E, L D P E, P A, P E T, P P, P S, and P V C.
Panel A, titled A, shows reference data. The Y-axis is Count from 0 to 150. The X-axis shows volume bins in k t: 0-5, 5-10, 10-15, 15-20, and 20-30. Most polymers are concentrated in the 0-5 bin with counts around 100 to 150. P S and P V C have the highest counts in this bin. The 5-10 bin shows lower counts for A B S, H D P E, L D P E, P E T, and P P. The 10-15 bin contains only H D P E, L D P E, and P P. The 15-20 bin contains only L D P E. The 20-30 bin contains only P A, which has a count over 150.
Panel B, titled B, shows model data. The Y-axis is Count from 0 to 30. The X-axis includes more bins: 0-5, 5-10, 10-15, 15-20, 20-30, 30-1000, 1000-2000, 2000-3000, and 3000-300000. In the 0-5 bin, all polymers have counts between 20 and 40. As volume increases, the counts for all polymers drop significantly. Small counts are distributed across all higher volume bins up to 300000 k t, indicating the models estimate much wider ranges of volume than the reference data.
Estimates from all four fine-tuned models trained on annual estimates of polymers in packaging in Norway did not match those from the reference dataset (Supplementary Figure S3, Figure 3). The polymer with the most similar model estimates compared to the reference data collected by experts was PVC, while the polymer type with the least similar model estimates was PA (Supplementary Figure S4 for residuals). The differences between model estimated and reference values of PA may be an artefact of their estimation using a linear regression to produce estimates for the time period where estimates were not available, as there was a low amount of available data. The relative closeness of model estimates to reference data on PVC may be due to the relative abundance of studies on PVC in the literature (e.g. Ciacci et al., Reference Ciacci, Passarini and Vassura2017), and therefore more data being available for the model to reference. Annual estimates from experts on PA volumes from packaging were higher (20–30 kt; see Figure 3A) compared to volumes for the other seven polymers. However, the maximum model estimates for PA volumes were far outside the prompted range of 0–30kt (see Supplementary Table S6) and rather in the range of 0 and1983 kt, inclusive.
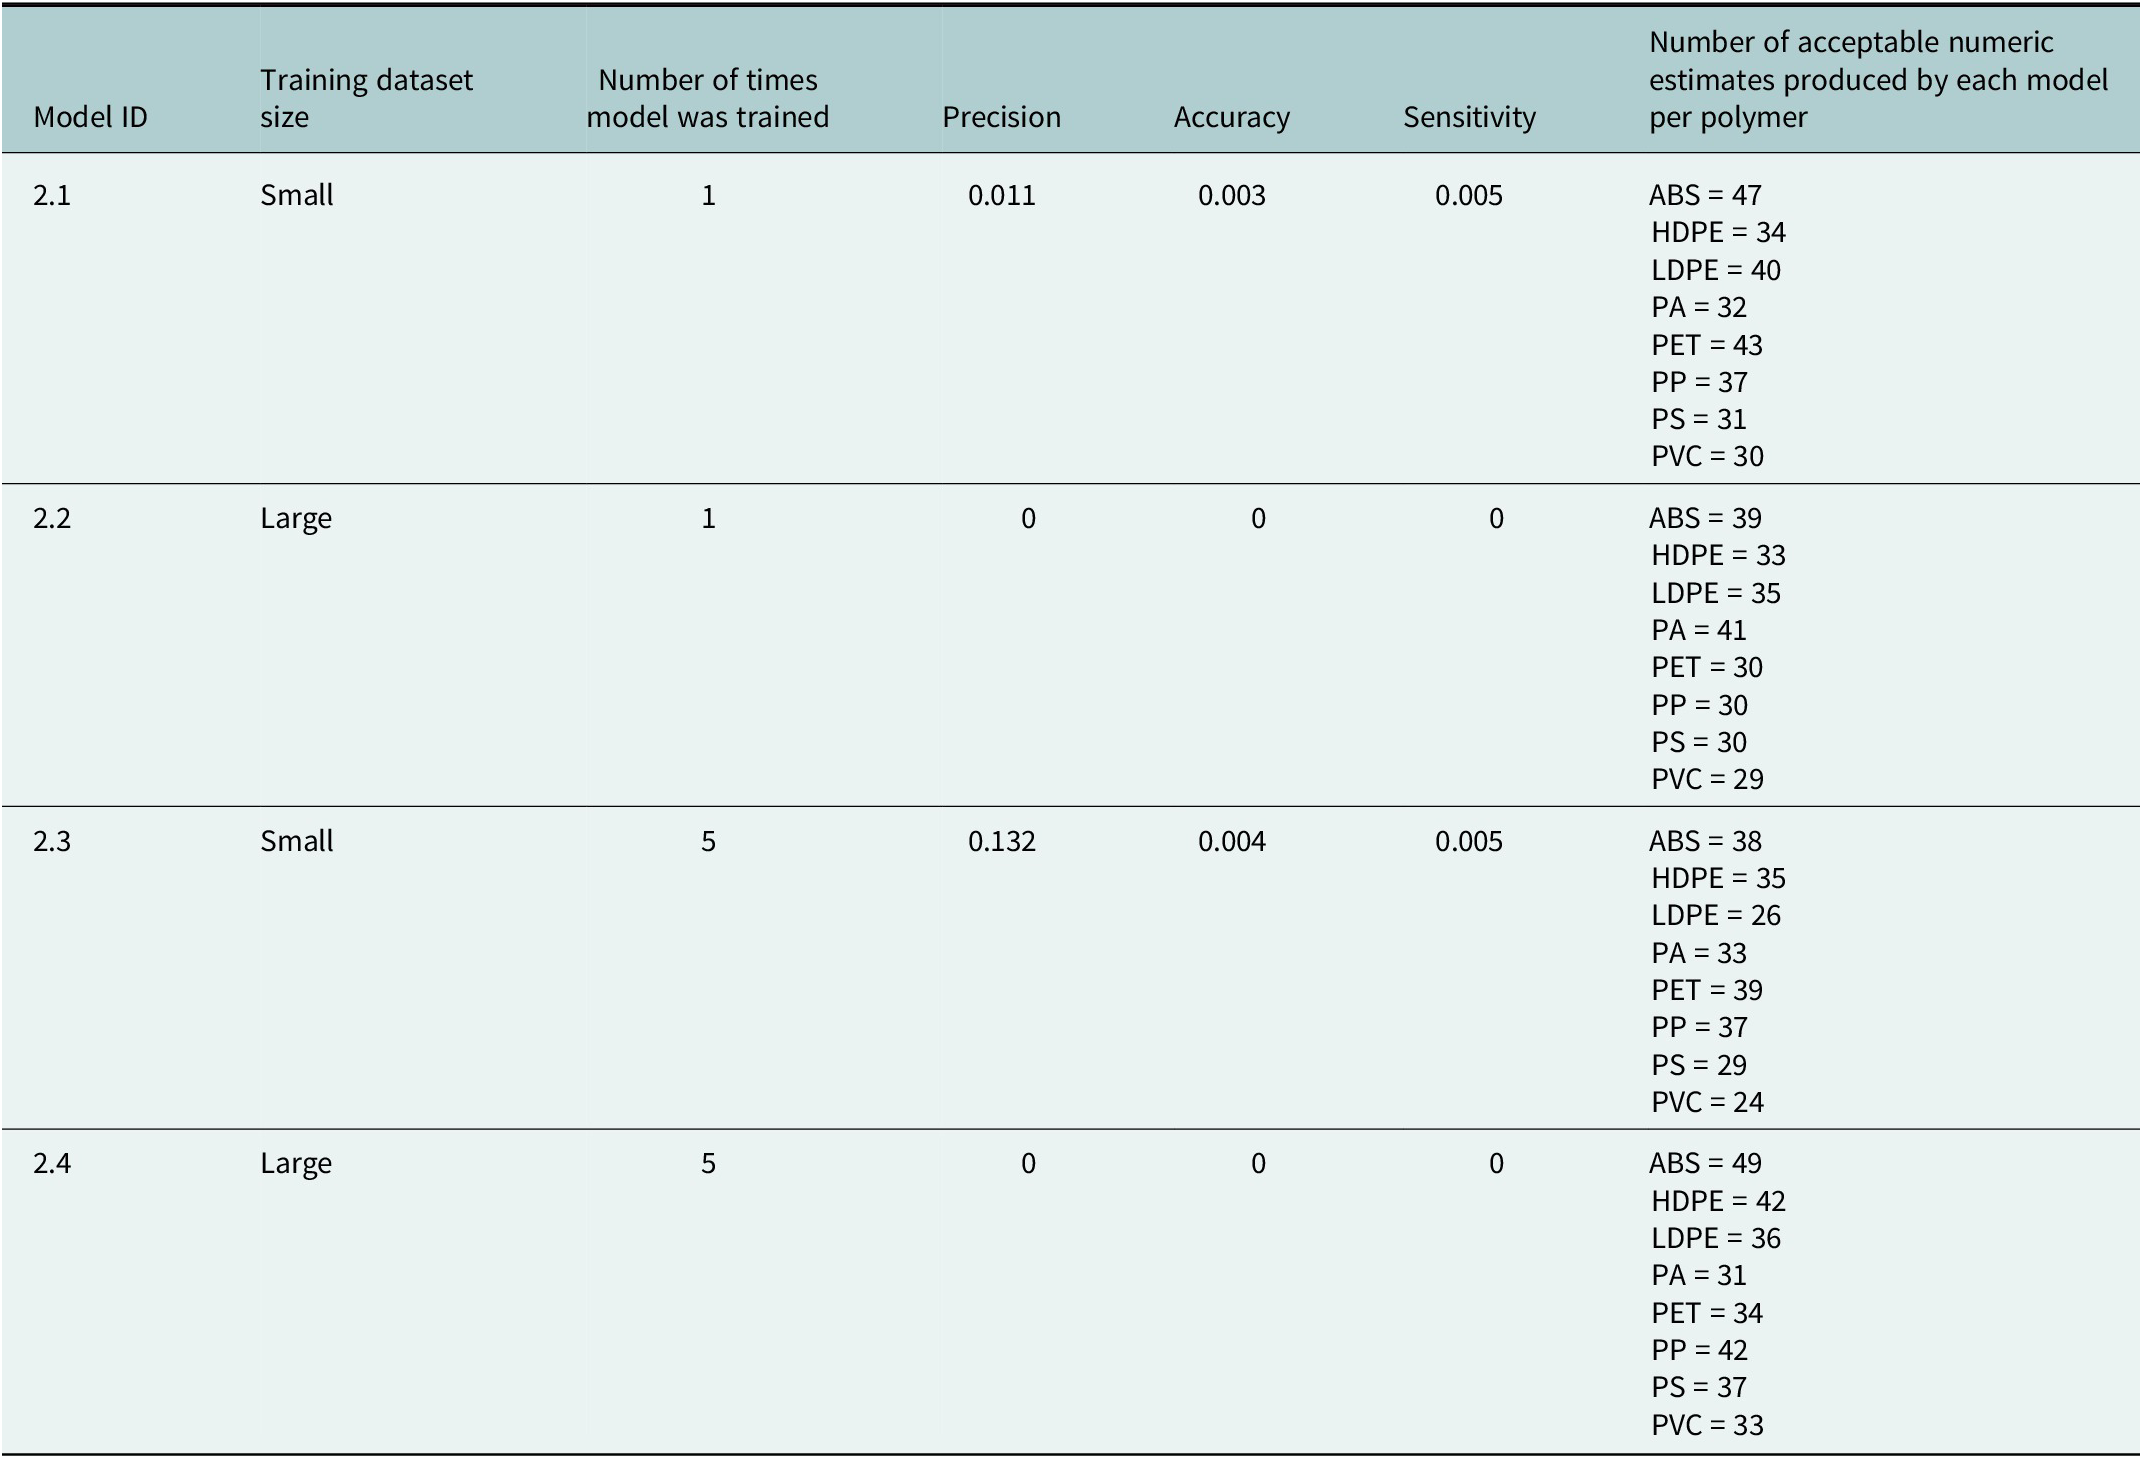
In calculating accuracy, precision and sensitivity metrics, positive values were estimates that were equal to reference values (i.e. provided by experts), as the aim of this task was to test whether GPT retrieved the same quantitative values as experts (from Norway or from similar contexts) or conducted the same basic analyses (i.e. linear regressions) to produce estimates. The model with the highest accuracy (model 2.3) was trained with the small training dataset five times (Table 2). Increasing the training dataset size for models trained once, and five times (models 2.2 and 2.4) decreased model precision, accuracy and sensitivity. Increasing the number of training rounds (models 2.1, 2.3) increased model precision (Δ0.12) and accuracy (Δ0.001) without changing model sensitivity.
Precision, accuracy and sensitivity values for each fine-tuned model used to produce annual estimates of the volume of polymers in packaging in Norway
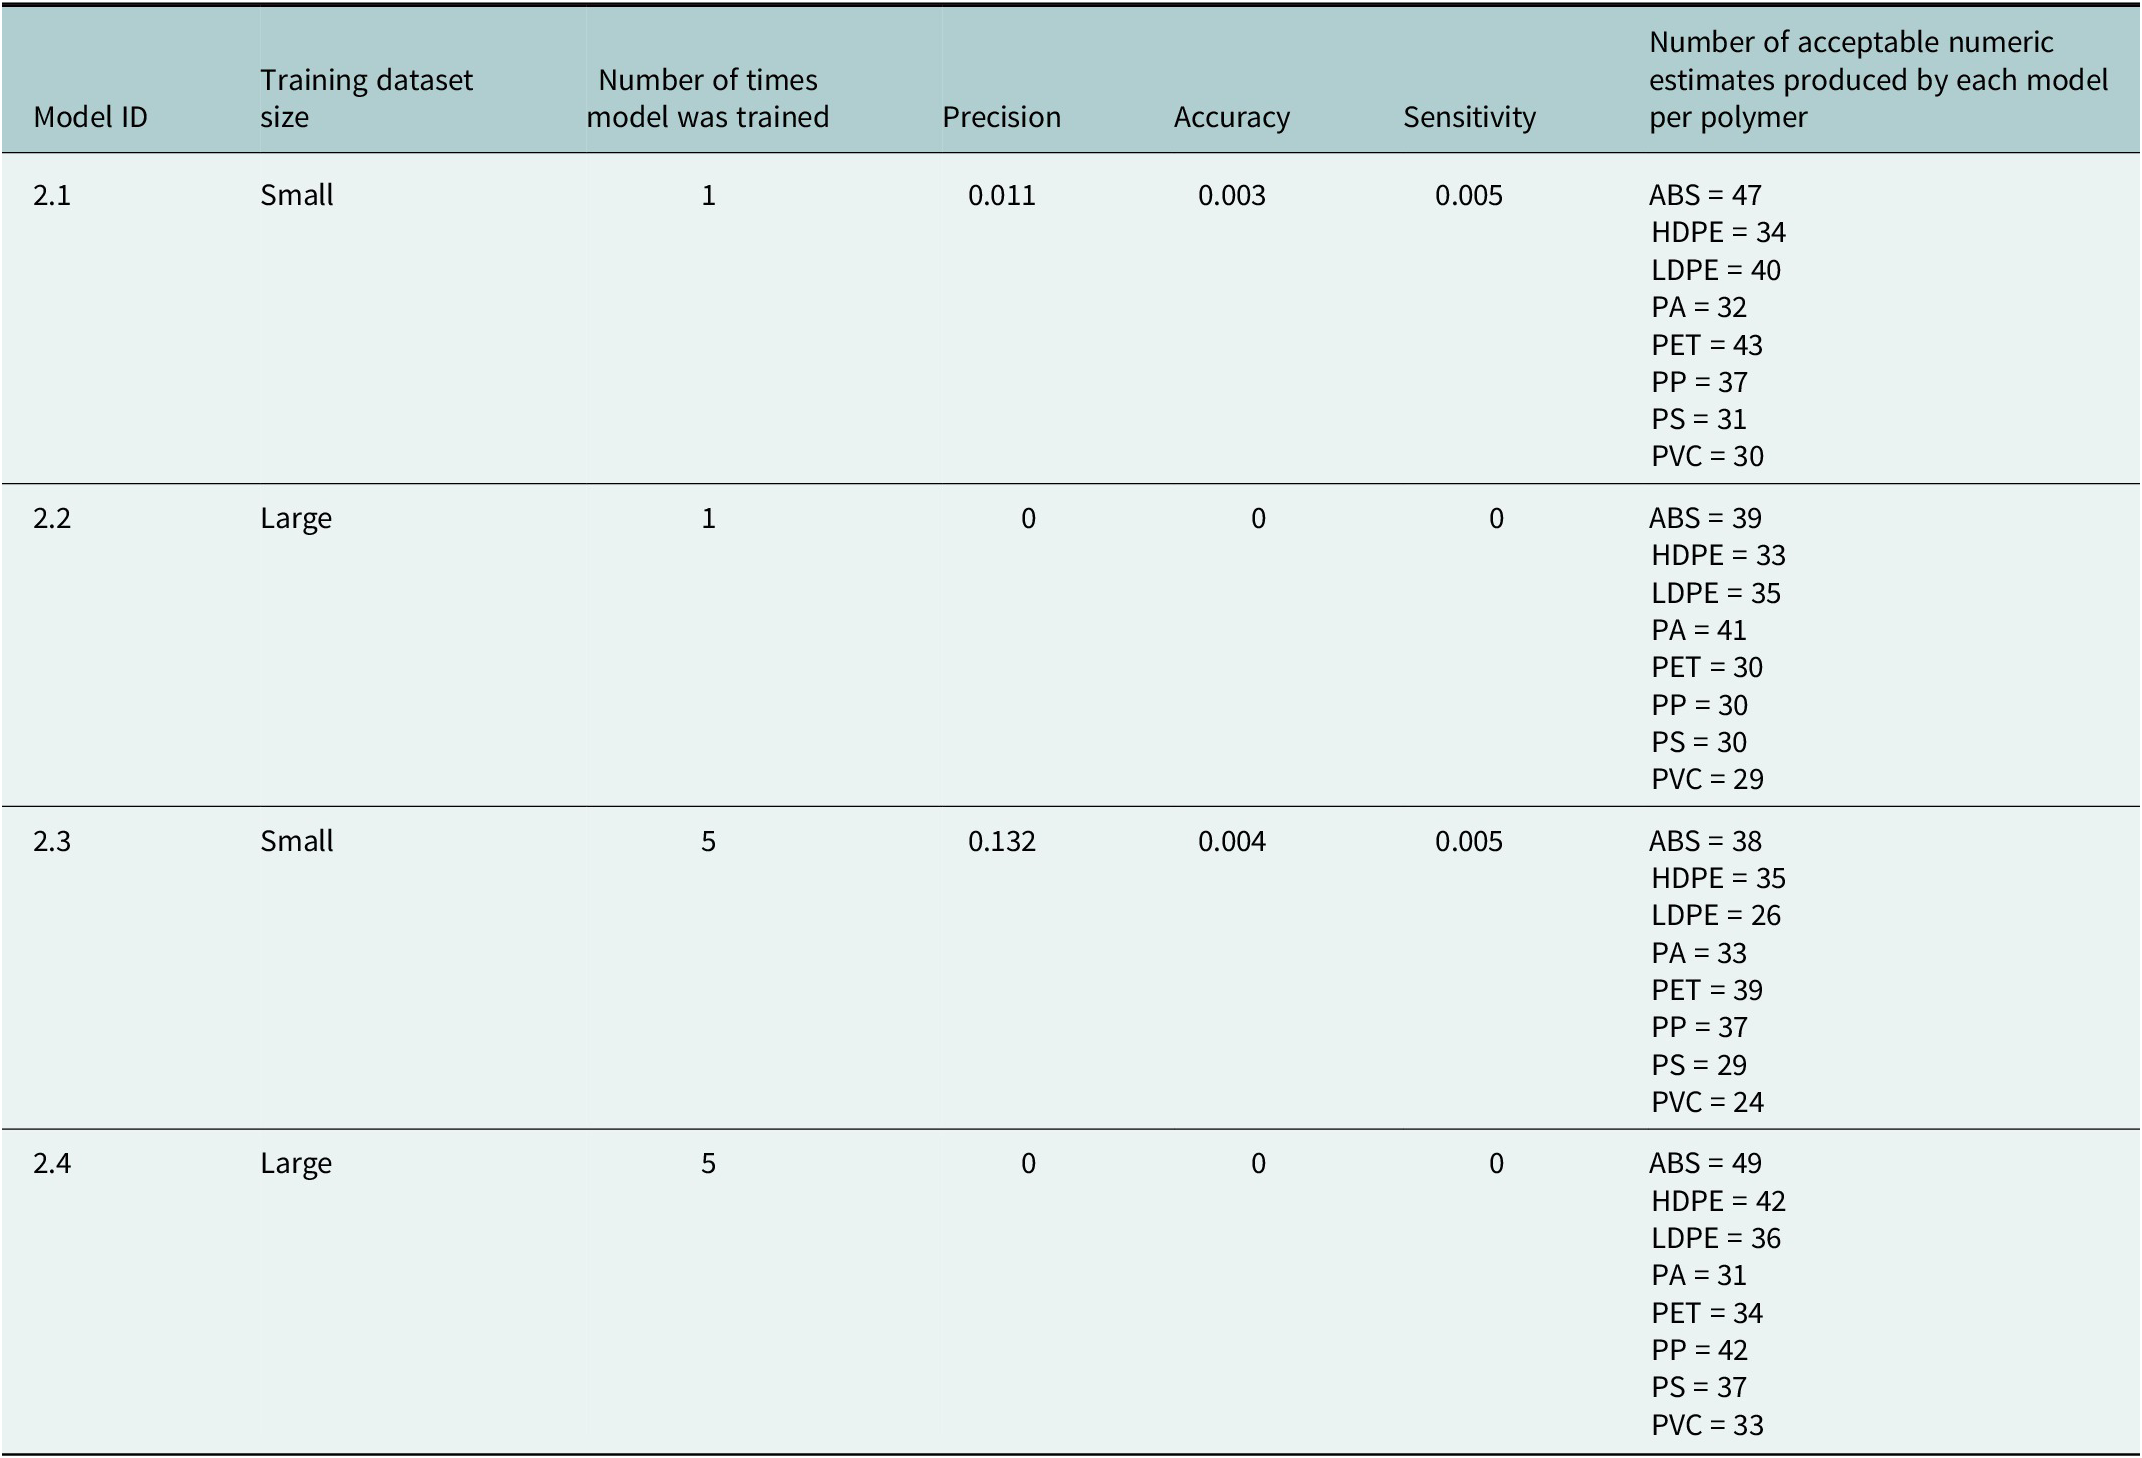
Table 2. Long description
The table consists of seven columns: Model I D, Training dataset size, Number of times model was trained, Precision, Accuracy, Sensitivity, and Number of acceptable numeric estimates produced by each model per polymer.
* Model 2.1: Small training size, trained 1 time. Precision 0.011, Accuracy 0.003, Sensitivity 0.005. Acceptable estimates: A B S = 47, H D P E = 34, L D P E = 40, P A = 32, P E T = 43, P P = 37, P S = 31, P V C = 30.
* Model 2.2: Large training size, trained 1 time. Precision 0, Accuracy 0, Sensitivity 0. Acceptable estimates: A B S = 39, H D P E = 33, L D P E = 35, P A = 41, P E T = 30, P P = 30, P S = 30, P V C = 29.
* Model 2.3: Small training size, trained 5 times. Precision 0.132, Accuracy 0.004, Sensitivity 0.005. Acceptable estimates: A B S = 38, H D P E = 35, L D P E = 26, P A = 33, P E T = 39, P P = 37, P S = 29, P V C = 24.
* Model 2.4: Large training size, trained 5 times. Precision 0, Accuracy 0, Sensitivity 0. Acceptable estimates: A B S = 49, H D P E = 42, L D P E = 36, P A = 31, P E T = 34, P P = 42, P S = 37, P V C = 33.
Note: The column ‘Number of acceptable numeric estimates produced by each model per polymer’ contains the count of numeric estimates each model produced within the specified range 0–30 kt for each polymer.
Discussion
This study represents the first formalized comparison of estimates produced by fine-tuned generative AI models to reference data collected by experts for tasks related to plastics accounting. We tested whether LLMs trained on a much larger dataset than experts could realistically review are able to retrieve reliable estimates from the available literature and, in the absence of existing fit-for-purpose values, provide estimates from similar regions/contexts. In these tests, we wanted to assess whether generative AI could trawl the vast amount of information used in its initial training to produce estimates similar to those of experts performing more targeted data collection. We also tested whether increasing the training dataset size and the number of training rounds improved model performance.
Overall, GPT performed poorly at producing numeric estimates that were comparable to those generated by experts. Although GPT has access to far more data than a human could realistically be expected to process, this approach is currently not proximate to a human surveying the literature and finding relevant data. Model estimates for the volumes of polymers used in plastic packaging indicated that GPT was not able to produce estimates from published studies, unable to obtain the same values as experts and could not conduct standard statistical modelling approaches applied to produce estimates. Instead, GPT appeared to hallucinate results (or provide outputs that were year values rather than estimates for a given year) or produce a text result, even when prompted to produce numeric estimates in a given range of values. This result may reflect a limitation inherent to using LLMs; specifically, models are sensitive to keyword choice during prompting. This sensitivity to keywords may lead to models not identifying key-value pairs correctly, as was the case of outputting year values rather than values between 0 and 30 kt in the second task.
Fine-tuning with high-quality, human-generated data is also essential when testing whether LLMs can be useful for tasks related to plastic accounting. In the task in which models estimated the material composition of products by plastic, GPT demonstrated a non-expert ability to identify certain categories as containing plastic products. However, in product categories where plastic is not typically present – such as ‘Works of Art and Antiques’ – determining its presence requires specialized knowledge. Due to the need for specialized knowledge, all models produced estimates with a high degree of uncertainty. Indeed, generative AI models trained for general intelligence rather than to address specific questions in one domain are unlikely to produce reasonable estimates for tasks that require domain-specific knowledge such as identifying non-intuitive cases where products contain plastics (e.g. ‘Works of Art and Antiques’). In contrast, generative AI models that are trained for specific rather than general intelligence (Emmert-Streib, Reference Emmert-Streib2024) are currently gaining traction as targeted training of models for specific fields have outperformed models trained on data from a wide spectrum of topics outside the domain of interest (Gu et al., Reference Gu, Tinn, Cheng, Lucas, Usuyama, Liu, Naumann, Gao and Poon2022). However, even models trained for specific intelligence cannot quality assure their own results to ensure the data they collect is indeed suitable, nor can they monitor whether estimates are reasonable in cases where literature estimates are not available. Plastic accounting tasks are particularly complex for AI models to tackle due to the ubiquity of plastic use in products that are not primarily made of plastic, such in sealants, paints, textiles and composites.
Plastics data gaps and data quality
The results from this study demonstrate that numerical estimates from recently available generative AI models are not yet of a sufficiently high quality to act as a substitute for data collected by experts with specialized knowledge about plastics. Fine-tuned generative AI models did not retrieve the same numeric estimates as those determined by experts, nor did they perform the same basic extrapolations (e.g. linear regressions) to produce estimates (Table 2, Figure 3). These results contrast with recent findings from building science (Rysanek et al., Reference Rysanek, Nagy, Miller and Dilsiz2023) and medical imaging (Rao et al., Reference Rao, Kim, Kamineni, Pang, Lie, Dreyer and Succi2023), where the model estimates were, in some cases, comparable to the values generated by experts. There are several potential reasons for why the models tested here performed poorly. Producing high-quality estimates from traditional modelling approaches (e.g. Material Flow Analysis) as well as newer approaches (e.g. use of generative AI) is critically dependent on the availability of high-quality input and source data. In the case of the tasks undertaken in this study, the quality of data used in the initial training of GPT appears to be too sparse and/or of too low quality for existing AI tools to produce approximations from its large training dataset (particularly in cases such as PA where linear regressions were used for reference data due to the sparseness of available data). As such, it could not provide estimates from studies conducted in countries that are economically similar. Indeed, other efforts to perform plastic accounting in Norway have been more limited in scope, for example, focusing only on single product type, such as estimating plastic bag consumption (Mepex, 2022), or on the recycling rates of plastic packaging (Deloitte, 2019).
In addition to government organizations such as SSB (the experts that produced the training datasets used in this study), Norwegian environmental groups such as Grønt Punkt (Green Point) and Handelens Miljøfond (the Retailers Environment Fund) collect statistics on plastic waste generation in Norway that could be useful for plastics accounting. However, data collected by these groups is not open and is typically only available as high-level aggregates to conceal proprietary data. Furthermore, data on the material composition of products is typically not openly declared by producers. Citizen scientists (i.e. non-experts) could contribute data on plastics for training generative AI models; however, citizen scientists would have to be assigned tasks that are simple to train for a high accuracy without requiring the use of expensive sensors, equipment or access to the scientific body of literature (due to the number of journals that require paid subscriptions). In general, data therefore can be collected (i.e. from the scientific literature), processed and interpreted more readily by experts than by generative AI or non-experts such as citizen scientists. Importantly, generative AI is not currently able to undertake any form of quality assurance of the data it collects, unlike human experts. While generative AI can search and collect data from a much larger body of literature than is feasibly possible by human experts, it will remain somewhat limited until such time as it is also able to perform an acceptable level of quality assurance. As generative AI models are complex ‘black-box models’, it is not possible to assess the quality of the source data used by models to produce estimates. In contrast, it is possible to assess the quality of data collected by experts and determine whether it comes from a reliable source and is sufficiently robust in nature. The inability to quality assure the data used by GPT to generate estimates may mean the modelled estimates produced are either hallucinations or not fit for purpose. Importantly, there is no way of determining this at present. Concerted efforts to collect high-quality, homogeneous statistics at the local level by both public and private groups in Norway could improve quantitative estimates from generative AI (and other models such as MFAs) on the consumption and use of plastics at the national level. These data would provide more reliable basis for generative AI models producing or extrapolating estimates. Although detailed information on product composition is often not transparent due to a competitive market, future policies must address how this can be made available without compromising the position of value chain actors. In addition, currently closed data may become more widely available following the passage of national and/or international regulations such as the global plastics treaty, which could require making data on product composition and plastic consumption more transparent for accurate reporting. These data would be needed to assess whether countries are meeting reduction targets and to quantify hazardous effects of plastics (Filella and Turner, Reference Filella and Turner2023; Syberg et al., Reference Syberg, Almroth, Fernandez, Baztan, Bergmann, Thompson, Gündoğdu, Knoblauch, Gomiero, Monclús, Muncke, Boucher, Gomez and Farrelly2024). Importantly, generative AI models will also need to incorporate some form of data quality assurance going forward so that users can be confident that the resulting estimates are derived from reliable and robust empirical data for reporting to regulators.
The limits and potential of generative AI for plastics accounting
Generative AI is currently creating a large amount of interest within the wider scientific research community as a tool for (i) more rapidly addressing research knowledge gaps and (ii) facilitating and increasing the efficiency of research tasks. As an LLM, GPT performs poorly when provided advanced mathematical tasks (Collins et al., Reference Collins, Jiang, Frieder, Wong, Zilka, Bhatt, Lukasiewicz, Wu, Tenenbaum, Hart, Gowers, Li, Weller and Jamnik2024). However, GPT has been demonstrated to be successful as a knowledge base interface for quantitative tasks, such as conducting systematic reviews (see Khraisha et al., Reference Khraisha, Put, Kappenberg, Warraitch and Hadfield2024), indicating there is strong potential for its application in multiple areas. The two tasks to which generative AI was applied in the current study required such a knowledge base interface, as manually searching the literature for relevant data is too resource and time-consuming. The fine-tuned models tested here to estimate the composition of products by plastics did not exhibit a high level of accuracy when prompted to produce numeric estimates (i.e. > 0.50, see Table 1). Similarly, the fine-tuned models used to produce annual estimates of the volumes of different plastic polymers in use did not retrieve quantitative values accurately (Table 2), instead producing text or values that were not within the prompted numeric range of values (Figure 3). Increasing the number of epochs for the larger training dataset (i.e. 75% of the training data) when fine-tuning the model did not improve the model performance (see Table 2), possibly due to memory saturation (Gogineni et al., Reference Gogineni, Suvizi and Venkataramani2025). The high number of non-numeric results returned by GPT demonstrate its current limitations as a model for retrieving numeric values from its knowledge base.
Despite these clear limitations, this study does demonstrate that GPT was successful at a binary classification task, which may decrease the amount of manual work required for plastics accounting by allowing researchers to accurately filter out products that do not contain plastic from their analyses. The fine-tuned GPT-3.5 models used in this study to estimate the proportion of plastic in products were found already to be generally accurate and precise (in some product categories; Figure 2) when numeric estimates were binned into binary categories (i.e. containing plastic or not). These results are consistent with other studies that found GPT performed well at binary classification tasks, even with a small number of sample observations (Babaei and Giudici, Reference Babaei and Giudici2024). Thus, GPT may be a useful tool in cases where tasks require binary classification and where the large knowledge base of GPT can be leveraged.
Rapid advancements are currently being made within the field that may render the results of this study obsolete, as the performance of newer generation models at specialized tasks improves. For example, GPT-4o, a subsequent version of GPT that was not available for fine-tuning at the time this study was conducted, was found to outperform both GPT-3.5 and humans at passing medical examinations (Taloni et al., Reference Taloni, Borselli, Scarsi, Rossi, Coco, Scorcia and Giannaccare2023) and outperformed GPT-3.5 as remote teaching tool (Tülübaş et al., Reference Tülübaş, Demirkol, Ozdemir, Polat, Karakose and Yirci2023). Advancements to the methods currently used for fine-tuning generative AI for specific complex tasks are also promising. Retrieval-augmented generation (Lewis et al., Reference Lewis, Perez, Piktus, Petroni, Karpukhin, Goyal, Küttler, Lewis, Yih, Rocktäschel, Riedel and Kielan.d.), for example, is one such method that has been demonstrated to produce models that outperform those that use specialized pre-training. Furthermore, the generation of data in machine-readable formats (e.g. JSON) could improve the quality of estimates provided by generative AI models by explicitly providing models input and output pairs. Providing models such ‘AI-positive’ training data could decrease the number of hallucinations/unsuitable estimates produced by models such as those GPT produced when estimating volumes of polymers used in plastic packaging. Future studies that use retrieval-augmented generation models may be more successful at providing comparable estimates for both of the plastics accounting tasks investigated in this study, given more high-quality background data (e.g. polymer composition, sector-specific waste statistics) on plastics becomes available (in machine-readable formats) and that a suitable level of quality assurance can be achieved.
Conclusions
Following the popular axiom ‘garbage in, garbage out’ from the computer and information science fields, ever more advanced generative AI models will not replace the need for high-quality baseline data. As the current landscape of Norwegian macro-level plastics data is scarce and of poor quality, estimates from any modelling approach, not matter how advanced, will likely by highly erroneous. The collection of high-quality statistics on household plastics waste by authorities is particularly important for Norway to meet its ambitious plastic waste reduction goals, where the amount of per-person municipal waste generated by Norwegians was the third highest in Europe in 2020 (Eurostat, 2023). Furthermore, there is a significant need for industry to make closed data on product and polymer composition openly available. More high-quality, human-generated, open data on plastics for model training are, however, necessary if generative AI is to be used for plastics accounting related tasks. The biggest challenge for using generative AI, however, remains; specifically that models are not a substitute for expert opinion and judgement. Thus, if generative AI models are going to be used to reach new policy objectives, rigorous data quality assurance will be needed to ensure estimates are reliable.
Open peer review
To view the open peer review materials for this article, please visit http://doi.org/10.1017/plc.2026.10055.
Supplementary material
The supplementary material for this article can be found at http://doi.org/10.1017/plc.2026.10055.
Data availability statement
All code and data for reproducing analyses are available under a CC BY-NC-SA 4.0 license (see Lara Veylit/Plasticine database GitLab: https://gitlab.sintef.no/Lara.Veylit/plasticine-database).
Acknowledgements
The presented work is part of the Plasticene project, funded by the Norwegian Research Council (grant agreement 318730). The authors are grateful to those from the Plasticene project partners Deloitte and the World Wildlife Fund who provided input regarding plastic data gaps and to Andreas Steinvik as well as two anonymous reviewers for their useful comments.
Author contribution
L.V. led writing, conceptualized study and performed analyses; A.M.B. provided support drafting and revising content; P.S. provided support for analysis and conceptualization of work; C.K. provided support drafting and revising content; S.M. contributed to the conception and design of the work and provided support in drafts of the study.
Funding statement
The presented work is part of the Plasticene project, funded by the Norwegian Research Council (grant agreement 318730).
Competing interests
The authors declare no competing financial interest.
AI statement
This study relied on the use of GPT, the base model of ChatGPT, for the creation of fine-tuned models compared in the study. By using GPT, we tested whether the model was able to retrieve data similar to those retrieved by experts. ChatGPT was not used for the generation of text in the article text or for image generation.


 Open access


Comments
To the Editorial Office of Cambridge Prisms: Plastics
Dear Editor,
Please find our manuscript “GPT is not currently a substitute for expert knowledge on plastics accounting: Exploring the limitations of generative AI tools” by L. Veylit, A.M. Booth, P. Stránský, C. Karl, S. Mehta attached which we would like to submit for publication at Cambridge Prisms: Plastics as an original research paper. We confirm that this manuscript is not being considered for publication elsewhere. All authors have approved the manuscript for submission to Cambridge Prisms: Plastics.
Policy makers require a high-level overview of the amount of plastic in products and packaging in use to inform decision making. Plastic accounting and modelling methods (e.g., material flow analysis) which provides such an overview requires significant manual work to retrieve data and produce estimates using basic statistical methods where none are readily available. Currently, generative AI tools such as Open AI’s GPT are showing promise as a quick method for retrieving data from its vast pretraining knowledge base. In this study, we tested whether fine-tuned GPT models could provide estimates comparable to those from experts on the material composition of imported products (i.e., by plastic) and on annual estimates of volumes of plastic polymers in use in plastics packaging in Norway. We found that generally numeric estimates from GPT did not match those provided by experts. However, results on classification of products were promising as GPT precisely and accurately determined which products contained plastic. These results indicate that although current models provide reliable estimates, future models and methods may allow for more automated filtering of products for data collection.
These findings are particularly relevant as they demonstrate the potential as well as the limitations of generative AI tools for retrieving data and providing estimates for plastic accounting, which we believe will be of general interest to the readership of Cambridge Prisms: Plastics.
On behalf of the authors,
Dr. Lara Veylit
Researcher, Climate and Sustainability
SINTEF Ocean